developing tier 1 environmental flow targets using a ... · developing tier 1 environmental flow...
TRANSCRIPT
Developing Tier 1 Environmental Flow Targets Using a Functional Flows Approach
SARAH YARNELL, Sam Sandoval, Belize Lane, Eric Stein, Julie Zimmerman, Ted Grantham, Larry Brown, Rob
Lusardi, Jeanette Howard, Jay Lund
Tier 1 Environmental Flow Targets
• Single method statewide based on functional flows approach
• Science-based analysis focusing on: – Stream classification
– Dimensionless Reference Hydrographs
– Functional flow metrics and ecological endpoints
• Resulting e-flow targets: rapid, coarse, comprehensive across state
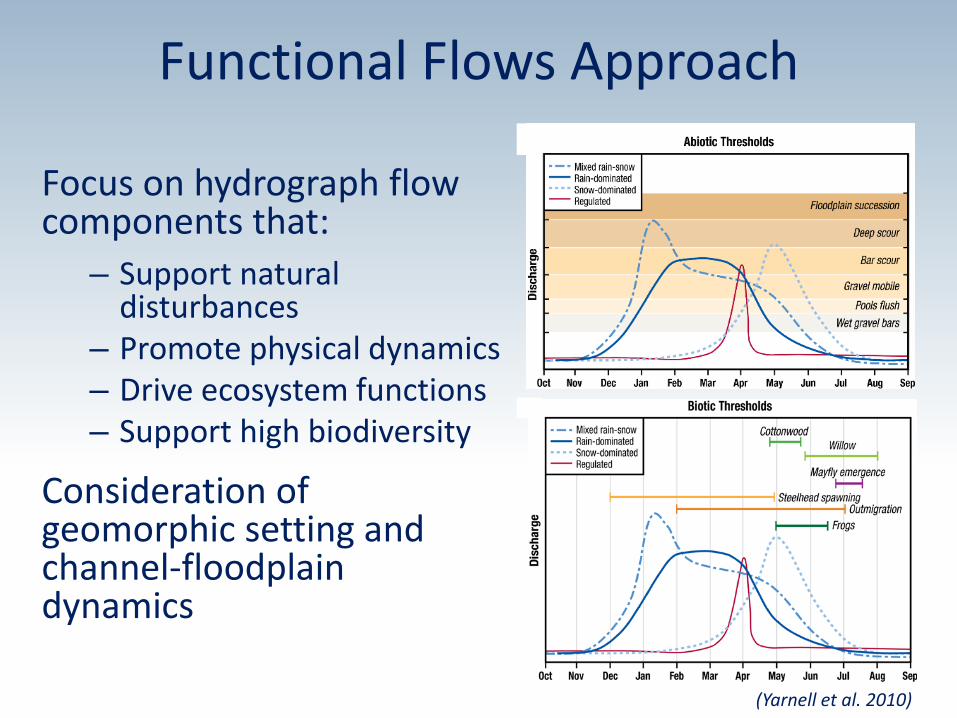
Functional Flows Approach
Focus on hydrograph flow components that:
– Support natural disturbances
– Promote physical dynamics – Drive ecosystem functions – Support high biodiversity
Consideration of geomorphic setting and channel-floodplain dynamics
(Yarnell et al. 2010)
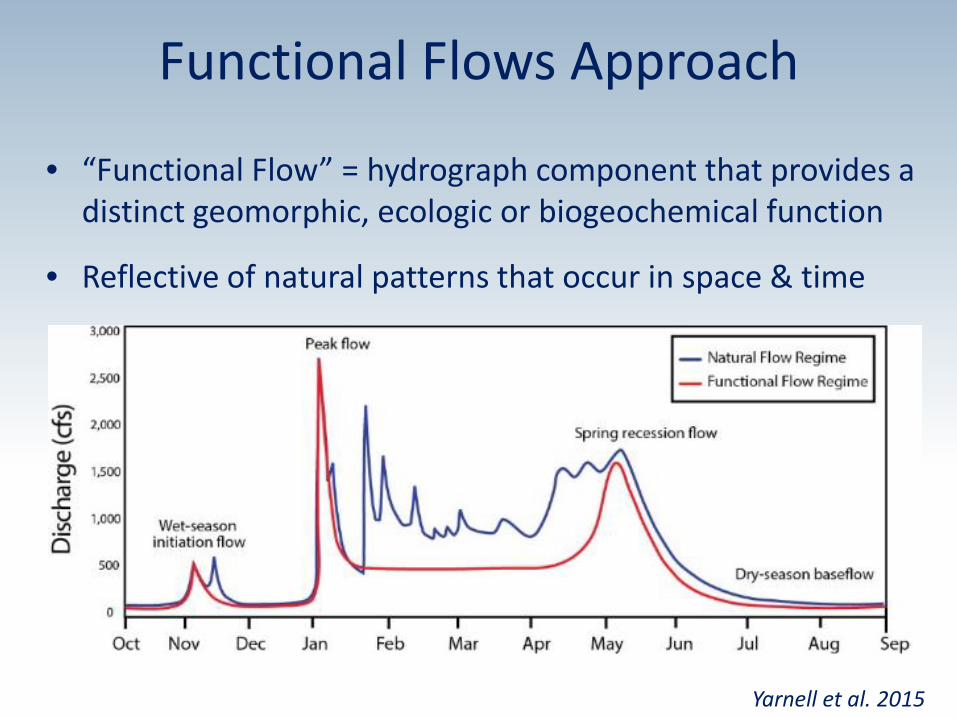
Functional Flows Approach
• “Functional Flow” = hydrograph component that provides a distinct geomorphic, ecologic or biogeochemical function
• Reflective of natural patterns that occur in space & time
Yarnell et al. 2015
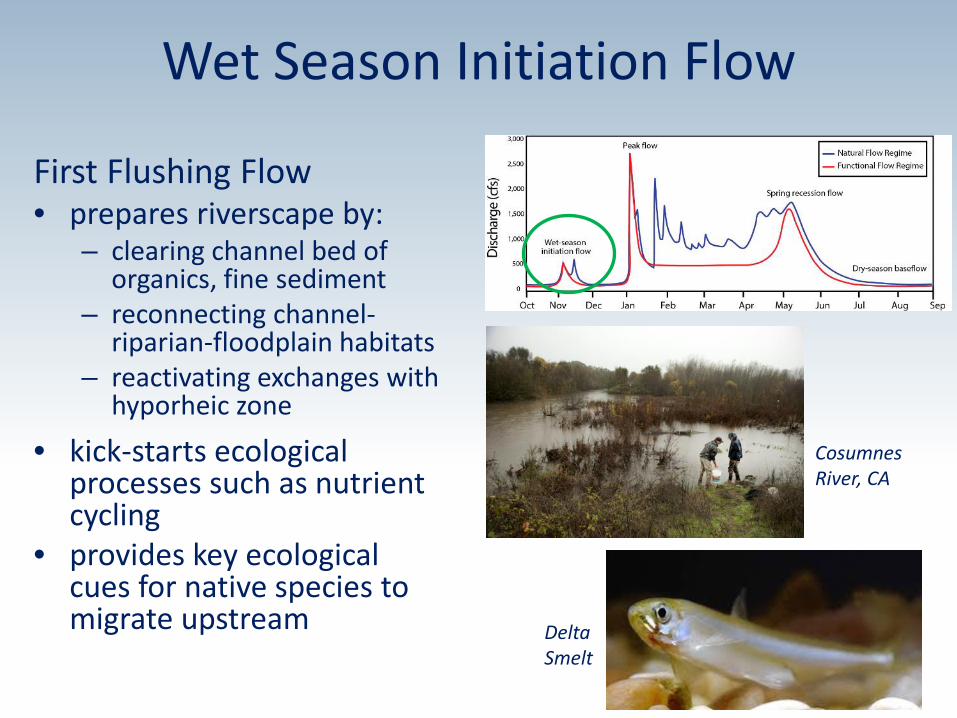
Wet Season Initiation Flow
First Flushing Flow • prepares riverscape by:
– clearing channel bed of organics, fine sediment
– reconnecting channel-riparian-floodplain habitats
– reactivating exchanges with hyporheic zone
• kick-starts ecological processes such as nutrient cycling
• provides key ecological cues for native species to migrate upstream
Cosumnes River, CA
Delta Smelt

Peak Magnitude Flow
• Primary geomorphic disturbance
• Resets natural processes such as succession
• Redistributes large volumes of sediment
• Prevents vegetation encroachment
• Reduces extent of exotic species not adapted to disturbance regime
• Most effective when given SPACE – levee setbacks, levee breaches to floodplain, tributary junctions
Cosumnes River, CA levee breaches
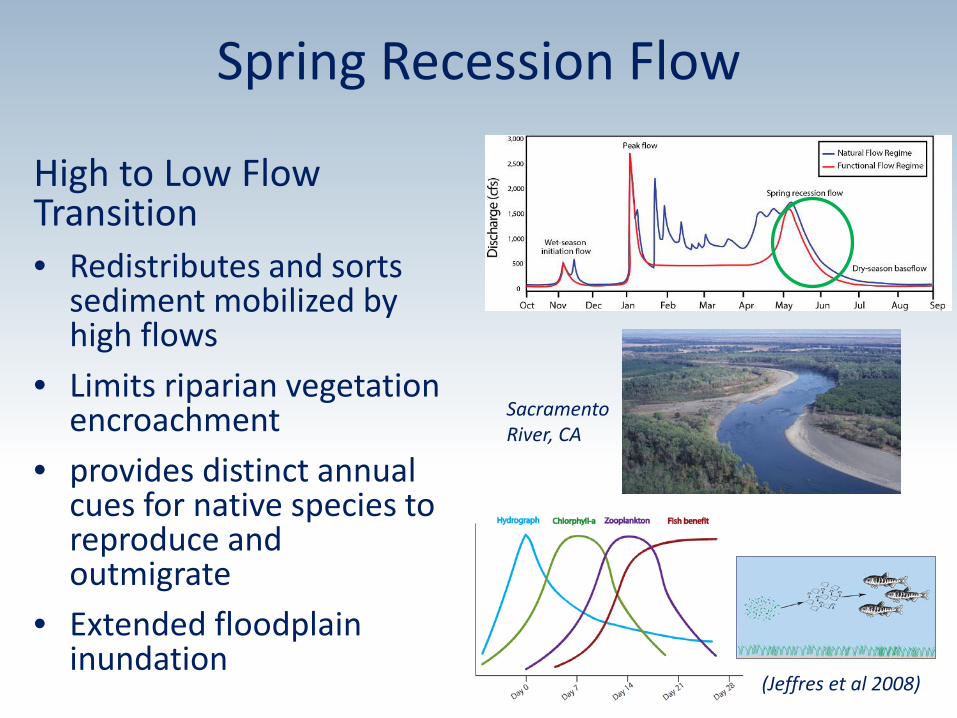
Spring Recession Flow
(Jeffres et al 2008)
High to Low Flow Transition • Redistributes and sorts
sediment mobilized by high flows
• Limits riparian vegetation encroachment
• provides distinct annual cues for native species to reproduce and outmigrate
• Extended floodplain inundation
Sacramento River, CA

Dry Season Low Flow
• Driver of seasonal river ecosystems
• Dictates extent and quality of physical instream habitat
• Creates ecological niche partitioning with native species utilizing refugia
• More effective when geormorphic diversity provides varied refugia
• Reduces extent of exotic species not adapted to limiting conditions
Santa Clara River, CA
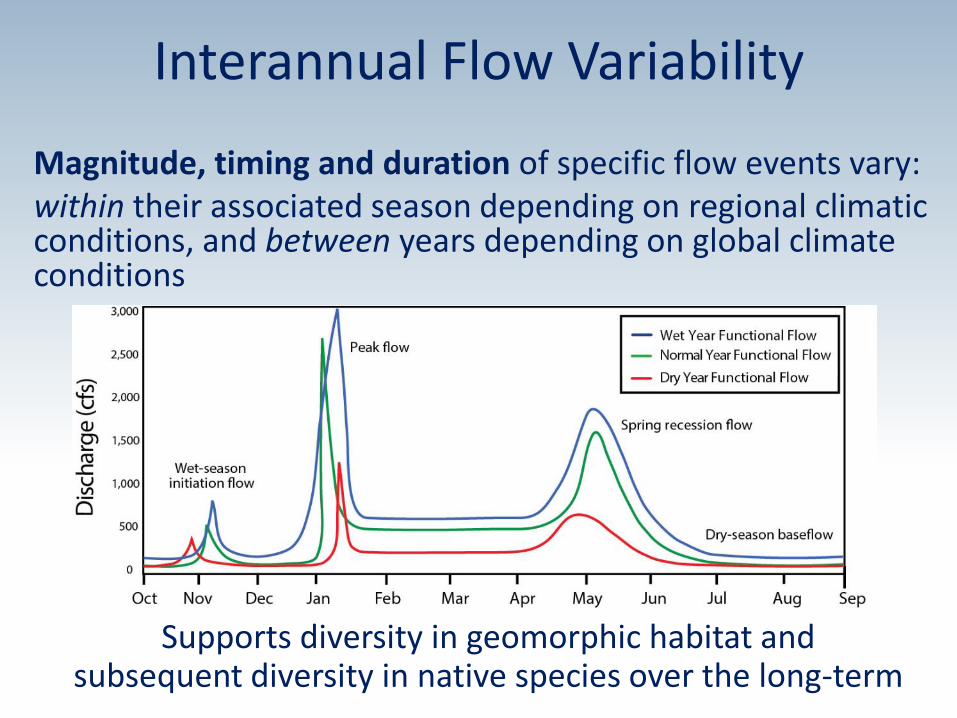
Interannual Flow Variability
Magnitude, timing and duration of specific flow events vary: within their associated season depending on regional climatic conditions, and between years depending on global climate conditions
Supports diversity in geomorphic habitat and subsequent diversity in native species over the long-term
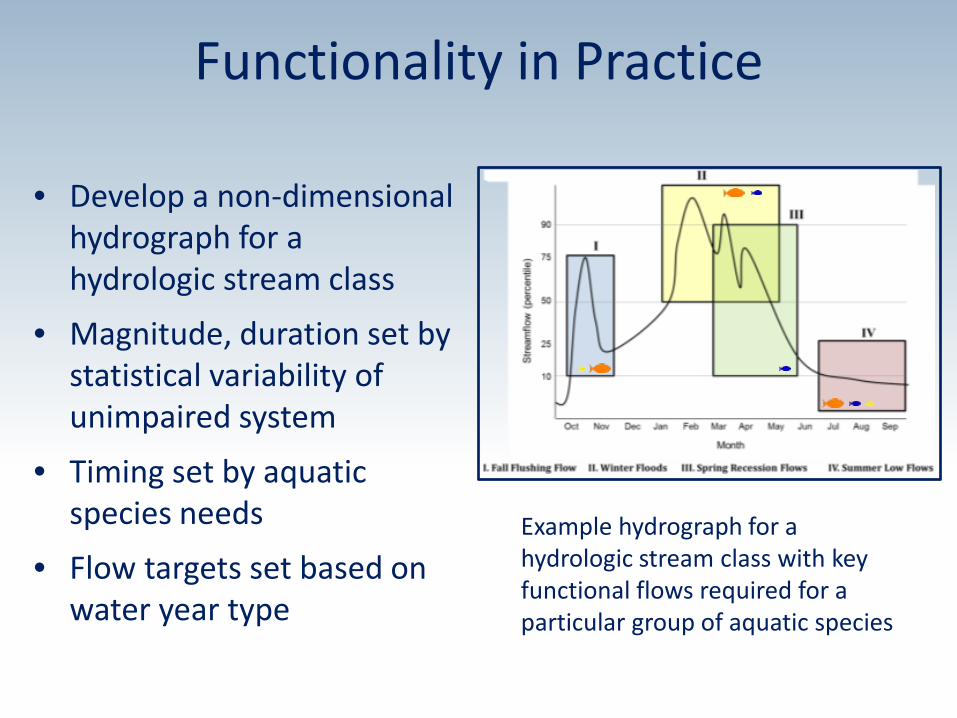
Functionality in Practice
• Develop a non-dimensional hydrograph for a hydrologic stream class
• Magnitude, duration set by statistical variability of unimpaired system
• Timing set by aquatic species needs
• Flow targets set based on water year type
Example hydrograph for a hydrologic stream class with key functional flows required for a particular group of aquatic species
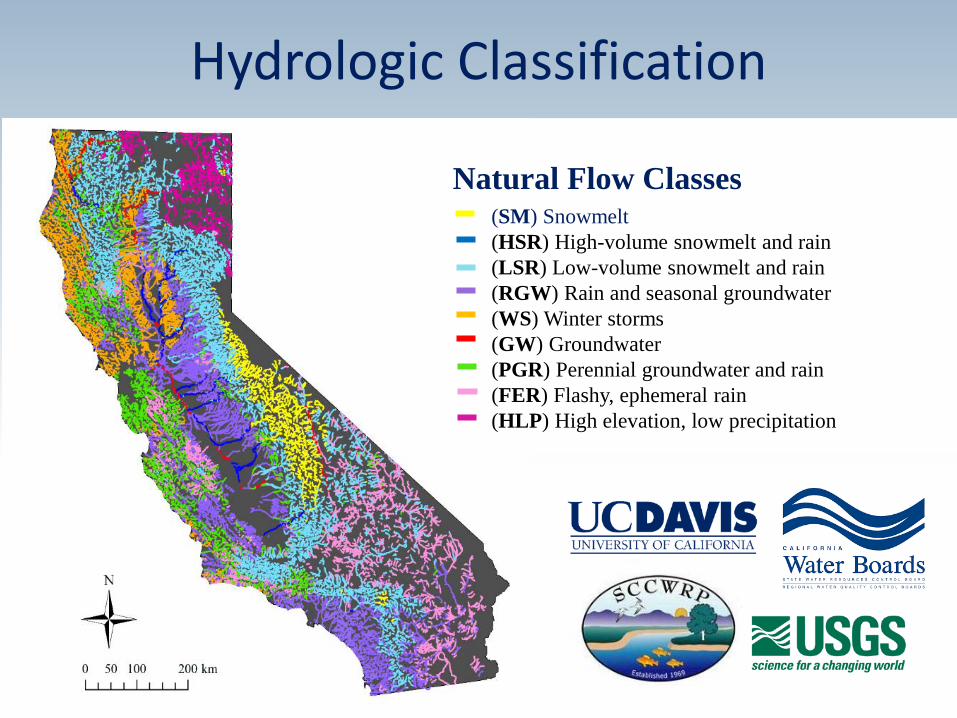
(SM) Snowmelt (HSR) High-volume snowmelt and rain (LSR) Low-volume snowmelt and rain (RGW) Rain and seasonal groundwater (WS) Winter storms (GW) Groundwater (PGR) Perennial groundwater and rain (FER) Flashy, ephemeral rain (HLP) High elevation, low precipitation
Natural Flow Classes
Hydrologic Classification
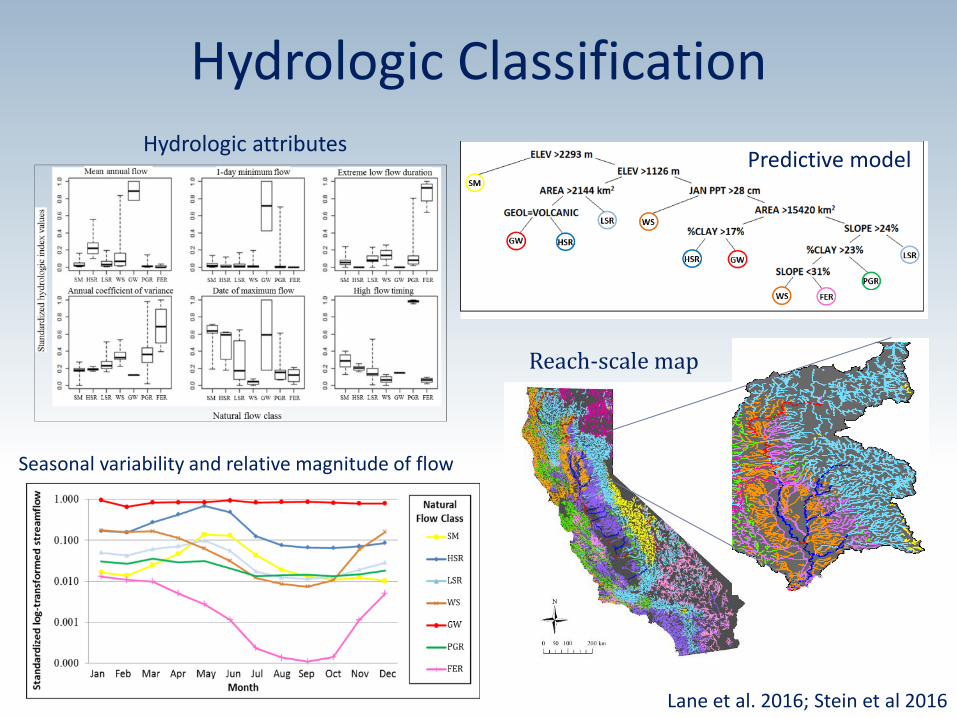
Seasonal variability and relative magnitude of flow
Hydrologic attributes
Reach-scale map
Lane et al. 2016; Stein et al 2016
Hydrologic Classification Predictive model
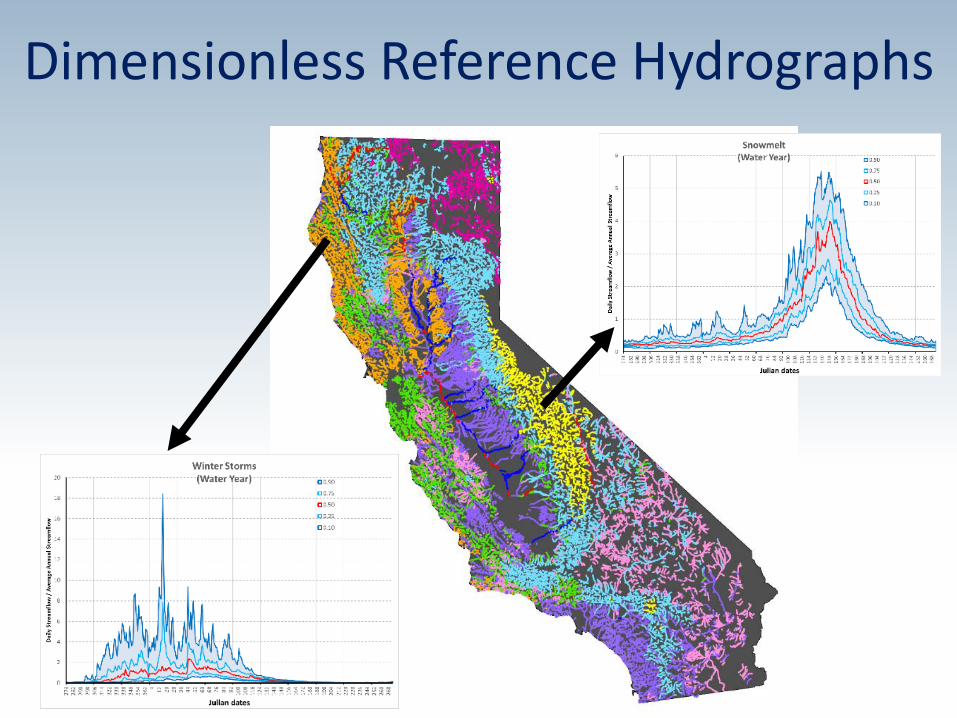
Dimensionless Reference Hydrographs


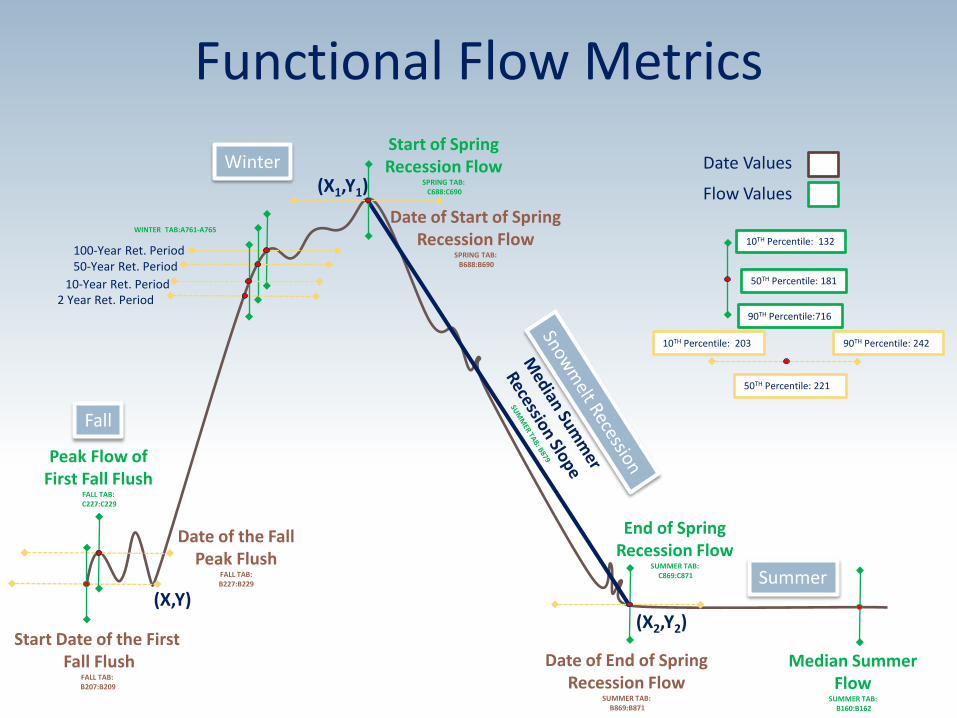
Functional Flow Metrics
15
Season Function Timing Flow Metrics Frequency (duration)
Fall Cue fish migration Sept 1 - Nov 30 peak magnitude, percent over baseflow
Annually (2 weeks)
Winter Clean spawning gravels
Dec 1 – Apr 1 Peak magnitude, recurrence interval
Once every 5 years (2-4 weeks)
Spring Cue and support spawning
March 1 – May 30
Recession rate, duration
Annually (6-8 weeks)
Summer Oversummering habitat
Apr 1-Sept 30 Magnitude, recurrence interval
Annually
Focus on quantitative metrics related to an ecological function
Fall
Winter
Summer
(X2,Y2)
Median Summer Flow
SUMMER TAB: B160:B162
Date Values
Flow Values
(X,Y)
Date of End of Spring Recession Flow
SUMMER TAB: B869:B871
50TH Percentile: 181
10TH Percentile: 132
90TH Percentile:716
90TH Percentile: 242
50TH Percentile: 221
10TH Percentile: 203
End of Spring Recession Flow
SUMMER TAB: C869:C871
Start of Spring Recession Flow
SPRING TAB: C688:C690
Date of Start of Spring Recession Flow
SPRING TAB: B688:B690
Start Date of the First Fall Flush
FALL TAB: B207:B209
Peak Flow of First Fall Flush
FALL TAB: C227:C229
Date of the Fall Peak Flush
FALL TAB: B227:B229
(X1,Y1)
WINTER TAB:A761-A765
2 Year Ret. Period 10-Year Ret. Period
100-Year Ret. Period 50-Year Ret. Period
Functional Flow Metrics

Functional Flow Calculator

Functional Flow Calculator
Season Function Timing Flow Metrics Frequency (duration)
Winter Clean spawning gravels; clear riparian
Nov 1 – Apr 24 Peak magnitude (720-2785 cfs)
Once every 5-8 years (10-29 days)
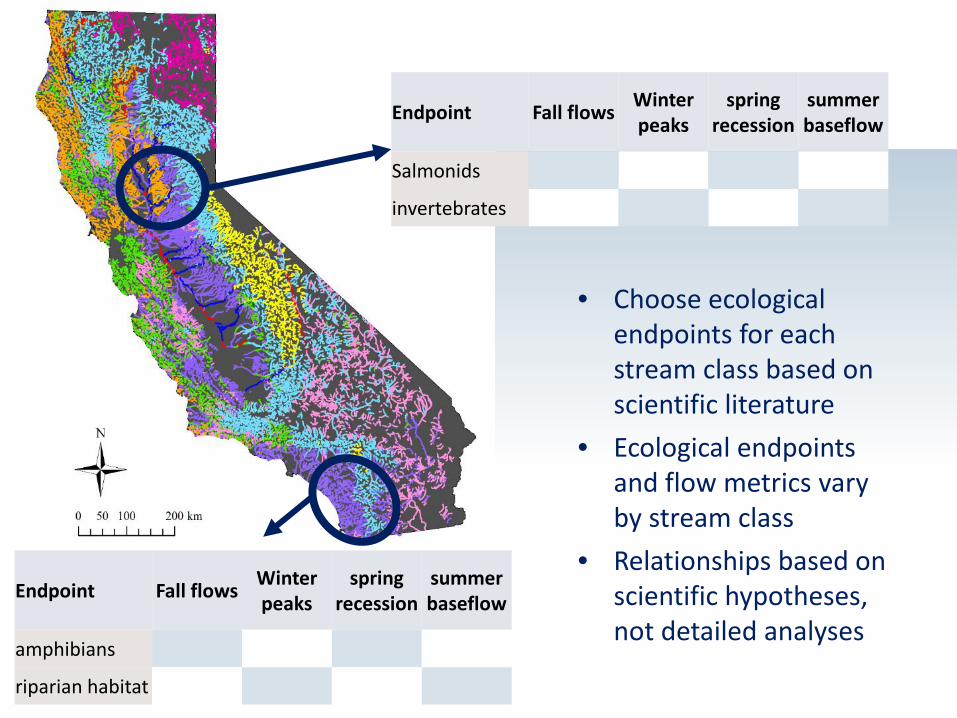
Endpoint Fall flows Winter peaks
spring recession
summer baseflow
amphibians
riparian habitat
Endpoint Fall flows Winter peaks
spring recession
summer baseflow
Salmonids
invertebrates
• Choose ecological endpoints for each stream class based on scientific literature
• Ecological endpoints and flow metrics vary by stream class
• Relationships based on scientific hypotheses, not detailed analyses
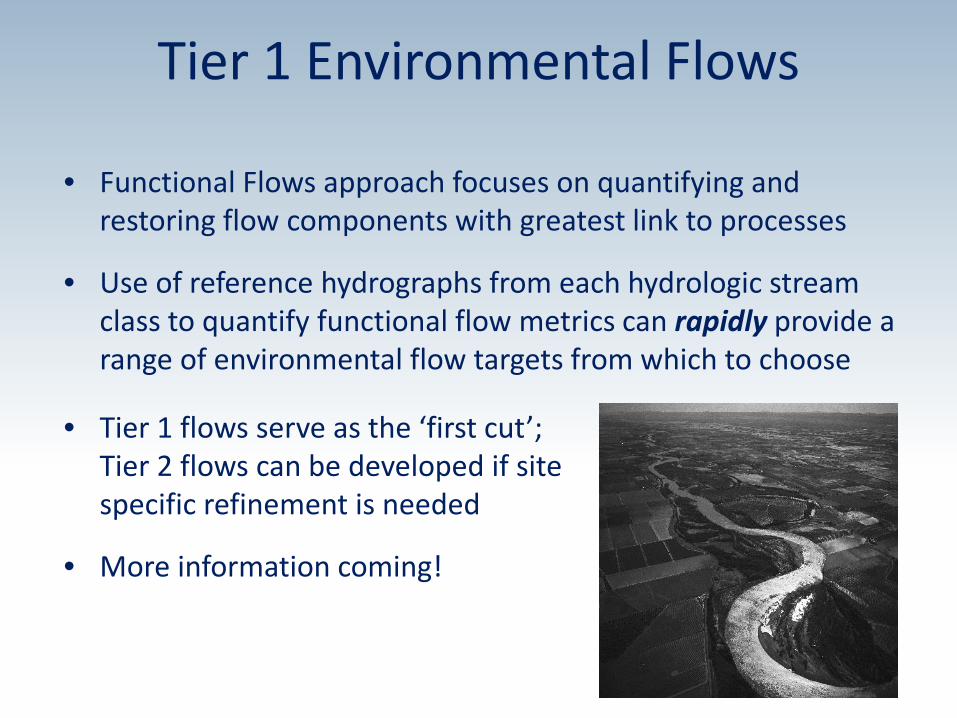
• Functional Flows approach focuses on quantifying and restoring flow components with greatest link to processes
• Use of reference hydrographs from each hydrologic stream class to quantify functional flow metrics can rapidly provide a range of environmental flow targets from which to choose
• Tier 1 flows serve as the ‘first cut’; Tier 2 flows can be developed if site specific refinement is needed
• More information coming!
Tier 1 Environmental Flows