
Ceylon Petroleum Corporation
toopeR launnA - 2009
වාර්ෂික වාර්තාව - 2009

CONTENTS
Description Page
Our Vision and Mission 1
Corporate Information 2
Senior Management 3
Directors’ Report 4 - 10
Chairman’s Report 11 - 19
Statement of Value Added 20
Highlights 21
Corporate Governance 22 - 26
Financial Statements 27
Income Statement 28
Balance Sheet 29
Statement of Changes in Equity 30
Cash Flow Statement 31 - 32
Significant Accounting Policies 33 - 43
Notes to the Financial Statements 44 - 55
Auditor General’s Report 56 - 75
Ten Year Summary
Glossary of Financial Terms
76 – 78
79
Abbreviations 80

1
OUR VISION
To be the premier customer driven, environmental friendly, enterprise in
the petroleum and related industries in the region while contributing
towards the prosperity of our nation.
OUR MISSION
To achieve excellence in petroleum refining, sales and marketing of high
quality products through a loyal and efficient dealer network and by
providing total solutions and services exceeding customer expectations,
while utilizing a high technology base for growth and development of the
enterprise by employee participation and innovation and maintaining high
ethical norms in all its activities with highest concern for health, safety and
environment and meet the expectations of the stakeholders.
2
CORPORATE INFORMATION
BOARD OF DIRECTORS
CHAIRMAN & MANAGING DIRECTOR
Major General Asoka Thoradeniya, USP
DIRECTORS
Mr. Methsiri Wijegunawardana
Ms. Kanthi Wijetunge
Mr. Saliya Rajakaruna
Mr. W.K.B. Weragama
Mr. Nihal Keppitipola
Mr. David Charitha Goonaratne
AUDITORS
The Auditor General
REGISTERED OFFICE
“Rotunda Tower”, No. 109, Galle Road, Colombo 3.
Telephone : 2473644(9 lines), 5455455(10 lines)
Telegrams : 2473644”LANKA OIL”
Cables : CEYPETCO
Telex : 221167,221235,221624 CEPETCO-CE
Fax : 2473979
E-mail : [email protected].
BANKERS
People’s Bank Bank of Ceylon
Commercial Bank Hatton National Bank Ltd.
Citi Bank N.A. Standard Chartered Bank

3
SENIOR MANAGEMENT
Major General Asoka Thoradeniya
Chairman/Managing Director
B.C. Jayawardhana Actg. Refinery Manager
S.K. Cyril Deputy General Manager
(Administration/Corporate Affairs/Business Development )
Ms R.T.A .Dabare
Acting Deputy General Manager (Finance)
S.W. Gamage Actg. Deputy General Manager
(Planning & Development)
R.S.Suntharalingam Additional Finance Manager
N.N.I.R. Fernando Deputy Refinery Manager
(Technical Services)
N.R.R. Jayasekara Deputy Refinery Manager (Maintenance & Project)
Ms.G. De Fonseka Chief Legal Officer
E.M. Piyasena Deputy Refinery Manager
(Manufacturing Operation)
A.R. Abel Marketing Manager
(Business Development)
W.Sarath Perera
Manager (Internal Audit)
K.S.W. Kottahachchy Commercial Manager
N.W.D.J. Silva Marketing Manager
(Retail)
A. Lambius Manager
(Agro Chemical)
P.G.H. Samarwickrama Engineering & Premises Manager
Maj. M.R.S.P. Samarasinghe Manager (Security& Investigation)
Ms. H. Senevirathne Manager Supplies
M. K. Garusinghe Manager (Development)

4
DIRECTORS’ REPORT
In accordance with Section 32(3) of the Ceylon Petroleum Corporation Act No. 28 of
1961, the Directors of the Ceylon Petroleum Corporation have pleasure in presenting
their report together with the Audited Financial Statements for the year ended 31st
December 2009. The Draft Financial Statements were approved by the Board of
Directors at the Board Meeting held on 19th March 2010 and submitted to the Auditor
General on the same day (19th March 2010). The Audited Financial Statements were
authorized to be issued on19th March 2010.
The Annual Report and Accounts, together with the Auditor General’s Report have
already been submitted to the Minister of Petroleum and Petroleum Resources
Development.
Principal Activities The principal activities of the Corporation are importing, refining, selling and distributing
petroleum products in Sri Lanka.
Associate Provision of storage and distribution facilities and IT services are core activities of
Associate company (CPSTL) for which CPC has invested 1/3 of share capital.
Review of Business The Chairman’s Review on pages 11 to 19 deals with the year’s performance of the
Corporation and on the Sri Lanka economy.
System of Internal Controls The Board of Directors has instituted an effective and comprehensive system of Internal
Controls required to carry on the business of the Corporation in an orderly manner, to
safeguard its assets and secure as far as possible the accuracy and reliability of the
Corporation’s Records.

5
Human Resources The Corporation while continuing to implement appropriate Human Resource
Management policies and practices to enhance employees’ skills.HR division is preparing
the revised cadre proposal as approved by the Board of Directors. Our HR policy
emphasizes on providing employees with new opportunities including foreign training
and ensuring their optimum contribution towards achieving our goals. The new
proposed cadre will help to improve the efficiency of the management within the entire
organization.
Audit Committee Audit Committee consists of three members, all of whom are Non-Executive Directors
including Chairman of Audit Committee. The Committee operates within a clearly
defined Terms of Reference (TOR) given by the Public Finance Circular No. PF/PE 7 dated
15th March 2000.
Financial Performance Turnover The turnover for the year had reduced to Rs. 257.508Bn. from the previous year figure
of Rs.358.002 Bn. which accounted the percentage reduction of28.07.The salient feature
observed was the increase of sales volume while reducing the turnover. The main
contributing factors for the reduction of turnover were the reduction of fuel prices of
Diesel, Petrol, Kerosene and Furnace Oil during the year.
The total turnover of the Corporation during the year is comprised of domestic Sales
(97.5 %) and Indirect Exports (2.5 %) for the year. Diesel, Petrol, Kerosene and Furnace
Oil are the major components of the domestic sales. The Corporation was responsible
for over 77 % of the Petrol and 85 % of the Diesel sales in the country.

6
Profit / (Loss) The Corporation has continued to incur loss of Rs. 11,566.96Mn.. which is lower than the
loss of Rs.14,735.028Mn. recorded in the previous year. The main contributory factors to
the recorded loss were selling of Furnace Oil at a subsidized price for power generation
and industries. Non adjustment of domestic retail price changes in line with
international oil price movements. The loss incurred by selling high Sulphur Furnace Oil
for power generation and industries were recorded as Rs. 18,550.24 Mn. and
Rs. 2,588.49 Mn. respectively. Loss due to concessions granted to the general public on
account of Kerosene was Rs. 1,540.43 Mn..The loss due to sale of Jet A-1 to Airlines was
Rs. 353.95 Mn.. which is significantly less than the loss incurred during the previous year.
Despite the heavy losses incurred due to above reasons, the sale of Petrol 90 Octane and
Auto Diesel had contributed positively with the profit contribution of
Rs. 6,865.22 Mn..and Rs. 2,159.73Mn.. These two figures along with the profit earned
from Asphalt, Naphtha, Petrol 95 Octane and Super Diesel had contributed to shrink the
overall loss to Rs. 11,497.47 Mn.. during the year. Reasons for the profit earned by these
products were the reduction of Crude oil and Refined product prices during the first
quarter of the year under review. Variations of Crude Oil prices during the first quarter
of the year were between US$ 40 per Bbl and US$ 60 per Bbl.
The net profit / (loss) for the year was Rs. (11,566.96) Mn..
The details of our profits / (loss) are given below:
2009 Rs. Mn.
2008 Rs. Mn..
Revenue 237,662.619 341,670.329
Cost of Sales (233,540.920) (339,835.291)
Gross Profit 4,121.700 1,835.038
Operating Income 2,290.064 1,070.740
6,411.760 2,905.778
Selling & distribution Exp. Administrative Exp. Financial Charges Profit/(loss) Before Tax
(10,421.438) (2,602.887) (4,740.663)
(11,353.224)
(10,516.235) (3,961.366) (3,163.204)
(14,735.028)
Taxation (213.735) (217.490)
Profit/(loss) after Taxation (11,566.957) (14,952.518)

7
Contribution to the Government
2009 Rs. Mn..
2008 Rs. Mn.
Value Added Taxes 9,007 5,817
Excise Duty 17,864 14,881
Social Responsibility Levy 461 -
Cess - 3,981
Dealers Turnover Tax & Imports Turnover Taxes 2,248 3,289
PAL 5,783 4,967
Custom Duty 18,341 3,777
Debit Tax 125 205
NBT 166 -
TOTAL 53,995 36,917
Operating Expenses The total operating expenses has marginally increased to Rs. 17,764.99Mn. When
compared with the figure of Rs. 17,640.81 Mn.. recorded during the previous year.
Capital Expenditure The total Capital Expenditure for the year was Rs. 270.642 Mn. whereas the same for
2008 recorded as Rs. 468.128Mn.
Property, Plant & Equipment Details of Property, Plant & Equipment of the Corporation and their movements are
given in Note 6 to the Financial Statements on pages 27.
Reserves The total reserves of the Corporation stood at Rs. 5,628.58Mn.as at 31stDecember 2009
in comparison to the figure recorded as Rs. 5,586.20Mn. in 2007. Movements are given
in the Statement of Changes in Equity on page 30.
8
Contributed Capital The total Contributed Capital of the Corporation as at 31 December 2009 was Rs. 1,000
Mn.
Board of Directors The Board comprises seven Directors including the Chairman. The Directors of the
Corporation during the year under review were:
Major General Asoka Thoradeniya, USP – Chairman
Mr. Methsiri D. Wijegoonawardane
Mr. Saliya Rajakaruna
Mrs. Kanthi Wijetunge
Mr. David Charitha Gooneratne
Capt. Nihal Keppetipola
Mr. W.K.B. Weragama
Directors’ Interest in Contracts & Related Party Transaction Directors’ interest in the contracts with the Corporation is referred in Note 22 to the
Financial Statements.
Compliance with Laws and Regulations The Corporation has not engaged in any activities contravening the laws and regulations.
All those responsible for ensuring compliance with the provisions in various laws and
regulations confirm their compliance to the Board of Directors.
Statutory Payments The Directors, to the best of their knowledge and belief are satisfied that all statutory
payments due to the Government and in relation to employees have been made on
time.

9
Going Concern The Board of Directors has reviewed the Corporation’s business plan and is satisfied that
the Corporation has adequate resources to continue its operations in the foreseeable
future. Accordingly, the Financial Statements are prepared based on the going concern
basis.
Internal Controls, Risk Management & Compliance Directors are responsible for the system of internal controls and risk management and
place considerable importance on maintaining a strong control environment to protect
and safeguard assets of the Corporation and prevent frauds and mismanagement.
Whilst inherent and residual risks cannot be completely eliminated, the Corporation
attempts to minimize them by ensuring that appropriate infrastructure, controls,
systems and ethical behavior are applied within predetermined procedures and
constraints. The Directors and management have put in place risk management policies
and guidelines. Senior Management Committee and Audit Committee are established to
monitor and manage all material risks.
Appointment of Auditors Pursuant to provisions of Article 154 of the Constitution of the Democratic Republic of
Sri Lanka, the Auditor General is the Auditor of the Corporation and issues final opinion
on the financial statements. The responsibilities in relation to the financial statements
are set out in the report of the Auditor General on page 56 of this Annual Report.

10
Corporate Governance
The Board of Directors is committed towards the maintaining as effective Corporate
Governance structure and process. The financial, operational and compliance aspects of
the Corporation are directed and controlled effectively within Corporate Governance
practices. These practices are in conformity to Corporate Governance rules and
regulations are described in Corporate Governance Report appearing on page 22 to 26
of this report.
For and on Behalf of the Board of Directors
Major General Ashoka Thoradeniya, USP
Chairman & Managing Director

11
CHAIRMAN’S REPORT Introduction The economy of Sri Lanka demonstrated an overall growth rate of 3.5 per cent in 2009
despite the most challenging domestic and external conditions. This is an outstanding
achievement resulting from the steady recovery of the economy since the second
quarter of the year. As reported by the Central Bank of Sri Lanka, the growth rate during
the fourth quarter of the year was 6.2 per cent. The domestic front impact on the
economy during early part of the year was due to the reaching of the internal conflict in
to the critical juncture. External pressure was due to the sudden withdrawal of capital by
foreign investors resulting from the adverse global condition continued throughout the
early part of the year.
Slowing down of the Global economy from the latter part of the previous year reduced
the global demand for oil and the prices dropped drastically. This trend had been
continued to the early part of the year under review and the oil prices dropped as low as
to US$ 40 per Bbl. The domestic selling price of petroleum products were revised in
December 2008 by passing the benefits of the reduction of global oil prices to the Sri
Lankan consumers.
Source: Platt’s Singapore prices
Mov ement of C rude P ric e
0
20
40
60
80
100
120
140
160
1/2/2003 1/2/2004 1/2/2005 1/2/2006 1/2/2007 1/2/2008 1/2/2009 2003 2004 2005 2006 2007 2008 2009
US $/bbl
12
In accordance with the Government decision, Corporation commenced to supply
Furnace Oil for power generation at fixed subsidized price from the beginning of the
year under review.
The total loss incurred on account of selling high Sulphur Furnace Oil at a subsidized
price for power generation was recorded as Rs. 18,550.24 Mn. during the year. The loss
incurred on selling Kerosene at subsidized price to general public was Rs. 1,540.43 Mn.
and the same for Air Lines on account of supplying Jet A-1 was as Rs. 353.95 Mn.. During
the year, the sale of petrol and Auto Diesel had generated profits for the Corporation.
These profits significantly compensated the losses incurred by fixing the domestic selling
price of Furnace Oil at a very low fixed price specially for power generation.
Financial Performance
Corporation has continued to incur loss of Rs. 11,566.96Mn. during the year. The loss
incurred by selling high Sulphur Furnace Oil for power generation and industries were
recorded as Rs. 18,550.24 Mn. and Rs. 2,588.49 Mn. respectively. Loss due to
concessions granted to general public on account of Kerosene was Rs. 1,540.43 Mn. The
loss due to sale of Jet A-1 to Air Lines was as Rs. 353.95 Mn..
Despite the heavy losses incurred due to above subsidies, the sale of Petrol 90 Octane
and Auto Diesel had contributed positively with the profit contribution of
Rs. 6,865.22 Mn..and Rs. 2,159.73 Mn. respectively. These two figures along with the
profit earned from Asphalt, Naphtha, Petrol 95 Octane and Super Diesel had contributed
to shrink the overall loss to Rs. 11,566.96 Mn. during the year. The main contributory
factors for continuous loss making position were provision of fuel oil for power
generation at very subsidized price determined by the Government and failure to make
retail price adjustments in line with international oil price movements.
The Refinery recorded a gross loss of approximately Rs.3.1 billion at the end of the year
even at the reduced throughput of 4,000 MT/Day during the period from August to
December. The main contributing factor for the loss was the sharp reduction oil prices in
the international market.

13
Starting from month of January of the year under review, CEB had agreed to settle their
oil bills to CPC which did not materialize. The accumulated debt of all the Government
agencies including CEB and the armed Forces is a continuing critical issue to CPC; these
debts totaled Rs.52.50Bn as at 31stDecember 2009.
In total, the Corporation made a massive contribution of Rs. 53.995Bn. to Government
revenue during the year. During the review period, CPC maintained the strategic stock
levels required to meet the domestic demand through effective storage operations
coupled with efficient planning of imports.
Serving the Nation
Arising from our vision, CPC continuously committed to contribute to enhance the living
standards of people in our country. During the year, all possible efforts were taken to
keep the domestic prices as low as possible absorbing the price fluctuations in the
international market.
The Corporation granted massive discounts for the power sector including private power
plants, thus helping to maintain steady energy prices for Sri Lankan consumers. As a
Government-owned enterprise, CPC continued to provide uninterrupted fuel supplies to
Sri Lanka Railways and the armed forces, helping these organizations discharge their
responsibilities to the nation. Under the circumstance of the involvement of the armed
forces in the humanitarian operations, contribution by CPC for their logistics was
commendable. The corporation took part in the “Negenahira Udanaya” and “Uthuru
Wasanthaya” programs of the Government and initiated to develop filling stations in the
Northern and Eastern provinces.
CPC continued to provide energy for the poor in the form of kerosene at a subsidized
price, from which the revenue loss to CPC in 2009 was Rs. 1.540 Bn.
CPC, while transferring all internally-generated cost advantages to the national
economy, is determined to guarantee the best possible domestic energy prices. In line
with this, we maintained our pricing policy with respect to agrochemicals, in order to
protect farmers from the effect of unusually inflated prices.

14
CPC, as a responsible corporate citizen, has recognized the importance of minimizing the
environmental pollution especially in terms of the handling and usage of petroleum
products for the safety of the environment. In line with world environmental standards,
it has developed plans to modernize the refinery to deliver products which have lower
environmental impact, as well as to produce low-sulphur diesel and furnace oils.
Strategic Priorities
An effective and efficient operation of the refinery, optimum utilization of storage
facilities including pipelines and discharging infrastructure both offshore and on shore,
implementation of efficient procurement and effective risk management practices were
identified as our strategic priorities.
The “Enterprise Resource Planning (ERP)” project, initiated in association with Ceylon
Petroleum Storage Terminals Limited (CPSTL), is in its final stage for launching. This ERP
system will enable providing timely and accurate information to the management. The
ERP system is planned to be launched during the first quarter of 2010.
Our current refinery expansion project is the most critical element in CPC’s future
sustainability. CPC is still looking forward to secure financing for the implementation of
the project.
New Markets
CPC has successfully entered into lubricant business and currently in the process of
expanding the market through its well established dealer network. Despite the marginal
loss of Rs. 6.17 Mn. incurred during the year more profit will be expected with the
expansion of the coverage and gaining market share.
Introduction of more farmer friendly pricing scheme and opening of CPC owned outlets
covering the entire geographical areas had been continued to expand our agrochemical
business during the year under review. We have successfully obtained ISO certifications
for our plant in Kolonnawa during the year.

15
New CPC Head Office Building
Construction of the new state-of-the-art Head Office building at Dematagoda at a cost of
Rs. 2.0Bn. is continued during the year. The project is planned for completion in the
third quarter of 2011.
Corporate Governance
An Audit Committee, which consists of three Non-Executive Board Members,
continuously meeting to achieve the objective of bringing our corporate governance in
par with global standards.
Corporate Social Responsibility
Corporate Social Responsibility is continued to be our main focus of attention and all
attempts are made to meet the needs of the entire nation at the least possible cost to
the consumer. As mentioned above, initiatives have promptly taken under the
“Negenahira Udanaya” and “Uthuru Wasanthaya” programs to supply fuels to the
cleared areas within a minimum possible time with the intention of the enhancing the
livelihood of the affected people in these areas. We also guaranteed uninterrupted fuel
supplies to Government institutions at any cost.
CPC has contributed a massive amount of Rs. 28.652 billion to the Government coffers
by duties and taxes during the year 2009.
Refinery Production
Refinery completed 40 years of operation on 06 August 2009 and processed 2,005,915
metric tons (Mts.) of Crude Oil equivalent to 5574 TPCD and 5491 TPSD, against a
budgeted 2,170,000 metric tons of crude oil intake. Total operating time efficiency was
98.5%.
The Refinery recorded a negative profit margin of approximately Rs.3.1 billion at the end
of the year even at the reduced throughput of 4,000 MT/Day during the period from
August to December.

16
Import of Crude Oil and Refined Products
The Corporation has imported 1.931Mn.. metric tons of crude oil at a C&F cost of USD
888.482Million. The average crude oil (C&F) cost is USD 62.524 per bbl compared to USD
97.65 per bbl during the previous year. The freight charges for importing crude oil
average to USD 10.82 per metric ton, when compared to 13.77 per MT in the previous
year.
Refined Bulk Products Imports were metric tons of 1.448Mn..and C & F value was USD
773.883Million.
Services by Ceylon Petroleum Storage Terminal Ltd., (CPSTL)
With the restructuring of CPC, the storage and operations of Kolonnawa and 12 regional
bulk depots located island wide, Data Processing and Distribution activities were
segregated and were brought under the CPSTL.
CPSTL along with CPC hold regular stock review meetings with marketing companies, to
monitor and ensure product availability to meet the country’s demand. It recovers a
Terminal Fee for the provision of storage and operation services, and specific charges for
distribution and data processing services rendered to CPC.
Operational facilities at Muthurajawela Tank Farm have been to unloading large tankers
to build up stocks when oil prices are low. While saving Rs. 30 million (approximately)
per shipment by way of reduced freight and avoiding pipeline and jetty charges.
The project to install a separate offshore pipeline with a dual berth Buoy to supply fuel
to the 300 MW West Cost Power Plant in Kerawalapitiya has commenced. In order to
improve operational efficiency, CPSTL will be launching a pipeline project linking
Kolonnawa and Muthurajawela storage tanks.
Revenue
The Corporation was responsible for over 77% of Petrol, 85% of Diesel and 100 % of
Kerosene sales in the country. Revenue for the year had reached Rs. 257.508Bn, when

17
compared to the previous year revenue of Rs. 358.002 Bn. The salient feature observed
is the increase of sales volume while reducing the turn over. The main contributing
factors for the reduction of turnover were the reduction of fuel prices of Diesel, Petrol,
Kerosene and furnace oil during the year. There wasn’t a noticeable demand increase or
decrease in all kinds of petroleum product.
Agrochemicals
CPC continues its pricing policy of maintaining reasonable prices for Agro Chemicals used
by cultivators and Plantation Sector, thus making useful contribution towards lower
production cost, thereby boosting overall agriculture sector.
The current “Ceypetco” agro chemical product range consist of 5 Weedcides, 4
Fungicides and 6 Insecticides. Serious consideration has been continuously given to
extend our product range to cover other agro based areas in the future. We also plan to
promote sales of Ceypetco agro Sales Centers, which would be set up in agro based
areas of the country.
Human Resource Development and Welfare
The employee strength by the end of year 2009 was 2682 in the permanent cadre and
197 in the casual cadre.
CPC has provided its employees and their families a Medical Assistance Scheme which is
managed by the Thrift Society of the Corporation. The Corporation employs two
Medical Officers on fulltime basis to serve employees. The hospitalization costs and
indoor treatments amount to Rs. 30 Million during the year under review. A monthly
allowance of Rs. 250/= is also paid to all employees for outdoor medical treatment.
18
A gratuity equivalent to ½ month pay for every year of service is paid under the Gratuity
Act and additional retirement and death benefits are paid out of Thrift Society funds. A
Death Gratuity is also paid for death of an employee. Corporation also provided
scholarship scheme for children of the employees who are at university level. During the
under review 15 scholarships granted for the children of employees who are reading
degrees in the field of Medicine, Engineering Management, Bio-Science, Physical
Science, Commerce and Arts. CPC has also established a Sports Club with a view to
encourage sports activities. CPC maintains four Holiday Homes outstation, exclusively
for the usage of employees and their families. There are several loan facilities granted at
concessionary interest rates to fulfill many necessities of employees.
We have also allocated funds for training employees locally and abroad. Funds are also
allocated for improving the knowledge of languages and computer literacy of employees
to upgrade their working environment.
The practice of awarding employees who have satisfactorily completed their services is
as follows;
20 years - Rs. 10,000/=
25 years - Gold Coin of 2.5 sovereign
30 years - Rs. 20,000/=
35 years - Rs. 25,000/=
40 years - Rs. 40,000/=
Employees’ children who are selected for government University education are awarded
scholarships as a welfare activity by the Corporation.
Environment Safety CPC being the market leader of petroleum products in the island and the owner of the
only local refinery in the country, is fully aware of its obligations to minimize
environmental pollution, and concerned about the environment safety in handling and
usage of petroleum products. In line with world environmental standards, CPC is
planning a modernization project at refinery, in order to produce low sulphur Diesel.
19
Looking Ahead to 2009
We have realized the increasing demand for refined petroleum products, especially for
liberated areas, power generation and increasing traveling within the country during the
coming year. The increasing demand for refined petroleum products will have to be
currently catered purely through importation. As mentioned previously, we eagerly look
forward to the implementation of the refinery expansion project to cater to the
domestic demand increase.
It is to be noted that, with our committed and experienced management team, with
clear market leadership and a knowledgeable and experienced workforce, we will take
every endeavors to achieve all targets while facing all the challenges ahead of us.
Acknowledgement
On behalf of the Board of Directors of the Ceylon Petroleum Corporation, I would like to
thank all members of the CPC team, who had stood with me to take all the challenges
during this period. I also thank the Hon. Minister of Petroleum and Petroleum Resources
Development and his Officials, the Treasury, the Central Bank, our business partners and
customers for their co-operation and support.
I take this opportunity to convey my gratitude to the Board of Directors for an excellent
job done and for their valuable support extended to me throughout the year. I also
thank our corporate and executive management, staff, customers and all stakeholders
for their dedication, loyalty and support in making the year under review a successful
one.
I further extend my appreciation to the Government; the Minister of Petroleum and
Petroleum Resources Development, the Hon. Minister A.H.M. Fowzie, the Secretary of
the Ministry of Petroleum and Petroleum Resources Development and his officials, the
Secretary to the Treasury and his official and the Governor of the Central Bank of Sri
Lanka, and his officials for their invaluable guidance and support.
Major General Ashoka Thoradeniya, USP Chairman & Managing Director
CEYLON PETROLEUM CORPORATION

20
STATEMENT OF VALUE ADDED
Rupees Million
2009 2008
Turnover 257,508.00 358,002.00 Bought in materials & services
(212,680.00) (335,551.00)
Value Added 44,828.00 22,451.00 Applied the following way % % To pay employees Wages & fringe benefits
2,301.00 5.13 2,237.00 9.96
To pay providers of capital Interest on loans
4,741.00 10.58 3,163.00 14.09
To provide maintenance and expansion of assets Depreciation 355.00 0.79 366.00 1.63 Retained Profit (11,664) (26.02) (15,029) (66.94) To pay Government Taxes, Duties, Stamp duty and Contribution to the general Treasury
49,096
109.52
31,714.00
141.26
Value Added 44,828 100.00 22,451.00 100.00

21
HIGHLIGHTS
FINANCIAL
UNIT 2009 2008
Gross Revenue Rs. Mill. 237,662.619 341,670.329 Gross Profit Rs. Mill. 4,121.700 3,393.103 Operational Profit/(Loss) Rs. Mill. 5,307.769 3,156.610 Finance Charges Rs. Mill.
4,740.663 3,163.204
Profit before Taxation Rs. Mill. (11,353.224) (14,735.028) Net profit after Taxation Rs. Mill. (11,566.957) (14,952.518) Capital and Reserves Rs. Mill. (13,038.049) (1,416.432) Long Term Borrowings Rs. Mill. 32,779.059 10,908.413 Capital Expenditure
Rs. Mill. 270.642 468.128
IMPORTS Crude Oil Imports Metric Tons 1,928,655 1,846,453 Refined Bulk Products Imports Metric Tons 1,449,969 1,625,720 C&F Value
Rs. Million 189,848.570 144,505.386
OPERATIONS Sales Metric Tons 4,208.348 3,436,662 Refinery Throughput
Metric Tons 1,894.910 1,776,787
MARKETING CPC Owned Nos. 252 253 Dealer Owned Nos. 712 686 Dealer controlled
Nos. 48 48
EMPLOYEES Employees at the yearend Nos. 2,792 2,832 Total emoluments for the year Rs. Million 2,055.826 1,880.570 Value added per employee Rs. 726,327 664,043

22
CORPORATE GOVERNANCE Corporate Governance As the major supplier of fuel, one of the key intermediary products of the Sri Lankan
economy, the Ceylon Petroleum Corporation affects the lives of all individuals and
institutions in the country. Considering the stakeholder groups, the Board of Directors
believe in and is committed to the practice of strong corporate governance, revising
governance practices to maintain the highest standards in the operation of the
Corporation. The Board believes that strong corporate governance helps to discharge its
responsibilities relating to transparency, disclosure and accountability. Moreover, they
are of the view that strengthening corporate governance is a continuous process. This
section describes some of the structures, processes and procedures of corporate
governance at the Ceylon Petroleum Corporation.
Board of Directors
The Board of Directors comprises of seven members, including the Chairman, all
appointed by the Hon. Minister of Petroleum and Petroleum Resource Development, in
accordance with the Ceylon Petroleum Corporation Act. No.28 of 1961 and its
amendments. One such Director is a representative of the Treasury (Ministry of
Finance). All the Directors are Non-Executive Directors, except for the Chairman who is
also the Managing Director.
Subject to reappointment, the Directors have initial tenures not exceeding a period of
three years on the Board. In taking decisions, the Board obtains relevant information
from the corporate management and if required, obtains information from external
professionals.

23
The Board of Directors is responsible for conducting the business affairs of the
Corporation, while adhering to the statutory requirements under which the Corporation
is governed. They are also responsible for granting approval for annual accounts, the
annual budget, corporate plan Action Plan and reviewing financial performance on a
regular basis. The Board oversees the granting of approvals relating to key
appointments, staff promotions, major capital expenditure investment and credit.
Board Meetings
Regular Board Meetings are held monthly, while special Board Meetings are convened
as and when required. Senior Managers also attend meetings on invitation.
The Board Meetings are conducted on a formal agenda and Directors are provided with
relevant background information by the corporate management prior to meetings.
Sixteen Board Meetings were held during the year under review, and there was full
attendance at all of these meetings.
Compliance and Transparency
The Ceylon Petroleum Corporation is committed to maintaining transparency in all its
dealings. The Corporation complies with Sri Lanka Accounting Standards and relevant
regulations to ensure accountability. Strong internal compliance measures have been
integrated into the Corporation’s daily operations. In accordance with the Finance Act
and Corporation Act, Financial Statements are published annually and tabled in
Parliament. Also in compliance with the Finance Act, the Auditor General carries out the
external audit of the Corporation.

24
Audit Committee
During the year the Audit Committee had five meetings at which review of financial
statements, discussions with regard to the report submitted by the Auditor General,
evaluation performance of different units of the Corporation, discussions relating to the
strategic issues of the Corporation and issues relating to stock and terminal operations
were taken up among the other matters. Mr. Saliya Rajakaruna who represented the
Treasury function as the Chairman of the Audit Committee until latter part of the 2009
and after his retirement Mr. Methsiri Wijegunawardena was appointed as the Chairman
of the Audit Committee.
Committee consists of three non executive directors who functioned as the members of
the committee. The Manager Internal Audit acts as the secretary to the Audit
Committee while superintendant of Government Audit unit and the external Auditors
take part in as observers to the Committee. Recommendations made by the committee
were submitted for the Board of Directors.
Management Committee
The Management Committee sits once a month to discuss current issues, especially in
relation to functional areas. The Committee is headed by two Directors who assist the
Chairman of the Committee. In this Committee, issues are discussed in detail and
decisions taken are forwarded to the Board of Directors for final approval.
Financial Disclosure
The Board of Directors is responsible for presenting Financial Statements that provide a
true and fair view of the operations of the Corporation. These statements are prepared
in accordance with the requirements of Sri Lanka Accounting Standards, the Finance Act
and the Corporations Act.

25
Internal Controls
The Board of Directors is responsible for maintaining a sound system of internal controls
and reviewing its effectiveness. The system is intended to safeguard the assets of the
Corporation and to ensure that proper records are maintained and reliable information
is produced. This responsibility covers all types of controls, including financial,
operational and compliance controls as well as risk management. It is vital to state,
however, that any system of internal control can ensure only reasonable and not
absolute assurance that errors and irregularities will be presented or detected within a
reasonable period of time.
The Internal Audit Department of the Corporation is responsible for ensuring the
adequacy of internal control procedures, and makes regular recommendations on
improvements.
Internal Audit
The Internal Audit has focused on the following objectives in discharging its
responsibilities.
(1) Review the annual financial statements to ensure whether they are complete,
consistence and in compliance with statutory requirements.
(2) Review of the other sections of the annual report in order to ensure information
disclosed are understandable and consistence.
(3) Oversee the function of risk management.
(4) Oversee the policies and procedures in place to have a system of internal
controls adequate in design and effective in operation.
(5) Review of financial statements and ensure that management response to
recommendations made by external auditors in timely manner.
(6) Performed all other functions delegated and / or requested by the Board.
(7) Regular update the Board about committee activities and make appropriate
recommendations.
26
Summary of activities carried out during the year;
(1) The committee reviewed the audited financial statement for the year ended 31st
December 2009 with the comments made by the Auditor General in his report.
(2) During above period the committee reviewed the effectiveness of financial
controls to ensure that they provide reasonable assurance.
(3) Committee emphasizes that Sri Lanka accounting standards and other relevant
rules and regulations should be complied in preparation of financial statements.
(4) The Committee had the meeting with the external auditors and reviewed various
weaknesses, especially operational and a financial area in order to ensure that
due attention is paid by the management in compliance with weaknesses
highlighted.
(5) The Committee reviewed the internal audit reports of the Corporation and
directed executive management to take corrective action to safeguard the assets
of the Corporation.
During the period under review, the Committee appointed two subcommittees to
address the pressing problems of the Corporation noted below;
(1) Financial reporting subcommittee to deal with all matters relating to audit and
financial statements and preparation of register of land which are owned by the
Corporation in order to ensure proper arrangements in regular basis.
(2) The committee also reviewed the progress report made by manager Internal
Audit with regard to internal audit process and stock control and losses.
Relationship with Treasury
The Corporation is closely associated with the Central Bank and the Treasury and obtains
their advice when managing Corporation’s treasury operations. The Corporation also
seeks advice and guidance for major expansion programmes and borrowings.

27
FINANCIAL STATEMENTS
Income Statement
Balance Sheet
Statement of Changes in Equity
Cash Flow Statement
Significant Accounting Policies
Notes to the Accounts

28
INCOME STATEMENTS
CEYLON PETROLEUM CORPORATION
INCOME STATEMENTS
Note 2009 2008
Rs. Mn. Rs. Mn.
Year Ended Year Ended
31.12.2009 31.12.2008
Revenue 1 237,662.619
341,670.329
Cost of Sales (233,540.920)
(338,513.719)
Gross Profit 4,121.700
3,156.610
Other Operating Income 2 1,186.069
236.493
Gain /(Loss) on Derivative Financial Instruments 0.000 (1,321.573)
Selling & Distribution Expenses (10,421.438)
(10,516.235)
Administrative Expenses (2,602.887)
(3,961.366)
Finance Charges 3.1 (4,740.663)
(3,163.204)
Finance Income 3.2 1,103.995
834.247
Profit /(Loss) Before Tax 4
(11,353.224)
(14,735.028)
Income Tax Expense 5 (213.733)
(217.490)
Profit /(Loss) for the year
(11,566.957)
(14,952.518)

29
BALANCE SHEET
R.T.A.Dabare
Act. Finance Manager R S Suntharalingam Addl. Finance Manager
19
thMarch 2010
CEYLON PETROLEUM CORPORATION
BALANCE SHEET
Note 2009 2008 Rs. Mn. Rs. Mn.
ASSETS Year Ended Year Ended 31.12.2009 31.12.2008 Non - Current Assets
Property, Plant &Equipments 6 5,041.139 4,624.066 Investment in Associated Companies 7.1 2,500.000 2,500.000 Other Investments 7.2 41.876 41.876 Trade and Other Receivables - More than one year 8 4,201.682 4,788.333 Deferred Tax Asset 5 689.623 689.623
12,474.320 12,643.898 Current Assets Inventories 9 25,568.277 31,537.495 Trade & Other Receivables - Due within one year 8 77,232.517 66,962.369 Income Tax Recoverable 106.369 243.672 Cash and Cash Equivalents 10 31,762.640 9,244.432
134,669.803 107,987.968
Total Assets 147,144.123 120,631.866
EQUITY AND LIABILITIES
Capital and Reserves Contributed Capital 11 1,000.000 1,000.000 Capital Reserve 12 4,992.686 4,992.686 Revaluation Reserve 13 25.696 25.696 Insurance Reserve 14 610.198 567.814 Retained Earnings (19,666.628) (8,002.628) Total Equity (13,038.048) (1,416.432)
Non - Current Liabilities
Retirement Benefits Liability 15 735.165 566.542 Interest Bearing Loans & Borrowings 16 32,779.059 10,908.413
33,514.224 11,474.955
Current Liabilities
Trade and Other Payables 17 120,421.143 63,802.285 Current Portion of Interest Bearing Loans & Borrowings 18 6,076.113 46,697.413 Provision for Deemed Dividend 170.691 73.647 126,667.947 110,573.345
Total Equity and Liabilities 147,144.123 120,631.868

30
STATEMENTS OF CHANGES IN EQUITY
CEYLON PETROLEUM CORPORATION
STATEMENTS OF CHANGES IN EQUITY
Year ended 31st December 2009
Contributed Capital Rs. Mn.
Capital Reserve Rs. Mn.
Revaluation Reserve Rs. Mn.
Insurance Reserve Rs. Mn.
Retained Earnings Rs. Mn.
Total(Restated) Rs. Mn.
Balance as at 1st January 2006 as previously stated 1,000.000 4,992.686 25.696 482.210 6,172.863 12,673.455 Correction of Prior Period Errors Prior to 01.01.2006 (a) Reversal of Over provision made to Thrift Society in 2004 100.000 100.000 (b ) Provisioning for non recoverable ACT (376.000) (376.000) (c) Recognition of Deferred Taxation (109.380) (109.380)
Balance as at 1st January 2006 (restated) 1,000.000 4,992.686 25.696 482.210 5,787.483 12,288.075
Accounting Period 2006 (e) Correction of the excess Finance Cost to accounting period 2006 (82.416) (82.416) (f) Correction of non provisioning for arrears in (158.803) (158.803) Turnover Tax related to the accounting period 30.09.2003 to.30.09.2005 Deemed Dividend (54.568) (54.568) Surplus during the year 19.878 19.878 Net Loss for the Period (946.220) (946.220)
Balance as at 1st January 2006 (restated) 1,000.000 4,992.686 25.696 502.088 4,545.476 11,065.946
Accounting Period 2007 Surplus during the year 20.991 20.991 Net Profit for the period 2,862.337 2862.337 Deemed Dividend (381.464) (381.464)
Balance as at 1st January 2007 1,000.000 4,992.686 25.696 523.079 7,026.349 13,567.810
Accounting Period 2008 Surplus during the year 44.735 44.735 Net Loss for the period (14,952.518) (14,952.518) Deemed Dividend (76.459) (76.459)
Balance as at 1st January 2008 1,000.000 4,992.686 25.696 567.814 (8,002.628) (1,416.432)
Accounting Period 2009 Surplus during the year 42.384 42.384
Net Profit for the period (11,566.957) (11,566.957) Deemed Dividend (97.044) (97.044)
Balance as at 31st December 2009 1,000.000 992.686 25.696 610.198 (19,666.629) (13,038.049)

31
CASHFLOW STATEMENT
CEYLON PETROLEUM CORPORATION
CASH FLOW STATEMENTS
2009 2008
Rs.Mn. Rs.Mn. Year Ended Year Ended 31.12.2009 31.12.2008
Cash Flows From/(Used in ) Operating Activities Profit/(Loss) before tax from continuing operations (11,353.224) (14,735.028) Adjustment for : Depreciation 355.465 366.722 Foreign Currency Translation 443.355 (1,013.785) Investment Income (0.001) (0.111) Interest Received (438.287) (654.726) Provision for Insurance Reserve 42.384 44.735 Provision for Stores Non Moving Items 27.535 (18.181) Provision for Bad & Doubtful Debts & Recoveries (367.536) (16.152) Interest Expenses 4,740.663 3,163.204 Adjustment for Valuation of Shares - 5.000 Provision for Retirement Obligation 191.036 47.226 (Profit)/Loss on Sale of Property, Plant & Equipment (8.669) (1.908)
Operating Profit/(Loss) before Working Capital changes (6,367.278) (12,813.004)
Changes in Working Capital (Increase)/ Decrease in Inventories 5,941.683 8,673.831 (Increase)/ Decrease in Trade and Other Receivable (9,315.962) (32,409.849) Increase/ (Decrease) In Trade and Other Payables 56,618.858 39,946.795
Cash Generated from/ (Used in) operating activities 46,877.301 3,397.773
Interest Paid (4,740.663) (3,163.204) Retiring Gratuity Paid (22.413) (22.051) Income Tax /WHT paid (77.931) (1,440.125)
Net Cash Generated from Operating activities 42,036.294 (1,227.607)
CASH FLOWS FROM INVESTING ACTIVITIES Acquisition of Property, Plant & Equipment (833.409) (630.180) Proceeds from Sale of Property, Plant & Equipment 88.589 15.948 Income from Investment 0.001 0.111 Interest Received 438.287 654.726
Net Cash Used in Investing Activities (306.532) 40.605
CASH FLOWS FROM FINANCING ACTIVITIES Repayment of Long Term Loans (21,538.358) (1,001.410)
Net Cash From/(Used in) Financing Activities (21,538.358) (1,001.410)
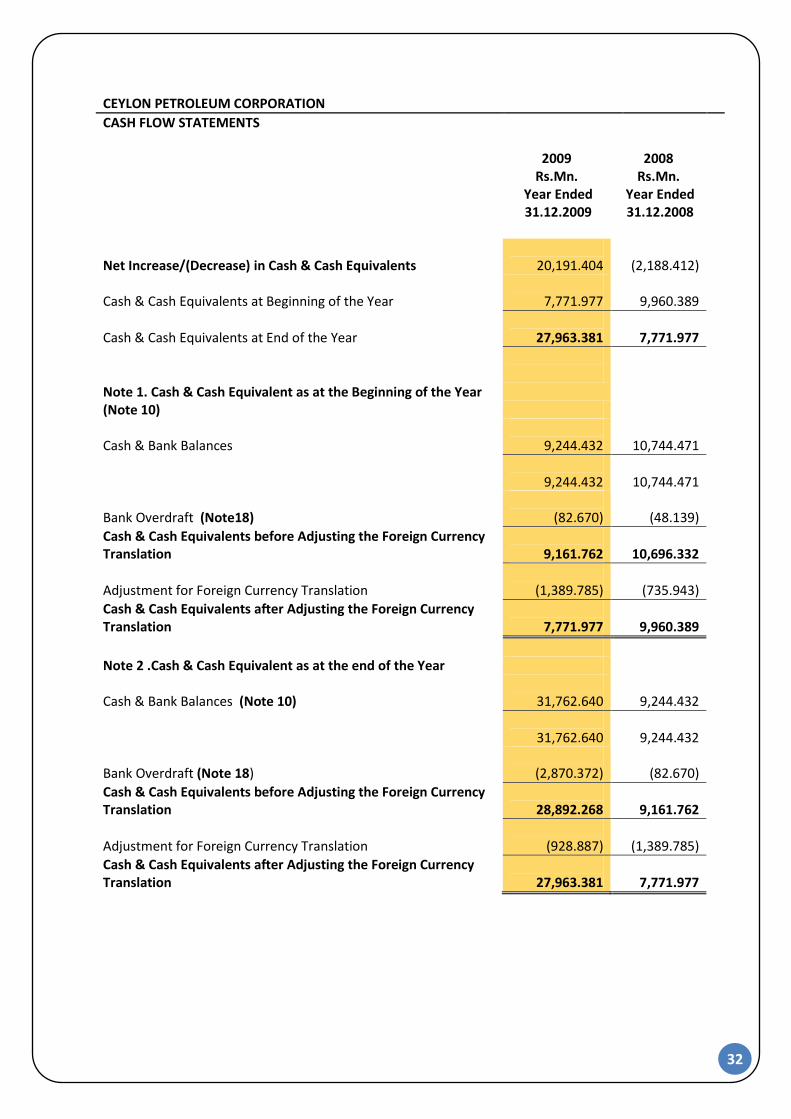
32
CEYLON PETROLEUM CORPORATION
CASH FLOW STATEMENTS 2009 2008
Rs.Mn. Rs.Mn. Year Ended Year Ended 31.12.2009 31.12.2008
Net Increase/(Decrease) in Cash & Cash Equivalents
20,191.404
(2,188.412)
Cash & Cash Equivalents at Beginning of the Year
7,771.977
9,960.389
Cash & Cash Equivalents at End of the Year
27,963.381
7,771.977
Note 1. Cash & Cash Equivalent as at the Beginning of the Year (Note 10)
Cash & Bank Balances
9,244.432
10,744.471
9,244.432
10,744.471
Bank Overdraft (Note18)
(82.670)
(48.139)
Cash & Cash Equivalents before Adjusting the Foreign Currency Translation
9,161.762
10,696.332
Adjustment for Foreign Currency Translation
(1,389.785)
(735.943)
Cash & Cash Equivalents after Adjusting the Foreign Currency Translation
7,771.977
9,960.389
Note 2 .Cash & Cash Equivalent as at the end of the Year
Cash & Bank Balances (Note 10)
31,762.640
9,244.432
31,762.640
9,244.432
Bank Overdraft (Note 18)
(2,870.372)
(82.670)
Cash & Cash Equivalents before Adjusting the Foreign Currency Translation
28,892.268
9,161.762
Adjustment for Foreign Currency Translation
(928.887)
(1,389.785)
Cash & Cash Equivalents after Adjusting the Foreign Currency Translation
27,963.381
7,771.977

33
SIGNIFICANT ACCOUNTING POLICIES 1. CORPORATE INFORMATION
1.1 General
Ceylon Petroleum Corporation is a Public Corporation incorporated under Ceylon
Petroleum Corporation Act No.28 of 1961 and domiciled in Sri Lanka. The
registered office of the Corporation is located at No.109, Galle Road, Colombo
03.
1.2 Principal Activities and Nature of Operations
The principle activities of the Corporation are refining, selling& distributing and
exploring Petroleum products in Sri Lanka.
1.3 Parent Entity and Ultimate Parent Entity
The Corporation is under the purview of the Ministry of Petroleum and
Petroleum Resources Development. In the opinion of the directors, the
Corporation’s ultimate parent undertaking and controlling party is the
Government of Sri Lanka.
1.4 Date of Authorization for Issue
The Financial Statements of Ceylon Petroleum Corporation for the year ended 31
December 2009was authorized for issue in accordance with a resolution of the
board of directors on 24 February 2010.

34
2. BASIS OF PREPARATION
The Financial Statements are prepared under the historical cost basis (except
revaluation) in accordance with generally accepted accounting principles of the
Accounting Standards laid down by the Institute of Chartered Accountants of Sri
Lanka and the provisions of the Finance Act No:38of 1971 and subsequent
amendments .
The Financial Statements are presented in Sri Lankan Rupees and all values are
rounded to the nearest Million except when otherwise indicated.
2.1 Statement of Compliance
The Financial Statements of Ceylon Petroleum Corporation has been prepared in
accordance with Sri Lanka Accounting Standards (SLAS).
2.1.1 Going Concern
The Directors have made an assessment of the Corporation’s ability to
continue as a going concern and they do not intend either to liquidate or to
cease trading.
2.1.2 Comparative Information
The accounting polices have been consistently applied by the Corporation
and except for the changes in accounting policy (polices) discussed more
fully in Note 25 consistent with these used in the previous year. The
changes made to comparative figures are discussed more fully in Note 21.
2.2 SIGNIFICANT ACCOUNTING JUDGMENTS, ESTIMATES AND ASSUMPTIONS
2.2.1 Judgments
In the process of applying the Corporation’s accounting policies,
management has made the following judgments, apart from those
involving estimations, which has the most significant effect on the
amounts recognized in the Financial Statements.

35
2.1.2 Deferred Tax Assets
Deferred tax assets are recognized for all unused tax losses to the extent
that it is probable that taxable profit will be available against which the
losses can be utilized. Significant management judgment is required to
determine the amount of deferred tax assets that can be recognized,
based upon the likely timing and level of future taxable profits together
with future tax planning strategies.
2.3 SUMMARY OF SIGNIFICANT ACCOUNTING POLICIES
2.3.1 Foreign Currency Transactions
The Financial Statements are presented in Sri Lanka Rupees, which is the
Corporation’s functional and presentation currency. Transactions in
foreign currencies are initially recorded at the functional currency rate
ruling at the date of the transaction. Monetary assets and liabilities
denominated in foreign currencies are retranslated at the functional
currency rate of exchange ruling at the balance sheet date. All differences
are taken to profit or loss. Non monetary items that are measured in
terms of historical cost in a foreign currency are translated using the
exchange rates as at the dates of the initial transactions. Non monetary
items measured at fair value in a foreign currency are translated using the
exchange rates at the date when the fair value was determined.
2.3.2 Taxation
(a) Current Tax
Current income tax assets and liabilities for the current and prior
periods are measured at the amount expected to be recovered from
or paid to the taxation authorities. The tax rates and tax laws used to
compute the amount are those that are enacted or substantively
enacted by the balance sheet date.

36
The provision for income tax is based on the elements of income and
expenditure as reported in the Financial Statements and computed in
accordance with the provisions of the relevant tax legislations.
(b) Deferred Taxation
Deferred income tax is provided, using the liability method, on
temporary differences at the balance sheet date between the tax
bases of assets and liabilities and their carrying amounts for financial
reporting purposes.
Deferred income tax liabilities are recognized for all taxable
temporary differences except where the deferred income tax liability
arises from the initial recognition of an asset or liability in a
transaction that is not a business combination and, at the time of the
transaction, affects neither the accounting profit or taxable profit or
loss.
Deferred income tax assets are recognized for all deductible
temporary differences, carry-forward of unused tax assets and unused
tax losses, to the extent that it is probable that taxable profit will be
available against which the deductible temporary differences, and the
carry-forward of unused tax assets and unused tax losses can be
utilized except where the deferred income tax asset relating to the
deductible temporary difference arises from the initial recognition of
an asset or liability in a transaction that is not a business combination
and, at the time of the transaction, affects neither the accounting
profit nor taxable profit or loss and the carrying amount of deferred
income tax assets is reviewed at each balance sheet date and reduced
to the extent that it is no longer probable that sufficient taxable profit
will be available to allow all or part of the deferred income tax asset
to be utilized.

37
Deferred income tax assets and liabilities are measured at the tax
rates that are expected to apply to the year when the asset is realized
or the liability is settled, based on tax rates (and tax laws) that have
been enacted or substantively enacted at the balance sheet date.
Deferred income tax relating to items recognized directly in equity is
recognized in equity and not in the income statement.
(c) Sales Tax
Revenues, expenses and assets are recognized net of the amount of
sales tax except where the sales tax incurred on a purchase of assets
or service is not recoverable from the taxation authorities in which
case the sales tax is recognized as a part of the cost of the asset or
part of the expense items as applicable and receivable and payable
that are stated with the amount of sales tax included. The amount of
sales tax recoverable and payable in respect of taxation authorities is
included as a part of receivables and payables in the Balance Sheet.
2.3.3 Borrowing Costs
Borrowing costs are recognized as an expense in the period in which they
are incurred.
2.3.4 Inventories
Inventories are valued at the lower of cost and net realizable value, after
making due allowances for obsolete and slow moving items. Net
realizable value is the price at which inventories can be sold in the
ordinary course of business less the estimated cost of completion and the
estimated cost necessary to make the sale.

38
The cost incurred in bringing inventories to its present location and
conditions are accounted using the following cost formulae:-
Raw Materials -At purchase cost on first-in first-out basis
Finished Goods a)Refined Products b) Imports
- At the cost of direct materials, direct labour and an
appropriate proportion of manufacturing overheads based on normal operating capacity, but excluding borrowing Costs.
- At purchase cost on first-in first–out basis.
Work-in-progress a)Refined Products b) Imports
-At the cost of direct materials, direct labour and an appropriate proportion of manufacturing overheads based on normal operating capacity, but excluding borrowing Costs. - At purchase cost on first-In first –out basis
Other Finished Goods -At purchase cost on weighted average basis
Consumables & Spares -At purchase cost on weighted average basis
Good in Transit -At Purchase
(By Location)
Net realizable Value is the estimated selling price in the ordinary course
of business, less estimated cost of completion and estimated costs
necessary to make the sale.
2.3.5 Trade and Other Receivables
Trade receivables are stated at the amounts they are estimated to realize
net of allowances for bad and doubtful receivables. In certain cases
specific provisions are provided on specific Trade Receivable other than
the normal provision made for Trade Receivables.
Other receivables and dues from Related Parties are recognized at cost
less allowances for bad and doubtful receivables.
2.3.6 Cash and Cash Equivalents
Cash and cash equivalents are cash in hand, demand deposits and short-
term highly liquid investments, readily convertible to known amounts of
cash and subject to insignificant risk of changes in value.

39
For the purpose of cash flow statement, cash and cash equivalents
consist of cash in hand and deposits in banks net of outstanding bank
overdrafts. Investments with short maturities i.e. three months or less
from the date of acquisition are also treated as cash equivalents.
2.3.7 Property, Plant and Equipment
Plant and equipment is stated at cost, excluding the costs of day to day
servicing, less accumulated depreciation and accumulated impairment in
value. Such cost includes the cost of replacing part of the plant and
equipment when that cost is incurred, if the recognition criteria are met.
Land and buildings are measured at cost less depreciation on buildings.
When each major inspection is performed, its cost is recognized in the
carrying amount of the plant and equipment as a replacement if the
recognition criteria are satisfied.
An item of property, plant and equipment is de recognized upon disposal
or when no future economic benefits are expected from its use or
disposal. Any gain or loss arising on derecognition of the asset (calculated
as the difference between the net disposal proceeds and the carrying
amount of the asset) is included in the income statement in the year the
asset is de recognized.
The asset's residual values, useful lives and methods of depreciation are
reviewed, and adjusted if appropriate, at each financial year end.
Depreciation rates are indicated in Note 6.5 as noted to the Financial
Statement.

40
2.3.8 Investments
a) Initial Recognition:
Cost of investment includes purchase cost and acquisition charges
such as brokerages, fees, duties and bank regulatory fees. The
Corporation distinguishes and presents current and non current
investment in the balance sheet.
b) Measurement
(i) Current Investment:
Current investments are carried at the lower of cost and market
value, determined on the basis of aggregate portfolio.
(ii) Long Term Investments
Long term investments are stated at cost. Carrying amounts are
reduced to recognize a decline other than temporary, determined
for each investment individually. These reductions for other than
temporary declines in carrying amounts are charged to income
statement.
(iii) Investments in Associate Companies
Investments in Associate Companies are stated at Cost.
(iv) Disposal of Investment
On disposal of an investment, the difference between net
disposals and proceed and the carrying amounts is recognized as
income or expense.

41
2.3.9 Provisions
Provisions are recognized when the Corporation has a present obligation
(legal or constructive) as a result of a past event, where it is probable that
an outflow of resources embodying economic benefits will be required to
settle the obligation and a reliable estimate can be made of the amount
of the obligation. When the company expects some or all of a provision to
be reimbursed, the reimbursement is recognized as a separate assets but
only when the reimbursement is virtually certain. The expense relating to
any provision is presented in the income statement net of any
reimbursement. If the effect of the time value of money is material,
provisions are determined by discounting the expected future cash flows
at a pre-tax rate that reflects current market assessments of the time
value of money and, where appropriate, the risks specific to the liability.
Where discounting is used, the increase in the provision due to the
passage of time is recognized as an interest expense.
2.3.10 Retirement Benefit Obligations
(a) Defined Benefit Plan – Gratuity
Gratuity is a Defined Benefit Plan. The Corporation is liable to pay
gratuity in terms of the relevant statute. In order to meet this
liability, a provision is carried forward in the balance sheet,
equivalent to an amount calculated based on a half month’s salary
of the last month of the financial year of all employees for each
completed year of service, commencing from the first year of
service. The resulting difference between brought forward provision
at the beginning of a year net of any payments made, and the
carried forward provision at the end of a year is dealt with in the
income statement.
The gratuity liability is not funded nor actuarially valued

42
(b) Defined Contribution Plans – Employees’ Provident Fund & Employees’ Trust Fund
Employees are eligible for Employees’ Provident Fund Contributions
and Employees’ Trust Fund Contributions in line with the respective
statutes and regulations. The Corporation contributes 15 % and 3%
of gross emoluments of employees to Employees’ Provident Fund
and Employees’ Trust Fund respectively.
2.3.11 Capital Reserve
Specific amounts received from Government Consolidated Fund and the
net value of restructuring sale proceeds which will eventually form the
issued capital of the successor to Ceylon Petroleum Corporation are
credited to a Capital Reserve.
2.3.12 Insurance Reserve
An amount equivalent to the actual cost of insurance on imports which
are not insured with a third party while in transit is credited to
insurance reserve.
2.3.13 Revenue Recognition
Revenue is recognized to the extent that it is probable that the
economic benefits will flow the corporation and the revenue and
associated costs incurred or to be incurred can be reliably measured.
Revenue is measured at the fair value of consideration received or
receivable net of trade discounts and sales taxes. The following specific
criteria are used for the purpose of recognition of revenue.
a) Sale of Goods
Revenue from the sale of goods is recognized when the significant
risks and rewards of ownership of the goods have passed to the
buyer, usually on dispatch of the goods.

43
b) Interest
Revenue is recognized on a time proportion basis that takes in to
accounts the effective interest rate on asset.
c) Dividends
Dividend Income is recognized when the shareholders’ right to
receive the payment is established.
d) Hedging proceeds
Hedging gain or loss in relation to hedging of Petroleum products
has been presented on the Income Statement as a separate line
item.
e) Rental income
Rental income is accounted for on a straight-line basis over the
lease terms.
f) Others
Other income is recognized on an accrual basis
2.3.14 Segment Information
The activities of the segments are described in the segmental review of
operation. Segments have been determined based on primary format.
Primary format represents the business segments, identified based on
the products which have similar risk and return faced by the customers.
Since the Corporation’s activities are geographically within Sri Lanka
Secondary segment format is not available.

44
NOTES TO THE FINANCIAL STATEMENTS CEYLON PETROLEUM CORPORATION
NOTES TO THE FINANCIAL STATEMENTS
1. REVENUE
2009 2008
DOMESTIC SALES QTY. Value QTY. Value
M.Ltrs Rs. Mn. M.Ltrs Rs. Mn.
90 Octane Petrol 524.698 57,418.763 477.548 62,778.103
95 Octane Petrol 21.403 2,636.372 26.618 3,655.623
Auto Diesel 1,687.045 119,046.261 1,620.849 151,070.451
Super Diesel 10.104 866.145 8.495 885.249
Kerosene 191.810 9,754.538 192.596 14,000.051
Furnace Oil 1,021.448 27,416.214 1,048.919 62,666.528
Furnace Oil Low Sulper 134.191 5,740.935 42.589 3,553.623
Naphtha 160.516 8,093.232 206.406 15,255.831
Avn. Gasoline 0.237 66.103 0.231 62.761
Avn. Turbine Fuel 176.457 9,749.853 239.296 21,755.668
Asphalt 92.941 8,049.974 105.886 9,412.025
Lub Oil 1.727 457.944 - -
Agro Chemicals 0.407 178.506 0.548 291.411
Solvent 1.353 135.188 3.637 435.322
L.P.G. 24.514 1,484.922 15.911 1,305.381
Total Domestic sales 4,048.850 251,094.950 3,926.844 345,095.913
EXPORTS
a) Indirect Exports
Avn.Turbine Fuel 113.280 6,298.091 122.656 11,262.986
Bunkering 6.310 115.153 25.097
1,643.217
119.590 6,413.243 147.753 12,906.203
Total Sales 257,508.193 358,002.116
Less : T.T, Ex Duty (19,845.574) (16,331.787)
237,662.619 341,670.329

45
Segment Information & Revenue
The following table presents revenue, cost of sales and gross profit of the corporation classified based on the class of the customers served.
2009 2008
Class of the Customers Sales Value Cost of sales Gross Profit Sales Value Cost of sales Gross Profit
Rs. Mn. Rs. Mn. Rs. Mn. Rs. Mn. Rs. Mn. Rs. Mn.
a) Transport
160,121.967
142,441.754
17,680.213
180,710.894
169,338.450 11,372.447
160,121.967
142,441.754
17,680.213 180,710.894 169,338.450 11,372.447
b) Power Generation
41,250.381
56,740.143
(15,489.762) 97,501.490
97,133.650 367.840
41,250.381
56,740.143
(15,489.762) 97,501.490
97,133.650 367.840
c) Aviation
16,114.048
15,312.762
801.286
31,629.713
34,948.506 (3,318.793)
16,114.048
15,312.762
801.286 31,629.713 34,948.506 (3,318.793)
d) Others
20,176.224
19,046.261
1,129.963 31,828.23 37,093.12 (5,264.884)
20,176.224
19,046.261
1,129.963 31,828.23 37,093.12 (5,264.884)
-
Gross Profit As Per Income statement
237,662.620
233,540.920
4,121.700 341,670.328 338,513.721 3,156.610
46
CEYLON PETROLEUM CORPORATION
NOTES TO THE FINANCIAL STATEMENTS Year ended 31 December 2009
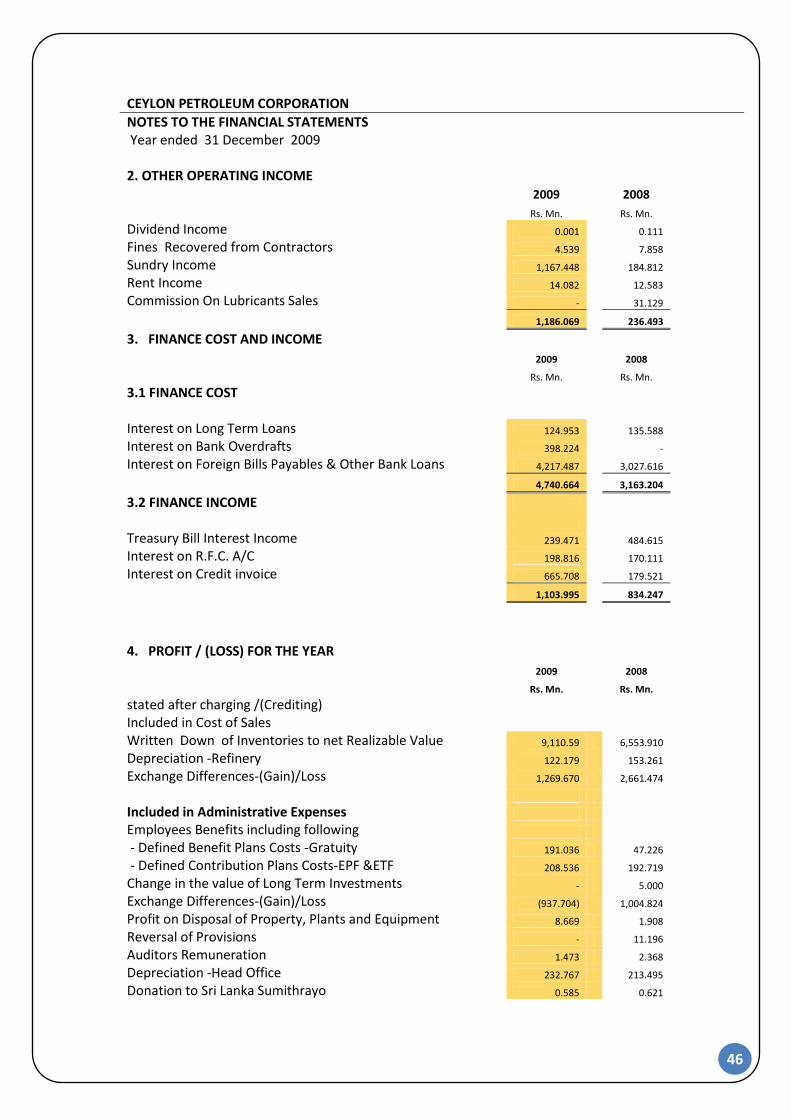
2. OTHER OPERATING INCOME
2009 2008
Rs. Mn. Rs. Mn.
Dividend Income 0.001 0.111
Fines Recovered from Contractors 4.539 7.858
Sundry Income 1,167.448 184.812
Rent Income 14.082 12.583
Commission On Lubricants Sales - 31.129
1,186.069 236.493
3. FINANCE COST AND INCOME
2009 2008
Rs. Mn. Rs. Mn.
3.1 FINANCE COST
Interest on Long Term Loans 124.953 135.588
Interest on Bank Overdrafts 398.224 -
Interest on Foreign Bills Payables & Other Bank Loans 4,217.487 3,027.616
4,740.664 3,163.204
3.2 FINANCE INCOME
Treasury Bill Interest Income 239.471 484.615
Interest on R.F.C. A/C 198.816 170.111
Interest on Credit invoice 665.708 179.521
1,103.995 834.247
4. PROFIT / (LOSS) FOR THE YEAR
2009 2008
Rs. Mn. Rs. Mn.
stated after charging /(Crediting)
Included in Cost of Sales
Written Down of Inventories to net Realizable Value 9,110.59 6,553.910
Depreciation -Refinery 122.179 153.261
Exchange Differences-(Gain)/Loss 1,269.670 2,661.474
Included in Administrative Expenses
Employees Benefits including following
- Defined Benefit Plans Costs -Gratuity 191.036 47.226
- Defined Contribution Plans Costs-EPF &ETF 208.536 192.719
Change in the value of Long Term Investments - 5.000
Exchange Differences-(Gain)/Loss (937.704) 1,004.824
Profit on Disposal of Property, Plants and Equipment 8.669 1.908
Reversal of Provisions - 11.196
Auditors Remuneration 1.473 2.368
Depreciation -Head Office 232.767 213.495
Donation to Sri Lanka Sumithrayo 0.585 0.621
47
CEYLON PETROLEUM CORPORATION
NOTES TO THE FINANCIAL STATEMENTS Year ended 31
stDecember 2009
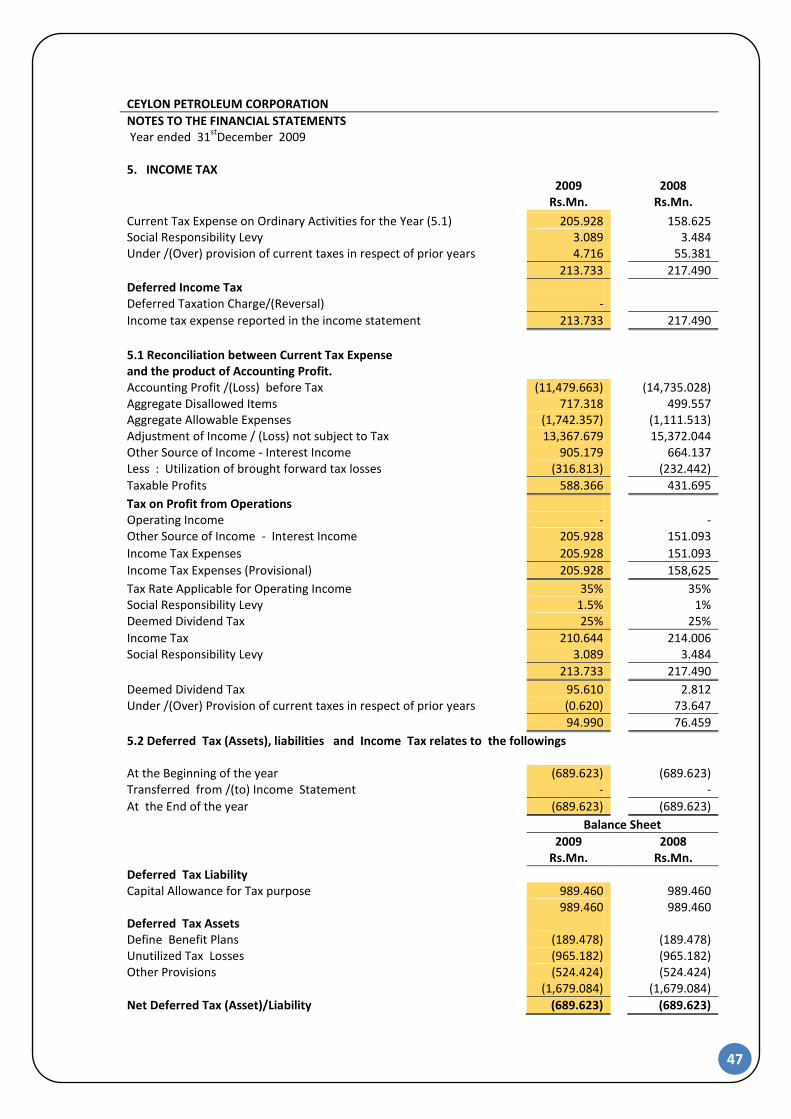
5. INCOME TAX 2009 2008
Rs.Mn. Rs.Mn.
Current Tax Expense on Ordinary Activities for the Year (5.1) 205.928 158.625 Social Responsibility Levy 3.089 3.484 Under /(Over) provision of current taxes in respect of prior years 4.716 55.381
213.733 217.490
Deferred Income Tax Deferred Taxation Charge/(Reversal) -
Income tax expense reported in the income statement 213.733 217.490
5.1 Reconciliation between Current Tax Expense and the product of Accounting Profit. Accounting Profit /(Loss) before Tax (11,479.663) (14,735.028) Aggregate Disallowed Items 717.318 499.557 Aggregate Allowable Expenses (1,742.357) (1,111.513) Adjustment of Income / (Loss) not subject to Tax 13,367.679 15,372.044 Other Source of Income - Interest Income 905.179 664.137 Less : Utilization of brought forward tax losses (316.813) (232.442)
Taxable Profits 588.366 431.695
Tax on Profit from Operations Operating Income - - Other Source of Income - Interest Income 205.928 151.093
Income Tax Expenses 205.928 151.093
Income Tax Expenses (Provisional) 205.928 158,625
Tax Rate Applicable for Operating Income 35% 35% Social Responsibility Levy 1.5% 1% Deemed Dividend Tax 25% 25%
Income Tax 210.644 214.006 Social Responsibility Levy 3.089 3.484
213.733 217.490
Deemed Dividend Tax 95.610 2.812 Under /(Over) Provision of current taxes in respect of prior years (0.620) 73.647
94.990 76.459
5.2 Deferred Tax (Assets), liabilities and Income Tax relates to the followings At the Beginning of the year (689.623) (689.623) Transferred from /(to) Income Statement - -
At the End of the year (689.623) (689.623)
Balance Sheet
2009 2008 Rs.Mn. Rs.Mn.
Deferred Tax Liability Capital Allowance for Tax purpose 989.460 989.460 989.460 989.460 Deferred Tax Assets Define Benefit Plans (189.478) (189.478) Unutilized Tax Losses (965.182) (965.182) Other Provisions (524.424) (524.424) (1,679.084) (1,679.084)
Net Deferred Tax (Asset)/Liability (689.623) (689.623)

48
CEYLON PETROLEUM CORPORATION
NOTES TO THE FINANCIAL STATEMENTS
Year ended 31st December 2009
6. PROPERTY, PLANT & EQUIPMENT
6.1 Gross carrying Amounts 2009
Cost
Land & Buildings
Vested Property
Plant, Mach & Equip
SPM Facility
Motor Vehicles
Furn/ Fittings Off. Equip & Other Assets
Total
Rs.Mn. Rs.Mn. Rs.Mn. Rs.Mn. Rs.Mn. Rs.Mn. Rs.Mn.
Bal as at 01/01/2009 1,354.047 1.016 3,702.750 2,142.422 372.897 1,434.360 9,007.492
Additions 104.388 - 119.967 - 10.544 35.743 270.642
Disposals - - (74.974) - (3.192) (5.719) (83.885)
Adjustment 10.169 - - - 8.879 19.048
Bal as at 31/12/2009 1,468.604 1.016 3,747.743 2,142.422 380.249 1,473.263 9,213.297
6.2 Depreciation
Bal as at 01/01/2009 162.676 0.338 2,050.686 1,259.415 192.801 937.267 4,603.183
Charge for the Year 18.612 0.010 164.079 31.219 14.254 127.291 355.465
Disposals - - (0.774) - (3.192) (3.966)
Adjustments - - - - - - -
Bal as at 31/12/2009 181.288 0.348 2,213.991 1,290.634 203.863 1,064.558 4,954.682
Net Book Value as at 31.12.2009 1,287.316 0.668 1,533.752 851.788 176.386 408.705 4,258.615
2008
Cost as at 31.12.2008 1,354.047 1.016 3,702.750 2,142.422 372.897 1,434.360 9,007.492
Acc.Dep as at 31.12.2008 162.676 0.338 2,050.686 1,259.415 192.801 937.267 4,603.183
Net Book Value l as at 31.12.2009 1,191.371 0.678 1,652.064 883.007 180.096 497.093 4,404.309
6.3 Assets and Capital Project in Progress 2009 2008
Rs.Mn. Rs.Mn.
Buildings 651.568 144.447
Plant & Machinery 7.099 8.043
Storage Facility 9.522 14.929
Re-structuring of Filling Stations 114.335 49.807
Others - 2.531
782.524 219.757
6.4 Net Book Values 2009 2008
Rs.Mn. Rs.Mn.
Property Plant & Equipment 4,258.615 4,404.309
Assets & Capital Projects in Progress 782.524 219.757
Total Carrying Amount of Property , Plant &Equipments 5,041.139 4,624.066

49
6.5 The useful lives of the assets is estimated as follows 2009 2008
Freehold Land Nil Nil
Buildings 40 Years 40 Years
Refinery Tanks & Pipelines 40 Years 40 Years
Refinery Plant & Machinery 10 Years 10 Years
Other Location Tanks 40 or 20 Years 40 or 20 Years
Other Locations Pipelines 10 or 5 Years 10 or 5 Years
Plant & Machinery 10 or 5 Years 10 or 5 Years
Browsers & Tank Lorries 5Years 5Years
Vans & Coaches 4Years 4Years
Furniture/Fittings & Office Equipments up to 31.12.1998 Fully Fully
Furniture/Fittings & Office Equipments up to 31.12.1999 3 Years 3 Years
SPM Facility - Tank Farm 40 Years 40 Years
- Pipelines 20Years 20Years
- Buoy 10 years 10 years

50
CEYLON PETROLEUM CORPORATION
NOTES TO THE FINANCIAL STATEMENTS Year ended 31st December 2009 7. INVESTMENTS
2009 2008
Rs .Mn. Rs .Mn. Rs .Mn. Rs .Mn.
At Cost
Director's Value
At Cost Director's
Value
7.1 Non-Current
a) Investment in Associated Company (Unquoted)
Ceylon Petroleum Storage Terminals Ltd.* 2,500.000 2,500.000 2,500.000 2,500.000
2,500.000 2,500.000 2,500.000 2,500.000
2009 2008
Rs .Mn. Rs .Mn. Rs .Mn. Rs .Mn.
At Cost Market Value At Cost
Market Value
b) Other Investments (Quoted)
Lanka Cement Ltd. 50.500 50.500 31.250
5,000,000 Ordinary Shares of Rs.10/= each fully paid.
Less:
Allowance for decline in value (19.250) - (19.250) -
31.250 0.000 31.250 31.250
Unquoted
2009 2008
Rs .Mn. Rs .Mn. Rs .Mn. Rs .Mn.
At Cost Director's At Cost Director's
Value Value
Associated News Papers of Ceylon Ltd.
61,206 Ordinary Shares of Rs.10/= each fully paid. 0.539 0.539 0.539 0.539
Lanka Leyland Ltd.
100 Ordinary Shares of 10/= each fully paid. 0.001 0.001 0.001 0.001
International Coop/Petroleum association
5,499 Shares of Us $ 100/= each fully paid Incorporated in USA 5.086 5.086 5.086 5.086
5.626 5.626 5.626 5.626
7.2 Current
Investments in Fixed Deposit 5.000 5.000
5.000 5.000
Total 41.876 41.876
* The effect of adopting the equity method could not be given due to the unavailability of Financial Statements of Ceylon Petroleum Storage Terminals Limited (CPSTL)

51
CEYLON PETROLEUM CORPORATION
NOTES TO THE FINANCIAL STATEMENTS
Year ended 31 December -2009
8 . TRADE & OTHER RECEIVABLE 2009 2008
Rs. Mn. Rs. Mn. Rs. Mn. Rs. Mn.
With in After With in After
one Year one Year one Year one Year
Trade Receivables 73,755.007 - 64,228.814 -
Other Receivables 2,327.730 3,171.653 1,564.897 3,758.950
Deposits 8.917 29.928 10.317 30.031
Advance 491.872 - 395.106 -
Prepayments 299.792 - 407.167 -
Loans & Advance to Employee 349.198 1,000.100 356.068 999.352
77,232.516 4,201.681 66,962.369 4,788.333
9. INVENTORIES 2009 2008
Rs.Mn. Rs.Mn.
Crude Oil 6,783.893 6,565.150
Other Raw material 519.310 540.994
Finished Products 15,234.771 23,422.707
Other Materials & Supplies 3,314.969 1,266.287
Less: Provision for Non Moving Items (284.665) (257.643)
25,568.278 31,537.495
10. CASH AND CASH EQUIVALENTS 2009 2008
Rs.Mn. Rs.Mn.
Components of Cash and Cash Equivalents
Cash & Bank Balances 23,812.640 8,194.432
Treasury Bills 7,950.000 1,050.000
31,762.640 9,244.432
11. CONTRIBUTED CAPITAL 2009 2008
Rs.Mn. Rs.Mn.
Initial Contribution in Pursuance of Section23 of Act No 28 of 1961 10.000 10.000
Voted by Appropriation Act no 23 of 1964 4.000 4.000
Voted by Appropriation Act no 15 of 1967 20.000 20.000
Contribution to Capital in 1976 60.000 60.000
Contribution to Capital in 1979 13.110 13.110
Contribution to Capital in 1980 10.710 10.710
Total Contributed by Govt. of Sri Lanka 117.820 117.820
Transferred from General Reserve in 1987 750.000 750.000
Transferred from Retained Profits in 1987 132.180 132.180
1,000.000 1,000.000
(No authorized capital has been fixed by the Parliament.)

52
CEYLON PETROLEUM CORPORATION
NOTES TO THE FINANCIAL STATEMENTS Year ended 31 December 2009
12. CAPITAL RESERVE 2009 2008
Rs.Mn. Rs.Mn. Balance as at 01
st January 4,992.69 4,992.69
Balance as at 31st
December 4,992.69 4,992.69
* In 2003, the transfer of assets to CPSTL had been done at book values. Subsequently it had been decided to record the above transaction based on the values that had been agreed upon in the process of privatization. The effect of the above transaction had been adjusted under net re-structuring sales proceeds.
13. REVALUATION RESERVE 2009 2008
Rs.Mn. Rs.Mn. Balance as at 01
st January 25.70 25.70
Balance as at 31st
December 25.70 25.70
14. INSURANCE RESERVE 2009 2008 Rs.Mn. Rs.Mn.
Balance as at 01st
January 567.81 523.08
Charged to Profit & Loss Account 42.38 44.74
Balance as at 31st December 610.20 567.81
15. RETIREMENT BENEFIT OBLIGATION 2009 2008
Rs.Mn. Rs.Mn. Balance as at 01
st January 551.69 526.51
Less: Payments made during the year 22.41 22.05 529.27 504.46 Add: Charge for the year 191.04 47.23
720.31 551.69 Add: Benefit China Bay Employees 14.86 14.86
Balance as at 31st
December 735.17 566.54
16. INTEREST BEARING LOANS & BORROWINGS 2009 2008 16.1 L.T. Loans not assigned to CPSTL Rs.Mn. Rs.Mn.
Treasury (A.D.B) Loan - (Interest 14.0% p.a.) repayable in forty 1/2 797.57 873.53 Yearly installments of Rs.37.977 Mil each commencing July ' 01. Indian Line of Credit (Interest LIBOR+0.5 p.a.) repayable in twelve 3,837.83 6,319.82 half yearly installments of Rs.1228.030 Mil each commencing May ' 06 16.2 L.T. Loans assigned to CPSTL Treasury (Exim Bank) Loan - (Interest 12 .0 p.a %) repayment commencing 3,142.75 3,714.16 Oct. 2004 in 24 equal 1/2 yearly installments of final Loan value
16.3 B.O.C Long Term Long -
25,000.0
0 0.00
32778.16 10907.51
Compensation Payable to Former Owners of properties vested in CPC 0.90 0.90
32779.06 10908.41
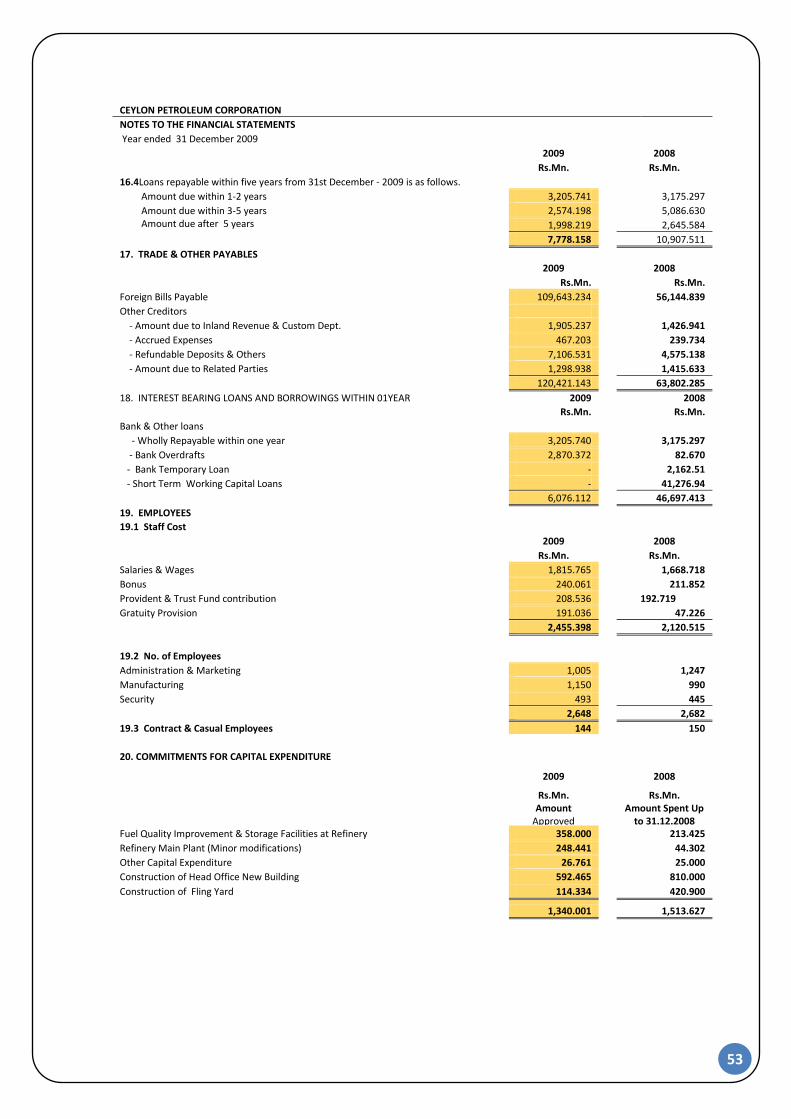
53
CEYLON PETROLEUM CORPORATION
NOTES TO THE FINANCIAL STATEMENTS
Year ended 31 December 2009
2009 2008
Rs.Mn. Rs.Mn.
16.4Loans repayable within five years from 31st December - 2009 is as follows.
Amount due within 1-2 years 3,205.741 3,175.297
Amount due within 3-5 years 2,574.198 5,086.630 Amount due after 5 years
1,998.219 2,645.584
7,778.158 10,907.511
17. TRADE & OTHER PAYABLES
2009 2008
Rs.Mn. Rs.Mn.
Foreign Bills Payable 109,643.234 56,144.839
Other Creditors
- Amount due to Inland Revenue & Custom Dept. 1,905.237 1,426.941
- Accrued Expenses 467.203 239.734
- Refundable Deposits & Others 7,106.531 4,575.138
- Amount due to Related Parties 1,298.938 1,415.633
120,421.143 63,802.285
18. INTEREST BEARING LOANS AND BORROWINGS WITHIN 01YEAR 2009 2008
Rs.Mn. Rs.Mn.
Bank & Other loans
- Wholly Repayable within one year 3,205.740 3,175.297
- Bank Overdrafts 2,870.372 82.670
- Bank Temporary Loan - 2,162.51
- Short Term Working Capital Loans - 41,276.94
6,076.112 46,697.413
19. EMPLOYEES
19.1 Staff Cost
2009 2008
Rs.Mn. Rs.Mn.
Salaries & Wages 1,815.765 1,668.718
Bonus 240.061 211.852
Provident & Trust Fund contribution 208.536 192.719
Gratuity Provision 191.036 47.226
2,455.398 2,120.515
19.2 No. of Employees
Administration & Marketing 1,005 1,247
Manufacturing 1,150 990
Security 493 445
2,648 2,682
19.3 Contract & Casual Employees 144 150
20. COMMITMENTS FOR CAPITAL EXPENDITURE
2009 2008
Rs.Mn. Rs.Mn.
Amount
Approved Amount Spent Up
to 31.12.2008 Fuel Quality Improvement & Storage Facilities at Refinery 358.000 213.425
Refinery Main Plant (Minor modifications) 248.441 44.302
Other Capital Expenditure 26.761 25.000
Construction of Head Office New Building 592.465 810.000
Construction of Fling Yard 114.334 420.900
1,340.001 1,513.627

54
Year ended 31 December 2009
21 COMPARATIVE INFORMATION
As reported previously 2008
Rs.Mn
a) Cost of Sales (Proceedings from Hedging) (1,321.572)
b) Trade and Other Payables 5,420.477
c) Current Portion of Interest Bearing Loans & Borrowings105,079.221
Current Presentation 2009 2008
Rs.Mn Rs.Mn
a) Gain /(Loss) on Derivative Financial Instruments - (1,321.572)
b) Current Portion of Interest Bearing Loans & Borrowings 6,076.113 46,697.413
c) Trade and Other Payables 120,421.143 63,802.285
Reasons for change in then presentation and classification:
a)
CEYLON PETROLEUM CORPORATION
NOTES TO THE FINANCIAL STATEMENTS
The presentation and classification of following items in theses Financial Statements are
amended to ensure comparability with the current year.
Short Term Working Capital Loans which have been included under trade and other
payables as short term working capital loans and presented in a separate line item
for better presentation.

55
Company RelationshipNature of Transaction
Amount
Paid/
(Received)
2009 2008
Rupees Mil Rupees Mil
Ceylon Petroleum Storage
Terminals Limited (CPSTL)
Associat
e
Company - Storage ,Terminal and dis tribution charges 7,636 6,954
- Recovery of Repayments of the fol lowing bank loans
NDB -Recovered repayments 0.000 24,157
The Interest rate i s 16% p.a and CPSTL repays 12% p.a
of this rate and the excess interest i s born by Ceylon
Petroleum Corporation
The excess interest charge absorbed by Ceylon
Petroleum Corporation 0.000 0.119
Exim Bank- Recovered Repayments 1,068.535 1,137.104
Interest Rate i s 12 p.a % and the ful l repayments are
recovered from CPSTL
2009 2008
Rupees Mil Rupees Mil
Chairman's Remuneration 1.395 1.339
Directors Remuneration 0.157 0.051
21.2 Other Transactions made with key Management Personnel.
CEYLON PETROLEUM CORPORATION
NOTES TO THE FINANCIAL STATEMENT
22. TRANSACTIONS WITH RELATED PARTIES
Mr.W.K.B. Weragama - Di rector of CPC, Mr Chethiya Ekanayake Director of CPC perfomed as di rectors at CPSTL
throughtout the year.
22.1 Transactions made with Related Parties

56
The Chairman Ceylon Petroleum Corporation Report of the Auditor General on the Financial Statements of the Ceylon Petroleum
Corporation for the year ended 31 December 2009 in terms of Section 14(2)(c) of the
Finance Act, No. 38 of 1971
1. The audit of financial statements of the Ceylon Petroleum Corporation (CPC) for the
year ended 31 December 2009 was carried out under my direction in pursuance of
provisions in Article 154(1) of the Constitution of the Democratic Socialist Republic of
Sri Lanka read in conjunction with Section 13(1) of the Finance Act No 38 of 1971. In
carrying out this audit, I was assisted by a firm of Chartered Accountants in public
practice. My comments and observations which I consider should be published with the
annual report of the Corporation in terms of Section 14(2) (c) of the Finance Act, appear
in this report. A detailed report in terms of Section 13(7) (a) of the Finance Act was
issued to the Chairman of the Corporation on 23 June 2010.
1.1 Responsibility of the Management for the Financial Statements
Management is responsible for the preparation and fair presentation of these
financial statements in accordance with Sri Lanka Accounting Standards. This
responsibility includes; designing, implementing and maintaining internal
control relevant to the preparation and fair presentation of financial statements
that are free from material misstatements, whether due to fraud or error;
selecting and applying appropriate accounting policies; and making accounting
estimates that are reasonable in the circumstances.
fzf;fha;thsHjiyikmjpgjpjpizf;fsk ;
AUDITOR GENERAL’S DEPARTMENT
vdJ ,y
My No LP/D/CPC/FA/09
ckJ ,y
Your No.
jpfjp
Date 29 September 2010
Date
Rje;jpurJf;fk;>
nfhOk;G 07> ,yq;if
INDEPENDENCE SQUARE,
COLOMBO 07, SRI LANKA
gf;]; ,y 2697451
Fax No. njhiyNgrp 2691151
Telephone.
<- nkapy; [email protected]
E-mail.

57
1.2 Scope of Audit and Basis for Opinion
My responsibility is to express an opinion on these financial statements based
on my audit. Audit opinion, comments and findings in this report are based on
review of the financial statements presented to audit and substantive tests of
samples of transactions. The scope and extent of such review and tests were
such as to enable as wide an audit coverage as possible within the limitations of
staff, other resources and time available to me. The audit was carried out in
accordance with Sri Lanka Auditing Standards to obtain reasonable assurance as
to whether the financial statements are free from material misstatements. The
audit includes the examination on a test basis of evidence supporting the
amounts and disclosures in financial statements and assessment of accounting
policies used and significant estimates made by the management in the
preparation of financial statements as well as evaluating their overall
presentation. I believe that my audit provides a reasonable basis for my
opinion. Sub – sections (3) and (4) of Section 13 of the Finance Act, No 38 of
1971 give discretionary powers to the Auditor General to determine the scope
and extent of the audit.
2. Financial Statements
2.1 Opinion
In view of my comments and observations appearing in this report, I am
unable to express an opinion on the financial statements of the Ceylon
Petroleum Corporation for the year ended 31 December 2009 presented
for audit.

58
2.2 Comments on Financial Statements
2.2.1 Sri Lanka Accounting Standards (SLAS) Following observations are made.
(a) The General Treasury had transferred 1/3 of the shares of
the Ceylon Petroleum Storage Terminal Ltd. (CPSTL) on 21
October 2009 to the Corporation with effect from 01
January.2009. As a result, the total shareholdings of the
Ceylon Petroleum Corporation increased to 2/3 of shares of
the CPSTL. The Corporation had not disclosed the transfer of
these shares in the financial statements and had not
prepared the consolidated financial statements, as required
by the SLAS -26 – Consolidated and Separate Financial
Statements.
(b) The Corporation had not revalued the assets to ensure that
the carrying amount do not differ materially from the
fair value which would be determined at the balance sheet
date, as stipulated in SLAS 18 – Property, Plant and
Equipment. Further, fully depreciated assets valued at Rs.
619.6 million which still continues to be used by the
Corporation without taking action to revalue the relevant
assets
(c) The risk and returns of the petroleum business with the
Corporation vary according to the class of customers.
Hence, segmental analysis as required by SLAS 28 –
Segment Reporting, should be disclosed based on the class
of customer for revenue, cost of sales and gross profit.
However, the segmental information had not been
properly disclosed in the financial statements, as required.

59
In this connection the Chairman informed me as follows
The objective of segmental reporting is to provide
information about different types of products and services
of an enterprise or different class of customers or different
geographical areas in which products are sold. This
segmental information assists users of financial statements
to:-
- understand the enterprise’s past performance
- assess the risk and rewards
- make more informed judgments about the enterprise as a
whole.
The CPC provides as per SLAS 28, the group of products
sold and class of customers that are subject to different
rates of profitability, opportunities for growth and risks.
This allows assessing the risk and return of CPC. SLAS 28
requires an enterprise to identify segments on the basis of
internal reporting system whenever applicable.
The materiality threshold for a segment is basically 10% of
total revenue, profit or assets. However, this is a very
subjective exercise. When considered refinery products
refining process common assets, liability and same inputs
material are shared in getting different refined products
so that, identification of separate assets, liabilities are not
practicable. Therefore, segmental information provided
by CPC is compliance with SLAS 28 considering the nature
of operations.

60
(d) The Corporation had not included certain taxes, which are
not recoverable from tax authorities in determining the
cost of purchase. Further, it was observed that the
advertising cost of Rs. 2.9 million had been included in the
manufacturing cost and this accounting treatment
violated the provisions in SLAS 05 – Inventories.
(e) The Corporation had not adopted appropriate procedures
to identify impairment indicators for its assets as required
by SLAS 41- Impairment of Assets. Due to this non
compliance, the carrying amount of the property, plant
and equipment amounting to Rs. 9,200 million had not
been compared with their recoverable amount.
2.2.2 Going Concern
The Corporation had sustained a loss of Rs. 11, 480 million (without tax
adjustment) for the year under review and had a negative equity position
of Rs. 13,716 million. Thus the ability of the Corporation to continue as a
going concern without the financial assistance from the Government of
Sri Lanka and other financial institutions is doubtful.
2.2.3 Accounting Deficiencies
The following accounting deficiencies were observed in audit.
(a) As per General Accounting Guidelines and Accounting
Standards, purchases are recorded when the risk and rewards
are transferred to the buyer, irrespective of the physical transfer
of goods. In the case of importation of goods, the recognition of
purchases is based on the date of Bill of Lading and the Pricing
Method. In the case of CPC, crude oil and refined products had
been insured by the CPC and all the risks and rewards relating to
purchases had been transferred when the goods are taken over
by the Captain of the vessel thus, it was the date of Bill of

61
Leading. However, it was observed that purchases of crude oil
amounting to Rs 8,700 million (CR/15/2009) the date of Bill of
Lading of which was 24 December 2009 had not been
considered as purchases during the year under review.
(b) It was observed that the rent income of the Corporation had
been understated by Rs. 1.8 million, due to the Corporation had
not recognized rent income as per rent agreement.
(c) Goods-in-transit (crude oil) amounting Rs. 8,700 million had not
been disclosed in the financial statements.
(d) The closing stock of fuel of Lanka Furnace Oil (LFO) 800 had been
overstated by Rs. 66.6 million due to an erroneous valuation. As a
result, purchases and creditors had been understated by a similar
amount.
2.2.4 Accounts Receivable and Payable
The following observations are made.
(a) The Corporation had not obtained Bank Guarantees from two
aviation contract customers, two private customers, four dealers and
four Government institutions whose outstanding balances amounted
to Rs. 20.4 million, Rs. 1, 544.9 million, Rs. 20.8 million and Rs. 3,
478.9 million respectively as at 31 December 2009. Further, it was
observed that the Corporation had provided credit facility
aggregating Rs. 626.6 million to dealers, private customers and
aviation customers exceeding their bank guarantees.

62
(b) The amount outstanding from the Ceylon Electricity Board (CEB) as
at 31 December 2009 amounted to Rs. 46,320 million. Eighty-eight
per cent of this amount was outstanding for a period of over one
year. Meanwhile, there was a dispute regarding a balance of Rs. 998
million due from the Ceylon Electricity Board.
2.2.5 Lack of Evidence for Audit
The following items in the financial statements could not be satisfactorily
vouched in audit due to the non-availability of required evidence as
indicated.
(a) The provision of Rs. 479 million made in the preceding years for
contractors’ payments, employees’ income tax, PAYE tax and other
payables relating to the Muthurajawela Project continued to be shown in
the financial statements every year. However, the details concerned had
not been furnished to audit. Further, this provision had not been
reviewed at the balance sheet date and adjusted to reflect the current
best estimate as required by SLAS 36 – Provisions, Contingent Liabilities
and Contingent Assets.
(b) No adequate documentary evidence were made available
regarding sundry items amounted to Rs. 487 million to determine
its accuracy and completeness
(c) The Corporation had failed to produce title deeds of the land
valued at Rs 67 million belonging to the Sapugaskanda Mini
Terminal.
(d) The existence and recoverability of investments aggregating
Rs. 55.5 million could not be determined due to lack of sufficient
evidence.

63
(e) Twenty five acres of land valued at Rs. 259 million at
Muthurajawela had been shown as an asset in the ledger.
However, there were no title deeds or documents to establish the
ownership of the land.
(f) No sufficient evidence were made available regarding the assets
purchased prior to 31 December 2002 reflected under property,
plant and equipment. As a result, the ownership, existence and
completeness of such assets could not be determined in audit.
(g) Confirmations had not been received in respect of a sum of Rs
8,096 million due from Government departments and agencies
included under trade and other receivables. As a result, the
completeness, existence and recoverability of such balances could
not be satisfactorily verified in audit.
(h) Sufficient evidence was not made available to determine the
recoverability of the Excise Duty amounting to Rs. 714 million
receivable from the General Treasury and included under Trade
and Other Receivables.

64
2.2.6 Non-compliance with Laws, Rules, Regulations and Management Decisions
The following instances of non-compliance were observed in audit.
Reference to Laws, Rules, Regulations and Management Decision
Non compliance
(a) Payment of Gratuity Act, No. 12 of 1983 (b) Value Added Tax Act, No. 14 of 2002 (c)Department of Public
Enterprises Circular No. PED/12 of 2 June 2003
(i) Paragraph 3.2
Gratuity had not been paid within 30 days from the termination of an employee as stipulated in the Act. Further, the Corporation had not paid surcharge for such delayed payments.
The Corporation computed output Value Added Tax on invoice basis and claimed the input Value Added Tax on cash basis without obtaining approval for cash basis. Further, it affects the working capital as the Corporation has to wait till the payment is made to claim the input Value Added Tax. The Board of Directors of the Corporation did not contain at least one member in the field of Petroleum, which is the main subject of the Corporation.
(ii) Paragraph 6.1
(iii) Paragraph 6.5
The draft annual report for the year under review had not been submitted to the Auditor General. The draft annual accounts should be rendered to the Auditor General within 60 days after the closure of the financial year. However, incomplete draft annual accounts had been submitted to the Auditor General on 17 March 2010.
(iv) Paragraph 8.3.5
Officers who were not entitled to assign motor vehicles had been assigned with motor vehicles on the approval of the Board of Directors or the Chairman, contrary to the Circular instructions. As such, 08 officers of the Corporation had been paid a sum of Rs 1.8 million as fuel and traveling allowances in 2009 alone. Fuel limits for such assigned motor vehicles had been decided either by the Board or by the Chairman.
In addition, the Chairman had granted approval to certain officers to claim reimbursement of the value of 100 – 120 litres of fuel per month for travel between their residences and office in their private motor vehicles.

65
(v) Paragraph 8.7
(d) Department of Public
Enterprises Circular No. 130 of 18 March 1998
The Corporation had paid PAYE tax from its own funds for the employees of the Corporation contrary to circular instructions. PAYE tax so paid by the Corporation, for the period 2000 to 2009 amounted to Rs. 777 million. In addition the Corporation had paid tax on tax for PAYE. Further PAYE tax had not been paid on bonus amounted to Rs. 147 million and Rs.148 million paid in 2008 and 2009 respectively.
Rate of interest on staff loans had been reduced from 7.2 per cent to 4.2 per cent without the authority of the General Treasury. The amount under recovered for the year under review due to this change amounted to Rs. 32 million. In this connection the Chairman informed me as follows. Reduction of the loan interest is in par with the public sector employees was implemented after consultation with the Hon. Minister by the Board of Directors during the year 1999.
(e) Letter dated 19 February 1990 issued by the Ministry of Policy Developmentand Implementation
Services of private lawyers had been obtained at a higher rate without obtaining prior approval of the Attorney General. The amount so paid to private lawyers during the year under review amounted to Rs.5 million.
2.2.7 Transactions not Supported by Adequate Authority
According to the Department of Public Enterprises Circular No PED/12 of 2 June
2003, the payment of bonus approved by the Board of Directors should be made
from the profit generated by the Corporation. However, the Corporation had
paid bonus amounting to Rs. 147 million and Rs. 148 million without generating
profit in the years 2008 and 2009 respectively.

66
3. Financial and Operating Review
3.1 Financial Review
3.1.1 Financial Results
According to the financial statements presented, the working of the
Corporation for the year under review had resulted in a pre-tax net loss of
Rs 11,480 million as compared with the pre-tax net loss of Rs. 14,735
million in the preceding year, thus indicating an improvement of Rs. 3,255
million in the financial results.
3.1.2 Analytical Review of the Financial Results and Financial Position
The following observations are made.
(a) The liquidity ratio at the end of the year under review indicated
1.06 times as compared with 0.98 times of the preceding year
showing a slight upward move while the acid test ratio had
deteriorated from 0.86 times to 0.69 times at the end of the year
under review.
(b) The following analysis depicted the poor performance in the
management of working capital for the year under review.
(i) The debtors’ turnover ratio indicated 3.9 times as compared with 6.75 times of the preceding year and the debt collection period had increased to 119 days as compared with 83 days of the preceding year.
(ii) The stock residence period had been 45 days as against 39
days of the previous year thus showing an increase of 06days.
(iii) The creditors’ turnover ratio indicated 2.52 times as
compared with 7.52 times of the preceding year and the credit payment period had increased to 144 days as compared with 49 days of the preceding year.
(iv) The operating cycle had been 20 days as against 44 days of
the previous year thus showing a decrease of 24 days.

67
(c) Debt Capital of the year under review as a percentage of Equity had been 302% as compared with 3,996% of the preceding year.
(d) The gross profit margin of the year under review had increased to
1.73 %as compared with 0.92 % of the preceding year. (e) The return on capital employed ratio showed a negative trend in 2008
and 2009. (f) The return on total assets ratio was a negative of 7.79 % as
compared with the negative of 8.18 % of the preceding year. 3.2 Operating Review
3.2.1 Performance
The following observations are made.
(a) The agreement entered into between the Laugf Gas (Pvt) Ltd and Ceylon
Petroleum Corporation in respect of LP gas sales had been expired on
20thOctober 2006. However, the Corporation has supplied LP Gas to Laugf
Gas (Pvt) Ltd continuously without entering into agreement. Instead, the
supply of gas had been continued with a letter given by the Minister of
Petroleum Industries. Further, the Corporation had planned to engage in
gas business in the year 2008. However, the Laugf Gas (Pvt) Ltd filed a
case against the Corporation in this regard which could possibly
discontinue supply of gas. The Supreme Court directed the Corporation to
continue gas supply to Laugfs Gas (Pvt) Ltd as agreed on 30 March 2009.
(b) According to the tender procedure set out by the National Procurement
Agency followed in evaluating tender economical viability of offers, it
should be based on competitive offer which conforms to tender
procedures /conditions of the Corporation. For a tender to be
competitive there should be more than one offer for a Tender. However,
it was observed that three tenders aggregating to Rs. 6,290 million had
been selected with only one offer.

68
In this connection the Chairman informed me as follows.
It is to be noted that from December, 2008 to November, 2009, the
procurement of crude oil and petroleum products was carried out by the
General Treasury under a Court order and procurement for crude oil and
petroleum products was determined on the urgency of country’s
requirement as refinery production was limited. Under this situation,
even a single quotation has to be considered.
(c) Some products of the Corporation have been sold at a price less than the
production cost. It appears that those loss making products have
contributed for the huge net loss significantly as well as for the negative
equity position of the Corporation at the end of the year under review.
The Details are given below :-
Product Sales Value
Rs. Mn..
Cost of
Sales
Rs. Mn..
Gross
Profit/(Loss)
Rs. Mn..
Net Profit at the year end 2009
Fuel Oil 3500 (power) 7,350 12,466 (5,116) Net Loss for the year ended 31 December 2009 amounted to Rs. 11,480 million and power generation fuel oil has contributed for a gross loss of Rs. 14,941 million
Fuel Oil 1500 (power) 14,402 24,227 (9,825)
Fuel Oil (others) 5,665 7,507 (1,842)
Agro Chemicals 179 197 (18)
Solvent 135 145 (10)
LPG 1,485 1,523 (38)
Kerosene 9,754 10,379 (625)
LAD (Bunkering) 64 74 (10)
Fuel Oil (Bunkering) 51 126 (75)
3.2.2 Hedging Transactions
According to on the minutes of the Board of Directors of the Corporation,
arbitration proceedings are being conducted at the London Court of International
Arbitration. The Corporation was sighted as a party in the arbitration proceeding
pertaining to hedging contracts entered into several commercial banks. Pending
the outcome of these proceedings at the London Court of International
Arbitration, the Corporation had not recognized any resultant liability. Further,
the Corporation had not furnished the details pertaining to the transactions to

69
enable to independently verify the liability under these circumstances. Further it
was not possible to satisfy in audit whether the Corporation has adequately
recognized all liabilities arising out of these contracts.
In this connection the Chairman informed me as follows :-
Supreme Court cases were pending during the course of audit for the year 2009.
Instructions were received from Hon. Attorney General not to disclose any
confidential information until conclusion of the Court cases.
3.2.3 Utilization of Corporation’s Resources by Other Government Institutions
Nine motor vehicles had been released to two Government Institutions and 18
employees had been released to seven Government Institutions without the
approval of the appropriate authority and disregarding the instructions contained
in the Public Enterprises Circular No. PED/12 of 02 June 2003.
3.2.4 Identified Losses
The following observations are made.
(a) The Corporation had entered into bunkering business through a private
company in April 2008 with the intention of carrying out that business in
future. According to the Corporation, at the commencement of the business,
the environment was not favorable to the Corporation since it had to adopt
different strategies to compete with other competitors in the market. Therefore,
during the period April 2008 to December 2008 and January 2009 to May 2009,
the Corporation had sold fuel at a reduced price to a private company and as a
result, the Corporation had incurred an approximate loss of Rs.85.2 million and
Rs.125 million respectively from the bunkering business.
(b) According to the current practice and the terms and conditions agreed with
CPSTL, the Corporation had reimbursed to CPSTL more than the amount
collected as slab from dealers. The Corporation had computed the dealer
commission based on the outlet spot price which included the slab. The slab

70
payments to CPSTL had been computed based on the actual monthly
consumption report prepared by the CPSTL. Due to this practice, the Corporation
had sustained an approximate loss of Rs. 11.1 million for the year ended
31stDecember 2009.
(c) The Corporation had sustained a loss of Rs. 1,039 million during the year under
review (previous year loss was Rs. 2,071 million)by down grading 19,502,631
litres of Aviation Turbine Fuel to Lanka Kerosene as there was an average price
difference of Rs. 18.65 per litre between these two products
(d) The Corporation had sustained a gross loss of Rs.624 million. (gross loss of the
previous year was Rs. 4,971 million) from kerosene sales during the year under
review.
(e) There was no standard set for allowable operational loss of fuel deliveries
through bowsers and wagons and storage at depots and terminals. The practice
followed by the Corporation is to allow the Own Use and Process Loss figure at 5
per cent for Crude Oil input and to allow a 0.5 per cent for evaporation loss for
each transfer between two locations. However, it was observed that a loss of Rs.
576 million had been occurred with regard to evaporation, processing, operation
and stock handling, product transferring etc. during the year 2009.
3.2.5 Management Inefficiencies
The following observations are made.
(a) No proper evaluation of the risk involved in linking the Corporation data base to
an Enterprise Resource Planning (ERP) system developed by Ceylon Petroleum
Storage Terminal Ltd. (CPSTL) with the assistance of the Indian Oil Company (the
parent company of the major industry competitor of the Corporation had been
made by the Corporation. Since the Corporation has to commit significant
amount of its resources (both capital and human) for this purpose, a proper and
in depth analysis of the impacts that would arise through this system integration
should have been done with the assistance of experts in the field of Enterprise

71
Resource Planning Systems. Further, it was observed that there was no
agreement or a memorandum of understanding (MOU) amongst the
Corporation, CPSTL and LIOC with regard to their respective responsibilities
under this project before the implementation of same. It was also important to
have an agreement/memorandum as precautionary measure, taking into
account the significant outlay of capital and human resources incurred by the
Corporation to upgrade their equipment etc. to be compatible with the ERP
System to be introduced by CPSTL.
(b) The bays No. 4C, 1D and 1A at Muturajawela Tank farm of the Corporation were
not in operation due to a technical failure. However, no action had been taken
to repair the bays by the Corporation.
(c) The Corporation had incurred demurrage charges amounting to Rs. 20.3 million
due to delay in establishing the letters of credit.
(d) The Corporation had made major investments amounting to Rs.2,556 million in
various portfolios. However, no income had been generated on these
investments as at 31 December 2009.
(e) The Corporation had paid Value Added Tax based on the turnover as per sales
ledger. However, a difference of Rs.550 million was observed between the
aggregate amount as per Sales Ledger and the aggregate amount as per Value
Added Tax Returns. Further, It was observed that a proper reconciliation
mechanism was not in practice to monitor Value Added Tax
payments/receivables.
(f) The management had accepted some cargo against the recommendation of the
Technical Evaluation Committee. An examination of the related file revealed that
the Corporation had paid the supplier based on the price calculated on the
monthly average of respective product price. However, TEC report available in
the respective file had recommended to use the average price of two days
72
before and after from Bill of lading date. Due to the violation of recommendation
of the TEC the Corporation had paid an additional sum of Rs. 52.3 million.
(g) As a practice, the Corporation used to select the vessel for transporting crude oil
based on competitive bidding process over the years. However, it was observed
that the Corporation had entered into an agreement with only two vessel owners
for a certain period at a fixed price. Hence, the Corporation had been deprived
of the benefits that could have been gained if the vessels were selected on
competitive bidding. Further, earlier tender condition facilitated for out turn
losses which were favorable to the Corporation. However, it was observed that
the said tender conditions had been modified and in place of our turn losses it
had been agreed for in transit losses since vessel owners had not agreed with the
out turn loss.
.(h) It was observed that 20,000 Mt. of High Sulphur fuel oil 1500 valued at Rs.1,140
million imported by the Corporation had been contaminated and it has affected
the Independent power producers in the country and the CPC has consulted the
Attorney General in this regard. The Attorney General’s opinion was that the fuel
specifications and the tender conditions laid down for the import of High Sulphur
fuel oil 1500 are not in favor of the Corporation in case of the above situation,
and therefore taking legal action against supplier could be a waste of money.
Hence the Board of Directors has taken a decision to cancel the registration of
this particular supplier.
(i) According to the agreement entered into with Lanka Indian Oil Company (LIOC),
the Government of Sri Lanka and the Corporation in 2003 relating to the taking
over of possession and related matters of the China Bay installation, the
Corporation has agreed to lease the storage facilities and the land to LIOC for a
period of thirty five years and that lease agreement should be executed within
06 months from the date of the agreement. However, the Corporation has not
yet entered into any lease agreement and any related lease rentals had not
been received from LIOC for the usage of this storage facility, although the
facility had already been used by the LIOC since February 2003.

73
3.2.6 Assets Management
The following assets had been allowed to idle since the acquisition of those assets.
Nature of the Asset Comments
(a) Wanathamulla -
Halgahakumbura Land
This land had been acquired for Rs.10.6 million for the purpose of LP Gas project and a playground. However, it had not been utilized due to encroachments. In addition, this land is being illegally occupied by squatters since 1973, and it was observed that about 623 families are being occupied this land presently.
(b) Mahahena Land According to the correspondence available, the Corporation had paid a sum of Rs. 0.625 million for the acquisition of the land. However, this land had not been accounted in the books of the Corporation, and is being used by the previous owner since 1986.
3.2.7 Human Resource Management (HRM)
There is no written standard period of rotation for the security officers at the
Muthrajawela terminal. A security officer is the only person who checks the tongue
level of each bowser after filling the fuel into the bowser.
3.2.8 Apparent Irregularities/ Irregular Transactions
As mentioned in my previous audit reports, an employee’s welfare association
(Ceylon Petroleum Corporation Thrift Society) is being functioned from the premium
made by the Corporation from time to time. The following observations are made in
this connection.
(a) A sum of Rs. 40.2 million had been released to the Society during the year under
review to implement the Medical Scheme of the Corporation which could have
been done by the Corporation itself. The above contribution had been made to
the Society in addition to the medical allowance of Rs. 3,000 per annum paid to
each employee with their monthly salary to meet outdoor treatments.

74
(b) The balance outstanding from the loans granted to members of the Society by
the Corporation out of the funds of the Corporation as at 31stDecember 2009
amounted to Rs. 20.7 million and a sum of Rs. 2.2 million had been received as
interest income from this Society.
3.2.9 The Corporate Plan
The Corporate Plan of the Corporation had not been reviewed and updated
annually, in terms of the Public Enterprises Circular No PED/12 of 2ndJune
2003 and also; it had not been forwarded to the Ministry, Department of
Public Enterprises and the Auditor General at least 15 days before the
commencement of each financial year. Further, Corporate Plans for the
period 2007 – 2011 and 2009-2013 had not been forwarded to the Auditor
General.
3.2.10 Budgetary Control
Significant variances were observed between the budget and the actual income and
expenditure for the year under review thus indicating that the budget had not been
made use of as an effective instrument of management control.

75
4. Systems and Controls
Significant deficiencies observed during course of audit were brought to the notice
of the Corporation from time to time. Special attention is needed in respect of the
following areas of control.
a) Property, Plant and Equipment
b) Debtors and Other Receivables
c) Trade Creditors and Other Payables
d) Hedging Transactions
e) Taxation
f) Accounting
g) Compliance with Laws, Rules etc.
h) Investments
i) Inventories
j) Utilization of Resources
k) Human Resource Management
l) Budget
H.A.S. Samaraweera
Acting Auditor General

76
TEN YEAR SUMMARY
DOMESTIC SALES OF BUL PRODUCTS
Rupees Mn.. 2000 2001 2002* 2003 2004 2005 2006 2007 2008 2009
(A) VALUE
Petrol 14,614.769 16,258.637 18,514.426 22,461.268 28,761.366 28,633.662 36,677.342 46,579.620
66,433.726 60,055.135
Auto Diesel 35,674.876 48,472.452 52,668.931 52,084.773 74,520.990 78,104.774 92,474.65 113,737.174 151,070.451 119,046.261
Super Diesel 1,342.637 1,904.453 1,902.580 1,698.721 1,711.525 725,285 349.805 467.764 885.249 866.145
Kerosene 4,432.654 5,512.753 5,938.386 5,683.438 7,775.135 11,430.279 13,209.914 12,459.330 14,000.051 9,754.538
Furnace Oil 6,932.905 11,836.009 15,126.837 16,238.84 20,135.716 30,165.885 36,421.645 43,941.105 66,220.151 33,157.145
Total 83,984.30 94,151.16 98,167.04 132,904.73 149,059.89 179,133.352 217,184.993 298,609.628 222,879.224
(B) QUANTITY - Thousand Metric Tons
Petrol 224.400 249.500 286.100 337.900 350.300 334.100 367.600 382.100
383.747 415.667
Auto Diesel 1,683.800 1,624.900 1,728.300 1,523.000 1,583.300 1,330.100 1,335.300 1,449.700
1,371.323 1,427.328
Super Diesel 46.700 49.00 46.900 39.500 31.600 11.700 4.700 5.400
7.188 8.548
Kerosene 229.100 227.800 228.800 184.600 171.800 178.000 196.600 168.500
151.308 150.690
Furnace Oil 736.700 748.800 757.600 648.300 771.700 972.800 911.100 985.200
994.545 1,095.733
Total 2,920.700 2,900.000 3,047.700 2,733.300 2,908.700 2,826.700 2,815.300 2,990.90 2,908.111 3,097.966
(C) RETAIL SELLING PRICES IN PETROLEUM PRODUCTS
(Colombo Spot Price in Rs. Per Litre as at 31st December)
Super Petrol 50.000 50.000 49.000 53.000 70.000 80.000 95.000 92.000 120.000 115.000
Auto Diesel 24.500 26.500 30.000 32.000 44.000 50.000 92.000 60.000 70.000 73.000
Super Diesel 18.500 29.800 31.800 35.300 49.300 55.300 65.300 65.3 85.300 88.300
Kerosene 18.400 17.400 24.000 25.500 25.500 30.500 48.000 48.000 50.000 51.000
Furnace Oil
-1000 Sec 14.600 16.500 21.200 23.200 24.700 31.400 44.400 44.400 33.900 34.900
-1500 Sec 14.000 15.800 20.700 22.300 24.300 30.300 43.300 43.300 31.700 32.700
-3500 Sec 12.400 14.100 18.900 20.700 22.000 28.000 41.000 41.000 25.000 26.000
INCOME & EXPENDITURE
Gross Income
Less Taxes 63,159.000 74,351.000 80,114.000 85,900.000 121,540.000 161,852.000 196,767.000 238.364 341.670 236,332.000
Income from Investment 181.000 120.000 1118.000 162.000 - - - - -
Cost of Sales 70,688.000 62,734.000 67,211.000 75,471.000 106,750.000 144,501.000 187,231.000 221,724.000 338,514.000 233,250.000
Margin -7,529.000 11,617.000 12,903.000 10,429.000 14,789.000 17,350.000 9,536.000 16,641.000 1,835.038 3,082.000
Extraordinary Item - - 2,530.000 - - - - - - -
Working & Establishment Exppenses including Interest 8,714.000 10,178.000 6,765.000 5,715.000 10,344.000 7,510.000 7,621.000 12,657.000 16,570.000 15,424.773
Kerosene Subsidy and other Levis paid to the treasury - - - - - - - - -
Profit/(Loss) Before Tax -16,062.00 1,559.00 9,786.00 4,874.00 4,445.00 9,840.00 -1,915.00 3,984.00
(14,735.000) (12,342.640)
* Retail prices revised monthly as per Formulae from February 2002
** Taxes comprise provisional, TT, Excise Duty & SRL

77
TEN YEAR SUMMARY
Rupees Mn. 2000
2001 2002* 2003 2004 2005 2006 2007 2008 2009 CAPITAL STRUCTURE
Capital Employed
Capital
1,000.000 1,000.000 1,000.000 1,000.000 1,000.000 1,000.000 1,000.000
1,000.000 1,000.000 1,000.000
Reserves (16,221.800) (15,039.400) (8,589.100) (2,253.800) 1,984.100 11,673.400 10,065.900
12,567.800 (2,416.400) (14,716.686)
L/T Liabilities 3,012.700 4,787.000 6,644.600 8,476.500 7,699.900 19,113.400 16,705
13,728.200 10,908.400 32,779.058
Gratuity Provision 462.200 482.800 424.900 556.800 700.400 377.400 514.300 541.400 566.500 735.200
Total (11,746.900) (8,769.600) (519.600) 7,779.500 11,384.400 32,164.200 28,285.400
27,837.400 10,058.500
Represented
Fixed Assets, Including work in Progress
5,905.400 7,630.200 10,844.700 4,504.400 4,450.700 4,512.700 4,460.900 4,374.600 4,624.000 5,041.000
Investment 316.200 338.700 57.800 2,173.800 2,176.100 2,535.600 2,553.100 2,546.900 2,541.900 2,541.900
Net Current Assets (17,968.500) (16,738.500) (11,422.100) (1,101.300) 4,757.600 25,115.900 21,271.500 20,915.900 2,892.600 12,214.672
Total (11,746.900) (8,769.600) (519.600) 5,576.900 11,384.400 32,164.200 28,285.500 27,837.400 10,058.500 19,797.572
SUMMARISED CASH FLOW STATEMENT
Cash Flow from Operating (13,920.000) 4,495.757 7,310.655 4,874.194 4,444.837 9,839.809 (1,915.029) 3,984.181 (14,735.028) (12,342.640)
Extraordinary item - - 2,529.832 - - - - - - -
Adjustment for Items not involving Movement of cash
537.928 604.449 529.412 988.365 776.807 841.682 1,431.845 1,928.200 1,922.024 4,986.477
Operating Profit/(Loss) before Working Capital changes
(13,382.072) 5,100.206 10,369.899 5,862.559 5,221.644 10,681.491 (483.184) 5,912.381 (12,813.004) (7,356.162)
Change in Working Capital
(increase)/Decrease in inventories
3,367.729 1,845.314 (3,099.970) 1,844.676 (5,157.403) (4,066.365) (9,184.440) (13,321.526) 8,673.831 5,962.155
(increase)/Decrease in Trade and Other Receivables
(197.361) (2,143.290) 711.285 (384.386) 789.614 (3,434.619) (2,852.640) (13,098.772) (32,409.849) (9,365.376)
(increase)/Decrease in Trade and Other Payables
22,289.402 (3,215.520) (4,571.558) (1,792.170) 2,862.133 (1,838.767) 11,099.326 23,813.340 39,946.795 57,438.630
Les Gratuity/Tax and Interest Paid
(2,264.633) (3,250.230) (2,788.440) (617.268) (880.768) (2,072.717) (5,613.107) (3,268.480) (4,625.380) (4,871.602)
Cash Generating From Operational Activities
3,077.607 (1,663.520) 621.216 4,913.411 2,835.220 (730.977) (7,034.045) 36.943 (1,227.607) 41,807.644
Cash Used in Investing Activities
(1,217.353) (2,173.473) (1,899.240) (3,421.404) 246.165 317.925 662.033
1,165.988 40.605 (308.564)
Cash from/(Used in) Financing Activities
715.698 1,797.652 2,069.996 1,880.885 1,050.684 13,020.883 (2,478.143)
(3,326.039) (1,001.410) (21,339.770)
Net (Decrease)/Increase in cash & Cash Equivalents
2,575.952 (2,039.341) 791.972 3,372.892 4,132.069 12,607.831 (8,850.155)
(2,123.108) (2,188.412) 20,159.310
Cash & Cash Equivalents at beginning of the year
(507.723) 2,068.229 28.888 820.860 4,193.752 8,325.821 20,933.652
12,083.497 9,960.389 7,771.977
Cash & Cash Equivalents at end of the year
2,068.229 28.888 820.860 4,193.752 8,325.821 20,938.652 12,083.497
9,960.389 7,771.977 27,931.287
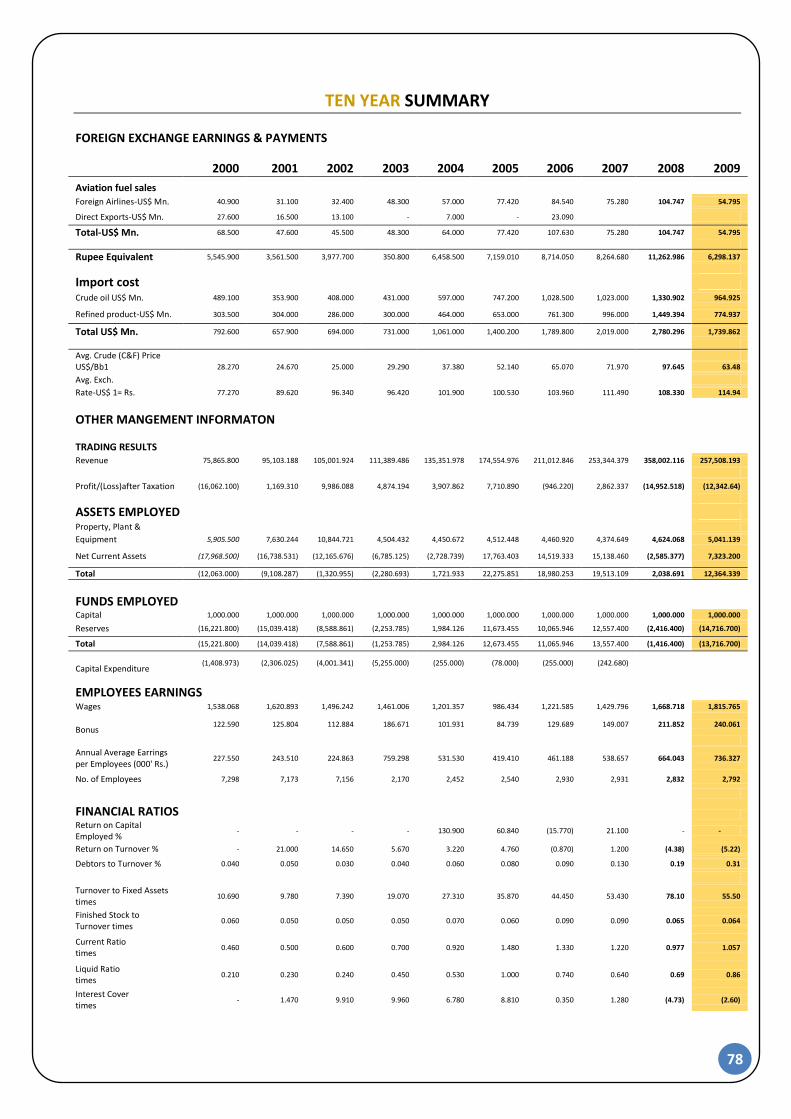
78
TEN YEAR SUMMARY FOREIGN EXCHANGE EARNINGS & PAYMENTS
2000 2001 2002 2003 2004 2005 2006 2007 2008 2009
Aviation fuel sales Foreign Airlines-US$ Mn. 40.900 31.100 32.400 48.300 57.000 77.420 84.540 75.280 104.747 54.795
Direct Exports-US$ Mn. 27.600 16.500 13.100 - 7.000 - 23.090
Total-US$ Mn. 68.500 47.600 45.500 48.300 64.000 77.420 107.630 75.280 104.747 54.795
Rupee Equivalent 5,545.900 3,561.500 3,977.700 350.800 6,458.500 7,159.010 8,714.050 8,264.680 11,262.986 6,298.137
Import cost
Crude oil US$ Mn. 489.100 353.900 408.000 431.000 597.000 747.200 1,028.500 1,023.000 1,330.902 964.925
Refined product-US$ Mn. 303.500 304.000 286.000 300.000 464.000 653.000 761.300 996.000 1,449.394 774.937
Total US$ Mn. 792.600 657.900 694.000 731.000 1,061.000 1,400.200 1,789.800 2,019.000 2,780.296 1,739.862
Avg. Crude (C&F) Price
US$/Bb1 28.270 24.670 25.000 29.290 37.380 52.140 65.070 71.970 97.645 63.48
Avg. Exch.
Rate-US$ 1= Rs. 77.270 89.620 96.340 96.420 101.900 100.530 103.960 111.490 108.330 114.94
OTHER MANGEMENT INFORMATON
TRADING RESULTS
Revenue 75,865.800 95,103.188 105,001.924 111,389.486 135,351.978 174,554.976 211,012.846 253,344.379 358,002.116 257,508.193
Profit/(Loss)after Taxation (16,062.100) 1,169.310 9,986.088 4,874.194 3,907.862 7,710.890 (946.220) 2,862.337 (14,952.518) (12,342.64)
ASSETS EMPLOYED
Property, Plant &
Equipment 5,905.500 7,630.244 10,844.721 4,504.432 4,450.672 4,512.448 4,460.920 4,374.649 4,624.068 5,041.139
Net Current Assets (17,968.500) (16,738.531) (12,165.676) (6,785.125) (2,728.739) 17,763.403 14,519.333 15,138.460 (2,585.377) 7,323.200
Total (12,063.000) (9,108.287) (1,320.955) (2,280.693) 1,721.933 22,275.851 18,980.253 19,513.109 2,038.691 12,364.339
FUNDS EMPLOYED
Capital 1,000.000 1,000.000 1,000.000 1,000.000 1,000.000 1,000.000 1,000.000 1,000.000 1,000.000 1,000.000
Reserves (16,221.800) (15,039.418) (8,588.861) (2,253.785) 1,984.126 11,673.455 10,065.946 12,557.400 (2,416.400) (14,716.700)
Total (15,221.800) (14,039.418) (7,588.861) (1,253.785) 2,984.126 12,673.455 11,065.946 13,557.400 (1,416.400) (13,716.700)
Capital Expenditure
(1,408.973) (2,306.025) (4,001.341) (5,255.000) (255.000) (78.000) (255.000) (242.680)
EMPLOYEES EARNINGS
Wages 1,538.068 1,620.893 1,496.242 1,461.006 1,201.357 986.434 1,221.585 1,429.796 1,668.718 1,815.765
Bonus
122.590 125.804 112.884 186.671 101.931 84.739 129.689 149.007 211.852 240.061
Annual Average Earrings per Employees (000' Rs.)
227.550 243.510 224.863 759.298 531.530 419.410 461.188 538.657 664.043 736.327
No. of Employees 7,298 7,173 7,156 2,170 2,452 2,540 2,930 2,931 2,832 2,792
FINANCIAL RATIOS
Return on Capital Employed %
- - - - 130.900 60.840 (15.770) 21.100 - -
Return on Turnover % - 21.000 14.650 5.670 3.220 4.760 (0.870) 1.200 (4.38) (5.22)
Debtors to Turnover % 0.040 0.050 0.030 0.040 0.060 0.080 0.090 0.130 0.19 0.31
Turnover to Fixed Assets times
10.690 9.780 7.390 19.070 27.310 35.870 44.450 53.430 78.10 55.50
Finished Stock to Turnover times
0.060 0.050 0.050 0.050 0.070 0.060 0.090 0.090 0.065 0.064
Current Ratio times
0.460 0.500 0.600 0.700 0.920 1.480 1.330 1.220 0.977 1.057
Liquid Ratio times
0.210 0.230 0.240 0.450 0.530 1.000 0.740 0.640 0.69 0.86
Interest Cover times
- 1.470 9.910 9.960 6.780 8.810 0.350 1.280 (4.73) (2.60)

79
GLOSARY OF FINANCIAL TERMS Cash Equivalents - Short term investments readily convertible to known amounts of
cash subject to insignificant risk of changes in value.
Contingent Liabilities - Conditions or situations at the Balance Sheet date, the financial
effects of which are to be determined by future events which may or may not occur.
Current Ratio - Measures the number of times current liabilities be recouped with
available current assets.
Debtors to Turnover - Measure of the credit extended to customers (i.e average debt
settlement period if stated in days)
Deferred Income - Income yet to be realized or realized but not recognized as income.
Interest Cover - Measures the extent to which interest charges be covered by profit
before Tax.
Liquid Ratio - Measures the number of times current assets be recouped with available
current liabilities.
Post Balance Sheet Events - Significant events that occur between the Balance Sheet
date and the date on which financial statements are authorized for issue.
Provisions - Liability of uncertain timing or amount.
Related parties - Parties who could control or significantly influence the Financial and
operating decisions/policies of the Corporation.
Segments - Constituent business units grouped in terms of nature and similarity of
operations.
Working Capital - Capital required financing the day-to-day operations (current assets
less current liabilities).
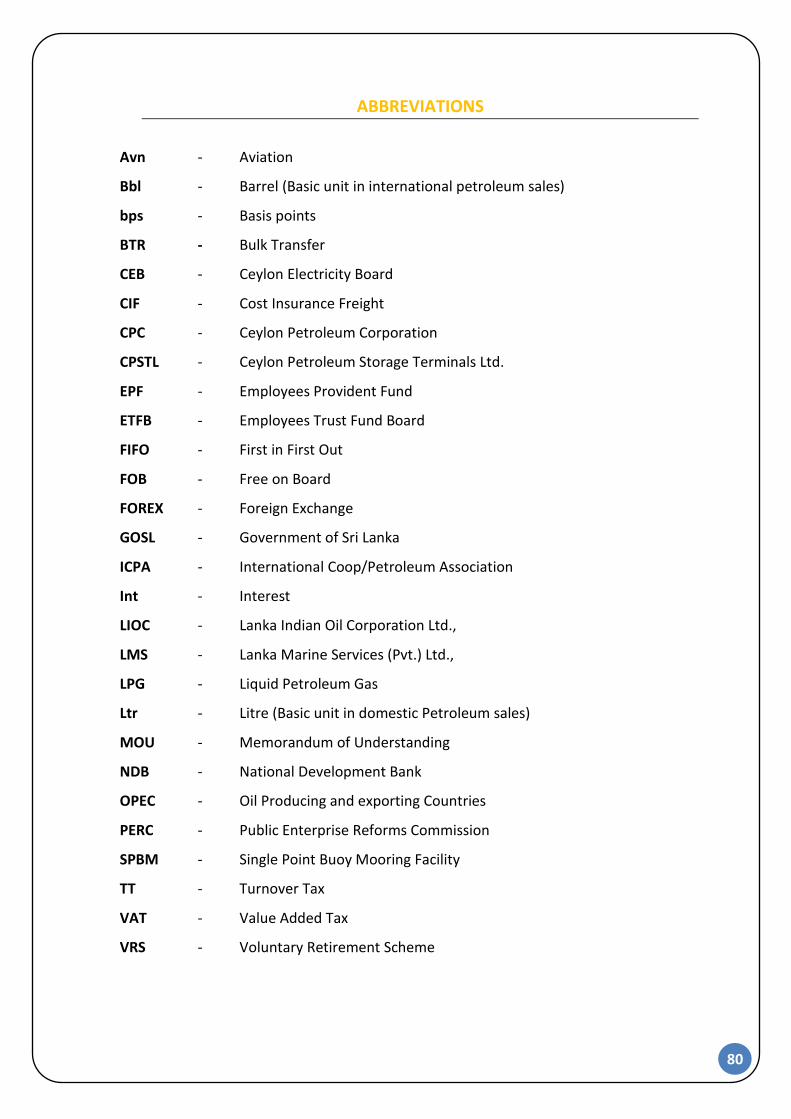
80
ABBREVIATIONS
Avn - Aviation
Bbl - Barrel (Basic unit in international petroleum sales)
bps - Basis points
BTR - Bulk Transfer
CEB - Ceylon Electricity Board
CIF - Cost Insurance Freight
CPC - Ceylon Petroleum Corporation
CPSTL - Ceylon Petroleum Storage Terminals Ltd.
EPF - Employees Provident Fund
ETFB - Employees Trust Fund Board
FIFO - First in First Out
FOB - Free on Board
FOREX - Foreign Exchange
GOSL - Government of Sri Lanka
ICPA - International Coop/Petroleum Association
Int - Interest
LIOC - Lanka Indian Oil Corporation Ltd.,
LMS - Lanka Marine Services (Pvt.) Ltd.,
LPG - Liquid Petroleum Gas
Ltr - Litre (Basic unit in domestic Petroleum sales)
MOU - Memorandum of Understanding
NDB - National Development Bank
OPEC - Oil Producing and exporting Countries
PERC - Public Enterprise Reforms Commission
SPBM - Single Point Buoy Mooring Facility
TT - Turnover Tax
VAT - Value Added Tax
VRS - Voluntary Retirement Scheme


