
此处看到的是页眉幻灯片标题
MELCOR application to AP1000 SBO Simulation
2013.05.02
5th meeting of European MELCOR User Group
Yaodong CHEN Tengfei LV Min LIAO
Div. of Advanced Nuclear System Research
State Nuclear Power Research Institute

此处看到的是页眉幻灯片标题

此处看到的是页眉幻灯片标题
--157x14’ 17x17 FAs-- No core lower plate
-- 2 hot legs/ 4 cold legs-- No penetration in LH-- Canned type MCP, no risk of shaft seal leakage
-- No intermediate section
3
Plant overview: Reactor system

此处看到的是页眉幻灯片标题
• Steel containment vessel is
part of passive safety system.
• PCS transfers heat from the
shell to the environment.
• Water from Passive
Containment Cooling Water
Storage Tank (PCCWST) wets
outer shell for > 72 hours.
• Natural convection air flow
through containment annulus
provides additional cooling.
Plant overview: PCS
此处看到的是页眉幻灯片标题
5
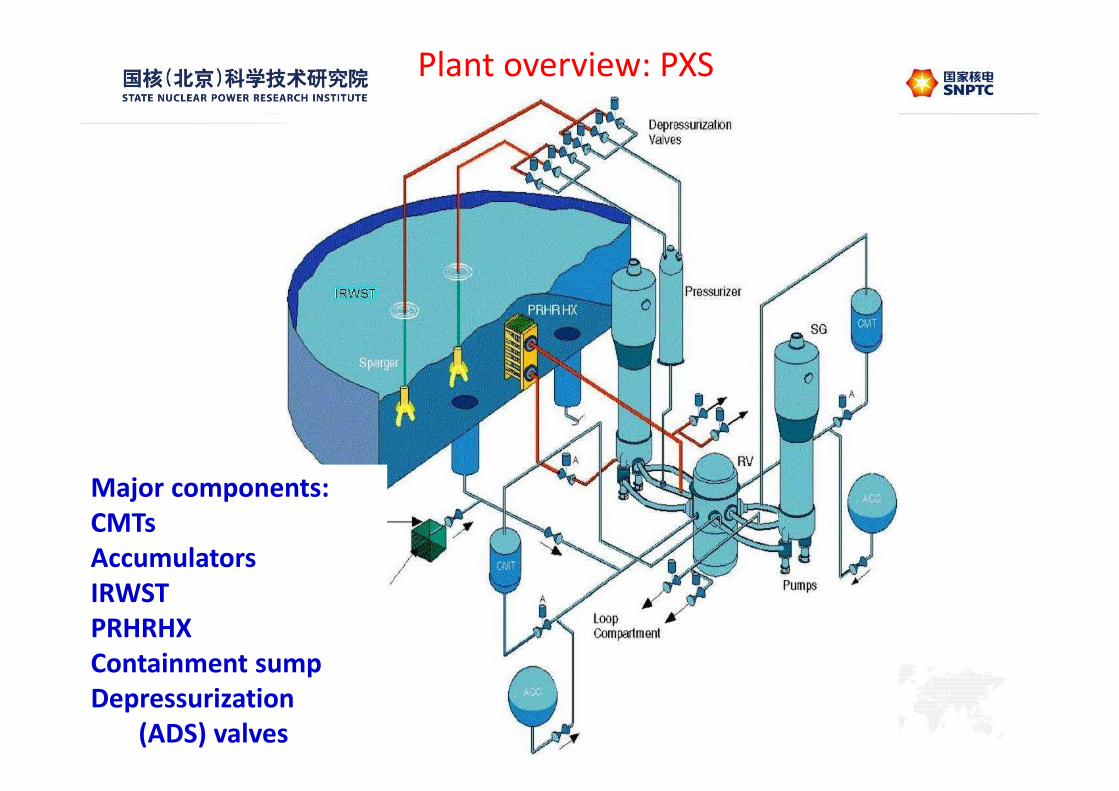
Plant overview: PXS
Major components:
CMTs
Accumulators
IRWST
PRHRHX
Containment sump
Depressurization
(ADS) valves

此处看到的是页眉幻灯片标题
6
• PRHR remove decay heat in event of loss of SG function, transferring heat to IRWST
• CMTs provide coolant at full system pressure to downcomer through DVI line.
• ADS 1~3 actuates in order when CMT level decreases below 67.5%.
• Two accumulators provide coolant at high flow rates when RCS < 700 psia.
• IRWST supplies borated water to RCS once sufficiently depressurized.
• ADS 4 initiates with CMT Low-2 level (20%) + Low RCS pressure (1200 psig)
PXS work condition

此处看到的是页眉幻灯片标题
7
Main control signal of safety system
Signal group A B C D E
SCRAM(1) PZR high pressure2460psia
PZR level HI-376% range
Primary flow low87% of nominal flow
RCP low speed90% of nominal speed
CMT injection
SCRAM(2) SG level Low-195000lbm
ESF activated ADS onset PZR low-1 pressure1800 psia
MCP trip “S” signal SG-NR HI-2100% range
Tavg Low-2542 F
“S”signal Pzr_pressure low21700 psia
Steam pressur low535 psia
Tcold Low500 F
Pcont Hi-28 psig
ADS1~3 trigger CMT low-167.5% vol
Hot leg lev low-20.072 m
CMT injection PZR level Low-27% range
“S”signal ADS1~3 onset
PRHR on SG-NR Low+ startup feed failure
SG-WR Low55000lbm
ADS1~3 onset CMT injection PZR level Hi-376% range
Turbine trip SG-NR HI-2100% range
“S” signal scram
MFW isolation SG-NR HI-2100% range
“S” signal Tavg Low-1542F
ADS4 trigger CMT low-2(20% vol)+ Prcs<8.27 Mpa
IRWST injection ADS4 onset Hotleg lev low2
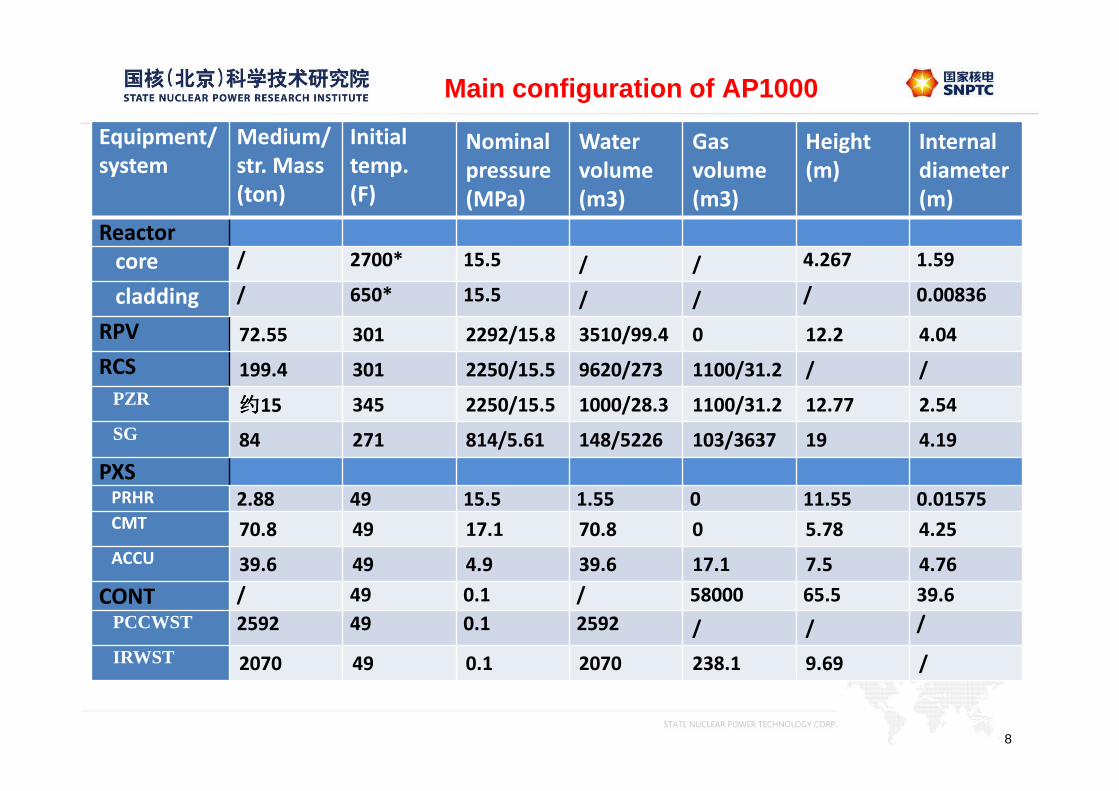
此处看到的是页眉幻灯片标题 Main configuration of AP1000
8
Equipment/
system
Medium/
str. Mass
(ton)
Initial
temp.
(F)
Nominal
pressure
(MPa)
Water
volume
(m3)
Gas
volume
(m3)
Height
(m)
Internal
diameter
(m)
Reactor
core / 2700* 15.5 / / 4.267 1.59
cladding / 650* 15.5 / / / 0.00836
RPV 72.55 301 2292/15.8 3510/99.4 0 12.2 4.04
RCS 199.4 301 2250/15.5 9620/273 1100/31.2 / /
PZR约约约约15 345 2250/15.5 1000/28.3 1100/31.2 12.77 2.54
SG 84 271 814/5.61 148/5226 103/3637 19 4.19
PXSPRHR 2.88 49 15.5 1.55 0 11.55 0.01575CMT 70.8 49 17.1 70.8 0 5.78 4.25
ACCU 39.6 49 4.9 39.6 17.1 7.5 4.76
CONT / 49 0.1 / 58000 65.5 39.6
PCCWST 2592 49 0.1 2592 / / /
IRWST 2070 49 0.1 2070 238.1 9.69 /
BWR-69 following Fukushima accident scenario

此处看到的是页眉幻灯片标题
9
MELCOR
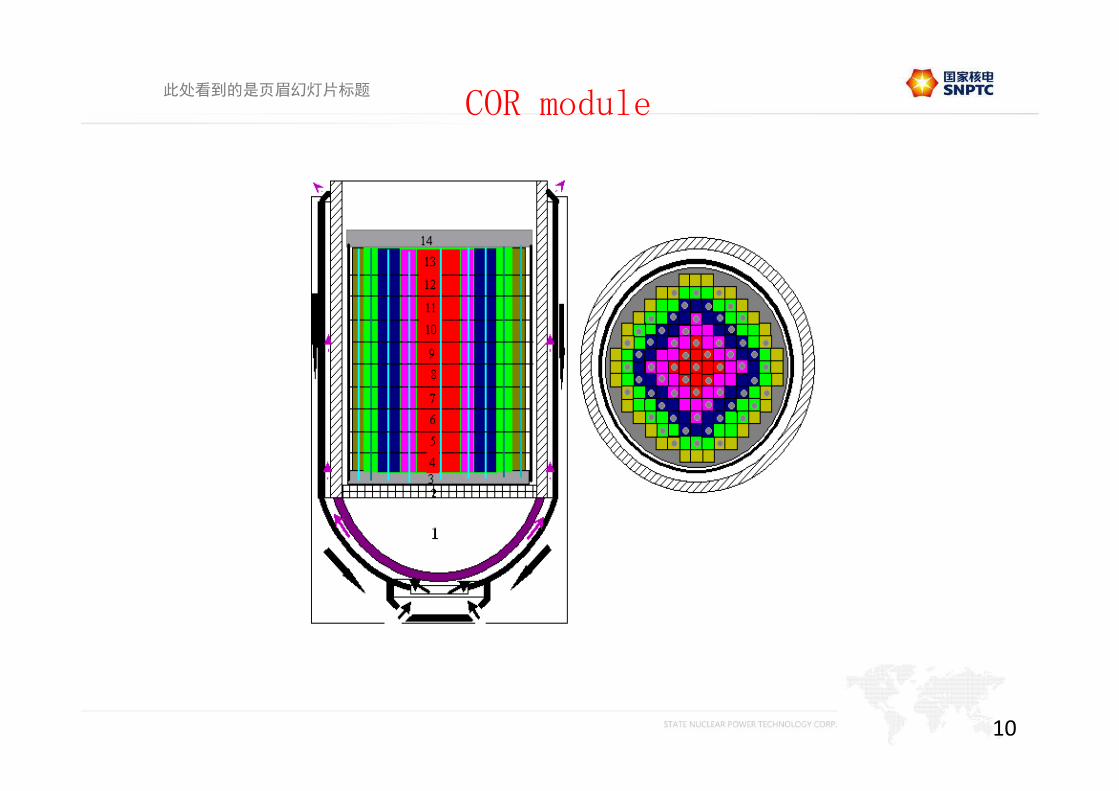
CV FL HS COR RN DCH FDI ESF CAV
CF TF
此处看到的是页眉幻灯片标题
COR module
10

此处看到的是页眉幻灯片标题
11
Nodalization of primary&secondary and PXS system

此处看到的是页眉幻灯片标题
12
Detailed PCS nodalization scheme
Configuration:
122 CVs
316 FLs
257 HSs
此处看到的是页眉幻灯片标题
13
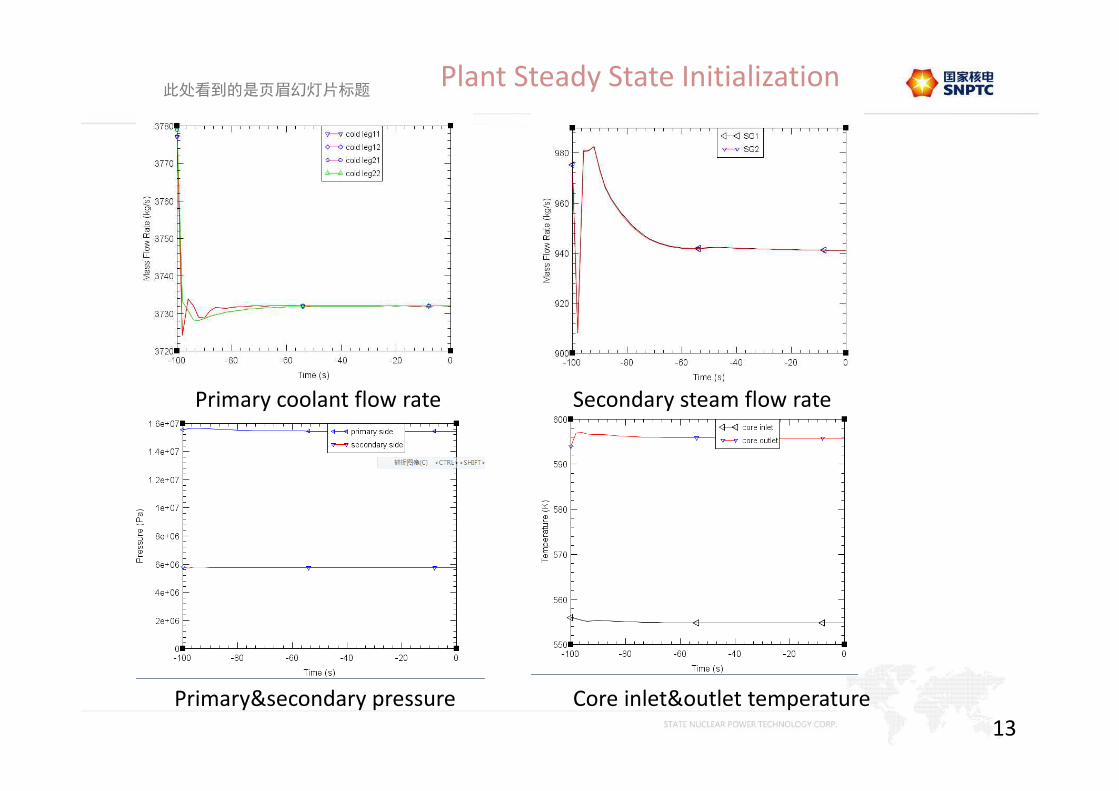
Plant Steady State Initialization
Primary coolant flow rate Secondary steam flow rate
Primary&secondary pressure Core inlet&outlet temperature

此处看到的是页眉幻灯片标题
Main assumptions:� The reactor initially operated at full power
� All PXS and PCS system could work
except the ERVC measure considered failed
� Cooled water droplet draining down along
the containment shell inside wall will not
return to IRWST directly
� the containment shell surface area is down
scaled to account for partial coverage of water
film on the outer surface
� 2 cases are simulated
1)PRHR started with 1 min delay after SG low
level signal true
2)PRHR started immediately after reactor
scram

此处看到的是页眉幻灯片标题
Comparison of PXS flow rate
Case1-PRHR flow decreased from CMT circulation
Case2-PRHR flow decreased rapidly
When IRWST water level dropped
To bottom of PRHR middle section

此处看到的是页眉幻灯片标题
Comparison of primary pressure trend
Case1 Pressure rise from CMT start
Pressure rise from PRHR top section uncover
Pressure rise from PRHR middle section uncover
此处看到的是页眉幻灯片标题
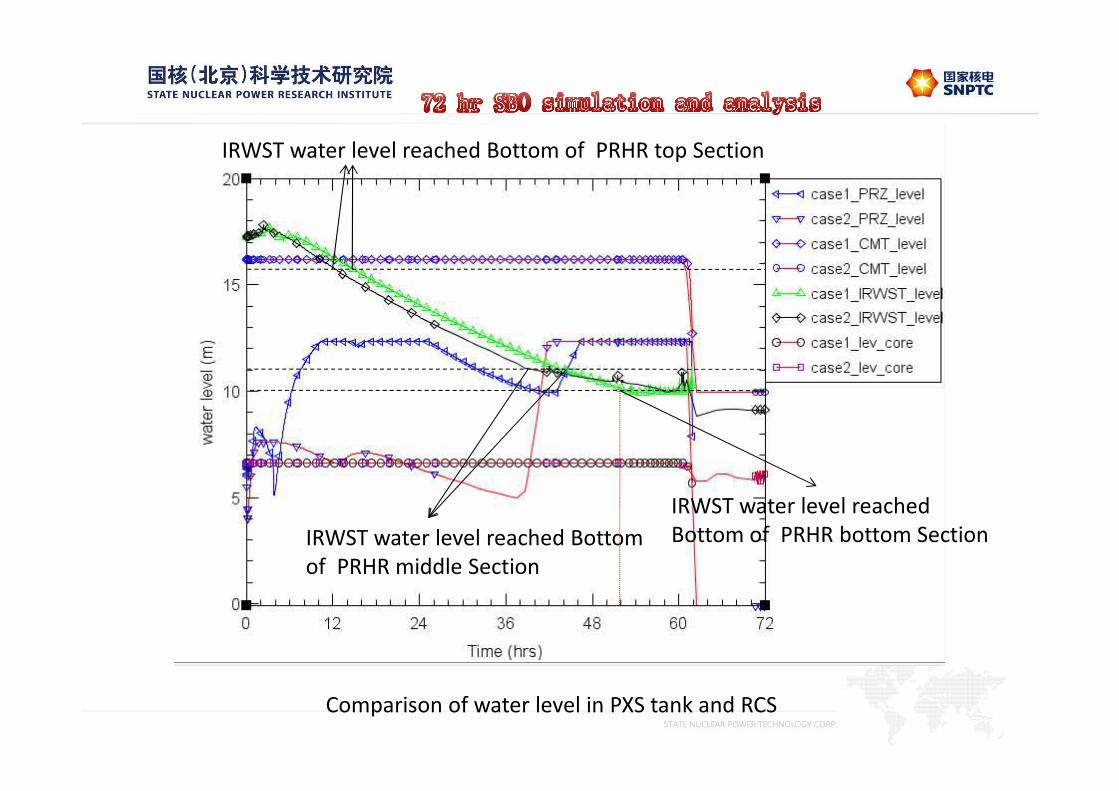
Comparison of water level in PXS tank and RCS
IRWST water level reached Bottom
of PRHR middle Section
IRWST water level reached Bottom of PRHR top Section
IRWST water level reached
Bottom of PRHR bottom Section
此处看到的是页眉幻灯片标题
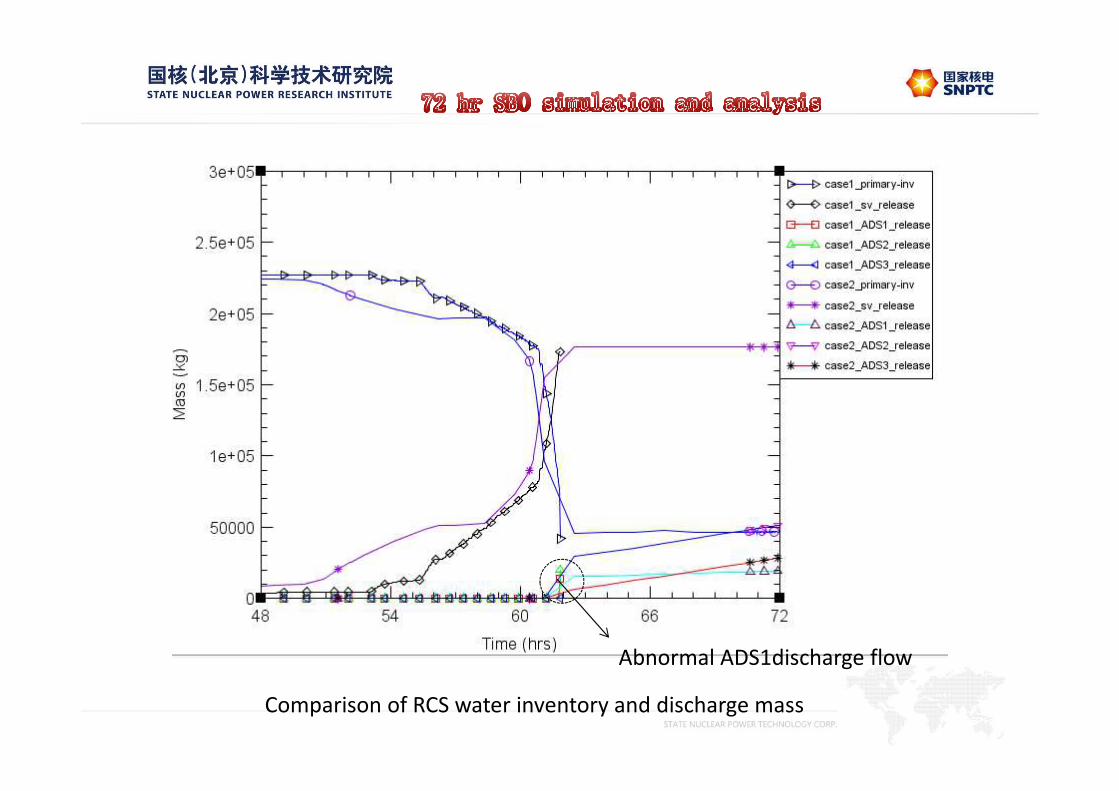
Comparison of RCS water inventory and discharge mass
Abnormal ADS1discharge flow

此处看到的是页眉幻灯片标题
Primary side&containment pressure V.S. heat removal trend(case1)

此处看到的是页眉幻灯片标题
containment pressure trend
Pressure rise from rapid decrease of
PRHR heat removal by drop of flow rate

此处看到的是页眉幻灯片标题
Water film thickness along the containment shell outside(case2)

此处看到的是页眉幻灯片标题
Water film temperature along the containment shell outside(case2)

此处看到的是页眉幻灯片标题
23
timingtimingtimingtiming((((s/hrs/hrs/hrs/hr))))
SequencesSequencesSequencesSequences case1case1case1case1 case2
second hour second hourSBO initiated 0 0Reactor scram 2 2SG narrow range water level low 25 25Steam line stop valve closed 62 62PRHR line open 85 25primary low-2 true T-averagee 274 120
CMT line started circulation 11711 3.3 260
Pressurizer low-2 pressure 13380 3.7 88538 24.6
PCS started by containment high pressure 20066 5.6 14448 4.0 PRHR tubes uncovered 158000 43.9 151500 42.1 CMT level low-1,ADS1~3 triggered 222400 61.8 220620 61.3 Hotleg low level true, IRWST injectionsignal activated
222573 61.8 220757 61.3
ADS4 triggered 222573 61.8 220757 61.3 ACCU started injection n/a n/a 220787 61.3 Core exit temperature exeeded 1200 F n/a n/a 228605 63.5 Cavity –flooding activated n/a n/a 228605 63.5 PCCWST exhausted n/a n/a 273649 76.0 Calculation terminated 222600 61.8 290000 80.6
此处看到的是页眉幻灯片标题
24
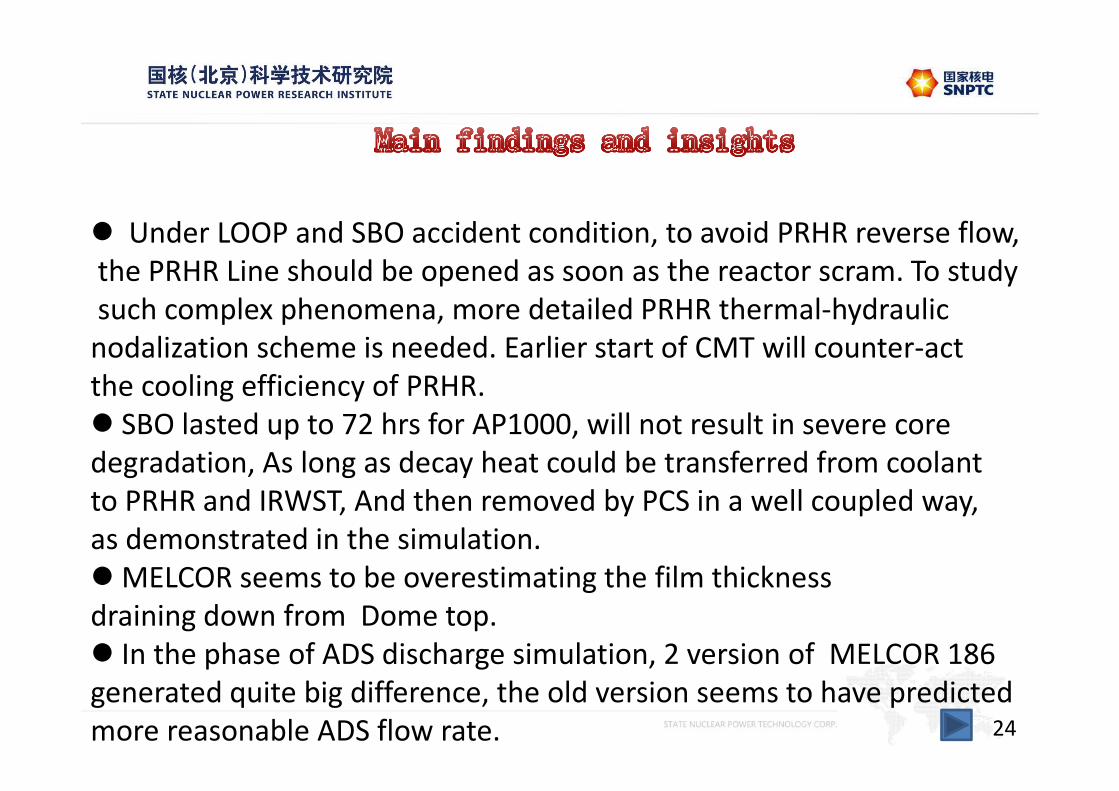
� Under LOOP and SBO accident condition, to avoid PRHR reverse flow,
the PRHR Line should be opened as soon as the reactor scram. To study
such complex phenomena, more detailed PRHR thermal-hydraulic
nodalization scheme is needed. Earlier start of CMT will counter-act
the cooling efficiency of PRHR.
� SBO lasted up to 72 hrs for AP1000, will not result in severe core
degradation, As long as decay heat could be transferred from coolant
to PRHR and IRWST, And then removed by PCS in a well coupled way,
as demonstrated in the simulation.
� MELCOR seems to be overestimating the film thickness
draining down from Dome top.
� In the phase of ADS discharge simulation, 2 version of MELCOR 186
generated quite big difference, the old version seems to have predicted
more reasonable ADS flow rate.
此处看到的是页眉幻灯片标题
25
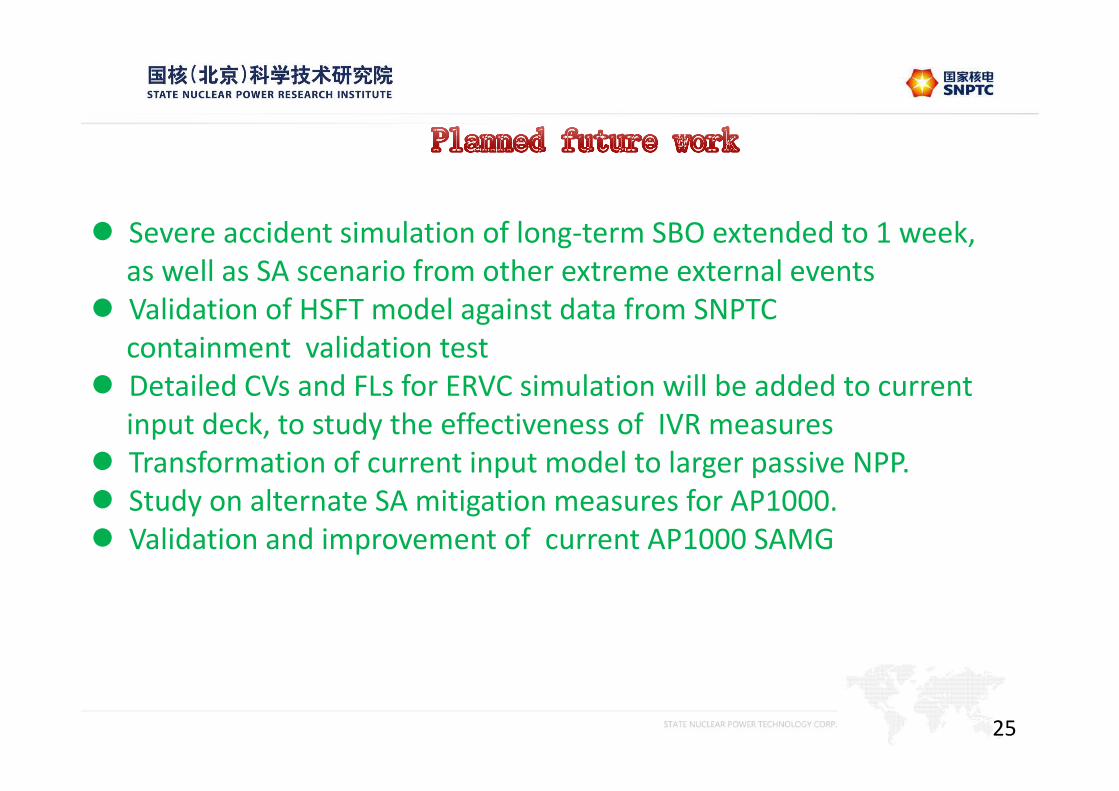
� Severe accident simulation of long-term SBO extended to 1 week,
as well as SA scenario from other extreme external events
� Validation of HSFT model against data from SNPTC
containment validation test
� Detailed CVs and FLs for ERVC simulation will be added to current
input deck, to study the effectiveness of IVR measures
� Transformation of current input model to larger passive NPP.
� Study on alternate SA mitigation measures for AP1000.
� Validation and improvement of current AP1000 SAMG

此处看到的是页眉幻灯片标题
谢谢观赏
Thank you
此处看到的是页眉幻灯片标题
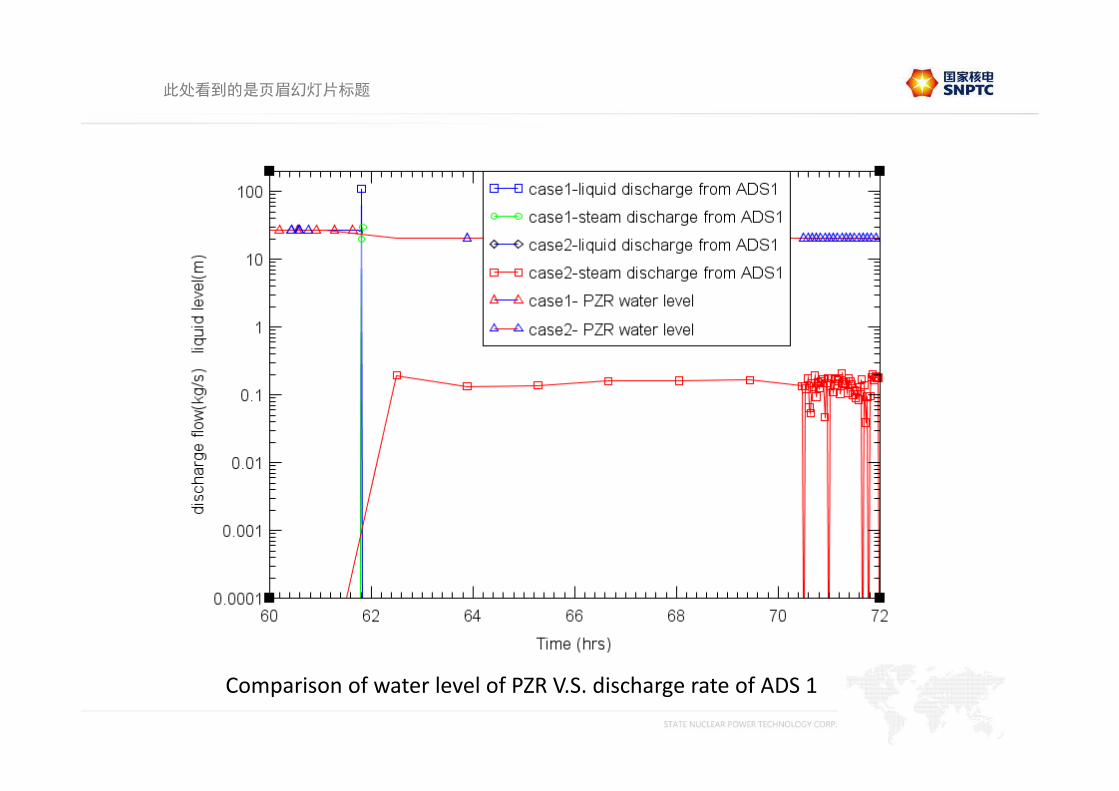
Comparison of water level of PZR V.S. discharge rate of ADS 1

此处看到的是页眉幻灯片标题
Comparison of CMT&PRHR&cold leg flow


