
Chihiro Shimizu(National University of Singapore and University of British Columbia)
Satoshi Imai(Statistics Bureau of Japan)
Erwin Diewert(University of British Columbia and New South Wales University)
Tsutomu Watanabe(University of Tokyo)
Housing Rent and Japanese CPI
14th Ottawa Group Meeting(Chiba, Japan)21.May. 2015

Ottawa Group 2015 Tokyo
2015/5/21 page. [email protected]
0.8
0.85
0.9
0.95
1
1.05
1.1
QT2
000/
1
QT2
001/
1
QT2
002/
1
QT2
003/
1
QT2
004/
1
QT2
005/
1
QT2
006/
1
QT2
007/
1
QT2
008/
1
QT2
009/
1
QT2
010/
1
QT2
011/
1
QT2
012/
1
QT2
013/
1
QT2
014/
1
Rt Rt* Residential Property Price
Annual
chan
gera
te : %
2007-2009:
the Financial Crisis
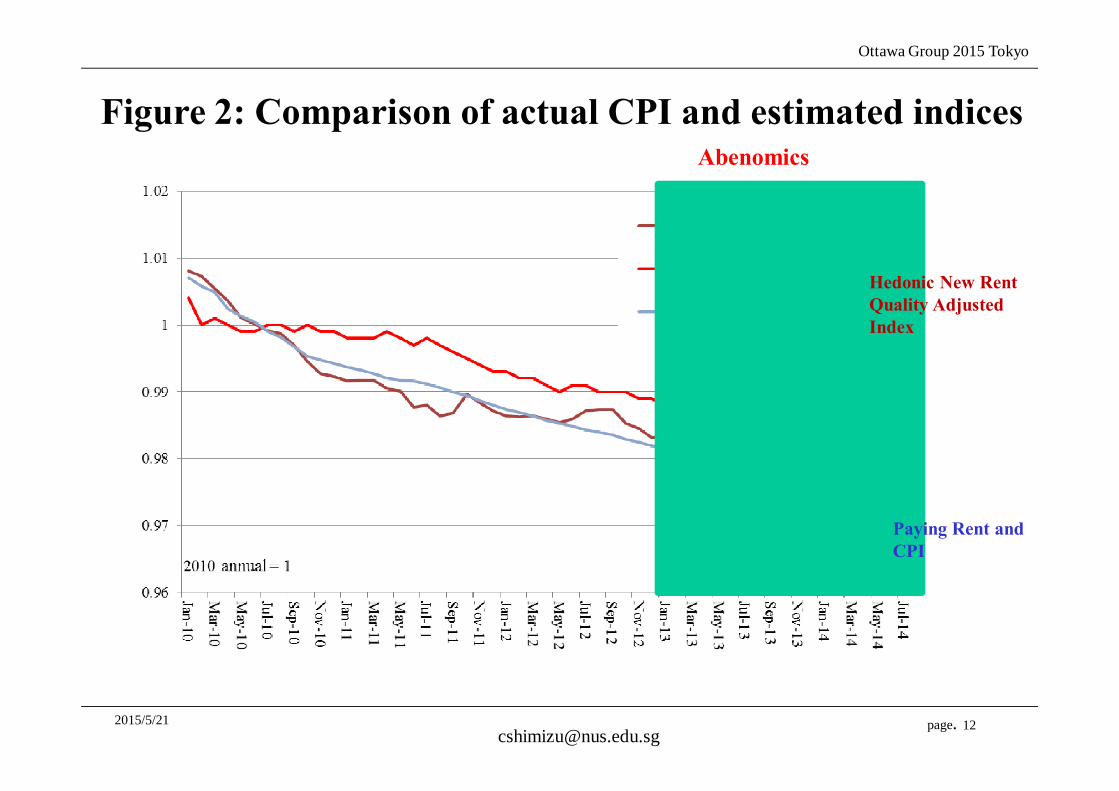
Hedonic estimate Rt*, Actual CPI Rent and Residential Property Prices
2013-: Abenomics
2011.3.11: Earthquake
Ottawa Group 2015 Tokyo
2015/5/21 page.
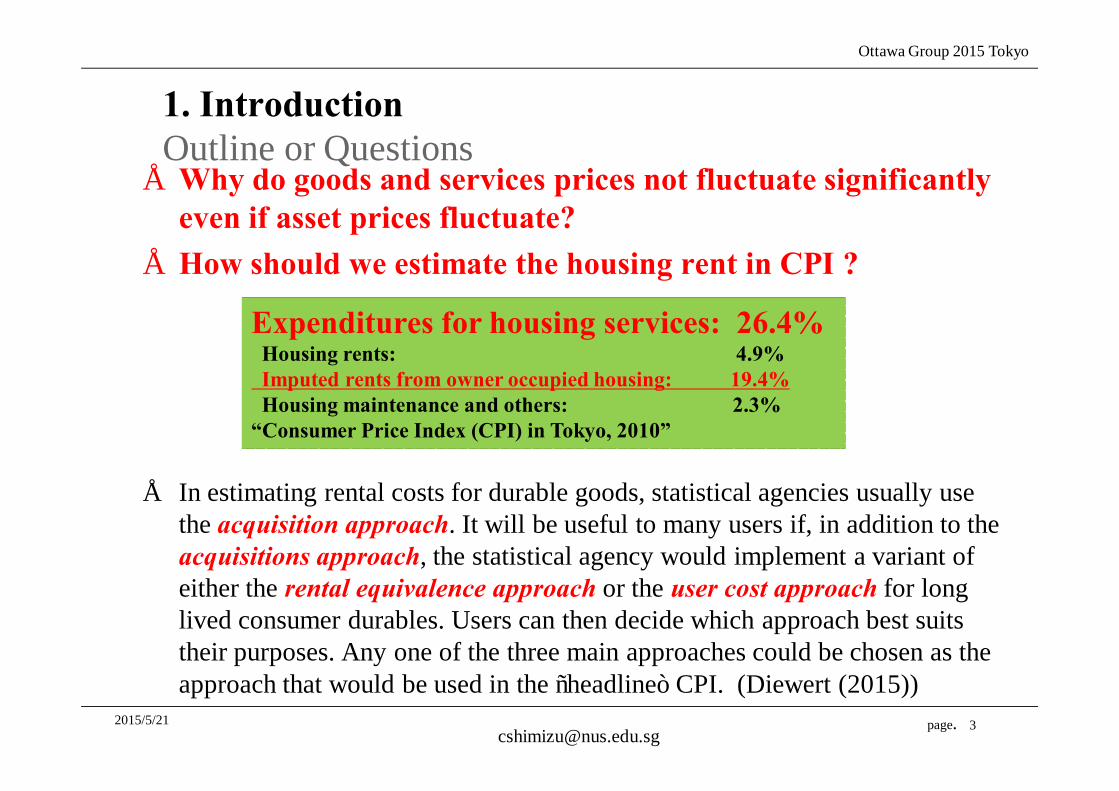
Outline or Questions• Why do goods and services prices not fluctuate significantly
even if asset prices fluctuate?• How should we estimate the housing rent in CPI ?
• In estimating rental costs for durable goods, statistical agencies usually use the acquisition approach. It will be useful to many users if, in addition to the acquisitions approach, the statistical agency would implement a variant of either the rental equivalence approach or the user cost approach for long lived consumer durables. Users can then decide which approach best suits their purposes. Any one of the three main approaches could be chosen as the approach that would be used in the “headline” CPI. (Diewert (2015))
1. Introduction
Expenditures for housing services: 26.4%Housing rents: 4.9%Imputed rents from owner occupied housing: 19.4%Housing maintenance and others: 2.3%
“Consumer Price Index (CPI) in Tokyo, 2010”
Ottawa Group 2015 Tokyo
2015/5/21 page.
Disadvantages of the rental equivalence approach
• Homeowners may not be able to provide very accurate estimates for the rental value of their dwelling unit.
• On the other hand, if the statistical agency tries to match the characteristics of an owned dwelling unit with a comparable unit that is rented in order to obtain the imputed rent for the owned unit, there may be difficulties in finding such comparable units. (Quality adjustment bias)
• The statistical agency should make an adjustment to these estimated rents over time in order to take into account the effects of depreciation. (Depreciation bias)
• Care must be taken to determine exactly what extra services are included in the homeowner’s estimated rent.
Ottawa Group 2015 Tokyo
2015/5/21 page.
Rent Control Bias: “Market Rent” and “Contract rent”
• In addition to the above possible biases in using the rentalequivalence approach to the valuation of the services of OOH,there are differences between “contract rent” and “marketrent”.
• “Contract rent” refers to the rent paid by a renter who has along term rental contract with the owner of the dwelling unitand “market rent” is the rent paid by the renter in the firstperiod after a rental contract has been negotiated.
• If we value the services of an owner occupied dwelling at itscurrent opportunity cost on the rental market, we should beusing market rent rather than contract rent.

Ottawa Group 2015 Tokyo
2015/5/21 page.
Panel data of rental prices
2. Macro-Analysis of Housing Rent

Ottawa Group 2015 Tokyo
2015/5/21 page. 7
Summary Statistics of Housing Rent
Sample periodFrequencyAreaType of dataCoverageProvided byNumber of units
Number of samples
mean s.d. mean s.d. mean s.d.Monthly rent 101,721.2 46,209.7 100,423.7 45,271.9 102,094.6 46,480.0Floor space (m2) 32.4 15.6 32.2 15.6 32.5 15.7Price per m2 3,293.3 788.3 3,271.9 756.8 3,292.8 798.1Age of unit (years) 13.0 9.9 12.3 10.1 13.4 9.8Time to nearest station (min) 5.1 3.8 5.0 3.7 5.2 3.9Time to central business district (min) 12.4 6.4 12.1 6.3 12.5 6.4
52,524All samples
New contracts Rollover contracts1,529,485 36,832 41,117
January 2010 - July 2014Monthly
Tokyo’s wardsPaid rent
New and rollover contractsRecruit

Ottawa Group 2015 Tokyo
2015/5/21 page.
Official Residential Rent Index or CPI Rent
• CPI rent survey districts are selected from enumeration districts of the Population Census by probability sampling. The number of house rent survey districts is 1,221.
• Statistics Bureau of Japan says that about 28,000 households are surveyed (see Annual report on the Retail Price Survey 2013).
• The survey districts are allocated according to scale of sample cities, the Tokyo metropolitan area is allocated 54 districts.
• The survey districts are grouped to three groups and one group is surveyed every 3 months.
• Rent index is calculated separately by 4 classification.-Wooden small house, wooden medium house, non-wooden small house and non-wooden medium house.
Ottawa Group 2015 Tokyo
2015/5/21 page. 9
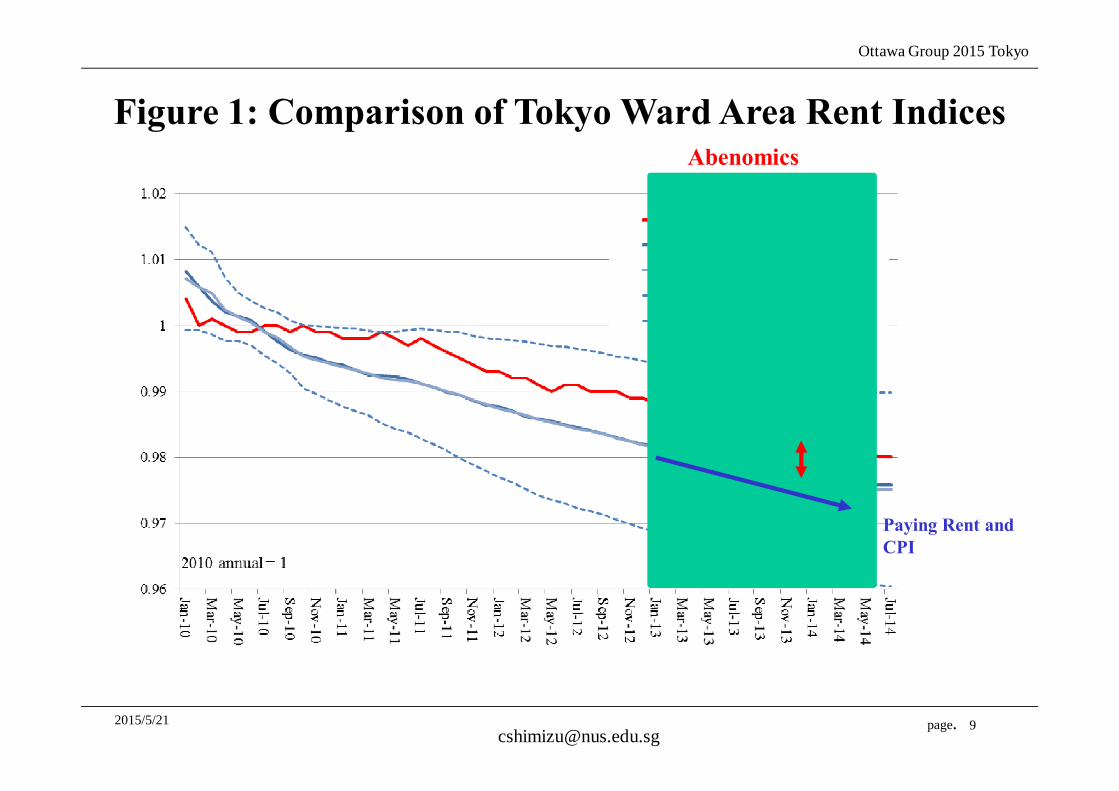
Figure 1: Comparison of Tokyo Ward Area Rent Indices
Paying Rent and CPI
Abenomics

Ottawa Group 2015 Tokyo
2015/5/21 page.
Hedonic estimation for housing rent• We have the price and property-characteristics data of houses,
pooled for all periods t=1,2,...,T , and that the number of datasamples in period t is nt.
• A standard hedonic price index is produced from thefollowing house-price estimation model:
ln Rit= βt xit + εit (1)where Rit is the rent of house i in period t, βt is a vector of parameters associated with residential property characteristics, xit is a vector of property characteristic for house i in period t,and εit is an error term

Ottawa Group 2015 Tokyo
2015/5/21 page.
Hedonic estimation for housing rent• We run rolling regression using new housing rent with T =12.
EstimationWindow Floor space
Age ofbuilding
Time tonearest station
Commutingtime to CBD Adjusted R2 Number of
observations
201001 - 201012 0.0188 -0.0109 -0.0087 -0.0058 0.917 17,697201002 - 201101 0.0188 -0.0109 -0.0088 -0.0058 0.916 16,707201003 - 201102 0.0188 -0.0109 -0.0089 -0.0059 0.917 15,670201004 - 201103 0.0188 -0.0110 -0.0090 -0.0059 0.917 14,504201005 - 201104 0.0188 -0.0110 -0.0092 -0.0058 0.916 13,303201006 - 201105 0.0189 -0.0111 -0.0094 -0.0058 0.915 11,684201007 - 201106 0.0189 -0.0112 -0.0096 -0.0060 0.914 10,667201008 - 201107 0.0190 -0.0114 -0.0097 -0.0062 0.916 9,942201009 - 201108 0.0189 -0.0115 -0.0095 -0.0065 0.918 9,099201010 - 201109 0.0190 -0.0114 -0.0099 -0.0065 0.919 8,346201011 - 201110 0.0191 -0.0113 -0.0104 -0.0067 0.922 7,571201012 - 201111 0.0191 -0.0113 -0.0105 -0.0066 0.924 6,698201101 - 201112 0.0191 -0.0114 -0.0104 -0.0067 0.924 6,490201102 - 201201 0.0192 -0.0114 -0.0104 -0.0067 0.927 6,446201103 - 201202 0.0192 -0.0113 -0.0101 -0.0065 0.927 6,485201104 - 201203 0.0192 -0.0113 -0.0102 -0.0067 0.927 6,564201105 - 201204 0.0194 -0.0113 -0.0099 -0.0071 0.928 6,664201106 - 201205 0.0194 -0.0112 -0.0096 -0.0075 0.929 6,782201107 - 201206 0.0194 -0.0110 -0.0095 -0.0074 0.927 6,788201108 - 201207 0.0193 -0.0110 -0.0096 -0.0071 0.925 6,880201109 - 201208 0.0193 -0.0109 -0.0098 -0.0068 0.923 6,887201110 - 201209 0.0191 -0.0109 -0.0096 -0.0071 0.922 6,913201111 - 201210 0.0191 -0.0110 -0.0096 -0.0072 0.922 6,920201112 - 201211 0.0192 -0.0110 -0.0094 -0.0074 0.922 6,988201201 - 201212 0.0191 -0.0109 -0.0091 -0.0075 0.922 6,963201202 - 201301 0.0189 -0.0109 -0.0091 -0.0072 0.918 6,968201203 - 201302 0.0188 -0.0109 -0.0091 -0.0076 0.918 7,000201204 - 201303 0.0188 -0.0108 -0.0093 -0.0076 0.918 7,012201205 - 201304 0.0187 -0.0109 -0.0097 -0.0073 0.917 6,939201206 - 201305 0.0186 -0.0109 -0.0098 -0.0071 0.916 6,785201207 - 201306 0.0186 -0.0110 -0.0098 -0.0071 0.917 6,725201208 - 201307 0.0186 -0.0110 -0.0098 -0.0073 0.918 6,526201209 - 201308 0.0186 -0.0110 -0.0097 -0.0075 0.918 6,409201210 - 201309 0.0187 -0.0110 -0.0097 -0.0074 0.918 6,260201211 - 201310 0.0186 -0.0110 -0.0098 -0.0073 0.916 6,179201212 - 201311 0.0186 -0.0110 -0.0099 -0.0073 0.916 6,028201301 - 201312 0.0187 -0.0110 -0.0105 -0.0075 0.915 5,869201302 - 201401 0.0189 -0.0109 -0.0107 -0.0078 0.918 5,718201303 - 201402 0.0191 -0.0108 -0.0110 -0.0077 0.918 5,530201304 - 201403 0.0190 -0.0108 -0.0109 -0.0075 0.919 5,389201305 - 201404 0.0191 -0.0107 -0.0109 -0.0075 0.918 5,288201306 - 201405 0.0192 -0.0106 -0.0112 -0.0077 0.918 5,273201307 - 201406 0.0191 -0.0105 -0.0114 -0.0077 0.916 5,206201308 - 201407 0.0192 -0.0104 -0.0113 -0.0079 0.915 5,225
Average 0.0190 -0.0110 -0.0099 -0.0070 0.9196 7,863
Ottawa Group 2015 Tokyo
2015/5/21 page. 12
Figure 2: Comparison of actual CPI and estimated indicesAbenomics
Paying Rent and CPI
Hedonic New Rent Quality Adjusted Index
Ottawa Group 2015 Tokyo
2015/5/21 page. 13
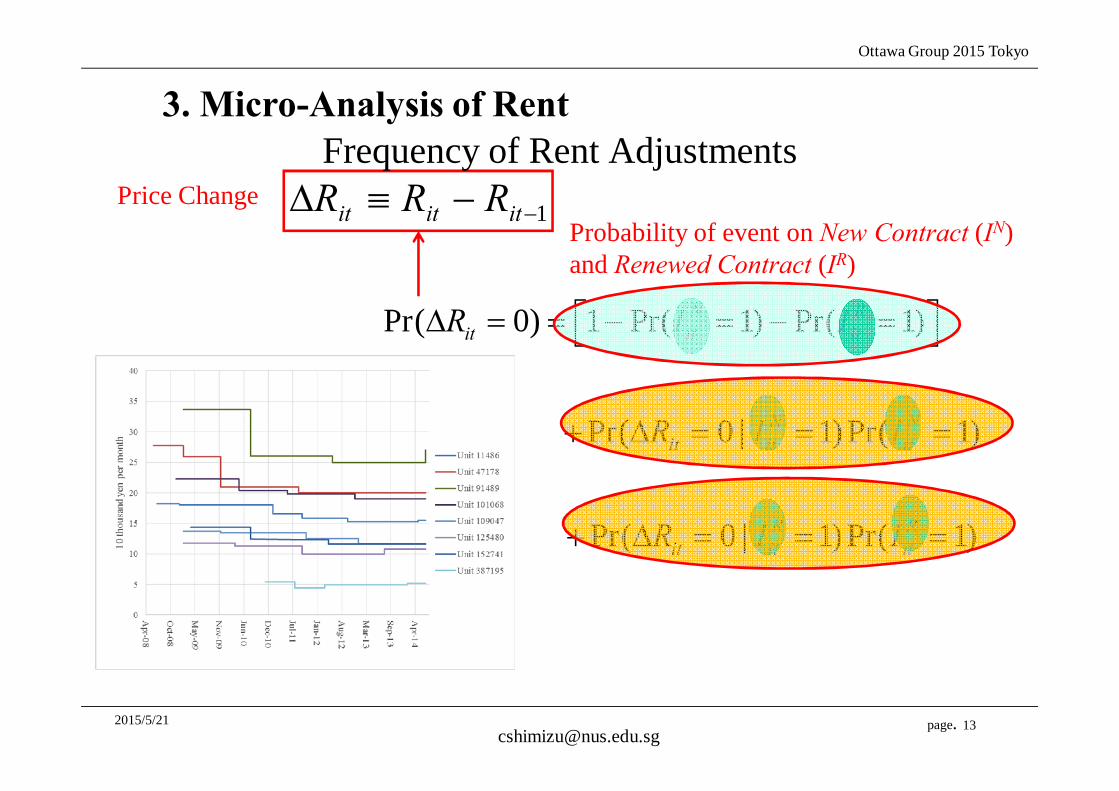
Pr( 0) 1 Pr( 1) Pr( 1)
Pr( 0 | 1)Pr( 1)
Pr( 0 | 1)Pr( 1)
it
it
Nit
Rit
R Rit
N Nit i
it
t
it
I
I I
R
R
I
IR I
∆ = = − = − =
+ ∆ = = =
+ ∆ = = =
1−−≡∆ ititit RRRFrequency of Rent Adjustments
Price ChangeProbability of event on New Contract (IN) and Renewed Contract (IR)
3. Micro-Analysis of Rent
Ottawa Group 2015 Tokyo
2015/5/21 page.
Rent decreased
Rent unchanged
Rent increased Total (Rent
change)Changes
accompanying new contracts
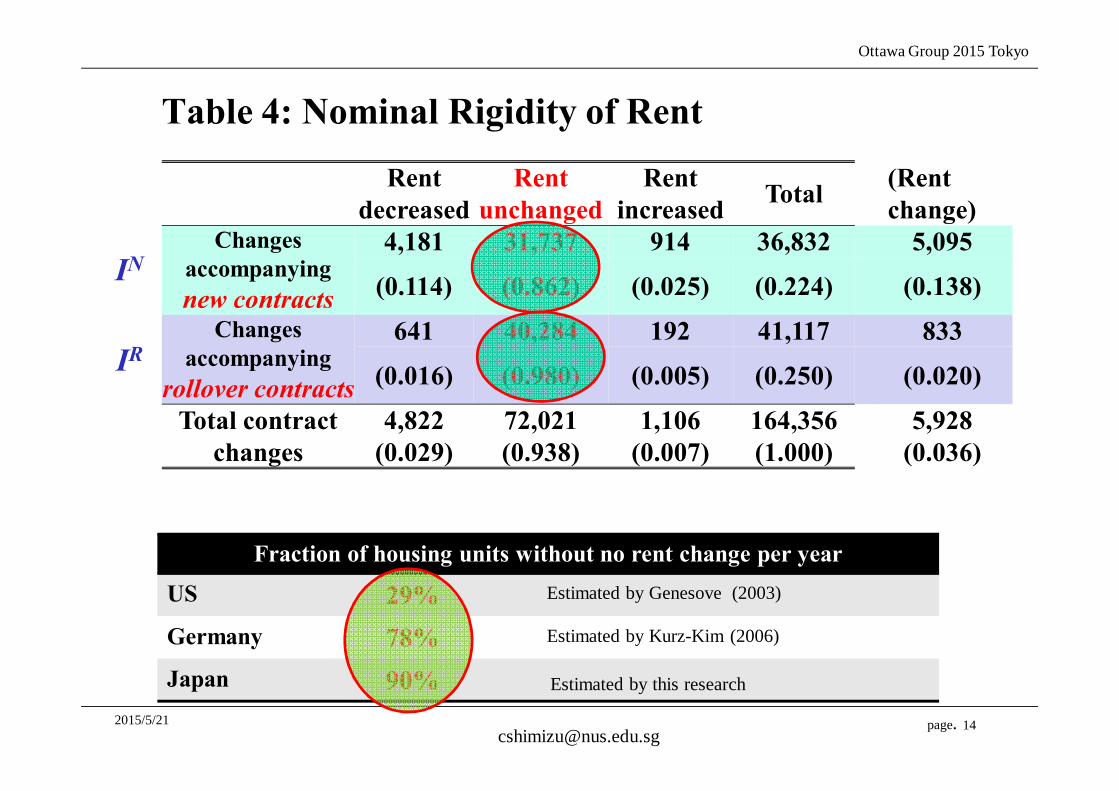
4,181 31,737 914 36,832 5,095
(0.114) (0.862) (0.025) (0.224) (0.138)Changes
accompanying rollover contracts
641 40,284 192 41,117 833
(0.016) (0.980) (0.005) (0.250) (0.020)
Total contract changes
4,822 72,021 1,106 164,356 5,928(0.029) (0.938) (0.007) (1.000) (0.036)
Table 4: Nominal Rigidity of Rent
14
Fraction of housing units without no rent change per year
US 29%Germany 78%Japan 90%
Estimated by Genesove (2003)
Estimated by Kurz-Kim (2006)
Estimated by this research
IN
IR

Ottawa Group 2015 Tokyo
2015/5/21 page.
Probability of No Rent Adjustments in New Contracts : 2010-2014
Figure 3: Monthly Changes in Nominal Rigidity of Rent
Ottawa Group 2015 Tokyo
2015/5/21 page. 16
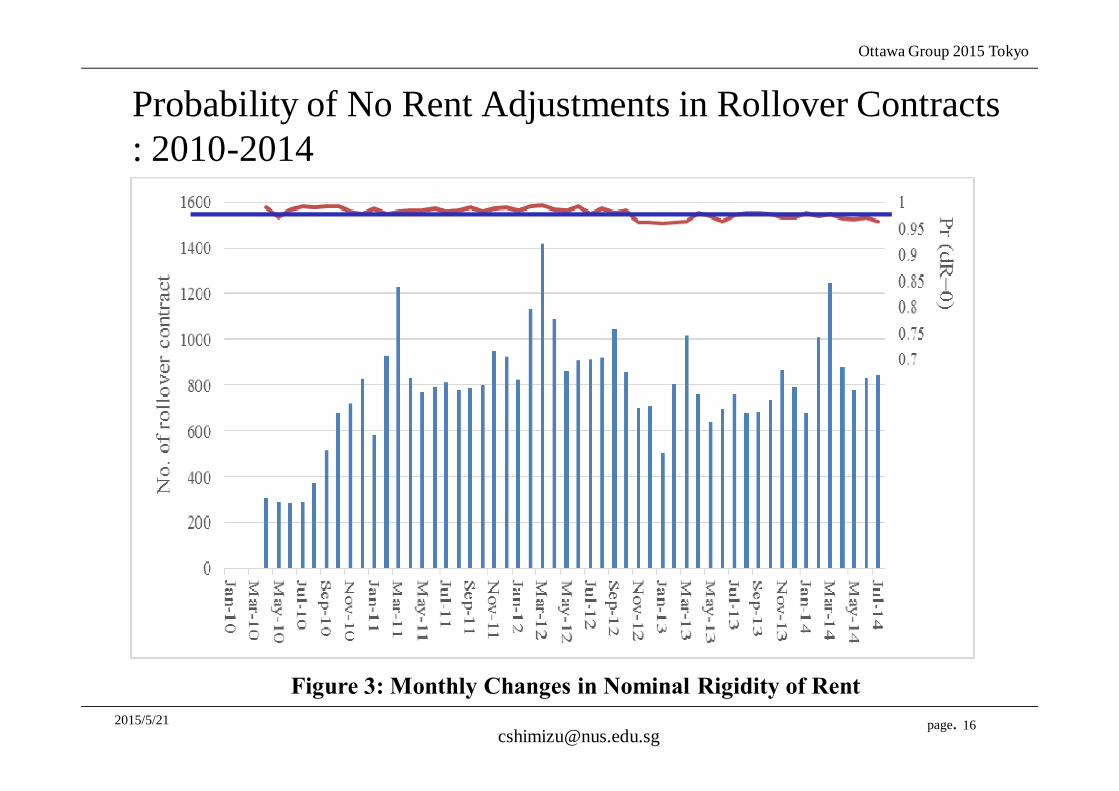
Probability of No Rent Adjustments in Rollover Contracts : 2010-2014
Figure 3: Monthly Changes in Nominal Rigidity of Rent
Ottawa Group 2015 Tokyo
2015/5/21 page.
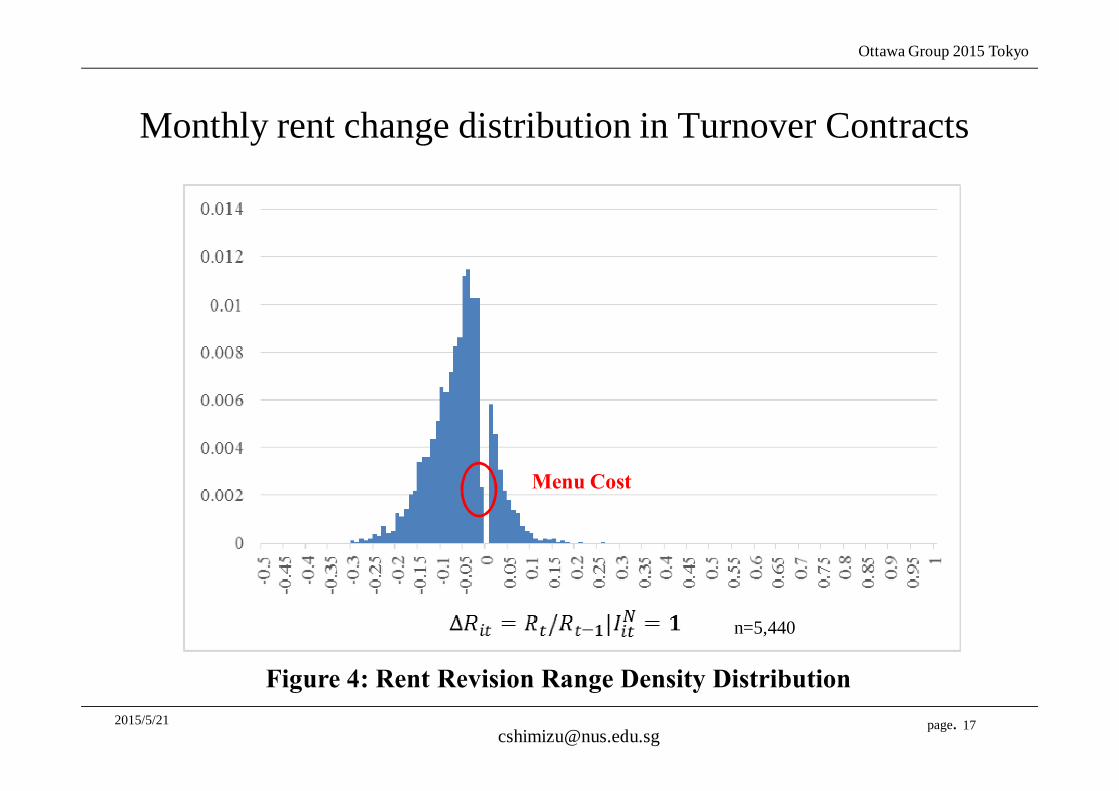
Monthly rent change distribution in Turnover Contracts
17
n=5,440
Menu Cost
Figure 4: Rent Revision Range Density Distribution

Ottawa Group 2015 Tokyo
2015/5/21 page.
Monthly rent change distribution in Rollover Contracts
18
n=18,582,863
Menu Cost
Figure 4: Rent Revision Range Density Distribution

Ottawa Group 2015 Tokyo
2015/5/21 page. 19
State-Dependent or Time-Dependent Pricing:Caballero-Engel’s definition of price flexibility
∫ ∫ Λ+Λ=∆
∆
=≠∆≡Λ−≡
+∆=∆
→∆
−
dxxhxxdxxhxR
xXRxRRX
R
t
t
itit
ititit
ittit
t
)()(' )()( loglim
)|0Pr()( loglog
log
0
*1
*
ξ
νξ
ξ
)|1Pr(),1|0Pr(
)|1Pr(),1|0Pr( )(
xXIxXIR
xXIxXIRx
itRitit
Ritit
itNitit
Nitit
====≠∆+
====≠∆=Λ
Intensive margin Extensive marginCaballero-Engel’smeasure of price flexibility
Caballero-Engel(1993)
:Adjustment Hazard Function
Caballero-Engel(2007)
Target Rent Level
Price GapProbability of rent adjustments

Ottawa Group 2015 Tokyo
2015/5/21 page.
Distribution of Price Gap in New Contract
Figure 5: Price Gap Distribution

Ottawa Group 2015 Tokyo
2015/5/21 page.
Distribution of Price Gap in Renewed Contract
Figure 5: Price Gap Distribution
Ottawa Group 2015 Tokyo
2015/5/21 page.
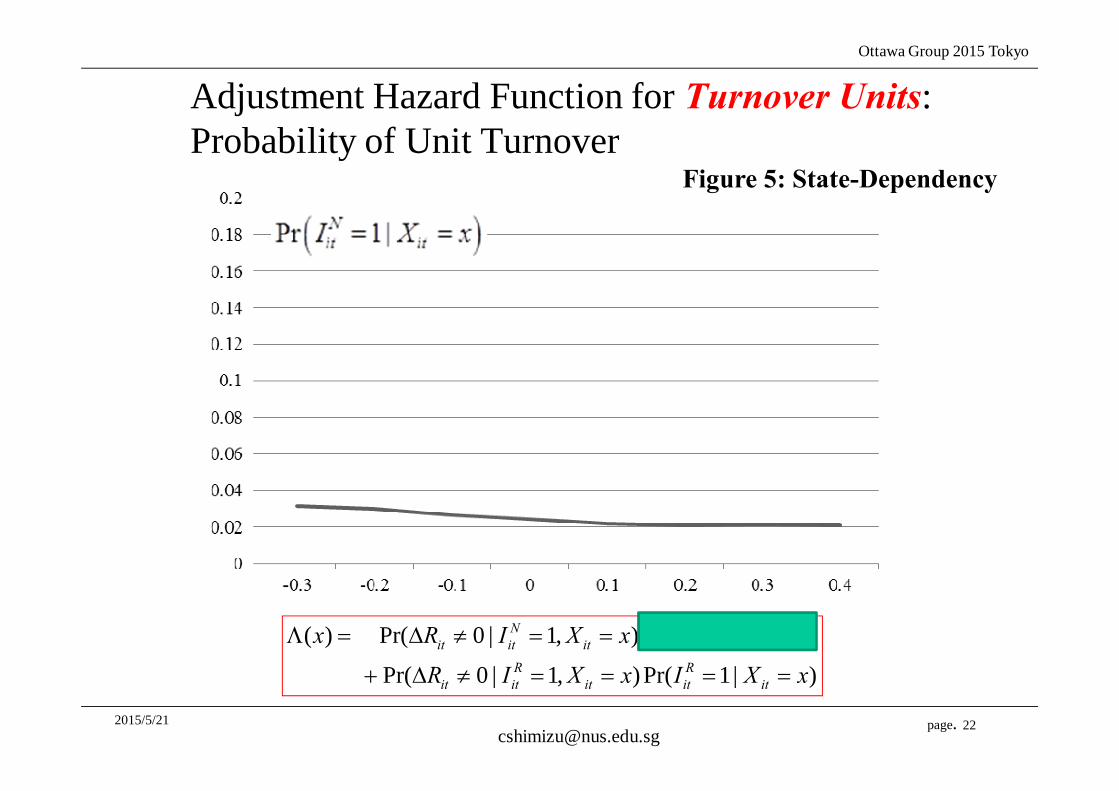
Adjustment Hazard Function for Turnover Units:Probability of Unit Turnover
22
( ) Pr( 0 | 1, ) Pr( 1| )
Pr( 0 | 1, )Pr( 1| )
N Nit it it it it
R Rit it it it it
x R I X x I X x
R I X x I X x
Λ = ∆ ≠ = = = =
+ ∆ ≠ = = = =
Figure 5: State-Dependency

Ottawa Group 2015 Tokyo
2015/5/21 page.
Adjustment Hazard Function for Turnover Units
23
( ) Pr( 0 | 1, ) Pr( 1| )
Pr( 0 | 1, )Pr( 1| )
N Nit it it it it
R Rit it it it it
x R I X x I X x
R I X x I X x
Λ = ∆ ≠ = = = =
+ ∆ ≠ = = = =
Figure 5: State-Dependency

Ottawa Group 2015 Tokyo
2015/5/21 page.
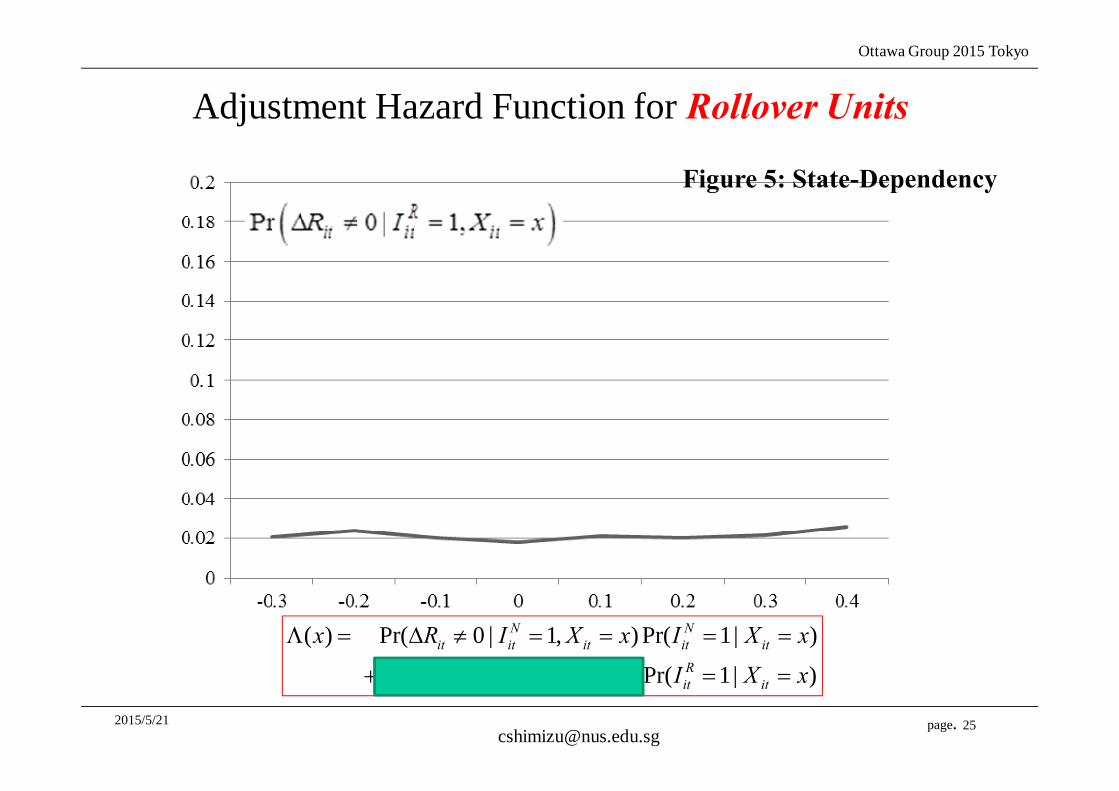
Adjustment Hazard Function for Rollover Units
24
( ) Pr( 0 | 1, ) Pr( 1| )
Pr( 0 | 1, )Pr( 1| )
N Nit it it it it
R Rit it it it it
x R I X x I X x
R I X x I X x
Λ = ∆ ≠ = = = =
+ ∆ ≠ = = = =
Figure 5: State-Dependency
Ottawa Group 2015 Tokyo
2015/5/21 page.
Adjustment Hazard Function for Rollover Units
25
( ) Pr( 0 | 1, ) Pr( 1| )
Pr( 0 | 1, )Pr( 1| )
N Nit it it it it
R Rit it it it it
x R I X x I X x
R I X x I X x
Λ = ∆ ≠ = = = =
+ ∆ ≠ = = = =
Figure 5: State-Dependency

Ottawa Group 2015 Tokyo
2015/5/21 page.
∫ =Λ 055.0)()( dxxhx
∫ =Λ 00580.0)()(' dxxhxx
Intensive margin:
Extensive margin:
Caballero-Engel’s measure of price flexibility0.050
26
Adjustment Hazard Functions
0607.0loglim0
=∆
∆→∆
t
tRt ξξ
0.035 0.029 0.023 0.021
0.006 0.026 0.028 0.027
0.131 0.134 0.138 0.137
0.015 0.022 0.020 0.021
0.005 0.004 0.004 0.003
0.039 0.569 0.337 0.047
( )Pr 1 |Nit itI X x= =
( )Pr 1|Rit itI X x= =
( )Pr 0 | 1,Nit it itR I X x∆ ≠ = =
( )Pr 0 | 1,Rit it itR I X x∆ ≠ = =
( )xΛ
( )h x
� ∈ �0.0,0.2�� ∈ ��0.4, �0.2� � ∈ ��0.2,0.0� � ∈ �0.2,0.4�
0.0081 0.0581
Table 5: Summary of Estimation Results

Ottawa Group 2015 Tokyo
2015/5/21 page. 27
Summary in “Sticky Housing Rent”
1. About ninety percent of the units in our dataset had no change in rents per year, indicating that rent stickiness is three times as high as in the US.
2. The probability of rent adjustment depends little on the deviation of the actual rent from its target level, suggesting that rent adjustments are not state dependent but time dependent.
3. These two results indicate that both intensive and extensive margins of rent adjustments are small, resulting in a slow response of the CPI rent to aggregate shocks.

Ottawa Group 2015 Tokyo
2015/5/21 page.
4. Re-estimation of CPIHow should we estimate CPI more linked to asset price developments?
• We have seen in the previous sections that the probability of individual rent adjustments is very low and that it depends little on price imbalances.
• These two facts imply that price flexibility in terms of the impulse response function is low, thus causing the CPI for rent to respond only slowly to aggregate shocks.
• We simplify the model.• We replace the imputed rent for owner-occupied housing in
the CPI by our estimate of the market rent R*.• We also replace the imputed rent for OOH by our estimate of
the depreciation adjusted rent R-age.28

Ottawa Group 2015 Tokyo
2015/5/21 page. 29
2007-2009: the Financial Crisis
Figure 7: Hedonic estimate Rt*, R-age and Actual CPI
2013-: Abenomics

Ottawa Group 2015 Tokyo
2015/5/21 page. 30
2007-2009: the Financial Crisis
2013-: Abenomics
Figure 8: Reestimates of CPI inflation under Rent for OOH replaced by Rt* and R-age

Ottawa Group 2015 Tokyo
2015/5/21 page.
5. Conclusions:
• Goods and services prices, as represented by consumer price indexes and the like, have not changed all that much in response to fluctuations in asset prices.
• In particular, there was no major change in goods and services prices even during the significant rise in asset prices that was one of the factors leading to the global financial crisis and subsequent decline in such prices. This lack of correlation means that business cycle management via financial policy is difficult.
• Focusing on rents, which are an important connecting point between asset market and goods and services market, we attempted to measure housing rent for Japan.
Ottawa Group 2015 Tokyo
2015/5/21 page.
5. Conclusions:
• Depreciation Bias:• The Japanese rent index has a downward bias due to the
neglect of depreciation. In other words, the actual CPI holds a strong downward bias due to the neglect of this “aging depreciation”: approximately 1.1 percent per year.
• Strong rigidity of price changes bias:• While rents based on new contracts change in an elastic
manner, actual paid rents change only gradually, even when market shocks occur.
• Average market rents, which are representative of consumer prices, have a strong tendency to change in a random manner, independently of changes in rents determined freely by the market.

Ottawa Group 2015 Tokyo
2015/5/21 page.
5. Conclusions:
• the United Nations, IMF, OECD, BIS, and ILO have jointly put together international handbook on residential property price indices (RPPI).
• RPPI will be new important indicators for policy makers.
• Going forward, it will likely be necessary to clarify the relationship between asset price fluctuations and rent (or good and services) fluctuations.

Ottawa Group 2015 Tokyo
2015/5/21 page.
Population decline and Vacant rate bias
2013 2008 2003 1998
Total 14.1% 13.9% 13.0% 12.6%
Owner Occupied Housing 9.8% 9.1% 7.8% 6.0%
(on Sale) 0.9% 1.0% 1.0% -
(others) 8.9% 8.0% 6.8% 6.0%
Rental Housing 18.8% 18.8% 17.6% 17.0%


