
Live tracking fALS SOD1 quaternary structure
1
Dimerization, oligomerization, and aggregation of human Amyotrophic lateral sclerosis Cu/Zn-superoxide dismutase 1 mutant forms in live cells*
Jiho Kim (김지호) †, Honggun Lee (이홍근) †, Joo Hyun Lee (이주현), Do-yoon Kwon
(권도윤), Auguste Genovesio, Denis Fenistein, Arnaud Ogier, Vincent Brondani and Regis Grailhe.
From Neurodegeneration and Applied Microscopy, Institut Pasteur Korea, Seongnam-Si,
Gyeonggi-Do 463-400, Republic of Korea
*Running title: live tracking fALS SOD1 quaternary structure †These authors contributed equally to this work To whom correspondence should be send: Regis Grailhe, Neurodegeneration and Applied
Microscopy, Institut Pasteur Korea, Seongnam-Si, Gyeonggi-Do 463-400, Republic of Korea, Tel.:
+82-31-8018-8260; Fax: +82-31-8018-8213; E-mail: [email protected]
Keywords: Protein aggregation, Superoxide dismutase (SOD), Mutant, Protein misfolding, Fluorescence resonance energy transfer (FRET), Fluorescence correlation spectroscopy
Background: Cu/Zn-superoxide dismutase
(SOD1) genetic mutants are associated with
familial Amyotrophic lateral sclerosis
(ALS). Mutant proteins form abnormal
aggregates.
Results: We used imaging of live cells to
observe SOD1 proteins, harboring mutations
associated with ALS.
Conclusion: SOD1 Mutations impair its
dimerization leading subsequent
aggregation.
Significance: Analysis of SOD1 quaternary
structure in living human cells correlate with
previous biochemical data.
ABSTRACT
More than one hundred Cu/Zn-
superoxide dismutase 1 (SOD1) genetic
mutations have been characterized; these
mutations lead to the death of motor
neurons in amyotrophic lateral sclerosis
(ALS). In its native form, the SOD1
protein is expressed as a homo-dimer in
the cytosol. In vitro studies have shown
that SOD1 mutations impair the
dimerization kinetics of the protein, and in
vivo studies have shown that SOD1 forms
aggregates in patients with familial forms
of ALS. In the present study, we analyzed
wild type (wt) SOD1 and 9 mutant (mt)
forms of the protein by non-invasive
fluorescence techniques. Using
microscopic techniques such as
fluorescence resonance energy transfer,
fluorescence complementation, images
based quantification and fluorescence
correlation spectroscopy, we studied
SOD1 dimerization, oligomerization, and
aggregation. Our results indicate that
SOD1 mutations lead to an impairment in
SOD1 dimerization and subsequently
affect protein aggregation. We also show
that SOD1 wt and mt proteins can
dimerize, however aggregates are
predominantly composed of SOD1 mt
proteins.
ALS is a progressive
neurodegenerative disorder caused by the
degeneration of motor neurons. Most cases of
ALS are sporadic (sALS), however
approximately 10% are familial (fALS).
One-quarter of fALS cases are inherited due
to mutations in the sod1 gene, which encodes
an enzyme responsible for scavenging free
radicals [1]. The fALS disorder is primarily a
heterozygous genetic condition. More than
140 point mutations have been found in the
SOD1 peptide sequence
http://www.jbc.org/cgi/doi/10.1074/jbc.M113.542613The latest version is at JBC Papers in Press. Published on April 1, 2014 as Manuscript M113.542613
Copyright 2014 by The American Society for Biochemistry and Molecular Biology, Inc.
by guest on June 24, 2018http://w
ww
.jbc.org/D
ownloaded from

Live tracking fALS SOD1 quaternary structure
2
(http://alsod.iop.kcl.ac.uk/Als/). Differences
in the Sod1 gene mutations are associated
with variability in the onset and duration of
the disease [2]. A notable exception is A4V,
the mutation that is frequently observed in
fALS pedigrees. This mutation is
consistently associated with a highly
penetrant, early onset, rapidly progressing
form of the disease [3]. It is widely accepted
that the pathology of ALS does not arise from
a loss of SOD1 activity [4], but rather, from a
dominant gain-of-function effect. Although a
variety of reasons for this toxicity have been
proposed, the structural instability of the
SOD1 mt [5] and the presence of SOD1-
containing aggregates in neurons [6], as well
as in animal models [7] strongly suggest that
the observed “aggresomes” are composed of
misfolded SOD1 proteins [8] and may play a
causal role in the disease.
In vitro studies have shown that the
SOD1 mutation carried in fALS patients,
results in altered tertiary structure which
impairs SOD1 dimer formation [9]. Some
mutations involve a conformational change
which induces protein aggregation as a result
of formation of intermolecular disulfide
bonds between the cysteine residues at
positions 6 and 111 [10]. SOD1 protein
ubiquitination is catalyzed by the Dorfin [11]
or E6-AP [12] ubiquitin ligases, and
promotes degradation of specific SOD1
aggregates. It is likely that SOD1 aggregation
and ubiquitination are connected, since any
change in the SOD1 quaternary structure
modifies the SOD1-SOD1 interface thereby
affecting the kinetics of dimer formation. It
should be noted that in vitro study conditions,
such as protein concentration and
environment, are very different from those
that occur in vivo. Therefore, in this study, we
set out to assess the effects of the SOD1 fALS
pathological mutations on dimerization,
oligomerization, and aggregation within the
cellular context, using non-invasive methods.
We applied several imaging approaches to
study SOD1 dimer formation, namely
fluorescence lifetime imaging microscopy
(FLIM), fluorescence correlation
spectroscopy (FCS) and the use of
bimolecular fluorescence complementation
(BiFC) [13]. We analyzed nine fALS
mutations to study SOD1 dimerization. We
further showed the formation of aggregates,
the co-localization of wt and mt SOD1
proteins, and their cellular diffusion
properties. Our results clearly define the
effects of SOD1 mutations on SOD1 protein
dimerization and aggregation in the cellular
context.
EXPERIMENTAL PROCEDURES
Plasmid constructs
Human superoxide dismutase 1
(sod1) cDNA (Origene, Abingdon, UK
SC111022) was cloned into the mammalian
expression vectors pEYFP-C1/N1 and
pECFP-C1/N1 (Clontech, BD Biosciences).
We used an improved form of CFP that
contained an aspartic acid substituted for a
histidine residue at position 148, resulting in
increased fluorescence lifetime and quantum
yield. This modification improved the
fluorescence energy transfer when combined
with YFP. The sod1 mutations A4V, G37R,
H46R, G85R, D90A, G93A, G93C, I104F
and I113T were generated using PCR-based
site-directed mutagenesis (QuikChange®
Multi Site-Directed Mutagenesis Kit,
Stratagene).
The mutant sod1 derivatives studied in this
work were selected by the following criteria:
A4V (short survival; 1.4 ± 0.9 years) is
located at the dimerization interface and is
the most frequent mutation in the U.S.A [3];
G37R (long survival) is a gain-of-charge
substitution in a beta strand [14]; H46R is
located in a beta strand and causes loss of
copper binding in the active site of SOD1,
and is the most frequent mutation in Japan
(long survival: 17.2 ± 7.2 years) [15;16];
G85R (medium survival: 6.0 ± 4.5 years) is a
gain-of-charge mutation in a beta strand [2];
D90A (sensory prodromal for months to
years; only homozygous; long survival: 14.2
± 7.0 years) is a loss-of-charge substitution
located at the protein surface [17]; G93A
(short survival: 2.3 ± 1.5 years) and G93C
(long survival) are modifications at a surface-
exposed beta strand, G93A has been
extensively studied because it was the first
by guest on June 24, 2018http://w
ww
.jbc.org/D
ownloaded from

Live tracking fALS SOD1 quaternary structure
3
SOD1 fALS mouse model [18].; I104F is a
mutation to an aromatic amino acid in an
alpha helix (long survival: 13 ± 1 years) [1];
and I113T (which can progress rapidly 3.6 ±
2.6 years) is a mutation located at the
dimerization interface [3]. For the BiFC
assay, the YFP (1-238) sequences encoding
amino acid residues 1-172 (YN172) and
155−238 (YC155) were fused in frame
upstream and downstream of the coding sod1
sequence, respectively, with a flexible linker
sequence (GGGGSGGG). All constructs
were confirmed by sequencing.
Cell culture
HEK 293 cells were maintained in
Dulbecco's modified Eagle's medium
supplemented with 10% fetal bovine serum,
100 units/ml penicillin, and 0.1 mg/mL
streptomycin. Transient transfections with
mammalian expression plasmids encoding
for the fusion proteins were performed using
Fugene 6 transfection reagent (Roche
Applied Science). The cells were cultivated
with 10 µg/mL ALLN (Calbiochem) for
aggregate quantification.
Fluorescence lifetime imaging microscopy
(FLIM)
We used FLIM to quantify SOD1
dimerization. The FLIM data were obtained
with a Leica TCS SP2 microscope equipped
with a FLIM SPC830 module from Becker
and Hickl. The fluorescence lifetime
profile of HEK 293 cells expressing the
CFP proteins was quantified using time-
correlated single photon counting
(TCSPC). The FRET efficiency was
calculated from the lifetime of CFP in the
absence and presence of acceptor
molecules. The decay profile of CFP was
fitted to a single-exponential curve
according to the mono-exponential
property of the H148D variant form of CFP
[19]. Samples co-expressing SOD1-wt and
mutant forms tagged with CFP or YFP,
respectively, were excited by a pulsed diode
laser operated at a repetition rate of 40 MHz
at 405 nm. The emitted light was collected
through an emission filter set to selectively
transmit between 470 nm and 500 nm. For the
statistical analysis, at least 60 cell images
were collected for the SOD1 wt and mutant
constructs. Importantly, we avoided cell
aggregates during this analysis so that we
could exclusively quantify SOD1
dimerization. To monitor the fluorescence
intensity of the CFP and YFP, we used fixed
settings including laser intensity, photo-
muliplicator (PMT) level, and pinhole size.
For the statistical analysis, over 30 images
were collected for each donor-acceptor
combination. The images were analyzed as
described previously [20]. The correlation
between FRET measurements and the ratio
of YFP/CFP intensity is reported for each
sample of cells analyzed. Because of the
experimental setting, the FLIM mean value
(in ns) does not accurately reflect the
magnitude of the interaction. The linear
regression and variance of the slope was
calculated. Since some of the mutant
analysis was rejected based on significance
(R square <0.3), the values are used to
estimate the interaction by comparison with
the wild type. Values near 0.00 reflect the
absence of interaction and SOD1
dimerization.
Fluorescence complementation (BiFC)
We established BiFC-stable cell
lines expressing constructs encoding wt and
mutant forms of SOD1, which were fused to
complementary fluorescent protein
fragments. These were established by two
successive rounds of transfection. First,
SOD1 wt and mutant DNA sequences fused
to the complementary fluorescent protein
fragment were introduced together. As a
control for the expression level, we
established a cell line constitutively
expressing the mCherry protein, prior to
imaging, the transfected cells were incubated
at 37°C for 24 h and then switched to 30°C
for 0 to 24 h to promote fluorophore
maturation. For detection of the the BiFC
constructs, we used confocal excitation of
488 nm and 532 nm wavelengths. Emission
at 535 nm was detected using a camera. A
20×/0.7 NA water immersion lens was used
for these experiments.
by guest on June 24, 2018http://w
ww
.jbc.org/D
ownloaded from
Live tracking fALS SOD1 quaternary structure
4
Imaging quantification
To quantify fluorescent and texture
of our images, we used Image Mining, a
custom-made image processing and analysis
application with an extendable “plug-in”
infrastructure [21]. The cells were segmented
using a previously described sequence of
processing steps [22]. Then, based on the
cellular segmentation (total intensity), the
fluorescence intensity was measured and
averaged.
FCS instrumentation
FCS measurements were performed
at room temperature with an FCS extension
attached to a Leica TCS SP2 AOBS confocal
laser scanning microscope (Leica
Microsystems, Manheim, Germany). For
YFP excitation, we used the 514 nm line of
the Argon laser. The excitation beam was
focused onto the sample through a HCX PL
Apo CS 63x1.2 water-immersion objective.
The fluorescence was collected by the same
objective, separated from the excitation light
by a dichroic mirror, and sent onto the
avalanche photodiode. The pinhole size was
set as one airy unit depending on the
objective type for all measurements. The
YFP emission was selectively collected
through a 535-585 nm band-pass filter.
Images of single cells expressing each cDNA
were taken prior to the actual FCS
measurement. The laser beam was then
focused at a selected spot within the
cytoplasm, and FCS measurements were
taken for 100 s. The autocorrelation curves
were acquired, processed and evaluated using
the Leica/ISS FCS software.
FCS data analysis
The autocorrelation function, G(),
for the FCS experiment was calculated from
the photon counts using the equation
G(τ) =< 𝛿𝐹(𝑡) ∙ 𝛿𝐹(𝑡 + ) >
< 𝐹(𝑡) >2
Where, F(t) represents the detected photon
counts at time t that is the lag time. The angle
brackets represent the time average. The
normal three-dimensional diffusion could be
fitted using the equation
G(τ) = 1 +1
𝑁(1 +
𝜏𝐷)−1 ∙ (1 + 𝑆2 ∙
𝜏
𝜏𝐷)−
12
Where N is the average number of fluorescent
particles in the observation volume defined
by the radius ro and length 2zo, and S is the
structure parameter representing the ratio
(ro/zo). The diffusion time of YFP expressed
in the HEK 293 cell as a standard sample and
the characteristic diffusion time was
determined to be approximately 500 s,
which is approximately 10 times slower than
in solution.
RESULTS
Analysis of SOD1 complexes using
YFP/CFP FRET and FLIM
To analyze SOD1 dimerization
properties in live cells, we developed a FRET
strategy by fusing SOD1 proteins to the N- or
C-termini of CFP and YFP, co-expressed
them, and used FLIM to quantify interactions
between SOD1 protein monomers. Our
approach allowed us to discriminate between
the CFP fluorescence and the FRET signal
(Fig. 1A). The SOD1 dimer proteins,
including the wt and/or G93A mutant form,
are depicted in Figure 1B.
To confirm that wt SOD1-expressing
cells used for the FRET analysis did not
contain SOD1 aggregates in their cytosol, we
analyzed cells expressing only the C-terminal
SOD1-CFP fusion as a negative control
(Control panel). The results (Fig. 1B, bottom
panel), presented as lifetime (ns), show that
the strongest FRET signal was obtained in
cells expressing the N-terminal/C-terminal
SOD1 fusion protein (Panel 3). We observed
a FRET signal with the wt SOD1 protein but
not with the G93A mutant and the negative
control. Figure 1C shows that the wt protein
(left panel) has a shorter lifetime distribution
in the cell than the G93A mt protein (right
panel). We also observed that the lifetime
signature of the SOD1 protein-protein
interaction was homogenously distributed in
by guest on June 24, 2018http://w
ww
.jbc.org/D
ownloaded from

Live tracking fALS SOD1 quaternary structure
5
all cells without visible aggregation,
suggesting that the SOD1 wt protein had
formed dimers.
We subsequently performed single-
cell lifetime fluorescence quantification
versus YFP/CFP fluorescence intensity for
SOD1 wt and G93A mutant forms (Fig. 2A).
The SOD1 wt protein showed a clear
decrease in its fluorescence lifetime
according to the relative concentration of the
SOD1-YFP acceptor, indicating SOD1
interaction. In contrast, we detected no
change in the lifetime of the SOD1 93A
mutant, as compared with the SOD1-YFP
acceptor. This absence of FRET indicated
SOD1 93A mutant failed to dimerize. We
then analyzed nine SOD1 mutant proteins
clinically associated with fALS by lifetime
fluorescence quantification intensity (Fig.
2B). The mutations were chosen for their
variable clinical and biochemical effects, and
for their positions in the SOD1 high
resolution 3-D crystal structure. The A4V
mutant amino acid residue, which is located
at the dimerization interface and is known to
reduce SOD1 dimerization by steric effects,
showed a FRET pattern similar to that
observed for the G93A mutant. A second
mutation at the dimerization interface, I113T,
does not have a strong steric effect and
showed a moderate distribution and lower
FRET than the wt SOD1 protein. Finally, the
H46R mutant, which mediates copper
binding at the active site in the core protein,
showed an intermediate distribution between
the wt and the G93A mutant control. Other
mutations we analyzed showed a pattern
similar to that of the control G93A mutant,
indicating SOD1 interaction defect.
SOD1 dimerization defect in homo-dimer
and hetero-dimer complexes.
To study SOD1 dimerization in live
cells, we performed BiFC, a useful tool for
analyzing molecular interactions at the
cellular level. It entails fusing two fragments
of a fluorescent protein, each of which cannot
fluoresce independently, to proteins to be
tested for interactions. When the proteins of
interest interact, a functional fluorochrome is
reassembled, which is detected by restoration
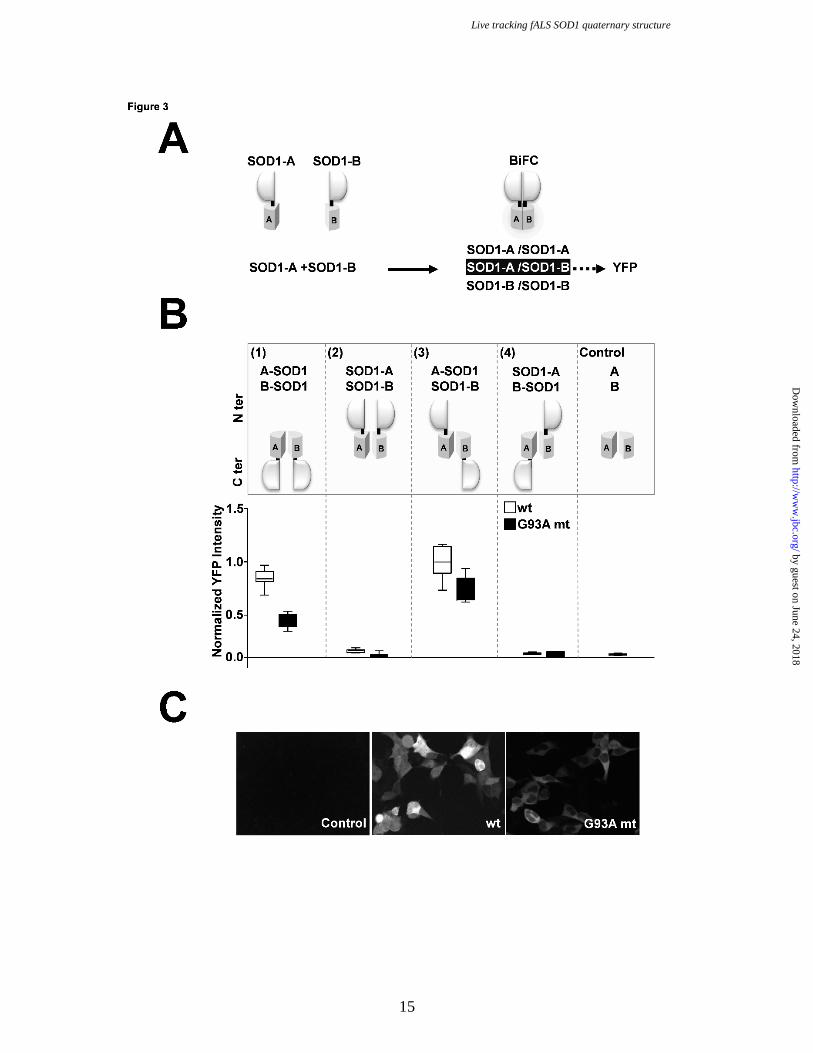
of a fluorescent signal. To test for SOD1
dimerization, we fused SOD1 polypeptides
with the yellow fluorescence protein
fragments YN172 (A) and YC155 (B). The
YN172 and YC155 fragments were fused to
the wt and G93A mutant SOD1 proteins at
the C-terminus (SOD1-A or -B) and N-
terminus (A- or B-SOD1). Because the SOD1
protein forms homo-dimers, we tested
several variations of homo-dimers, including
SOD1-A/SOD1-A, SOD1-B/SOD1-B and
SOD1-A/SOD1-B. However, only the A/B
combination homo-dimer restored YFP
fluorescence (Fig. 3A).
We then expressed the four possible
combinations (Fig. 3B, top panel) and
measured the restored fluorescence
complementation that occurred upon SOD1
dimerization (Fig. 3B, bottom panel). No
fluorescence was detected for the
combinations 2 and 4 or for the negative
control expressing only YN172 and YC155
(Control). However, we found that the
combinations 1 and 3 yielded high
fluorescence signals. For both combinations,
there was a reduction in the fluorescence
intensity for the G93A mutant, as compared
to the wt protein. As depicted in figure 3C,
the confocal images of the wt and G93A mt
combination (1) indicated a homogeneous
distribution of the proteins, and no alterations
in cellular morphology. We did not observe
SOD1 aggregates in cells expressing
combination (1), however, some
aggregations were detected in cells
expressing combination (3) (data not shown).
Hence, we chose to use combination (1) to
study SOD1 protein dimerization.
Because fALS disease is caused by
hetero-zygotic mutations at the sod1 locus,
we next used BiFC to analyze a combination
of wt and mutant SOD1 proteins. As shown
in Figure 4A, we examined three different
SOD1 BiFC conditions, including wt and
mutant homo-dimers and wt/mutant hetero-
dimers. The BiFC approach allows us to
measure wt/mutant hetero-dimer formation
independent of homo-dimers, although all
forms are present in cells of fALS patients.
The dimers formed between wt and G93A
mutant SOD1 monomers showed an
by guest on June 24, 2018http://w
ww
.jbc.org/D
ownloaded from

Live tracking fALS SOD1 quaternary structure
6
intermediate fluorescence signal. The
measured values indicate homo-dimers
comprised of wt and mt SOD1 proteins (Fig.
4B). We then quantified the YFP
fluorescence signal for all of the mutant
SOD1 homo-dimers (mutant SOD1-
A/mutant SOD1-B) and mutant/wt SOD1
hetero-dimers (wt SOD1-A/mutant SOD1-
B). We found that all the mutations tested in
this study, with the exception of D90A,
resulted in reduction of SOD1 dimerization.
As was observed previously for the G93A
mutant, most of the SOD1 wt/mutant dimers
showed intermediate signals compared with
the wt and mutant dimers. Interestingly,
among the studied mutations located at the
dimerization interface, the wt SOD1 subunit
was able to form dimers with the I113T, but
not A4V, mutant.
Association of SOD1 fALS mutations with
protein aggregation.
The fALS-associated mutation of
SOD1 has been shown to promote protein
aggregates that are then degraded by the
ubiquitination and proteasome pathways. To
analyze the formation of SOD1 cellular
aggregates, we generated stable cell lines
expressing the G93A mutant and wt SOD1
proteins fused to CFP and YFP, respectively,
and selected for further study a cell line that
equally expressed the mutant and wt SOD1
fluorescently-tagged constructs. The SOD1
G93A mutant protein, detected in the CFP
channel, was distributed as a single
fluorescence spot in each cell (Fig. 5A, left
panel). In contrast, the wt SOD1 protein,
detected in the YFP channel, was distributed
homogeneously (Fig. 5A, right panel).
Fluorescence quantification of a single cell
containing the SOD1 G93A mutant further
confirmed that the SOD1 mutant protein is
the predominant form present in the
aggregates (Fig. 5B).
To confirm that the wt protein did not
generate aggregates, we prevented the SOD1
degradation using a proteasome inhibitor
(ALLN). The wt and G93A mutant spots
were quantified under increasing ALLN
concentrations (Fig. 5C), as reported in
previous SOD1 aggregation studies [11; 12].
As expected, the number of fluorescent spots
for the G93A mt increased as the ALLN
concentration increased. However, detection
of the spot was negligible for the wt SOD1.
At the highest concentration of ALLN, the wt
spot detection did not reach the base-line spot
formation of the G93A mt.
To study the process of aggregation,
we performed time-lapse microscopy on a
cell line stably expressing the G93A mutant.
The cell line was maintained at 37°C in a
humidified atmosphere with 5% CO2, and
epi-fluorescence microscopy images were
acquired every 5 minutes for a period of 18
hours. As seen in the figure 6A, the
aggregates appeared simultaneously at
multiple sites of the cells and grew over a
period of minutes before fusing together
threby generating larger aggregates, and
converging into a single spot. The aggregates
did not form at specific sites within the cell.
We next analyzed the aggregation of
the 9 mutant fALS-related SOD1 proteins.
Cells were transiently transfected in the
presence and absence of ALLN, visualized
after 48 hours, and protein aggregation was
quantified (Fig. 6B). Under these
experimental conditions, we observed
aggregates in cells expressing all the tested
mutant proteins except for I113T, D90A and
H46R. In the presence of the ALLN
proteasome inhibitor, we detected an increase
in the number of cells with cellular
aggregates for all SOD1 mutant proteins
except for H46R.
Cellular diffusion of fluorescent SOD1
G93A mutant compared with wild type
protein.
Although we showed that the fALS-
related SOD1 mt proteins displayed a loss in
their ability to homo-dimerize, and an
increase in aggregation, we also wanted to
examine the intermediate multimeric state of
SOD1. To study the assembly of mutant
forms of SOD1, we employed a microscopic
technique called fluorescence correlation
spectroscopy (FCS) that is capable of
measuring the mobility of a single molecule
by tracking its fluorescent signature in one
targeted locus of living cells. We used FCS to
by guest on June 24, 2018http://w
ww
.jbc.org/D
ownloaded from
Live tracking fALS SOD1 quaternary structure
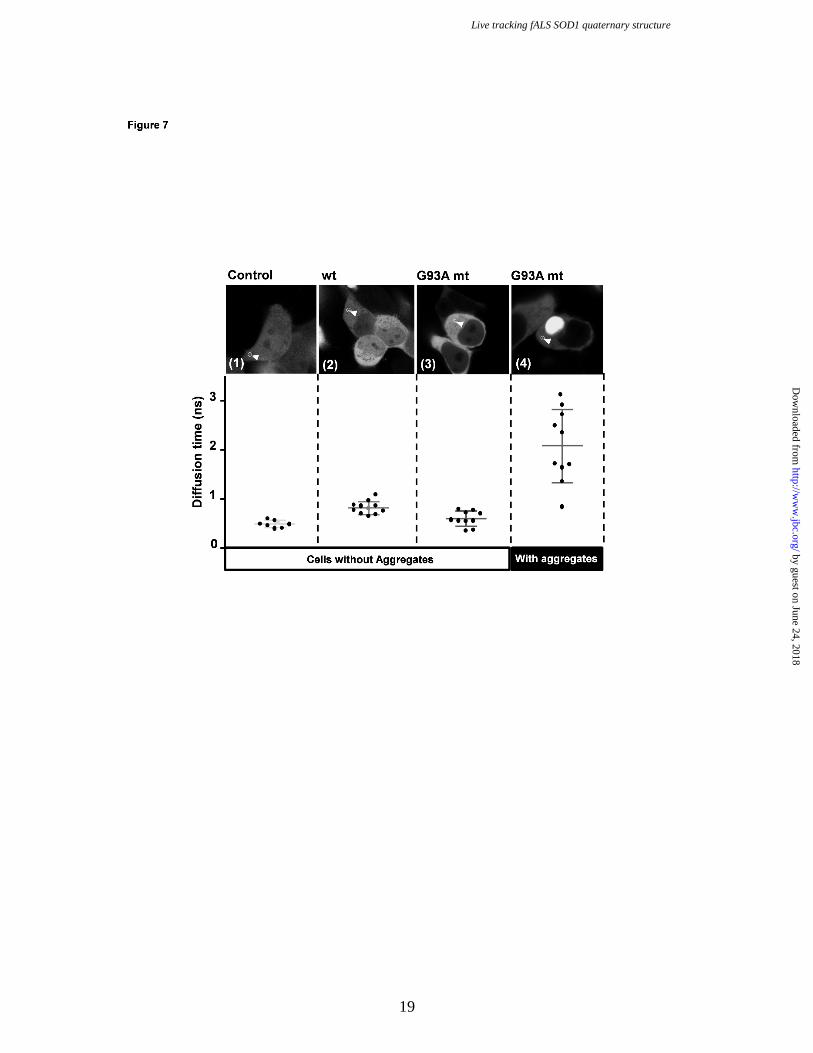
7
measure, in living cells, the correlation time
(τD) of fluorescently tagged proteins, which is
related to the diffusion coefficient and the
molecular weight of the protein complex. We
analyzed two cell lines expressing either the
wt and or G93A mutant protein fused to YFP.
For the G93A mutant, we compared cells
with or without aggregates (Figure 7). We
observed that the wt protein, but not G93A
mutant, could be distinguished from the
native YFP (Control). However, the diffusion
time for the G93A mutant in cell with no
visible aggregates was reduced compared
with that of the wt protein, which is due to the
size difference between the SOD1 wt and
mutant proteins which are in dimeric and
monomeric states respectively. The cells
expressing the G93A mutant contained
aggregates with high diffusion time values
and variance between cells that likely
represent SOD1 at various degrees of
oligomerization.
DISCUSSION
Among the SOD1 mutations
analyzed, we studied mutations that directly
affect the dimerization interface (A4V and
I113T) and mutations spread across the beta
sheet secondary structures (G37R, H46R,
G85R, D90A, G93A, G93C and I104F).
Using FRET and BiFC, we found that SOD1
dimerization in living cells was consistently
reduced for most of these mutant proteins. It
should be noted that these techniques
required modification of the SOD1 protein,
by tagging it with fluorescent proteins (FP) or
fragments, for the FRET and BiFC
techniques respectively.
The combination of our results with
structural data suggests that defective
dimerization of the SOD1 mutants is due to
altered tertiary structures. FRET analysis of
the mutant proteins showed that for H46R
and I113T, homo-dimerization was
disrupted, but remained more discrete. The
H46 amino acid is involved in the copper-
zinc binding site. Interestingly, the H46R
mutation showed a moderate effect on
dimerization by FRET. One could conclude
that the H46R phenotype is due to the loss of
the copper-zinc binding site and a moderate
defect in dimer formation. These quantitative
results obtained for typical mutations
corroborate the clinical data currently
available. In fact, the A4V mutant which
drastically affected SOD1 dimerization has
been shown to have a dramatic effect on
patients and is associated with rapid disease
progression. As expected, based on the data
showing moderate effects on dimerization,
the H46R and I113T mutations are associated
with longer disease onset than that associated
with the A4V mutation. In addition, the other
mutations associated with intermediate
disease onset analyzed in this study show
dimerization defects that correlate with the
clinical observations.
Among the nine mutations tested, we
found one mutant form that displayed a
discrepancy between the FRET and BiFC
techniques. The mutation D90A significantly
decreased the SOD1 dimer formation
measured by FRET but not by BiFC. One
possible explanation for this discrepancy is
that the fusion protein used in the BiFC
analysis modified the complex
association/dissociation dynamics of
dimerization, leading to an irreversibly
dimerized state. Hence, the D90A mutation
may affect only dissociation of the
monomers, which cannot be examined by the
BiFC approach.
Because fALS is a genetic disease
that is usually caused by heterozygous
mutations, we performed a quantitative
analysis of SOD1 wt/mutant hetero-dimers.
The BiFC technique was selected to quantify
SOD1 wt/mutant formation because the
FRET technique cannot quantitatively
distinguish SOD1 wt/mutant from SOD1
mutant/mutant dimers. As previously
reported and shown using high resolution X-
ray crystallography of SOD1, the mutations
A4V and I113T affect the dimerization
interface [23; 24]. The strong dimerization
impairment observed by BiFC for the A4V
mutant compared to I113T further validates
our experimental conditions. Interestingly,
the A4V mutation prevented the formation of
any SOD1 dimers, while the I113T mutation
prevented formation of mutant homo-dimers
by guest on June 24, 2018http://w
ww
.jbc.org/D
ownloaded from

Live tracking fALS SOD1 quaternary structure
8
but allowed formation of wt/mutant
heterodimers.
In addition to studying properties of
SOD1 protein dimerization, we also
quantified the aggregation of SOD1 wt and
mutant YFP-fusion proteins in living cells.
Under our experimental conditions, cellular
aggregates were observed for almost all of
the studied mutations. Key information
available to date (clinical, biochemical,
FRET, BiFC and aggregation) relating to wt
and mutant SOD1 proteins are summarized in
Figure 8A. Interestingly, we found that the
H46R and I113T mutations, which showed a
mild effect on dimer formation by FRET
analysis, did not produce aggregates when
expressed in cells. The D90A mutation which
is associated with mild and late disease onset,
did not produce aggregation in our
experiments. The mutation A4V had the most
drastic dimerization defect and also showed
the strongest SOD1 aggregation activity.
By studying SOD1 aggregation
using time-lapse microscopy, we found that
SOD1 aggregation formation occurs in a
relatively short period of time (on the order
of a few minutes) and that multiple
aggregates form in parallel from various sub-
cytosolic locations. In cells containing
aggregates, the diffusion properties of the
G93A mutant protein indicated that SOD1
proteins freely diffusing in the cytosol were
multimers containing more than two SOD1
monomers. Interestingly, cells expressing the
G93A mutant that do not show aggregates
contained SOD1 as monomers or dimers.
These results suggest that the monomer is the
major form of SOD1 associated with fALS,
prior to the formation of aggregates. The
triggering event leading from
oligomerization to aggregation remains to be
elucidated and will require greater
understanding of the cellular homeostasis of
mutant and wt forms of SOD1. Interestingly,
the proteasome inhibitor ALLN had a strong
impact on SOD1 aggregation, suggesting that
SOD1 aggregates are subject to proteasomal
degradation.
Based on our results, we propose the
model shown in Figure 8B. In this model, the
SOD1 wt proteins exist primarily as dimers,
whereas SOD1 mutant proteins are mostly
monomeric. However, we found the
dimer/monomer ratio is variable and
dependent upon the mutation site. Oligomer
formation involves covalent disulfide bonds
(C6-C111) between SOD1 monomers [25]
that are much more stable (and appear to be
irreversible in a cellular context) than the
dimerization interaction. We observed that
only the SOD1 mutants we studied led to the
formation of aggregates, and this process
seems to be initiated by SOD1 monomers.
The aggregates were composed only of
mutant SOD1, and the cellular ubiquitination
and proteasome protein degradation
machinery was insufficient to prevent the
formation of aggregates in our cellular
models.
ACKNOWLEDGEMENTS
This work was supported by Basic
Science Research Program through the
National Research Foundation of Korea
(NRF) grant funded by the Ministry of
Education, Science and Technology (MEST:
grant number 2012R1A2004980), and
supported by the National Reaserch
Fondation of Korea grant funded by the
Korean government (MSIP) (grant number
2007-00559), the Gyeonggi-do and KISTI.
by guest on June 24, 2018http://w
ww
.jbc.org/D
ownloaded from

Live tracking fALS SOD1 quaternary structure
9
References 1. Abe K, Aoki M, Ikeda M, Watanabe M, Hirai S, Itoyama-Y (1996) Clinical characteristics of familial amyotrophic lateral sclerosis with Cu/Zn superoxide dismutase gene mutations. JNeurol Sci. 136(1-2):108-16. 2. RosenDR, Siddique T, Patterson D, Figlewicz DA, Sapp P, Hentati A, Donaldson D, Goto
J, O'Regan JP, Deng H, Rahmani Z, Krizus A, McKenna-Yasek D, Cayabyab A, Gaston
SM, Berger R, Tanzi RE, Halperin JJ, Herzfeldt B,Van den Bergh R, Hung W, Bird T, Deng
G, Mulder DW, Smyth C, Laing NG, Soriano E, Pericak–Vance MA, Haines J, Rouleau
GA, Gusella JS, Horvitz HR, Brown RH Jr (1993) Mutations in Cu/Zn superoxide dismutase gene are associated with familial amyotrophic lateral sclerosis. Nature. 364(6435):362. 3. Rosen DR, Bowling AC, Patterson D, Usdin TB, Sapp P, Mezey E, McKenna-Yasek D, O'Regan J, Rahmani Z, Ferrante RJ, Brownstein MJ, Kowall NW, Flint Beal M, Horvitz HR, Brown RH Jr (1994) A frequent ala 4 to val superoxide dismutase-1 mutation is associated with a rapidly progressive familial amyotrophic lateral sclerosis. Human molecular genetics. 3(6):981-7. 4. Bowling AC, Barkowski EE, McKenna-Yasek D, Sapp P, Horvitz HR, Beal MF, Brown RH Jr (1995) Superoxide Dismutase Concentration and Activity in Familial Amyotrophic Lateral Sclerosis. , J Neurochem. 64(5):2366-9. 5. Lindberg MJ, Tibell L, Oliveberg M (2002) Common denominator of Cu ͞Zn superoxide dismutase mutants associated with amyotrophic lateral sclerosis : Decreased stability of the apo state. Proc Natl Acad Sci U S A. 99(26), 16607–16612. 6. Matsumoto G, Stojanovic A, Holmberg CI, Kim S, Morimoto RI (2005) Structural properties and neuronal toxicity of amyotrophic lateral sclerosis-associated Cu/Zn superoxide dismutase 1 aggregates. J Cell Biol. 171(1):75-85. 7. Puttaparthi K, Wojcik C, Rajendran B, Demartino GN, Elliott JL (2003) Aggregate formation in the spinal cord of mutant SOD1 transgenic mice is reversible and mediated by proteasomes. J Neurochem. 87 (4) 851–860. 8. Johnston JA, Ward CL, Kopito RR (1998). Aggresomes: a cellular response to misfolded proteins. J Cell Biol. 143(7):1883-98. 9. Lindberg MJ, Byström R, Boknäs N, Andersen PM, Oliveberg M, Bokna N, Bystro R (2005) Systematically perturbed folding patterns of amyotrophic lateral sclerosis (ALS) -associated SOD1 mutants. Proc Natl Acad Sci U S A. 102(28):9754-9 10. Niwa J, Yamada S, Ishigaki S, Sone J, Takahashi M, Katsuno M, Tanaka F, Doyu M, Sobue-G (2007) Disulfide Bond Mediates Aggregation, Toxicity, and Ubiquitylation of Familial Amyotrophic Lateral. J Biol Chem. 282(38):28087-95.
11. Niwa J, Ishigaki S, Hishikawa N, Yamamoto M, Doyu M, Murata S, Tanaka K, Taniguchi N, Sobue G (2002) Dorfin ubiquitylates mutant SOD1 and prevents mutant SOD1-mediated neurotoxicity. J Biol Chem. 277(39):36793-8. 12. Mishra A, Maheshwari M, Chhangani D, Fujimori-Tonou N, Endo F, Joshi AP, Jana NR, Yamanaka K(2013) E6-AP association promotes SOD1 aggresomes degradation and suppresses toxicity. Neurobiol Aging. 34(4):131012
by guest on June 24, 2018http://w
ww
.jbc.org/D
ownloaded from

Live tracking fALS SOD1 quaternary structure
10
13. Hu CD, Chinenov Y, Kerppola TK (2002) Visualization of interactions among bZIP and Rel family proteins in living cells using bimolecular fluorescence complementation. Mol Cell. 9(4):789-98. 14. Borchelt DR, Lee MK, Slunt HS, Guarnieri M, Xu ZS, Wong PC, Brown RH Jr, Price DL, Sisodia SS, Cleveland DW (1994) Superoxide dismutase 1 with mutations linked to familial amyotrophic lateral sclerosis possesses significant activity. Proc Natl Acad Sci U S A. 91(17):8292-6. 15. Corson LB, Strain JJ, Culotta VC, Cleveland DW (1998) Chaperone-facilitated copper binding is a property common to several classes of familial amyotrophic lateral sclerosis-linked superoxide dismutase mutants. Proc Natl Acad Sci U S A. 95(11):6361-6. 16. Aoki M, Ogasawara M, Matsubara Y, Narisawa K, Nakamura S, Itoyama Y, Abe K (1994). Familial amyotrophic lateral sclerosis (ALS) in Japan associated with H46R mutation in Cu/Zn superoxide dismutase gene: a possible new subtype of familial ALS. J Neurol Sci. 126(1):77-83. 17. Andersen PM, Nilsson P, Ala-Hurula V, Keränen ML, Tarvainen I, Haltia T, Nilsson L, Binzer M, Forsgren L, Marklund SL (1995) Amyotrophic lateral sclerosis associated with homozygosity for an Asp90Ala mutation in CuZn-superoxide dismutase. Nat Genet. 10(1):61-6. 18. Tu PH, Raju P, Robinson KA, Gurney ME, Trojanowski JQ, Lee VM (1996) Transgenic mice carrying a human mutant superoxide dismutase transgene develop neuronal cytoskeletal pathology resembling human amyotrophic lateral sclerosis lesions. Proc Natl Acad Sci U S A. 93(7):3155-60. 19. Bastiaens PI, Squire A (1999) Fluorescence lifetime imaging microscopy: spatial resolution of biochemical processes in the cell. Trends Cell Biol. 9 (2), 48-52. 20. Kim J, Lee J, Kwon D, Lee H Graihle R (2011) A comparative analysis of resonance energy transfert methods for Alzheimer related protein-protein interactions in living cells. Mol.BiosSyst. 7, 2991-2996. 21. Dorval T, Ogier A, Genovesio A, Lim HK, Kwon do Y, Lee JH, Worman HJ, Dauer W, Grailhe R (2010) Contextual automated 3D analysis of subcellular organelles adapted to high-content screening. J Biomol Screen. 15 (7), 847-57. 22. Fenistein D, Lenseigne B, Christophe T, Brodin P, Genovesio A (2008) A fast, fully automated cell segmentation algorithm for high-throughput and high-content screening. Cytometry A. 73 (10), 958-64. 23. Hough MA, Grossmann JG, Antonyuk SV, Strange RW, Doucette PA, Rodriguez JA, Whitson LJ, Hart PJ, Hayward LJ, Valentine JS, Hasnain SS (2004) Dimer destabilization in superoxide dismutase may result in disease-causing properties: structures of motor neuron disease mutants. Proc Natl Acad Sci U S A. 101(16):5976-81 24. Khare SD, NV Dokholyan NV (2006) Common dynamical signatures of familial amyotrophic lateral sclerosis-associated structurally diverse Cu, Zn superoxide dismutase mutants. Proc Natl Acad Sci U S A. 103(9):3147-52.
by guest on June 24, 2018http://w
ww
.jbc.org/D
ownloaded from

Live tracking fALS SOD1 quaternary structure
11
25. Banci L, Bertini I, Boca M, Calderone V, Cantini F, Girotto S Vieru-M (2009) Structural and dynamic aspects related to oligomerization of apo SOD1 and its mutants. Proc Natl Acad Sci U S A. 106(17):6980-5
by guest on June 24, 2018http://w
ww
.jbc.org/D
ownloaded from

Live tracking fALS SOD1 quaternary structure
12
Figure Legends Figure 1: FRET and fluorescence lifetime analysis of SOD1 proteins in living cells. A. SOD1 protein dimerization and FRET analysis. Schematic representation of SOD1 dimerization and fluorescence of YFP and CFP fusion proteins. B. Analysis of three combinations (1, 2 and 3) of YFP- and CFP-tagged wt and G93A mutant SOD1 fluorescent pairs (n=5). C. FLIM visualization of the degree of donor fluorophore lifetime shortening on a pseudocolor scale. The color-coded FLIM images show the wt and G93A mutant. The average fluorescence lifetimes of the wt and G93A mutant SOD1 homo-dimers are 2.59 ns and 2.90 ns, respectively. The fluorescence lifetime distribution of the CFP and YFP tagged SOD1 proteins is shown. Figure 2: FRET analysis of wt and SOD1 mutant proteins. A. Comparison of wt and G93A mutant by FRET analysis (number of cells analyzed, n=60). B. Structure of the human SOD1 dimer showing the positions of the fALS mutations. C. Analysis of the nine selected fALS-associated mutants (number of cells analyzed, n=60). Figure 3: BiFC analysis of SOD1 dimerization in living cells. A. Schematic representation of the BiFC protein fragments (YN172 and YC155) and fusion proteins. B. Analysis of four combinations (1, 2, 3 and 4) of SOD1 wt and G93A mutant proteins (n=3). C. BiFC confocal image of control, wt and G93A mutant cells observed using combination 1. Figure 4: BiFC analysis of SOD1 mutant and wt-mutant heterodimers. A. Schematic representation of the BiFC wt and mutant combinations. B. BiFC analysis of the wt and G93A mutant homo-dimers and the wt/G93A mutant hetero-dimer (n=3). C. Histogram representation of the results obtained for the wt, mutant and wt/mutant dimers (n=3). Figure 5: Fluorescence analysis of cells stably co-expressing fluorescent wt and G93A mutant SOD1 proteins. A. Image of the cell line stably expressing wt (SOD1-Y wt) and G93A mutant (SOD1-C G93A) fused to YFP and CFP, respectively. The arrows indicate the positions of aggregates. B. Analysis of YFP and CFP fluorescence in a cell with SOD1 aggregates. C. Effect of ALLN proteasome inhibitor concentration on the number of fluorescent spots detected in wt or G93A mutant SOD1-expressing cells (n=5). Figure 6: Analysis of mutant SOD1 aggregation in living cells. A. Time course analysis of G93A mt aggregation in a single cells. The arrows indicate the positions of the aggregates. B. Histogram representation of the percentage of cells showing aggregates in cell culture expressing mutant SOD1 proteins with or without the ALLN proteasome inhibitor. Figure 7: Analysis of wt and G93A mutant SOD1 protein diffusion in living cells. The top panels depict typical analyzed cells, and the arrows indicate the position of fluorescence diffusion detection. The bottom panels show plots of the quantification of the diffusion times for several cells. Figure 8: and cellular models of cellular SOD1 protein analysis. A. Table summarizing quantitative measurement on wt and mutant SOD1 proteins. *Survival and *G are experimental results from references [5;9]. B. Molecular model of the cellular distributions of wt and fALS mutant SOD1.
by guest on June 24, 2018http://w
ww
.jbc.org/D
ownloaded from

Live tracking fALS SOD1 quaternary structure
13
by guest on June 24, 2018http://w
ww
.jbc.org/D
ownloaded from

Live tracking fALS SOD1 quaternary structure
14
by guest on June 24, 2018http://w
ww
.jbc.org/D
ownloaded from
Live tracking fALS SOD1 quaternary structure
15
by guest on June 24, 2018http://w
ww
.jbc.org/D
ownloaded from

Live tracking fALS SOD1 quaternary structure
16
by guest on June 24, 2018http://w
ww
.jbc.org/D
ownloaded from

Live tracking fALS SOD1 quaternary structure
17
by guest on June 24, 2018http://w
ww
.jbc.org/D
ownloaded from

Live tracking fALS SOD1 quaternary structure
18
by guest on June 24, 2018http://w
ww
.jbc.org/D
ownloaded from
Live tracking fALS SOD1 quaternary structure
19
by guest on June 24, 2018http://w
ww
.jbc.org/D
ownloaded from

Live tracking fALS SOD1 quaternary structure
20
by guest on June 24, 2018http://w
ww
.jbc.org/D
ownloaded from

Fenistein, Arnaud Ogier, Vincent Brondani and Regis GrailheJiho Kim, Honggun Lee, Joo Hyun Lee, Do Yoon Kwon, August Genovesio, Denis
sclerosis Cu/Zn-superoxide dismutase 1 mutant forms in live cellsDimerization, oligomerization, and aggregation of human Amyotrophic lateral
published online April 1, 2014J. Biol. Chem.
10.1074/jbc.M113.542613Access the most updated version of this article at doi:
Alerts:
When a correction for this article is posted•
When this article is cited•
to choose from all of JBC's e-mail alertsClick here
by guest on June 24, 2018http://w
ww
.jbc.org/D
ownloaded from


