
Universidade de Aveiro
2014
Departamento de Engenharia Civil
MANJIP SHAKYA
AVALIAÇÃO DA VULNERABILIDADE SÍSMICA DE ESTRUTURAS ESBELTAS DE ALVENARIA SEISMIC VULNERABILITY ASSESSMENT OF SLENDER MASONRY STRUCTURES

Universidade de Aveiro
2014
Departamento de Engenharia Civil
MANJIP SHAKYA
AVALIAÇÃO DA VULNERABILIDADE SÍSMICA DE ESTRUTURAS ESBELTAS DE ALVENARIA
Tese apresentada à Universidade de Aveiro para cumprimento dos requisitos necessários à obtenção do grau de Doutor em Engenharia Civil, realizada sob a orientação científica do Doutor Humberto Salazar Amorim Varum, Professor Associado com Agregação da Departamento de Engenharia Civil da Universidade de Aveiro e coorientação do Doutor Romeu da Silva Vicente, Professor Auxiliar da Departamento de Engenharia Civil da Universidade de Aveiro e do Doutor Aníbal Guimarães Costa, Professor Catedrático da Departamento de Engenharia Civil da Universidade de Aveiro.


Universidade de Aveiro
2014
Departamento de Engenharia Civil
MANJIP SHAKYA
SEISMIC VULNERABILITY ASSESSMENT OF SLENDER MASONRY STRUCTURES
Thesis submitted to the University of Aveiro to fulfill the requirements to obtain the degree of Doctor of Philosophy in Civil Engineering, under the scientific supervision of Dr. Humberto Salazar Amorim Varum, Associate Professor with Habilitation, Department of Civil Engineering, University of Aveiro and co-guidance of Dr. Romeu da Silva Vicente, Assistant Professor, Department of Civil Engineering, University of Aveiro and Dr. Aníbal Guimarães Costa, Full Professor, Department of Civil Engineering, University of Aveiro.

o júri
presidente Prof. Doutor Nelson Fernando Pacheco da Rocha Professor Catedrático da Secções Autónomas de Ciências da Saúde da Universidade de Aveiro
Prof. Doutor Humberto Salazar Amorim Varum Professor Associado com Agregação da Departamento de Engenharia Civil da Universidade de Aveiro
Prof. Doutor Fernando Farinha da Silva Pinho Professor Auxiliar da Faculdade de Ciências e Tecnologia da Universidade Nova de Lisboa
Prof. Doutor Graҫa de Fátima Moreira de Vasconcelos Professor Auxiliar da Escola de Engenharia da Universidade do Minho
Prof. Doutor Hugo Filipe Pinheiro Rodrigues Professor Adjunto da Escola Superior de Tecnologia e Gestão do Instituto Politécnico de Leiria
Prof. Doutor Cristina Margarida Rodrigues Costa Professor Adjunto da Departamento de Engenharia Civil do Instituto Politécnico de Tomar


the jury
president Prof. Dr. Nelson Fernando Pacheco da Rocha Full Professor, Autonomous Section of Health Science, University of Aveiro
Prof. Dr. Humberto Salazar Amorim Varum Associate Professor with Habilitation, Department of Civil Engineering, University of Aveiro
Prof. Dr. Fernando Farinha da Silva Pinho Assistant Professor, Faculty of Science and Technology, New University of Lisbon
Prof. Dr. Graҫa de Fátima Moreira de Vasconcelos Assistant Professor, School of Engineering, University of Minho
Prof. Dr. Hugo Filipe Pinheiro Rodrigues Assistant Professor, School of Technology and Management, Polytechnic Institute of Leiria
Prof. Dr. Cristina Margarida Rodrigues Costa Assistant Professor, Department of Civil Engineering, Polytechnic Institute of Tomar


acknowledgements The present work has been developed at the Department of Civil Engineering, University of Aveiro, Portugal. I wish to express my sincere gratitude to the following persons, which have contributed to make this work possible and helped me growing. Firstly, I would like to express my gratitude to the scholarship under the Erasmus Mundus Action 2 Partnership, EU-NICE project, financially supporting to develop a PhD at Department of Civil Engineering, University of Aveiro, Portugal. I would also like to thank Dr. Giorgio Monti and Dr. Marco Faggella from EU-NICE project coordinating University, Sapienza Universiy of Rome, Italy for their help and support. My gratitude goes to my supervisor, Dr. Humberto Salazar Amorim Varum, Associate Professor with Habilitation, and to my co-supervisors Dr. Romeu da Silva Vicente, Assistant Professor, and Dr. Aníbal Guimarães Costa, Full Professor, from the Department of Civil Engineering, University of Aveiro, who were my source of encouragement and motivation during the whole work. Their advice, suggestions and solution to bottleneck problems encountered during this work were just immensurable. Their technical excellence, unwavering faith and constant encouragement were very helpful and made this effort an enjoyable one. This research work was enabled and sustained by their vision and ideas. I thank to all my colleagues from Department of Civil Engineering, University of Aveiro, for both academic and social interactions. I would like to express my deepest gratitude, to my parents Ram Krishna Shakya and Surja Laxmi Shakya, to my wife Sushma Bajracharya and to all my family members for their love and invaluable support in everything. This thesis is dedicated to them.


palavras-chave
Estruturas esbeltas de alvenaria; torres; minaretes; chaminés; Pagode; Nepal; fragilidade estrutural; avaliação da vulnerabilidade; índice de vulnerabilidade; estratégias de melhoria do comportamento
resumo
Existem estruturas esbeltas de alvenaria por todo o mundo, e estas constituem uma parte relevante do património da humanidade, arquitetónico e cultural. A sua proteção face à ação sísmica é um tema de grande preocupação entre a comunidade científica. Esta preocupação surge, principalmente, do dano severo ou até mesmo perda total sofrida por este tipo de estruturas em eventos catastróficos, e da necessidade e interesse em preservá-las. Apesar dos grandes avanços na tecnologia, e do conhecimento em sismologia e engenharia sísmica, a preservação destas estruturas frágeis e massivas ainda representa um grande desafio. Com base na investigação desenvolvida neste trabalho é proposta uma metodologia que visa a avaliação do risco sísmico de estruturas esbeltas de alvenaria. A metodologia proposta foi aplicada na avaliação da vulnerabilidade sísmica de templos Pagode, no Nepal, que possuem procedimentos de construção simples e detalhes construtivos pobres relativamente às exigências de resistência sísmica. O trabalho está estruturado em três partes principais. Em primeiro lugar, são discutidas as fragilidades estruturais específicas, bem como as características construtivas, de um importante património classificado da UNESCO que são os templos Pagode do Nepal, que afetam o seu desempenho sísmico e as propriedades dinâmicas. Na segunda parte deste trabalho apresenta-se o método simplificado proposto para a avaliação da vulnerabilidade sísmica de estruturas esbeltas de alvenaria. Finalmente, a metodologia proposta neste trabalho é aplicada no estudo dos templos Pagode do Nepal, e na avaliação da eficiência de soluções de melhoria do desempenho sísmico compatíveis com o valor cultural e tecnológico original.


keywords
Slender masonry structures; towers; minarets; chimneys; Pagoda; Nepal; structural fragility; vulnerability assessment; vulnerability index; retrofitting strategies
abstract
Slender masonry structures are distributed all over the world and constitute a relevant part of the architectural and cultural heritage of humanity. Their protection against earthquakes is a topic of great concern among the scientific community. This concern mainly arises from the strong damage or complete loss suffered by this group of structures due to catastrophic events and the need and interest to preserve them. Although the great progress in technology, and in the knowledge of seismology and earthquake engineering, the preservation of these brittle and massive structures still represents a major challenge. Based on the research developed in this work it is proposed a methodology for the seismic risk assessment of slender masonry structures. The proposed methodology was applied for the vulnerability assessment of Nepalese Pagoda temples which follow very simple construction procedure and construction detailing in relation to seismic resistance requirements. The work is divided in three main parts. Firstly, particular structural fragilities and building characteristics of the important UNESCO classified Nepalese Pagoda temples which affect their seismic performance and dynamic properties are discussed. In the second part the simplified method proposed for seismic vulnerability assessment of slender masonry structures is presented. Finally, the methodology proposed in this work is applied to study Nepalese Pagoda temples, as well as in the efficiency assessment of seismic performance improvement solution compatible with original cultural and technological value.


i
CONTENTS
Contents i
List of Figures v
List of Tables xi
List of Symbols xv
Chapter 1: Introduction 1
1.1 Background ......................................................................................................... 1
1.2 Motivation ........................................................................................................... 3
1.3 Objectives ............................................................................................................ 4
1.3.1 General objectives ................................................................................... 4
1.3.2 Specific objectives ................................................................................... 4
1.4 Organization of the thesis ................................................................................... 4
Chapter 2: Slender masonry structures: A literature review 7
2.1 Introduction ......................................................................................................... 7
2.2 State of the art on slender masonry structures .................................................... 9
2.2.1 Damage scenario of slender masonry structures in past earthquake ....... 9
2.2.2 Analytical and experimental investigation on slender masonry
structures ................................................................................................ 11
2.2.3 Proposed and followed repair and strengthening interventions ............. 13
2.3 Database collection and analysis ....................................................................... 15
2.3.1 Formulation for computing the fundamental frequency/period of
tower and cantilever structures .............................................................. 18
2.3.2 Empirical formulae for computing the fundamental frequency of
slender masonry structures .................................................................... 19
2.3.3 Predictive performance compared results .............................................. 21
2.4 Conclusions ....................................................................................................... 27
Chapter 3: Nepalese Pagoda temples: A sensitivity analysis 29
3.1 Introduction ....................................................................................................... 29
3.2 State of the art on Nepalese Pagoda temples .................................................... 30
ii
3.2.1 History of Nepalese Pagoda temples ...................................................... 30
3.2.2 Structural characterization of Nepalese pagoda temples ........................ 30
3.2.2.1 Foundation ............................................................................... 31
3.2.2.2 Masonry walls ......................................................................... 32
3.2.2.3 Timber members ...................................................................... 33
3.2.2.4 Roof system ............................................................................. 35
3.2.3 Seismic behaviour of Nepalese Pagoda temples .................................... 37
3.2.4 Previous research on Nepalese Pagoda temples ..................................... 39
3.2.4.1 Material properties of structural components .......................... 39
3.2.4.2 Dynamic properties of Nepalese Pagoda temples ................... 41
3.2.4.3 Analytical failure modes of Nepalese Pagoda temple ............. 42
3.2.5 Strengthening practice on Nepalese Pagoda temples ............................. 43
3.3 Seismic sensitivity analysis of the common structural components .................. 45
3.3.1 Numerical modeling of temples ............................................................. 45
3.3.2 Experimental modal identification and model updating ........................ 48
3.3.2.1 Ambient vibration test of Radha Krishna temple .................... 48
3.3.2.2 Calibration and validation of numerical model ....................... 50
3.3.3 Parametric analysis and results ............................................................... 52
3.4 Conclusions ........................................................................................................ 55
Chapter 4: Seismic vulnerability assessment methodology 57
4.1 Introduction ........................................................................................................ 57
4.2 Proposed methodology for the vulnerability assessment ................................... 58
4.3 Modeling strategy adopted for parametric analysis ........................................... 61
4.4 Calibration of proposed methodology for vulnerability assessment ................. 64
4.4.1 Definition of vulnerability assessment parameters ................................ 64
4.4.2 Definition of parameters weight ............................................................. 90
4.5 Implementation of proposed methodology on slender masonry structures ........ 93
4.5.1 Vulnerability assessment of slender masonry structures ........................ 93
4.5.1.1 Nepalese Pagoda temples ........................................................ 93
4.5.1.2 Masonry towers ....................................................................... 95
4.5.1.3 Masonry minarets .................................................................... 98
4.5.1.4 Industrial masonry chimneys ................................................. 100
4.5.2 Vulnerability curves for slender masonry structures ............................ 103
4.6 Conclusions ...................................................................................................... 107
Chapter 5: Seismic vulnerability assessment: A case study 109
5.1 Introduction ...................................................................................................... 109
5.2 Historical seismicity in Nepal .......................................................................... 110
5.3 Case study description ..................................................................................... 113

iii
5.4 Vulnerability assessment of the Nepalese Pagoda temples.............................. 115
5.4.1 Seismic vulnerability assessment ........................................................ 115
5.4.2 Physical damage distribution and scenario .......................................... 119
5.5 Seismic loss assessment of the Nepalese Pagoda temples .............................. 125
5.5.1 Collapsed and unusable Pagoda temples ............................................. 125
5.5.2 Estimation of repair costs .................................................................... 127
5.6 Seismic vulnerability and loss comparison: Original state and retrofitted ..... 128
5.6.1 Proposed repair and strengthening interventions ................................. 128
5.6.2 Results of proposed retrofitting in vulnerability and loss reduction.... 130
5.7 Conclusions ..................................................................................................... 135
Chapter 6: Synopsis and future research 137
6.1 Summary ......................................................................................................... 137
6.2 Conclusions and future research ..................................................................... 139
References 143

iv

v
LIST OF FIGURES
Chapter 2: Slender masonry structures: A literature review 7
Figure 2.1: Slender masonry structures: a) Towers; b) Minarets; c) Chimney; d) Pagoda
temples ................................................................................................................ 9
Figure 2.2: Earthquake induced damage on bell tower and minaret: a) vertical cracks
at the base; b) shear crack on the stem; c) damage at belfry; d) collapse at
transition zone; e) partial collapse of balcony .................................................. 11
Figure 2.3: Steel tie rods: a) inferior view of system of four tie rods; b)external anchorage
for steel strands; c) external anchorages and closure of existing windows; d)
external horizontal anchorage ........................................................................... 15
Figure 2.4: Comparison between experimental and predicted values of the fundamental
frequency of slender masonry structures according to different formulation ... 22
Figure 2.5: Comparison of the fundamental frequencies predicted by three different
sub–formulations of Eq. ( ) for all types of slender masonry structures,
towers and minarets .......................................................................................... 22
Figure 2.6: Comparison between experimental and predicted values of the fundamental
frequency according to Eq. ( ) and Eq. ( ) for all types of slender masonry
structures ........................................................................................................... 23
Figure 2.7: Comparison of the fundamental frequencies predicted by three different
sub–formulations of Eq. ( ) for all types of slender masonry structures,
towers and minarets .......................................................................................... 24
Figure 2.8: Comparison between experimental and predicted values of the fundamental
frequency according to Eq. ( ) and Eq. ( ) for all types of slender masonry
structures ........................................................................................................... 24
Figure 2.9: Comparison of the fundamental frequencies predicted by three different
sub–formulations of Eq. ( ) for all types of slender masonry structures,
towers and minarets .......................................................................................... 25
Figure 2.10: Comparison between experimental and predicted values of the fundamental
frequency according to Eq. ( ) for all types of slender masonry
structures ........................................................................................................ 26

vi
Figure 2.11: Comparison of the fundamental frequencies predicted by three different
sub–formulations of Eq. ( ) for all types of slender masonry structures,
towers and minarets ........................................................................................ 26
Chapter 3: Nepalese Pagoda temples: A sensitivity analysis 29
Figure 3.1: Nepalese Pagoda temples ................................................................................. 31
Figure 3.2: Temple section with foundation: (a) Shiva temple; (b) Nyatopol temple ......... 32
Figure 3.3: Traditional wall section .................................................................................... 33
Figure 3.4: Wall system of Nepalese Pagoda temples: a) one sides open; b) three sides
open; c) four sides open; d) walk way between outer colonnade and inner
wall, inner wall with one door opening; e) walk way between outer
colonnade and inner wall, inner wall with four door openings; f) double
wall system, walkway between walls, all four sides door openings ................. 33
Figure 3.5: Section of Narayan temple .............................................................................. 34
Figure 3.6: Beam–column joint system .............................................................................. 34
Figure 3.7: Inner and outer wall plate ................................................................................. 35
Figure 3.8: Floor system ..................................................................................................... 35
Figure 3.9: Roof construction system in Pagoda temples ................................................... 36
Figure 3.10: Rafter and wall plate joint at upper end (left) and above wall (right) ............ 36
Figure 3.11: Detail timber peg joint .................................................................................... 36
Figure 3.12: Timber struts ................................................................................................... 36
Figure 3.13: Bhaktapur Darbar Square world heritage site before and after 1934
earthquake ....................................................................................................... 37
Figure 3.14: Kathmandu Darbar Square world heritage site after 1934 earthquake .......... 37
Figure 3.15: Test setup on brick masonry wall ................................................................... 39
Figure 3.16: Strengthening work on Radha Krishna temple .............................................. 44
Figure 3.17: Three Nepalese Pagodas: a) Shiva; b) Lakshmi Narayan; c) Radha
Krishna ............................................................................................................ 46
Figure 3.18: FE models: a) Shiva temple; b) Lakshmi Narayan temple; c) Radha
Krishna temple ................................................................................................ 47
Figure 3.19: Location of accelerometers used in experimental modal identification of
Radha Krishna temple .................................................................................... 48
Figure 3.20: Identification of spectral peaks (FDD): a) E–W direction; b) N–S
direction .......................................................................................................... 49

vii
Figure 3.21: Vibration modes identified from ambient vibration measurement: a) first
bending xx; b) first bending yy; c) second bending xx; d) second bending
yy; e) third bending yy; f) third bending xx ................................................... 50
Figure 3.22: Comparison between measured and computed vibration mode shape:
a) first bending xx; b) second bending xx; c) third bending xx ..................... 51
Chapter 4: Seismic vulnerability assessment methodology 57
Figure 4.1: FE model of the reference structure ................................................................. 62
Figure 4.2: Macro–modeling for masonry walls ................................................................ 62
Figure 4.3: Stress–Strain relations applied to the total strain crack model: a) behaviour
of material with softening under uniaxial tension; b) behaviour of material with
hardening/softening under uniaxial compression; c) behaviour of material
with constant shear retention factor under uniaxial shear [143] ....................... 63
Figure 4.4: Different aspects of the link between orthogonal walls [4; 150] ..................... 65
Figure 4.5: Pushover analysis results for different shear strength capacity ....................... 69
Figure 4.6: Comparison between slenderness ratio vs max. global drift percentage for
different types of slender masonry structures ................................................... 72
Figure 4.7: Comparison between height/breadth ratio vs max. global drift percentage for
different types of slender masonry structures ................................................... 73
Figure 4.8: Location of the structure in various slope of the land ...................................... 74
Figure 4.9: Earthquake damage at the bond provided by the adjacent structure ................ 75
Figure 4.10: Position of the tower in the urban context ..................................................... 76
Figure 4.11: Influence of size of openings and number of opening sides at base in the
max. global drift capacity ............................................................................... 77
Figure 4.12: Vertical irregularity scenario: a) reduction in wall thickness; b) presence of
non–supported wall portion ............................................................................ 79
Figure 4.13: Reduction in wall thickness scenario for paraametric analysis: a) linearly
thickness reduction through overall height internally, both way and
externally; b), c), d) 75%, 50% and 25% thickness reduction above
1/4th
of overall height internally, both way and externally; e), f), g) 75%,
50% and 25% thickness reduction above 1/2 of overall height internally,
both way and externally; h), i), j) 75%, 50% and 25% thickness reduction
above height 3/4th
of overall height internally, both way and externally ....... 80
Figure 4.14: Discontinuous scenario in masonry wall section for parametric analysis ..... 80
Figure 4.15: Influence of the reduction in wall thickness in the max. global drift
capacity ........................................................................................................... 81

viii
Figure 4.16: Influence of the presence of non–supported wall portion in the max. global
drift capacity ................................................................................................... 83
Figure 4.17: FE models for parametric analysis ................................................................. 84
Figure 4.18: Influence of number, location and dimensions of openings in the max.
global drift capacity ........................................................................................ 85
Figure 4.19: Different aspects of the link between wall and floor ...................................... 87
Figure 4.20: Types of roof structures according to its thrusting behaviour ........................ 88
Figure 4.21: Non–structural elements: a) bells on bell towers; b) balcony in minarets;
c) pinnacles in Pagoda temples ....................................................................... 89
Figure 4.22: Percentage change in max. global drift (left) and base shear force (right) ..... 92
Figure 4.23: Vulnerability index and vulnerability class distribution of all parameters
for the 78 Pagoda temples assessed ................................................................ 94
Figure 4.24: Vulnerability index and vulnerability class distribution of all parameters
for the 63 masonry towers assessed ................................................................ 97
Figure 4.25: Vulnerability index and vulnerability class distribution of all parameters
for the 32 masonry minarets assessed ............................................................. 99
Figure 4.26: Vulnerability index and vulnerability class distribution of all parameters
for the 8 industrial masonry chimneys assessed ........................................... 102
Figure 4.27: Correlation amongst vulnerability curves for maximum, mean and
minimum value of the vulnerability index .................................................... 105
Figure 4.28: Vulnerability curves for Nepalese Pagoda temples ...................................... 105
Figure 4.29: Vulnerability curves for masonry towers ..................................................... 106
Figure 4.30: Vulnerability curves for masonry minarets .................................................. 106
Figure 4.31: Vulnerability curves for industrial masonry chimneys ................................. 106
Chapter 5: Seismic vulnerability assessment: A case study 109
Figure 5.1: 1934 Earthquake intensity distribution map: a) 1934 Nepal–Bihar
earthquake; b) 1988 Udayapur earthquake ...................................................... 111
Figure 5.2: View of the Indo–Asian collision zone .......................................................... 112
Figure 5.3: Earthquake intensity distribution map of Kathmandu for three anticipated
earthquakes models ......................................................................................... 113
Figure 5.4: Map of Nepal showing the geographical location of surveyed area in three
cities of Kathmandu Valley ............................................................................. 114
Figure 5.5: Vulnerability index distributions: a) Histogram; b) Best fit normal

ix
distributions .................................................................................................... 116
Figure 5.6: Vulnerability index distributions w.r.t.: a) Slenderness ratio;
b) Height/Breadth ratio; c) Height .................................................................. 117
Figure 5.7: Vulnerability distribution map for Nepalese Pagoda temples of three
different cities at Kathmandu Valley: a) Lalitpur; b) Kathmandu;
c) Bhaktapur.................................................................................................... 118
Figure 5.8: Discrete damage distribution histograms for with
different intensities ......................................................................................... 121
Figure 5.9: Fragility curves for different values of : a) b)
............................................................................................... 122
Figure 5.10: Spatial damage distribution corresponding (EMS–98) VI for
Nepalese Pagoda temples of three different cities in the Kathmandu
Valley: a) Lalitpur; b) Kathmandu; c) Bhaktapur ........................................ 123
Figure 5.11: Spatial damage distribution corresponding (EMS–98) for
Nepalese Pagoda temples of three different cities in the Kathmandu
Valley: a) Lalitpur; b) Kathmandu; c) Bhaktapur ........................................ 124
Figure 5.12: Probability of collapsed Pagoda temples for different vulnerability
index values .................................................................................................. 126
Figure 5.13: Probability of unusable Pagoda temples for different vulnerability
index values .................................................................................................. 126
Figure 5.14: Estimation of repair costs............................................................................. 128
Figure 5.15: Comparison of histogram and the best–fit normal distribution curves ........ 131
Figure 5.16: Comparison of discrete damage distribution histograms for
and with
different intensities ....................................................................................... 132
Figure 5.17: Comparison of Fragility curves for and
.................................................................... 133
Figure 5.18: Comparison of probability of collapse Pagoda temples for
and ................ 134
Figure 5.19: Comparison of probability of unusable Pagoda temples for
and ................ 134
Figure 5.20: Comparison of repair cost for and
.................................................................... 135

x

xi
LIST OF TABLES
Chapter 2: Slender masonry structures: A literature review 7
Table 2.1: Database compiled from the literature review for masonry towers .................. 16
Table 2.2: Database compiled from the literature review for masonry minarets ............... 17
Table 2.3: Database compiled from the literature review for masonry chimneys .............. 17
Table 2.4: Database compiled from the literature review for Nepalese Pagoda temples ... 17
Chapter 3: Nepalese Pagoda temples: A sensitivity analysis 29
Table 3.1: Mechanical properties of traditional masonry materials ................................... 40
Table 3.2: Allowable stresses on brick masonry ................................................................ 40
Table 3.3: Material properties adopted in FE modeling of temple structures .................... 40
Table 3.4: Young’s modulus of traditional brick masonry walls ....................................... 41
Table 3.5: Density of traditional construction materials in temples ................................... 41
Table 3.6: Experimental dynamic properties for Nepalese Pagoda temples ...................... 42
Table 3.7: Dimensions of three selected temples ............................................................... 46
Table 3.8: Natural frequencies and modal damping from ambient vibration
measurement ...................................................................................................... 50
Table 3.9: Material properties used in FE modeling .......................................................... 52
Table 3.10: Comparison between measured and computed frequencies ............................ 52
Table 3.11: Analytical frequency of the three temples ....................................................... 52
Table 3.12: Reduction in the fundamental frequency due to various damage scenarios .... 54
Chapter 4: Seismic vulnerability assessment methodology 57
Table 4.1: Vulnerability index ( ) .................................................................................... 60
Table 4.2: Geometrical characteristics of the reference structure ...................................... 63
Table 4.3: Masonry mechanical properties used as input for FE modeling ....................... 64
Table 4.4: Definition of the vulnerability classes for parameter P1 ................................... 65

xii
Table 4.5: Definition of the vulnerability classes for parameter P2 .................................... 66
Table 4.6: Description of the masonry Class A ................................................................... 67
Table 4.7: Description of the masonry Class B ................................................................... 67
Table 4.8: Description of the masonry Class C ................................................................... 68
Table 4.9: Description of the masonry Class D ................................................................... 68
Table 4.10: Definition of the vulnerability classes for parameter P3 .................................. 70
Table 4.11: Characteristic values of shear strength ............................................................. 70
Table 4.12: Definition of the vulnerability classes for parameter P4, in function of
slenderness ratio and height/breadth ratio (according to their influence
over the global drift) ....................................................................................... 73
Table 4.13: Definition of the vulnerability classes for parameter P5 .................................. 75
Table 4.14: Definition of the vulnerability classes for parameter P6 .................................. 76
Table 4.15: Definition of the vulnerability classes for parameter P7, in function of the size
of openings and number of opening sides at base (dimension of openings are
considered centered and equal in all sides) ..................................................... 78
Table 4.16: Definition of the vulnerability classes for parameter P7, in function of the
max. relative eccentricity (% of wall breadth) ................................................ 78
Table 4.17: Definition of the vulnerability classes for parameter P8 due to variation
of wall thickness ............................................................................................. 82
Table 4.18: Definition of the vulnerability classes for parameter P8 due to the presence
of discontinuities in wall (i.e. non–supported wall portion) ........................... 83
Table 4.19: Definition of the vulnerability classes for parameter P9, in function of the
number, location and size of openings (according to their influence in the
global drift) ..................................................................................................... 86
Table 4.20: Define the classes of vulnerability for the parameter P10 ............................... 88
Table 4.21: Definition of the vulnerability classes for parameter P11 ................................ 89
Table 4.22: Definition of the vulnerability classes for parameter P12 ................................ 89
Table 4.23: Sensitivity analysis performed and results obtained ........................................ 91
Table 4.24: Definition of weights as a function of the results for two criteria (global drift
and base shear force) ....................................................................................... 91
Table 4.25: Comparison of weight ( ) for vulnerability assessment parameters .............. 92
Table 4.26: Interpretation of the mean damage grade ( ) ............................................... 103

xiii
Chapter 5: Seismic vulnerability assessment: A case study 109
Table 5.1: Major damaging earthquakes in Himalaya region and essential human
casualties ......................................................................................................... 111
Table 5.2: Mean vulnerability index ( ), Vulnerability class and topology .................... 115
Table 5.3: Interpretation of damage grade, ................................................................. 120
Table 5.4: Estimation of the number of collapsed and unusable Pagoda temples ............ 127
Table 5.5: Estimation of the reduction of collapsed and unusable Pagoda temples
after retrofitting actions .................................................................................. 133

xiv
xv
LIST OF SYMBOLS
Natural period
Fundamental frequency
Plan dimension of the building in the direction of oscillation
Young’s modulus
Mass per unit of length
Specific weight
Poisson’s ratio
Compressive strength
Compressive fracture energy
Tensile strength
Tensile fracture energy
Friction angle
Characteristic shear strength
Horizontal seismic coefficient
Slenderness ratio
Maximum top displacement
Total height
B Breadth at base
Radius of gyration
Cross-sectional area
Minimum moment of inertia
Lateral load intensity
Coefficient depending upon the soil foundation
Seismic zone factor for average acceleration spectra
Average acceleration coefficient

xvi
p Foundation land slope
Relative eccentricity
Tt Thickness of top wall
Tn Thickness of non–supported top wall
Tb Thickness of wall at base
Ht Height of top wall
OA Size of opening above base
OB Size of opening at base
RC Reinforced concrete
Numerical value of vulnerability classes
Weight
Vulnerability index
Mean vulnerability index
Mean damage grade
Macroseismic intensity,
Vulnerability index used in the Macroseismic Method
Ductility factor
Damage grade
Gamma function
Probability occurrence a certain damage grade
Weights indicating the percentage of buildings with a certain damage level
[ ] Repair cost probabilities for a certain intensity
[ ] Probability of the repair cost for each damage level
[ ] Probability of the damage for each level of building vulnerability and
intensity
Probability of collapse
Probability of unusable

1
CHAPTER 1
INTRODUCTION
Summary This introductory chapter presents the background and motivation that
underlines the development of this research proposal. The general and specific objectives of
this research are listed. Finally, this first chapter is closed with the presentation of a detailed
outline and organization of the present thesis.
Chapter outline
1.1 Background
1.2 Motivation
1.3 Objectives
1.3.1 General objectives
1.3.2 Specific objectives
1.4 Organization of the thesis
1.1 Background
Historical slender masonry structures with different characteristics and functions are
distributed all over the world and constitute a relevant part of the architectural and cultural
heritage of humanity. The cultural importance of these structures poses the problem for
their safety and preservation. Unfortunately, several historical constructions suffered
partial or total collapse in the course of time due to earthquakes, fatigue, deterioration, soil
movements, etc. The occurrence of these unexpected and unavoidable events has
demonstrated that historical slender masonry structures are one of the most vulnerable
structural types to suffer strong damage or collapse [1]. These losses are simply not
quantifiable in economic terms, as nether lives nor can cultural heritage be reinstated by
post–earthquake reconstruction plans.
Their protection is a topic of great concern among the scientific community. This
concern mainly arises from the observed damages after every considerable earthquake and
the need and interest to preserve them. Although the recent progress in technology,
seismology and earthquake engineering, the preservation of these brittle and massive
monuments still represents a major challenge [2]. The study of these historical
Chapter 1. Introduction
2
constructions must be undertaken from an approach based on the use of modern
technologies and science. It is the responsibility of the experts to select and adequately
manage the possible technical means needed to attain the required understanding of the
morphology and the structural behaviour of the construction and to characterize its repair
needs, the principles lay general criteria, research and diagnosis, and remedial measures
and health monitoring. A multi–disciplinary approach is required and the peculiarity of
heritage structures, with their complex history, requires the organization of studies and
analysis in steps: condition survey, identification of the causes of damage and decay,
choice of the remedial measures and control of the efficiency of the interventions.
Understanding of the structural behaviour and material characteristics is essential for
intervention over architectural heritage. Diagnosis is based on historical information and
qualitative and quantitative approaches. The qualitative approach is based on direct
observation of the structural damage and material degradation as well as historical and
archaeological research, while the quantitative approach requires material structural
testing, monitoring and structural analysis.
In the context of the seismic risk management of the built environment there are two
main aspects. These aspects refer to the seismic risk assessment and seismic risk reduction.
The seismic risk of a certain structure located in a seismic zone is determined by two
factors, i.e. the seismic hazard and its structural vulnerability. Since the seismic hazard is
unavoidable and is not in our hands to reduce or modify it, the seismic risk reduction may
be attained by reducing their structural vulnerability. Therefore, the vulnerability
assessment of this type of structure is necessary to establish the strengthening strategy in
order to enhance their behaviour when subjected to major earthquakes. Modern
requirements for an intervention include reversibility, minimal intensive repair and
compatibility to the original construction, as well the obvious functional and structural
requirements. Seismic vulnerability assessment of ancient masonry structures is an issue of
most importance at present time.
The present research work is a step to preserve the cultural heritage for future
generation. Seismic vulnerability assessment and seismic risk reduction are the two key
issues for the preservation of slender masonry built heritage, such as Pagoda temples,
towers, minarets and chimneys. The first issue, the hypothesis, corresponds to the
possibility of assessing their seismic vulnerability by developing a simplified vulnerability

Seismic vulnerability assessment of slender masonry structures
3
assessment method. The second issue (i.e. achieving the seismic risk reduction)
corresponds to a proposal for seismic strengthening strategy resourcing to retrofitting
techniques for slender masonry structures by minimum intrusion criteria which are
intended to improve the seismic performance and to reduce the expected damage. Nepalese
Pagoda temples, many of which are considered world classified heritage (UNESCO), are
the main focus case study in the implementation of the method.
1.2 Motivation
The study scope is directed towards conservation and retrofitting/strengthening of
slender masonry structures, which is one of the major concerns in order to preserve the
built heritage for future generations.
The historical slender masonry structures located in seismic prone areas are especially
vulnerable to suffer structural damages, due to their geometrical, mechanical and structural
features, which could lead to global or local collapse mechanisms. The post–earthquake
information from various events (1934 Nepal–Bihar earthquake, 1976 Friuli earthquakes,
1999 Kocaeli and Duzce earthquakes, etc.) reveals that a vast number of such slender
structures were destroyed by the quake. Although numerous collapses and heavy structural
damage evidence were reported following the earthquakes, not many researchers
investigated the seismic behaviour and performance of these structures. Cultural heritage
buildings and monuments are, therefore, at risk, and the cultural loss in the consequence of
an earthquake is incalculable. Furthermore, typical problems of masonry structures such as
material degradation, geotechnical problems, buckling behaviour of slender elements and
the nonlinear behaviour of masonry generated by the presence or development of cracks
for very low horizontal load levels due to its poor tensile strength are of high importance.
The safeguard of this architectural heritage is a fundamental issue in the cultural life of
modern societies. The preservation of the historical construction against the seismic action
is of strategic importance, considering incalculable value of its architectural value.
Presently, conservation and restoration of cultural heritage are one of the major concerns,
since many of them are considered world classified heritage (UNESCO). The need of
preserving historical constructions is thus not only a cultural requirement but also an
economical and developmental demand.

Chapter 1. Introduction
4
This research aims to propose a simplified methodology for the seismic vulnerability
assessment of slender masonry structures and implement it particularly in Nepalese Pagoda
temples as a case study. Moreover, in this research few retrofitting strategy is proposed and
a comparative study is carried out between original and retrofitted (assumed) state Pagoda
temples to understand its effectiveness in loss estimation.
1.3 Objectives
1.3.1 General objective
The broad objective of this research work is to propose a simplified seismic
vulnerability assessment methodology for slender masonry structures.
1.3.2 Specific objectives
The following specific objectives aim to achieve the above mentioned general objective:
• Describe the main features that rule the structural vulnerability of slender masonry
structures (specifically for Nepalese Pagoda temples) reported in the literature;
• Identify the major parameters that influence the dynamic properties of slender
masonry structures;
• Analyze the seismic sensitivity of the common structural components of Nepalese
Pagoda temples;
• Development of a simplified methodology for the seismic vulnerability assessment
of slender masonry structures;
• Application of the proposed methodology for Nepalese Pagoda temples as a case
study;
• Propose a retrofitting strategy for Nepalese Pagoda temples.
1.4 Organization of the thesis
Chapter 1 presents the introduction of the thesis and identifies the specific contributions
to the scientific knowledge in a more general context. This chapter shortly describes the

Seismic vulnerability assessment of slender masonry structures
5
background and motivation for choosing this research and also provides the overview on
the general objective as well as particular objectives to achieve it.
Chapter 2 is an intensive literature review aimed to acquire detailed information and
knowledge on slender masonry structures. This extensive state of the art includes both the
study of different analytical and numerical based approaches and the analysis of the most
relevant experimental campaigns performed. The information regarding damage scenarios
due to past earthquakes, as well as repair and strengthening interventions proposed and
followed by different researchers are discussed. Moreover, this chapter also presents
another important objective of intensive literature review, which was to gather and compile
data on slender masonry structures regarding dynamic, geometrical and mechanical
characteristics for further use in the developing of a reliable numerical formulation for
predicting the fundamental frequency of slender masonry structures.
Chapter 3 corresponds to a second intensive literature review regarding seismic history,
seismic performance, construction system and research carried on Nepalese Pagoda
temples. Moreover, this chapter also presents the task carried out to analyze particular
structural fragilities and characteristics of the historic Nepalese Pagoda temples which
affect their seismic performance. For this task three different Nepalese Pagoda temples
were selected and numerical modeling using SAP 2000 was done. Among those three
temples, one of them was experimentally analyzed for dynamic properties and the model
calibration has carried out. Finally the updated model was used for parametric analysis to
understand the seismic response of the common structural components of Nepalese Pagoda
temples. Outcomes of this task contribute to understand the structural fragilities of Pagoda
temple typology and the associated traditional building technology and construction
details. It has also aided to identify the most influential structural parameters when
assessing seismic vulnerability of such structures.
Chapter 4 presents a simplified methodology for assessing the seismic vulnerability of
slender masonry structures based on a vulnerability index evaluation method. Here, 12
parameters (qualitative and quantitative) are defined to evaluate the vulnerability index for
slender masonry structures. Nonlinear parametric analysis is carried out to calibrate most
of the quantitative parameters, as well as to define the weight of each parameter.
Moreover, this chapter also present the implementation of this methodology for different

Chapter 1. Introduction
6
types of slender masonry structures to develop vulnerability curves for this structural
typology.
Chapter 5 started with the descriptions of task carried out on field survey of 78 Nepalese
Pagoda temples for gathering sufficient information to support the vulnerability
assessment. The information collected in the field survey is crucial for applying the
vulnerability index method on Pagoda temples as case studies. This task will be followed
with the application of the proposed vulnerability index method on these temple structures.
Finally, in this chapter damage and vulnerability mapping of the 78 Nepalese Pagoda
temple structures along with loss assessment and proposal of retrofitting strategy for loss
mitigation will be presented.
Finally, chapter 6 summarizes and presents the most important conclusions derived
from this research work. Moreover, some unsolved issues and recommendations for further
research are mentioned.

7
CHAPTER 2
SLENDER MASONRY STRUTURES: A LITERATURE REVIEW
Summary This chapter presents detailed information and knowledge on slender masonry
structures acquired from an intensive literature review. This chapter is closed with the
presentation of four reliable empirical formulations for predicting the fundamental
frequency of slender masonry structures.
Chapter outline
2.1 Introduction
2.2 State of the art on slender masonry structures
2.2.1 Damage scenario of slender masonry structures in past earthquake
2.2.2 Analytical and experimental investigation on slender masonry structures
2.2.3 Proposed and followed repair and strengthening interventions
2.3 Database collection and analysis
2.3.1 Formulation for computing the fundamental frequency/period of tower and
cantilever structures
2.3.2 Empirical formulae for computing the fundamental frequency of slender
masonry structures
2.3.3 Predictive performance compared and results
2.4 Conclusions
2.1 Introduction
Slender masonry structures such as towers, minarets, chimneys and Pagoda temples (see
Figure 2.1) can be characterized by their distinguished architectural characteristics, age of
construction and original function, but their comparable geometric and structural ratios
yield to the definition of an autonomous structural type. These structures are featured by
their notable slenderness and also represent one of the main differences from most of the
historic structures or even ordinary buildings [1].
Considering that historical masonry is typically characterized by a complex geometry,
irregularities and a high degree of heterogeneity, stress concentrations can occur, thus
promoting local collapses. Hence, the structural failure can be driven even by a moderate
increase in the stress level, which can occur during seismic events or even with the effects
of cyclic loads as wind and temperature variations [2–5]. Moreover, strong earthquakes
tensile damage is distributed along the height of the structure, while the shear damage is

Chapter 2. Slender masonry structures: A literature review
8
concentrated in the lower part [6]. These structures are able to resist gravitational actions,
but as they were not explicitly designed to withstand seismic loading, show particularly
weakness in regard to horizontal loading induced by strong motion [7]. The limited
ductility of the masonry combined the slenderness of theses towers, that behave as a
vertical cantilever fixed at the base, generally provides a rather brittle structural behaviour
[8]. Therefore, these constructions are particularly vulnerable with respect to seismic
action [9].
The dynamic behaviour of a structure is important to define its health status, as well as,
to define the restoration intervention, after damage generated by an earthquake [10]. The
behaviour of slender masonry structures under seismic loads is generally dominated by the
axial stresses that arise from the static vertical loads combined with the dynamic loads
induced by the low–intensity earthquake that is often close to the compression strength of
the traditional masonry material and also makes them more vulnerable to base settlements
[3]. Thus, such structures have long been considered to be particularly susceptible to
seismic actions and therefore, it is crucial to understand the dynamic behaviour of these
structures to preserve and strengthen them against earthquake excitation.
The knowledge of dynamic properties, together with local site seismicity and
stratigraphy, is the starting point for an accurate estimation of the seismic safety of these
structures [11]. A reliable evaluation of the dynamic properties of a structure is of
importance for the analysis of its dynamic behaviour, in particular under seismic actions
[12]. One of the fundamental dynamic properties, so called fundamental frequency, plays a
primary role for the assessment of the seismic demand on structures. It can be evaluated by
numerical analyses, or even according to empirical formulations provided in building
codes. In the case of slender masonry structures, where reliable results are required from
the numerical model analyses for precisely calibrating the interventions work, but
systematic studies focused on this issue are still missing.
The present chapter is driver to describing an intensive literature review regarding the
state of the art on slender masonry structures. The seismic behaviour and failure
mechanisms of slender masonry structures are the most important aspects which determine
the seismic vulnerability of these structures. Hence, a deep understanding of all these
aspects is the basis towards the achievement of their risk reduction, by means of decreasing
their seismic vulnerability using an appropriate retrofitting strategy, which is the main

Seismic vulnerability assessment of slender masonry structures
9
objective of this thesis. Moreover, in this research, a number of literature reviews has been
carried out in order to collect a data regarding the dynamic properties, material and
geometric characteristics of slender masonry structures. The collected database has been
analyzed and correlated to develop a reliable formulation for predicting the fundamental
frequency of such structures.
(a) (b)
(c) (d)
Figure 2.1: Slender masonry structures: a) Towers [13]; b) Minarets [14]; c) Chimney [15]; d) Pagoda
temples
2.2 State of the art on slender masonry structures
2.2.1 Damage scenario of slender masonry structures in past earthquake
The historical slender masonry construction, have demonstrated during the past to be
susceptible to damage, and prone to partial or total collapse, under earthquake actions,
sometimes due to lack or inadequate retrofit [16]. A detailed analysis of the documentation
regarding the damages caused by recent and less recent Italian earthquakes [17; 10] allow
drawing interesting conclusions on the qualitative behaviour of such structures when they

Chapter 2. Slender masonry structures: A literature review
10
are subject to seismic action. In particular, the following issues can be considered as
relevant:
• In isolated bell tower damage patterns are frequently distributed along the whole
height, although they are usually more severe at the base [18] (see Figure 2.2a);
• During strong earthquakes vertical shear cracks are sometimes observed. In this
case, the reduction of the cross–section stiffness during the deformation process
may have a key role on the overall response of the structure [2] (see Figure 2.2b);
• It can be argued that the damage evolution during a dynamic excitation plays a
crucial role in reducing the resisting geometry of the structure, thus activating
higher vibration modes which seem to be associated to the damage of the upper
part, especially the tower crown and the belfry [19; 20] (see Figure 2.2c).
Curti et al. [24] observed in 31 Italian bell towers damaged by the 1976 Friuli
earthquakes that the belfry is the most vulnerable part of the tower due to the presence of
large openings leading to the pillars to be slender and by the top masses. As well as in the
case of towers which share sides with church at different heights are horizontal constraints
that increase the seismic vulnerability of the tower by limiting its slenderness and by
creating localized stiffening zones that could cause the concentration of important stresses.
The documentation by Firat [25], pointed the location of the failure in the minarets that
collapsed during 1999 Kocaeli and Duzce earthquakes (Turkey) was found to be at the near
bottom of the cylinder, where a transition was made from circular to square section (see
Figure 2.2d). The old masonry minarets were also observed to fail near the bottom of the
cylinder, where the minaret connects to the adjacent building or is part of it at the lower
section [22]. Few cases of minor damage were also observed, such as the collapse of parts
of the balcony (see Figure 2.2e) during Kocaeli earthquake (Turkey) [26].

Seismic vulnerability assessment of slender masonry structures
11
(a) (b)
(c) (d) (e)
Figure 2.2: Earthquake induced damage on bell tower and minaret: a) vertical cracks at the base [10]; b)
shear crack on the stem [20]; c) damage at belfry [21]; d) collapse at transition zone [22]; e) partial collapse
of balcony [23]
2.2.2 Analytical and experimental investigation on slender masonry structures
In Italy, the sudden collapse of the Pavia civic tower, in 1989, motivated the
development of many investigations concerning these types of structures [27–37]. These
investigations involved both analytical and experimental analysis including several tasks:
field survey of the „„as built‟‟ configuration and of the crack pattern, non–destructive
testing (e.g. ambient vibration [1; 15; 26; 32; 38–41] or terrestrial laser scanning [15; 42])
and slightly destructive tests (e.g. flat–jack tests [43–45] or sonic pulse velocity tests [46]),

Chapter 2. Slender masonry structures: A literature review
12
laboratory tests on cored samples, finite element modeling and theoretical analysis [16; 28;
39–40; 47–54].
At present, a number of studies are available in the technical literature dealing with
numerical and experimental analyses of slender masonry structures. It can be stated that a
wide and consolidated scientific tradition exists is based on the use of a variety of different
analysis techniques, as for instance:
• Utilization of non–linear FE codes [36; 48–49; 51–52; 55];
• Combined eigenvalues and experimental identification studies [16; 39];
• 2D limit analyses assuming masonry as either a no–tension or a scarcely resistant in
tension material [16; 39; 56];
• 3D nonlinear dynamics of slender towers by specific fiber–element models [57–
58];
• Experimental and in–situ tests [29; 59];
• Repairing and rehabilitation proposals [4; 60].
The results of these studies are peculiar to each structure under investigation, but they
are the outcomes of a common three–step process that consists of the following: (a)
monitoring, (b) diagnosis, and (c) retrofitting. In fact, prevention and rehabilitation can be
successfully achieved only if diagnosis of the building is carefully analyzed [61].
According to what reported in the technical literature the majority of the historical big
structures has been modelled with a so called macro–modeling strategy, i.e. the
heterogeneous masonry is replaced at a structural level by a fictitious material with average
mechanical properties (either orthotropic or isotropic) representing the global response of
the whole structure under increasing loads. In some cases advanced material models have
been used, such as elastic–plastic models with softening and damage, which are the only
ones suitable to have an insight into the structural behaviour of a masonry structure. For
instance, Buti‟s bell tower (Italy) was studied by Bernardeschi et al. [49] in the presence of
two different load conditions: firstly the bell tower was subjected only to its own weight
and then to both self–weight and static horizontal loads simulating seismic actions. An 8th
–
century masonry tower (Sineo in Alba, Italy) was numerically analysed and monitored by
Carpinteri et al. [55], in order to investigate the causes of dangerous crack patterns

Seismic vulnerability assessment of slender masonry structures
13
occurring at the base. Several dynamic structural characterizations are also available in the
specialized literature, as for instance the study conducted by Ivorra and Pallares [38] on the
bell tower of „„Nuestra Sra. de la Misericordia Church‟‟ (Valencia, Spain). With reference
to the geometrical configuration of the bell tower, different numerical models were
calibrated, on the basis of dynamic tests, in order to determine the bending and torsion
frequencies of the tower. In [4], some remarks regarding the basic design choices and the
selection of the most appropriate materials and techniques for the restoration of the Monza
Cathedral bell tower are reported. A seismic analysis of the Asinelli Tower in Bologna
(Italy) is performed by Riva et al. [36]. In this study, an assessment of the tower‟s stability
with respect to seismic events, compatible with the local seismic hazard, is carried out by
means of a non–linear dynamic analysis on a simplified model mainly made of beam
elements with non–linear stress–strain behaviour. The application of geo–radar techniques
to the analysis of three main structural problems concerning the bell tower (Torrazzo) in
Cremona is studied by Binda et al. [29]. Their study demonstrates the necessity and the
great potentialities of a multidisciplinary collaboration in morphological analyses and
diagnoses carried out by means of non–destructive investigations.
2.2.3 Proposed and followed repair and strengthening interventions
Nowadays, there is a huge variety of techniques and materials available for the
protection of historical masonry constructions. Among them, two main techniques are
distinguished, the rehabilitation or restoration works and the retrofitting. The rehabilitation
or restoration works aim to use materials of similar characteristics to the originals and to
mainly apply the same constructive techniques, in order to locally correct the damage of
certain structural elements, e.g. sealed up of cracks and reposition of mortar and units. In
general terms, the objective of these works is to preserve the building in good conditions
and in its original state, mainly to withstand the vertical loading generated by self–weight.
By the other hand, the structural retrofitting intends to use modern techniques and addition
of advanced materials in order to mainly improve the seismic performance of the building,
by increasing its ultimate lateral load capacity (strength), ductility and energy dissipation.
Compatibility, durability and reversibility are the fundamental aspects recommended in
literature to be taken into account when retrofitting is applied for the seismic protection of
cultural heritage.

Chapter 2. Slender masonry structures: A literature review
14
In order to improve the structural behaviour of the tower, a series of repair and
strengthening techniques are proposed to be executed both at a local and global level. This
consisted of the application of [4]:
• Metallic horizontal reinforcing rings on several sections along the height of the
tower to confine the masonry and to improve the connection between the
contiguous walls;
• The application of the reinforced repointing technique diffused on various portions
of the walls to counteract the creep damage, and concentrated on some pilaster
strips to strengthen the corners;
• Local interventions of injection, rebuilding and pointing of the mortar joints, to
restore the zones having high material deterioration.
The study carried out by Ceroni et al. [62] on bell Tower of Santa Maria Del Carmine
(Italy), reported the following intervention work on past:
• By the end of the 19th century, several steel tie rods have been inserted connecting
the orthogonal walls and placed symmetrically and parallel to the walls (see Figure
2.3a) with various end anchorage systems (plate for strands, horizontal and vertical
bars (see Figure 2.3b; 2.3c; 2.3d).
• During the 1970s, several internal steel chains were added and RC injections were
conducted in numerous areas corresponding particularly to the connections of the
RC staircase in the masonry walls and in the corners.
• After the 1980 Irpinia earthquake, mortar injections, reinforced with steel bars,
were carried out in the corners of most floors under the fourth level. The connection
was improved with a diffuse system of steel reinforced inclined mortar injections.
In order to stabilize an existing deformed structure and to stop its further unhinging
development, prestress cables are suggested by Stavroulaki et al. [63] in Torre Grossa at
San Gimignano (Italy). The technique of externally placed tendons is widely used for the
reinforcement of existing structures, because of several advantages: minimum disturbance
of the structure and its users, negligible change of mass, stiffness and dynamic

Seismic vulnerability assessment of slender masonry structures
15
characteristics of the existing structure, minimum loss of prestressing forces due to friction,
and the use of high–quality materials with known properties [62; 64–66].
(a) (b)
(c) (d)
Figure 2.3: Steel tie rods [62]: a) inferior view of system of four tie rods; b) external anchorage for steel
strands; c) external anchorages and closure of existing windows; d) external horizontal anchorage
2.3 Database collection and analysis
Slender masonry structures can be characterized by their distinguished architectural
characteristics, age of construction and original function, but their comparable geometric
and structural ratios yield to the definition of an autonomous structural type. These
structures are characterized by their notable slenderness and also represent one of the main
differences from most of the historic structures or even ordinary buildings [1]. These
structures are scattered over different countries with different densities and features.
Database of such structures was compiled through a systematic literature review. Data was
acquired from experimental works performed on the determination of dynamic properties
and material characteristics.
Chapter 2. Slender masonry structures: A literature review
16
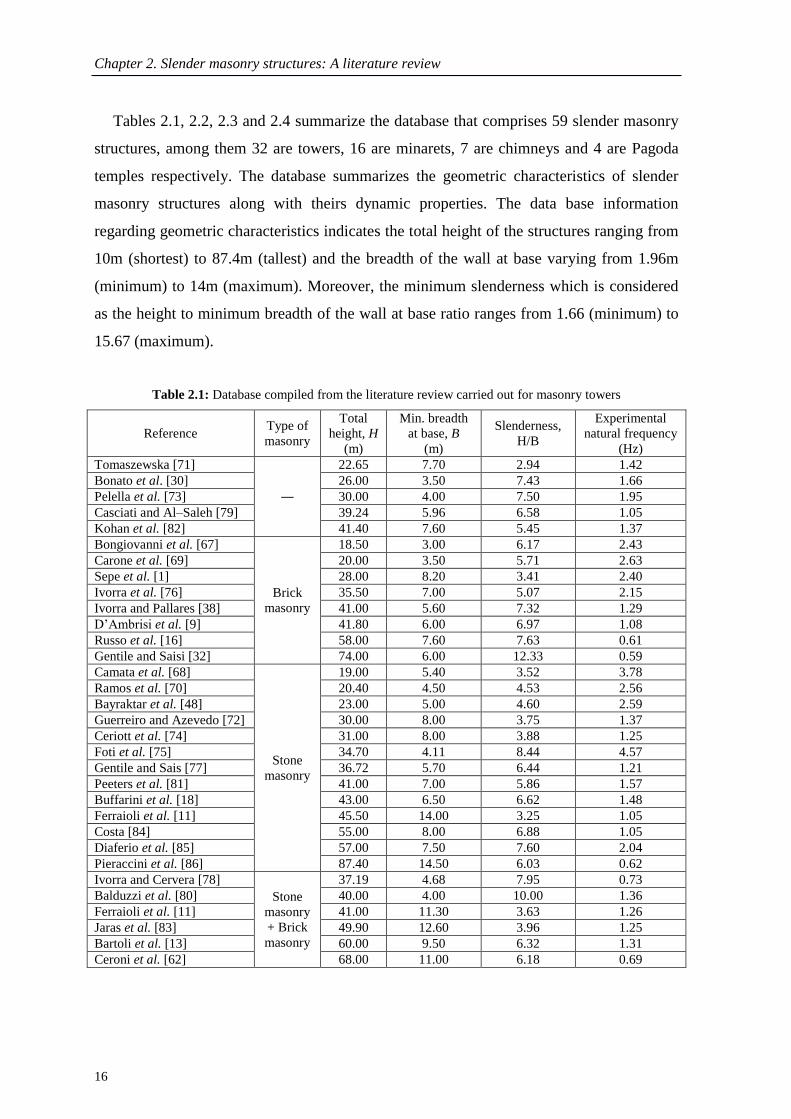
Tables 2.1, 2.2, 2.3 and 2.4 summarize the database that comprises 59 slender masonry
structures, among them 32 are towers, 16 are minarets, 7 are chimneys and 4 are Pagoda
temples respectively. The database summarizes the geometric characteristics of slender
masonry structures along with theirs dynamic properties. The data base information
regarding geometric characteristics indicates the total height of the structures ranging from
10m (shortest) to 87.4m (tallest) and the breadth of the wall at base varying from 1.96m
(minimum) to 14m (maximum). Moreover, the minimum slenderness which is considered
as the height to minimum breadth of the wall at base ratio ranges from 1.66 (minimum) to
15.67 (maximum).
Table 2.1: Database compiled from the literature review carried out for masonry towers
Reference Type of
masonry
Total
height, H
(m)
Min. breadth
at base, B
(m)
Slenderness,
H/B
Experimental
natural frequency
(Hz)
Tomaszewska [71]
―
22.65 7.70 2.94 1.42
Bonato et al. [30] 26.00 3.50 7.43 1.66
Pelella et al. [73] 30.00 4.00 7.50 1.95
Casciati and Al–Saleh [79] 39.24 5.96 6.58 1.05
Kohan et al. [82] 41.40 7.60 5.45 1.37
Bongiovanni et al. [67]
Brick
masonry
18.50 3.00 6.17 2.43
Carone et al. [69] 20.00 3.50 5.71 2.63
Sepe et al. [1] 28.00 8.20 3.41 2.40
Ivorra et al. [76] 35.50 7.00 5.07 2.15
Ivorra and Pallares [38] 41.00 5.60 7.32 1.29
D‟Ambrisi et al. [9] 41.80 6.00 6.97 1.08
Russo et al. [16] 58.00 7.60 7.63 0.61
Gentile and Saisi [32] 74.00 6.00 12.33 0.59
Camata et al. [68]
Stone
masonry
19.00 5.40 3.52 3.78
Ramos et al. [70] 20.40 4.50 4.53 2.56
Bayraktar et al. [48] 23.00 5.00 4.60 2.59
Guerreiro and Azevedo [72] 30.00 8.00 3.75 1.37
Ceriott et al. [74] 31.00 8.00 3.88 1.25
Foti et al. [75] 34.70 4.11 8.44 4.57
Gentile and Sais [77] 36.72 5.70 6.44 1.21
Peeters et al. [81] 41.00 7.00 5.86 1.57
Buffarini et al. [18] 43.00 6.50 6.62 1.48
Ferraioli et al. [11] 45.50 14.00 3.25 1.05
Costa [84] 55.00 8.00 6.88 1.05
Diaferio et al. [85] 57.00 7.50 7.60 2.04
Pieraccini et al. [86] 87.40 14.50 6.03 0.62
Ivorra and Cervera [78]
Stone
masonry
+ Brick
masonry
37.19 4.68 7.95 0.73
Balduzzi et al. [80] 40.00 4.00 10.00 1.36
Ferraioli et al. [11] 41.00 11.30 3.63 1.26
Jaras et al. [83] 49.90 12.60 3.96 1.25
Bartoli et al. [13] 60.00 9.50 6.32 1.31
Ceroni et al. [62] 68.00 11.00 6.18 0.69

Seismic vulnerability assessment of slender masonry structures
17
Table 2.2: Database compiled from the literature review for masonry minarets
Reference Type of
masonry
Total
height, H
(m)
Min. breadth
at base, B
(m)
Slenderness,
H/B
Experimental natural
frequency
(Hz)
Oliveira et al. [26]
Brick
masonry
23.02 3.73 6.17 1.68
38.65 3.68 10.50 0.80
41.60 3.97 10.48 1.37
48.70 4.64 10.50 1.18
51.70 5.12 10.10 0.95
63.20 4.96 12.74 1.02
66.55 7.52 8.85 1.32
66.55 7.52 8.85 1.17
74.40 6.50 11.45 0.83
Zaki et al. [87]
Stone
masonry
20.00 3.40 5.88 1.84
El–Attar et al. [41] 24.48 3.80 6.44 1.95
Pau and Vestroni [88] 30.00 3.55 8.45 1.45
Turk and Cosgun [89] 40.25 3.00 13.42 0.88
Oliveira et al. [26] 44.96 5.28 8.52 1.03
Krstevska et al. [90] 47.00 3.00 15.67 1.04
Oliveira et al. [26] 54.90 4.80 11.44 0.63
Table 2.3: Database compiled from the literature review carried industrial masonry chimneys
Reference Type of
masonry
Total
height, H
(m)
Min. breadth
at base, B
(m)
Slenderness,
H/B
Experimental
natural frequency
(Hz)
Aoki and Sabia [91]
Brick
masonry
15.00 1.96 7.65 2.69
Costa [92] 22.86 2.20 10.39 1.37
Yamamoto and Maeda [93] 23.10 2.34 9.87 1.00
Eusani and Benedettini [95] 36.00 3.40 10.59 0.93
Lopes et al. [15] 41.40 3.70 11.19 0.61
Costa et al. [96] 45.60 4.30 10.60 0.79
Grande and Aҫores [94] Stone
masonry 31.00 4.00 7.75 1.13
Table 2.4: Database compiled from the literature review carried Nepalese Pagoda temples
Reference Type of
masonry
Total height,
H (m)
Min. breadth at
base, B (m)
Slenderness,
H/B
Experimental natural
frequency (Hz)
Jaishi et al. [97]
Brick
masonry
10.00 3.00 3.33 3.10
Shakya et al. [98] 12.76 3.48 3.67 2.06
Jaishi et al. [97] 16.93 10.20 1.66 2.32
27.00 6.58 4.10 1.68
The database information regarding dynamic properties shows the frequencies of the
reviewed structures. It is noticeable in the database that the fundamental frequency of
slender masonry structures is highly influenced by height of the structure and slenderness
ratio (i.e. the taller the structure the lower the fundamental frequency and similarly higher
the slenderness ratio lower the fundamental frequency). The database reveals that the tower
structures have third mode shape as torsion. All the experimental frequency for various

Chapter 2. Slender masonry structures: A literature review
18
slender masonry structures presented here in database is measured by different authors
using ambient vibration test. Note that there is much less information regarding dynamic
properties of chimneys and Pagoda temples because research in these types of structures is
taking its 1st step.
2.3.1 Formulation for computing the fundamental frequency/period of tower and
cantilever structures
The empirical formulation proposed for the prediction of fundamental period/frequency
for bell tower/cantilever structures by different codes and authors are taken as a basis for
developing new empirical formulae for such structures. Later, the predictive performance
between previous author‟s formulations and newly developed formulation are compared
with reference to the experimental fundamental frequency.
A linear relation between the fundamental vibration period ( ) and the height ( ) of
the tower proposed by Faccio et al. [99] is:
The formulation in Eq. better fits the experimental data, for slender structures
with a period lower than 1sec, however, it slightly underestimates the period higher than
1sec [12].
An empirical correlation for the prediction of the natural period ( ) of Italian masonry
towers as a function of height ( ) has been proposed by Rainieri and Fabbrocin [12]:
Eq. leads to an overestimation for low values of the natural period and to an
underestimation at the higher values of the natural period [12].
From Eq. , proposed by the Spanish Standard NCSE–02 [100], the value of the
estimated fundamental frequency of towers ( ) can be obtained by:

Seismic vulnerability assessment of slender masonry structures
19
√
√
where, is the plan dimension of the building in the direction of oscillation, is the
height of tower.
Eq. leads to an overestimation for low values of the natural period and to an
underestimation for higher values of the period [12].
The first frequency of vibration ( ) for cantilever [101] is given by:
√
where, is the modulus of elasticity, the moment of inertia, the mass per unit of
length, and the total length of the cantilever.
2.3.2 Empirical formulae for computing the fundamental frequency of slender
masonry structures
On the basis of previous formulations and compiled database, four new empirical
formulations are developed for the reliable prediction of fundamental frequency of slender
masonry structures. Each formulation is further expressed in three sub formulations
depending upon different multiplication factors, for three different structures categories
(i.e. all types of slender masonry structures, towers (bell tower, clock tower, civic tower
etc.) and minarets). Linear R squared approach is carried out to evaluate the predictive
performance of these proposed empirical formulations.
On the basis of power correlation with the experimental fundamental frequency, the first
formulation for predicting fundamental frequency ( ) is developed as a function of height
( ), which is presented in Eq.

Chapter 2. Slender masonry structures: A literature review
20
where,
= 0.0517 and = 0.76 (for all types of slender masonry structures); with R2 = 0.59
= 0.0151 and = 1.08 (for masonry tower structures); with R2 = 0.73
= 0.1178 and = 0.533 (for masonry minaret structures); with R2 = 0.59
On the basis of Eq. formulation, here is suggested a second formulation (Eq. )
for the prediction of the fundamental frequency ( ) of slender masonry structures as a
function of the height ( ) and the minimum breadth at base ( ):
(
)
where,
= 0.038, = 0.25 and = 1 (for all types of slender masonry structures); with R2 =
0.89
= 0.03, = 0.17 and = 0.5 (for all masonry tower structures); with R2 = 0.96
= 0.1, = 1 and = 1 (for all masonry minaret structures); with R2 = 0.46
Retaining the basic structures of Eq. , where fundamental frequency of a slender
structure is expected to be a function of the second moment of area ( ), height of the
structures ( ), young‟s modulus of elasticity ( ) and the mass per unit of length ( ), a
third formulation (Eq. ) for the prediction of the fundamental frequency ( ) of
slender masonry structures is proposed accounting for all these parameters.
√
where,
= 1.425 (for all types of slender masonry structures); with R2 = 0.56
= 1.375 (for all masonry tower structures); with R2 = 0.48
= 1.345 (for all masonry minaret structures); with R2 = 0.89

Seismic vulnerability assessment of slender masonry structures
21
On the basis of power correlation with the experimental fundamental frequency, the
formulation for predicting fundamental frequency ( ) is developed as a function of
minimum slenderness ratio, i.e. height ( ) to minimum breadth at base ratio ( , which is
presented in Eq.
(
)
where,
= 3.648 and = 0.55 (for all types of slender masonry structures); with R2 = 0.33
= 3.58 and = 0.57 (for masonry tower structures); with R2
= 0.20
= 8.03 and = 0.86 (for masonry minaret structures); with R2
= 0.58
Here, the newly developed formulations expressed in Eq. ( ), Eq. ( ) and Eq. ( )
are basically function of geometrical characteristics whereas Eq. ( ) is the function of
both geometrical and mechanical characteristics. These formulations have been compared
with experimental database and previous formulations by other authors for validation.
2.3.3 Predictive performance compared results
The fundamental frequency predicted by the proposed empirical formulations is
compared with previous authors‟ estimation and also with the experimental fundamental
frequency. Moreover, predictive performance of proposed sub–formulations for various
types of slender masonry structures is also compared for validation of their reliability.
Figure 2.4 illustrates the comparison between the experimental and empirical
fundamental frequency expressed according to different predictive formulations for all
types of slender masonry structures. Results reveal that empirical formulation proposed by
Faccio et al. [99] and Rainieri and Fabbrocin [12], leads to an overestimation of the
fundamental frequency for slender structures of height between 15m to 50m, while the
values from Eq. ( ) better fit the experimental fundamental frequency.

Chapter 2. Slender masonry structures: A literature review
22
Figure 2.4: Comparison between experimental and predicted values of the fundamental frequency of slender
masonry structures according to different formulation
Figure 2.5 illustrates the comparison of empirical fundamental frequency expressed by
Eq. ( ) for different types of slender masonry structures. Results reveal that the
fundamental frequency predicted by three different sub–formulations (i.e. for all types of
slender masonry structures, towers and minarets) derived from Eq. ( ), using different
numerical values for factor and , have different trendlines, which suggest, it is not
reliable to estimate the fundamental frequency for all types of slender masonry structures
using a single formulation. Therefore, for the better predictive performance, it is better to
estimate using individual formulation presented in Eq. ( ).
Figure 2.5: Comparison of the fundamental frequencies predicted by three different sub–formulations of Eq.
( ) for all types of slender masonry structures, towers and minarets
0.0
0.5
1.0
1.5
2.0
2.5
3.0
3.5
4.0
0 10 20 30 40 50 60 70 80 90
Fre
qu
ency
(H
z)
Height (m)
Freq. for all types of slender masonry
structures (Experimental)Freq. trendline using Eq. (2.5) for all
types of slender masonry structuresFreq. trendline using Eq. (2.1)
Freq. trendline using Eq. (2.2)
R² = 0.59
R² = 0.73
R² = 0.59
0.0
0.5
1.0
1.5
2.0
2.5
3.0
3.5
4.0
0 10 20 30 40 50 60 70 80 90
Fre
qu
ency
(H
z)
Height (m)
Freq. for towers
(Experimental)
Freq. for minarets
(Experimental)
Freq. for chimneys
(Experimental)
Freq. for Pagoda temples
(Experimental)
Freq. trendline using Eq.
(2.5) for all types of
slender masonry structuresFreq. trendline using Eq.
(2.5) for towers
Freq. trendline using Eq.
(2.5) for minarets

Seismic vulnerability assessment of slender masonry structures
23
Similarly, Figure 2.6 illustrates the comparison between experimental and empirical
fundamental frequency expressed according to NCSE–02 [100] and Eq. ( ). Results
show that empirical formulation proposed by NCSE–02 [100], leads to an underestimation
of fundamental frequency for the slender masonry structures 15m to 40m height, while the
values from Eq. ( ) formulation better fit the experimental fundamental frequency.
Figure 2.6: Comparison between experimental and predicted values of the fundamental frequency according
to Eq. ( ) and Eq. ( ) for all types of slender masonry structures
Result of the comparison between empirical fundamental frequencies expressed by Eq.
( ) for different types of slender masonry structures is shown in Figure 2.7. Here, the
result reveals that the fundamental frequency predicted by three different sub–formulations
(i.e. for all types of slender masonry structures, towers and minarets) derived from Eq.
( ), using different numerical values for factor , and , have a similar trendline,
which suggests that it is reliable to estimate fundamental frequency for all types of slender
masonry structures including towers with the same formulation. However, results also
show that sub–formulation derived from Eq. ( ) for the minarets has a different trendline
than others, which means that for the better predictive performance, it is better to estimate
the fundamental frequency of minaret structures using different formulation presented in
Eq. ( ).
0.0
0.5
1.0
1.5
2.0
2.5
3.0
3.5
4.0
0 10 20 30 40 50 60 70 80 90
Fre
qu
ency
(H
z)
Height (m)
Freq. for all types of slender masonry
structures (Experimental)
Freq. trendline using Eq. (2.6) for all types
of slender masonry structures
Freq. trendline using Eq. (2.3)

Chapter 2. Slender masonry structures: A literature review
24
Figure 2.7: Comparison of the fundamental frequencies predicted by three different sub–formulations of Eq.
( ) for all types of slender masonry structures, towers and minarets
Figure 2.8 illustrates the comparison between experimental and fundamental frequency
expressed according Eq. ( ) and Eq. ( ). Results show that formulation proposed in Eq.
( ), leads to an underestimation of fundamental frequency, while the values from Eq.
( ) formulation better fit the experimental fundamental frequency.
Figure 2.8: Comparison between experimental and predicted values of the fundamental frequency according
to Eq. ( ) and Eq. ( ) for all types of slender masonry structures
Figure 2.9 illustrates the comparison of empirical fundamental frequency expressed by
Eq. ( ) for different types of slender masonry structures. Result reveals that the
R² = 0.89
R² = 0.96
R² = 0.46
0.0
0.5
1.0
1.5
2.0
2.5
3.0
3.5
4.0
0 10 20 30 40 50 60 70 80 90
Fre
qu
ency
(H
z)
Height (m)
Freq. for towers
(Experimental)
Freq. for minarets
(Experimental)
Freq. for chimneys
(Experimental)
Freq. for Pagoda temples
(Experimental)
Freq. trendline using Eq.
(2.6) for all types of
slender masonry structuresFreq. trendline using Eq.
(2.6) for towers
Freq. trendline using Eq.
(2.6) for minarets
0.0
0.5
1.0
1.5
2.0
2.5
3.0
3.5
4.0
0 10 20 30 40 50 60 70 80 90
Fre
quen
cy (
Hz)
Height (m)
Freq. for all types of slender masonry
structures (Experimental)
Freq. trendline using Eq. (2.7) for all types
of slender masonry structures
Freq. trendline using Eq. (2.4)

Seismic vulnerability assessment of slender masonry structures
25
fundamental frequency predicted by three different sub–formulations (i.e. for all types of
slender masonry structures, towers and minarets) derived from Eq. ( ), using different
numerical values for factor , have similar trendlines, which suggest that it is reliable to
estimate the fundamental frequency for all types of slender masonry structures including
towers and minarets resourcing to a single formulation. But, for the better predictive
performance, it is better to estimate using individual formulation presented in Eq. ( ).
Figure 2.9: Comparison of the fundamental frequencies predicted by three different sub–formulations of Eq.
( ) for all types of slender masonry structures, towers and minarets
Lastly, Figure 2.10 illustrates the comparison between experimental and empirical
fundamental frequency expressed according Eq. ( ) for all types of slender masonry
structures. Result shows that an empirical formulation proposed, lead to better fit the
experimental fundamental frequency.
Figure 2.11 illustrates the comparison of empirical fundamental frequency expressed by
Eq. ( ) for different types of slender masonry structures. Result reveals that the
fundamental frequency predicted by three different sub–formulations (i.e. for all types of
slender masonry structures, towers and minarets) derived from Eq. ( ), using different
numerical values for factor and , have a similar trendline, which suggest that it is
reliable to estimate fundamental frequency for all types of slender masonry structures
including towers with the same formulation. However, results also show that sub–
formulation derived from Eq. ( ) for the minarets has a different trendline than others,
which means that for the better predictive performance, it is better to estimate the
R² = 0.56
R² = 0.48
R² = 0.89
0.0
0.5
1.0
1.5
2.0
2.5
3.0
3.5
4.0
0 10 20 30 40 50 60 70 80 90
Fre
qu
ency
(H
z)
Height (m)
Freq. for towers
(Experimental)
Freq. for minarets
(Experimental)
Freq. for chimneys
(Experimental)
Freq. for Pagoda temples
(Experimental)
Freq. trendline using Eq.
(2.7) for all types of
slender masonry structuresFreq. trendline using Eq.
(2.7) for towers
Freq. trendline using Eq.
(2.7) for minarets

Chapter 2. Slender masonry structures: A literature review
26
fundamental frequency of minaret structures using different formulation presented in Eq.
( ).
Figure 2.10: Comparison between experimental and predicted values of the fundamental frequency
according to Eq. ( ) for all types of slender masonry structures
Figure 2.11: Comparison of the fundamental frequencies predicted by three different sub–formulations of
Eq. ( ) for all types of slender masonry structures, towers and minarets
Among all of four empirical formulation proposed, Eq. ( ) has the highest linear R
squared value (R2), which obviously is the best predictive performance formulation for all
types of slender masonry structures.
0.0
0.5
1.0
1.5
2.0
2.5
3.0
3.5
4.0
0 2 4 6 8 10 12 14 16
Fre
qu
ency
(H
z)
Height/Breadth
Freq. for all types of slender masonry
structures (Experimental)
Freq. trendline using Eq. (2.8) for all
types of slender mansonry structures
R² = 0.33
R² = 0.20 R² = 0.58
0.0
0.5
1.0
1.5
2.0
2.5
3.0
3.5
4.0
0 2 4 6 8 10 12 14 16
Fre
quen
cy (
Hz)
Height/Breadth
Freq. for towers
(Experimental)
Freq. for minarets
(Experimental)
Freq. for chimneys
(Experimental)
Freq. for Pagoda temples
(Experimental)
Freq. trendline using Eq.
(2.8) for all types of
slender masonry structuresFreq. trendline using Eq.
(2.8) for towers
Freq. trendline using Eq.
(2.8) for minarets

Seismic vulnerability assessment of slender masonry structures
27
2.4 Conclusions
Researchers have identified that one of the most important parameters that determines
the vulnerability of such kind of structures is its slenderness. At present, many studies are
available in the technical literature for the numerical/experimental analysis of slender
masonry structures. A main issue in the seismic behaviour of slender masonry structures is
the influence of the axial stresses induced by gravity loads, whose values are often of the
same order of magnitude as the ultimate compression of the masonry material. This
behaviour, combined with the dynamic characteristics of the seismic action represents a
major challenge.
In the present chapter the database compiled is the key constituent in the calibration of
empirical formulations for the prediction of the fundamental frequency for slender
masonry structures. Data was collected through literature review on slender masonry
structures regarding experimental natural frequency, geometrical and mechanical
characteristics. The experimental fundamental frequencies have been correlated to develop
an empirical formulation for the prediction of the fundamental frequency of slender
masonry structures. Based on all documented and validated experimental data, reliable
empirical formulations for the better prediction of the fundamental frequency for slender
masonry structures are proposed. Comparative results confirm that the newly developed
formulation has a reliable predictive performance.

28

29
CHAPTER 3
NEPALESE PAGODA TEMPLES: A SENSITIVITY ANALYSIS
Summary This chapter corresponds to a second intensive literature review regarding
seismic history, seismic performance, construction system and researches carried on
Nepalese Pagoda temples. Moreover, this chapter also presents the task carried out to
analyze particular structural fragilities and characteristics of the historic Nepalese Pagoda
temples which affect their seismic performance.
Chapter outline
3.1 Introduction
3.2 State of the art on Nepalese Pagoda temples
3.2.1 History of Nepalese Pagoda temples
3.2.2 Structural characterization of Nepalese Pagoda temples
3.2.2.1 Foundations
3.2.2.2 Masonry walls
3.2.2.3 Timber members
3.2.2.4 Roof system
3.2.3 Seismic behaviour of Nepalese Pagoda temples
3.2.4 Previous research on Nepalese Pagoda temples
3.2.4.1 Material properties of structural components
3.2.4.2 Dynamic properties of Nepalese Pagoda Temple
3.2.4.3 Analytical failure modes of Nepalese Pagoda Temple
3.2.5 Strengthening practice on Nepalese Pagoda temples
3.3 Seismic sensitivity analysis of the common structural components
3.3.1 Numerical modeling of temples
3.3.2 Experimental modal identification and model updating
3.3.2.1 Ambient vibration test of Radha Krishna temple
3.3.2.2 Calibration and validation of numerical model
3.3.3 Parametric analysis and results
3.4 Conclusions
3.1 Introduction
Nepal is located in a highly active tectonic region of the Himalayan belt, one of the
most severe earthquake prone areas of the world. Nepal is lying between the Indian and the
Eurasian plate, which are moving continuously, resulting in frequent devastating
earthquakes. Cultural heritage buildings and monuments are, therefore, at risk, and the
eventual cultural loss in the consequence of an earthquake is incalculable. Post–seismic

Chapter 3. Nepalese Pagoda temples: A sensitivity analysis
30
surveys of past earthquakes have shown the potential damage that unreinforced masonry
structures, particularly Pagoda temples, may suffer in future earthquakes.
Most of the Nepalese Pagoda temples, erected during 14th
century, are considered non–
engineered constructions that follow very simple rules and construction detailing in respect
to seismic resistance requirements and, in some cases, without any concern for seismic
action. Presently, conservation and restoration of Nepalese temples is one of the major
concerns, since they are considered world heritage with universal value. The present
research is devoted to outline particular building characteristics of the UNESCO classified
Nepalese Pagoda temples and the common structural fragilities, which may affect their
seismic performance. Moreover, based on a parametric sensitivity analysis, structural
weaknesses and fragilities of Pagoda temples were identified associated to the local and
traditional construction techniques, detailing and common damages.
3.2 State of the art on Nepalese Pagoda temples
3.2.1 History of Nepalese Pagoda temples
Nepalese Pagoda temples, built as a structure reserved for religious or spiritual
activities, began to appear around the middle of 14th
century during the Malla Dynasty
(1200–1768) [102]. Almost all the monuments, independence/irrespective of types, such
as different tiered roof temples, pati, sattal, monastris, dhungedhara, chaityas, viharas,
stupas, etc. and traditional private houses that belong to the Malla period which is also
known as the medieval period. These monuments were constructed when there were no
mechanical and technical facilities and were handcrafted to a high quality and in a vast
quantity, with the best available materials and skills at the time of their construction [103].
3.2.2 Structural characterization of Nepalese Pagoda temples
The main peculiarities of Pagoda temples in comparison to other traditional masonry
structures are their considerable wall thickness, multi–tiered roof, box type configuration,
and considerable plinth section and height (see Figure 3.1). These structures are
constructed using brick masonry and timber members with tiles or metal roof coverings.

Seismic vulnerability assessment of slender masonry structures
31
Figure 3.1: Nepalese Pagoda temples
3.2.2.1 Foundations
Conservation works are usually done plinth upwards, therefore, the foundation of
existing temples have rarely been studied in depth, and hence the condition of foundations
is unknown. After the 1934 earthquake some temples were rebuilt over the old foundation,
since those still presented good condition. The foundation of the tiered temple is often just
as wide as the plinth platform itself and appears as a masonry mat foundation. This has led
many observers (apparently expecting a foundation in the pattern of stepped footings for
the main masonry walls) to suggest that tiered temples had no foundation at all [104].
Observations of existing temples with high plinth show that it is usual for the plinth mat to
be built directly off the ground level or on a thin brick soling. However, the temples with
shallow plinths rise from some depth below ground. As for the foundation and massive
plinth (1 to 5m height) in pyramid shape, these yield even more complexity.
Figure 3.2a and Figure 3.2b show schematic examples of the foundation of Nepalese
Pagoda temples with low and high plinth, respectively. These expressive plinth base
massive foundations will benefit to eliminate the earthquake risks associated with soft soils
[105].

Chapter 3. Nepalese Pagoda temples: A sensitivity analysis
32
Figure 3.2: Temple section with foundation: a) Shiva temple; b) Nyatopol temple [106]
3.2.2.2 Masonry walls
Brick masonry walls constructed in the longitudinal and transverse directions are the
main load bearing system in these temples. In case of multi–tiered temples, wall thickness
is not the same for every storey, it reduces from ground storey to top tower (see Figure
3.2b). The thickness of the masonry walls range from 50cm to 75cm and were constructed
with three layers in a single cross–section as shown in Figure 3.3. The outer faces of the
walls are made of fired clay bricks with smooth finishing and inner face is made of sun
dried bricks [107]. Outer and inner face wall layer was not well connected with the middle
core wall. Normally, the middle core is filled with rubble stone, brick fragment and mud,
which made the wall very poor to withstand in some cases heavy load from the main
structure. Similar multi–leaf masonry walls construction practice in several buildings of the
historical city centers of L‟Aquila and Castelvecchio Subequo is reported by Indirli et al.
[108]. The bonding mortar inside the massive walls is not visible from the outside but has a
very significant influence on the structural strength and capacity of the temples. In many
temples, yellow clay mortar, mud mortar and, more rarely, lime–surkhi mortar was used
[109]. The main masonry wall system arrangements and fabric of existing multi–tiered
temples are shown in Figure 3.4.

Seismic vulnerability assessment of slender masonry structures
33
Figure 3.3: Traditional wall section Figure 3.4: Schematic representation of wall system of
Nepalese Pagoda temples: a) one sides open; b) three sides open; c) four sides open; d) walk way between
outer colonnade and inner wall, inner wall with one door opening; e) walk way between outer colonnade and
inner wall, inner wall with four door openings; f) double wall system, walkway between walls, all four sides
door openings
3.2.2.3 Timber members
The Pagoda temple height ranges from one to five tier symmetric structures with brick
masonry and timber elements. The ground floor consists of a Sal wood (Shorea Robusta)
timber framing system. These frames arrangements support the wall of 2.5 to 3.5m height
above it, which supports the first roofing system and also has decorative features. The
sections marked in Figure 3.5 reveal the traditional construction of the top tower, which
rest on timber joists and timber columns along with timber beams, supporting the walls
above. The timber columns at the base level stand on a stone base with a small pin inserted
into the stone and the top of the timber column‟s pin goes through the beam, as shown in
Figure 3.6.
Most of the temples have timber first floors, built using simple battens or joists upon
which timber planks are laid. These in turn support the final floor finish. This technique
closely resembles to the ancient masonry buildings floor structure construction practice
throughout Europe [110]. Given that Nepal is located in an earthquake prone zone, some

Chapter 3. Nepalese Pagoda temples: A sensitivity analysis
34
carpenters have developed their construction techniques accordingly, providing additional
bracing by linking the vertical and horizontal structural components [111]. This practice is
very effective in preventing relative slippage effect of the floor structure on the walls in the
presence of lateral forces and hence creating a box–type behaviour response. This
connection is made using wedges (timber peg) that fix the wall plate along the perimeter
through the joists that run inside and outside the building, as shown in Figure 3.7. The wall
plate, which runs throughout the perimeter of the wall constituting a type of ring–beam,
allows a better distribution of the dead and live loads along the wall length, also allowing a
better in plane stiffness and stress distribution [112]. The floor is then joined to the
horizontal frame (wall plate) using battens, some of which also run through the wall and
are fixed in position using wooden wedges. But, in many of temples structural floor system
are constructed by simply laying timber joists in one direction and there is no anchoring
scheme of the joist with the walls, as shown in Figure 3.8.
Figure 3.5: Section of Narayan temple [106] Figure 3.6: Beam–column joint system
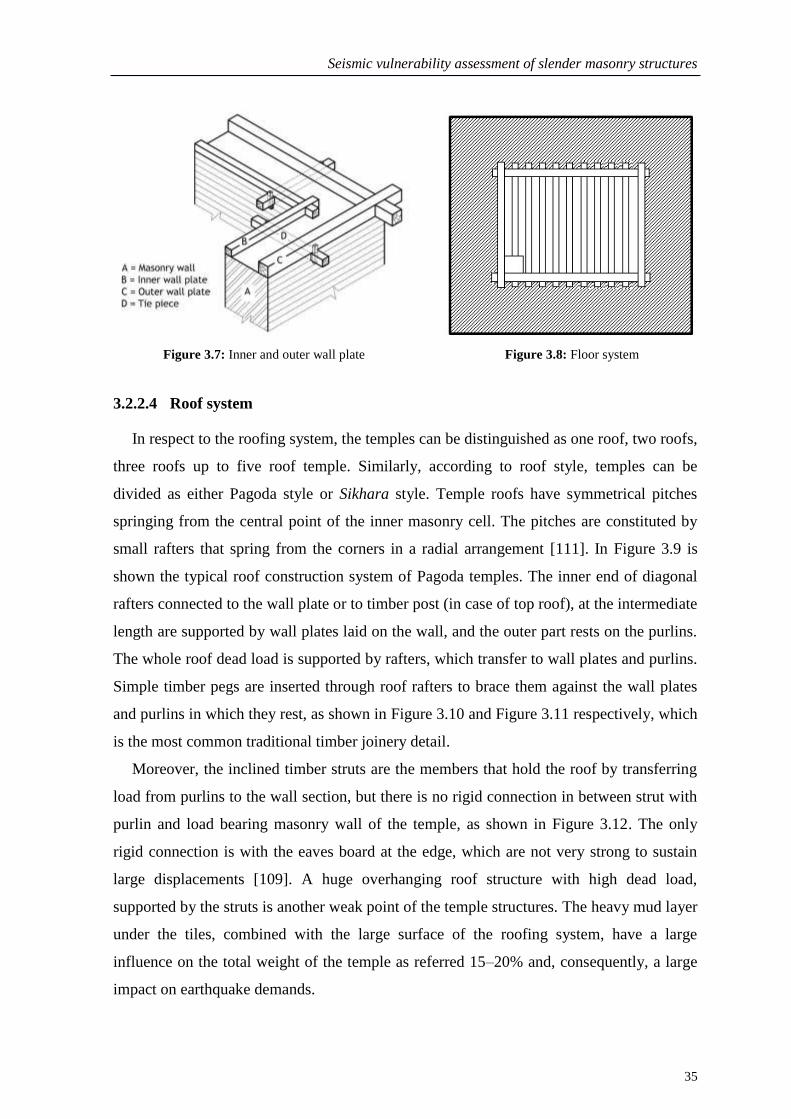
Seismic vulnerability assessment of slender masonry structures
35
Figure 3.7: Inner and outer wall plate Figure 3.8: Floor system
3.2.2.4 Roof system
In respect to the roofing system, the temples can be distinguished as one roof, two roofs,
three roofs up to five roof temple. Similarly, according to roof style, temples can be
divided as either Pagoda style or Sikhara style. Temple roofs have symmetrical pitches
springing from the central point of the inner masonry cell. The pitches are constituted by
small rafters that spring from the corners in a radial arrangement [111]. In Figure 3.9 is
shown the typical roof construction system of Pagoda temples. The inner end of diagonal
rafters connected to the wall plate or to timber post (in case of top roof), at the intermediate
length are supported by wall plates laid on the wall, and the outer part rests on the purlins.
The whole roof dead load is supported by rafters, which transfer to wall plates and purlins.
Simple timber pegs are inserted through roof rafters to brace them against the wall plates
and purlins in which they rest, as shown in Figure 3.10 and Figure 3.11 respectively, which
is the most common traditional timber joinery detail.
Moreover, the inclined timber struts are the members that hold the roof by transferring
load from purlins to the wall section, but there is no rigid connection in between strut with
purlin and load bearing masonry wall of the temple, as shown in Figure 3.12. The only
rigid connection is with the eaves board at the edge, which are not very strong to sustain
large displacements [109]. A huge overhanging roof structure with high dead load,
supported by the struts is another weak point of the temple structures. The heavy mud layer
under the tiles, combined with the large surface of the roofing system, have a large
influence on the total weight of the temple as referred 15–20% and, consequently, a large
impact on earthquake demands.
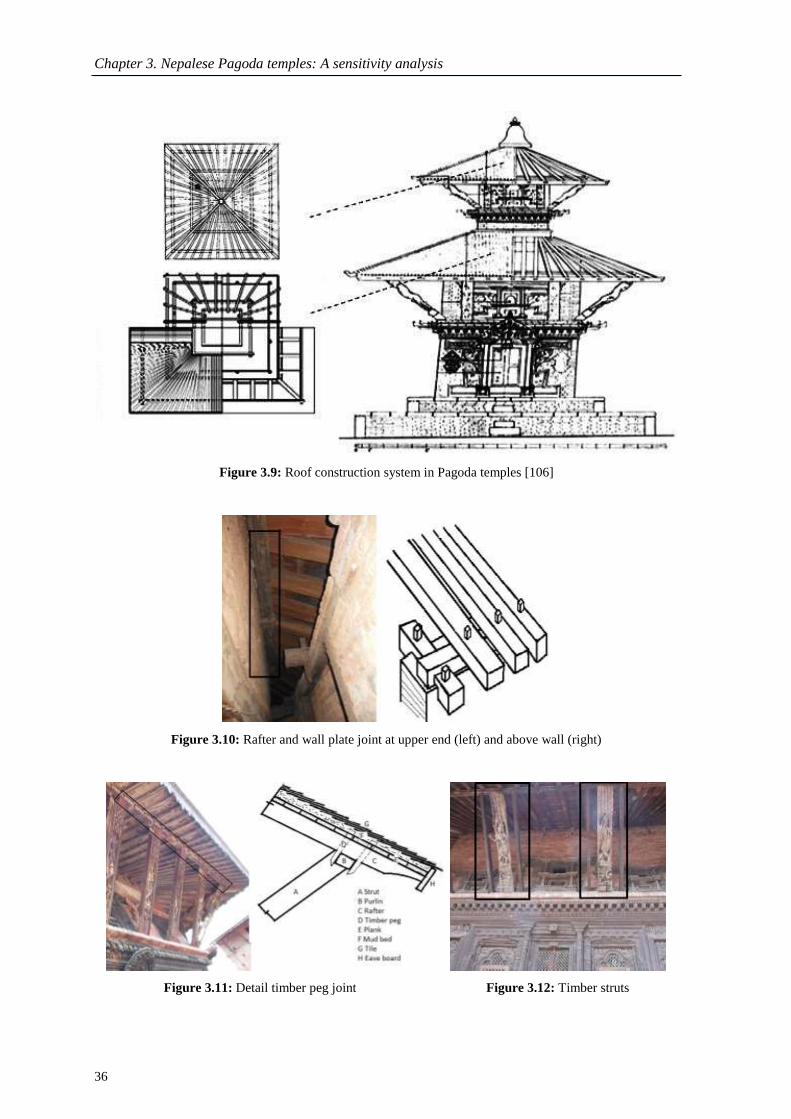
Chapter 3. Nepalese Pagoda temples: A sensitivity analysis
36
Figure 3.9: Roof construction system in Pagoda temples [106]
Figure 3.10: Rafter and wall plate joint at upper end (left) and above wall (right)
Figure 3.11: Detail timber peg joint Figure 3.12: Timber struts

Seismic vulnerability assessment of slender masonry structures
37
3.2.3 Seismic behaviour of Nepalese Pagoda temples
Nepalese Pagoda temples were constructed when there were no mechanical and
technical facilities and were handcrafted to a high quality with the best available materials
and workmanship at the time of their construction [103].
The 1934 earthquake post–earthquake photographic information, as shown in Figures
3.13 and 3.14, reveal that a vast number of monuments were destroyed by the quake.
Cultural heritage buildings and monuments are, therefore, at risk, and the eventual cultural
loss in the consequence of an earthquake is incalculable. Post–seismic surveys of past
earthquakes have shown the potential damage that unreinforced masonry structures,
particularly Pagoda temples, may suffer in future earthquakes [109].
Figure 3.13: Bhaktapur Darbar Square world heritage site before and after 1934 earthquake [109]
Figure 3.14: Kathmandu Darbar Square world heritage site after 1934 earthquake [109]
The traditionally built temples have evolved through many years of building experience
from the 12th
to the 18th
centuries. Practical earthquake experience has been incorporated in
the construction during those centuries. Some important features of traditional construction
techniques in respect to Pagoda temples are pointed out by Nienhuys [105]:

Chapter 3. Nepalese Pagoda temples: A sensitivity analysis
38
• A symmetrical construction (square floor plan) is in general less vulnerable to
earthquakes than a unsymmetrical construction;
• A huge massive plinth avoids shear at the foundation level. Such plinth may
redistribute shear forces throughout the structure, thus partly absorbing the impact
of strong earthquake jolts;
• A conical mass distribution with a wide base is difficult to push over. When a mass
needs to be pushed over a leaning support, it will withstand most earthquakes;
• A concentric support structure with interconnected columns will function as a table
on slightly movable legs.
On the basis of the above basic mentioned traditional technology features, it can be said
that our ancestors have learned by trial and error on earthquake construction techniques.
However, most of the Nepalese Pagoda temples were erected following very simple
construction rules and details, to comply with seismic resistance requirements [113].
Structural characteristics in the historical design and configuration of the Nepalese Pagoda
temples which affect performance in an earthquake are outlined by Theophile et al. [114]:
• Lack of vertical structural continuities is created by the resting of upper temple
level on timber beams rather than directly on the wall structure below. This
configuration puts the temple at risk to withstand the lateral forces of an
earthquake;
• Lateral forces of an earthquake are exacerbated by the top heaviness of the
structure created by the great mass of mud and tile covered roof;
• Ambulatory–like arcades at base level create a soft ground floor, a weak zone
which may fail before it transfers the earthquake‟s demands from ground to upper
areas of the temple;
• Overall looseness of the structure detracts from performance in an earthquake. Lack
of rigid connections are found in a poor through–wall bonding of the multi–layer
masonry wall, structurally deficient timber joinery and traditional timber pegged
joints, rigid in only one direction.

Seismic vulnerability assessment of slender masonry structures
39
3.2.4 Previous research on Nepalese Pagoda temples
3.2.4.1 Material properties of structural components
In many cases geometry of the structure, or the mechanical characteristic of
construction materials, are not sufficiently known to conduct a structural safety assessment
problem, so numerical models cannot carry out a reliable simulation of expected on
plausible behaviours. Therefore the evaluation of the mechanical properties, especially of
masonry is necessary to determine the seismic vulnerability of existing constructions and
to eventually design seismic retrofitting strategies. It is crucial to have experimental data
collected to characterize old and existing structures [115]. Sufficient research has not been
carried out on traditional construction technology and materials used in Nepalese Pagoda
temples. However, some experimental research work carried out to derive the mechanical
properties of traditional masonry constructions in Nepal, providing valuable information
for the numeric modeling of temple structures ahead.
Thapa [107] carried out research work with the objective of determining the various
mechanical properties of traditional materials related with brick masonry to apply as input
in seismic analysis of historical masonry structures of Nepal. The sample and the testing
application used in test process are shown in the Figure 3.15. And the results obtained are
summarized in Table 3.1.
Figure 3.15: Test setup on brick masonry wall [107]

Chapter 3. Nepalese Pagoda temples: A sensitivity analysis
40
Table 3.1: Mechanical properties of traditional masonry materials [107]
Material Experiment setup and type
Specific
weight
(kN/m3)
Young‟s
modulus
(MPa)
Shear
modulus
(MPa)
Average
compressive
strength
(MPa)
Average
shear
strength
(MPa)
Mud mortar Compression test on cubes 17.5 34.5 − 1.09 −
Brick unit Compression test on cubes 13.5 − − 9.18 −
Mud masonry
brick wall panel
Compressive test 19 − − 0.56 −
Combined loading test 19 632 253 − 0.14
Diagonal compression test 19 336 172 − 0.14
The above results were obtained from tests carried out on bricks collected from old
ruined masonry buildings, which are representative of materials typically used. The tested
results on brick masonry and its units represent reliably the characteristics of the existing
brick masonry of temple structures, due to the fact that both structures where built in the
same period.
In the work of Jaishi et al. [97], allowable stresses for brick masonry structures were
considered following the values presented in the National Building Code of India (Part VI),
as summarized in Table 3.2. Similarly, the elastic properties of the construction materials,
as summarized in Table 3.3, were used for finite element modeling of temple structures in
previous works, based on material testing at the real site in Kathmandu valley. But the
value of Young‟s modulus for mud–mortar brick masonry adopted by Jaishi et al. [97] was
taken from the research conducted by Tomazevic et al. [116].
Table 3.2: Allowable stresses on brick masonry [97]
Failure mode Allowable stress (MPa)
Shear 0.201
Tensile 0.050
Compression 0.606
Table 3.3: Material properties adopted in FE modeling of temple structures [97]
Material Specific weight
(kN/m3)
Young‟s modulus
(MPa) Poisson‟s ratio
Timber 8 1250 0.12
Mud–mortar brick masonry 20 800 0.10
Parajuli et al. [117] performed non–destructive testing (acoustic emission test), in order
to evaluate the properties of masonry in traditional brick masonry houses constructed in the
same period that the temples and the results are summarized in Table 3.4. The Results
show that the Young‟s modulus of wall decrease with the increase in wall thickness, this is

Seismic vulnerability assessment of slender masonry structures
41
due to increase in the joints and voids inside the wall with increase in wall thickness,
resulting in sharply reducing its strength [117].
Table 3.4: Young‟s modulus of traditional brick masonry walls [117]
Thickness of wall (cm) Young‟s modulus (MPa)
11 11567
14 10889
23 3000
44 782
Nienhuys [105] in his report “Options for Reconstruction and Retrofitting of Historic
Pagoda Temples” calculated the overall weight of Narayan temple, adopting for the
specific weight of the materials the values summarized in Table 3.5.
Table 3.5: Density of traditional construction materials in temples [105]
Mud–mortar brick masonry
(kg/m3)
Roof timber
(kg/m3)
Roof clay layer 8–20cm thick
(kg/m3)
Roof tiles 6cm thick
(kg/m3)
1400 800 1400 1400
3.2.4.2 Dynamic properties of Nepalese Pagoda temples
The field dynamic testing provides a direct way to obtain the real dynamic properties of
a structure. There are mainly three types of structural dynamic testing: (1) forced vibration
testing, (2) free vibration testing, and (3) ambient vibration testing. In the first two
methods, the structure is excited by artificial means such as shakers or drop weights. In
contrast, ambient vibration testing uses the natural or environmental excitation induced by
winds and traffics. Ambient vibration tests are usually preferred over the other non–
destructive forced vibration techniques since no forced excitation is required and thus the
cost of the vibration test project is reduced significantly.
On December 19–30, 2002 an ambient vibration test was carried out by Jaishi et al. [97]
on three typical temples of Nepal and modal parameter was obtained using peak picking
(PP) and advance stochastic subspace identification (SSI), which is tabulated in Table 3.6.
Nepalese Pagoda temples are stiffer with fundamental time period less than 0.6sec. It is
also demonstrated that the damping ratios of Nepalese temples lay between 1% and 6%
that is lower than those reported elsewhere for historical structures due to stone or brick
masonry type of construction [97]. Apart from this, there is no information of research
work carried out on Nepalese Pagoda temples for acquiring the dynamic properties.

Chapter 3. Nepalese Pagoda temples: A sensitivity analysis
42
Table 3.6: Experimental dynamic properties for Nepalese Pagoda temples [97]
Temple Photographic view Mode Frequencies (Hz) Damping ratio
(%) PP SSI N
yato
po
l
First bending (N–S) 1.685 1.677 1.5
First bending (E–W) 1.709 1.739 5.9
Second bending (E–W) 3.906 3.872 3.3
Second bending (N–S) 3.931 3.890 3.0
Third bending (E–W) 5.105 6.358 2.9
Third bending (N–S) 6.128 6.194 2.6
Yec
hh
esw
or
First bending (E–W) 2.310 2.334 1.5
First bending (N–S) 2.246 2.326 1.7
Second bending (E–W) 5.762 5.207 3.6
Second bending (N–S) 5.176 5.172 4.3
Third bending (N–S) 8.300 8.360 4.4
Third bending (E–W) 8.207 8.337 4.1
Sa
lan
Gan
esh
First bending (E–W) 3.003 3.005 1.8
First bending (N–S) 3.345 3.036 2.1
Second bending (E–W) 4.907 4.915 1.2
Second bending (N–S) 6.660 6.756 1.6
Third bending (E–W) 7.300 6.748 2.0
Third bending (N–S) 6.660 7.397 2.4
3.2.4.3 Analytical failure modes of Nepalese Pagoda temple
Even though many uncertainties, in the work of Jaishi [118], ten temples were modeled
using SAP 2000 shell model. Response analysis using seismic coefficient and response
spectrum method were carried out which showed that the most vulnerable parts of masonry
temples are as described below.
• The piers between the openings are more flexible than the portion of the wall below
or above the openings, so practically all deformations take place in piers that leads
to its failure. The masonry piers near door opening fail in tension in most of
temples, but in some temples the compression mode of failure is also present;
• In traditional temples, masonry wall is directly above doorframe. This wooden
member is safe in all case;
• Most of traditional Nepalese temples possess framing arrangements in ground floor
level. This framing arrangement is safe;
• Wall section where reduction in wall thickness in vertical plane occurs shows
failure part;

Seismic vulnerability assessment of slender masonry structures
43
• Analysis of most of the results shows that the corner sections of walls is weaker
that middle portion.
The dominant modes of failure in these temples are of tensile and compressive nature.
Shear failure is not encountered in most of the temples due to considerable wall thickness.
But in some type of temple having bearing core area only on one side, reveals considerable
shear stress. In such type of temples, all the three modes of failure are observed. Most
dominant mode of failure in Nepalese temples is associated with tensile stress. However,
the above mentioned studied was based on a linear analysis, besides recognizing the
limitation of the linear approach for modeling complex materials. Hence, a detail
nonlinear analysis might be needed to know exact failure mode of such structures.
3.2.5 Strengthening practice on Nepalese Pagoda temples
Normally, most of the strengthening actions carried out for temples in a very simple
way, just repairing for quotidian used, resourcing to modern materials, without any
concern in terms of seismic strengthening. One of the challenges in the restoration and
retrofitting process of such monuments is to achieve a durable compromise between full
structural consolidation and the preservation of the historic fabric and appearance [114].
The conservation work on Nepalese Pagoda is carried out by KVPT [119] in cooperation
with government of Nepal archeology department. KVPT [119] is the only international
non–government agency registered and working in the field of preservation and restoration
of cultural heritage in Nepal [118]. The strengthening practices followed by KVPT [119]
are pointed below [114]:
• Repair or rebuilding of timber wall plate and tie structure with improved joinery
and steel plate reinforcement;
• Concealed bolting of timber joints at strut, purline and rafter location;
• Reinforced concrete ring beam above the wall;
• Steel beams inserted to support the upper temple level (turret);
• Steel collar used for tying joist and timber joist, and inner and outer wall plates
together;
• Steel bracing between inner and outer walls at floor level;
• Iron strap above timber cornices;
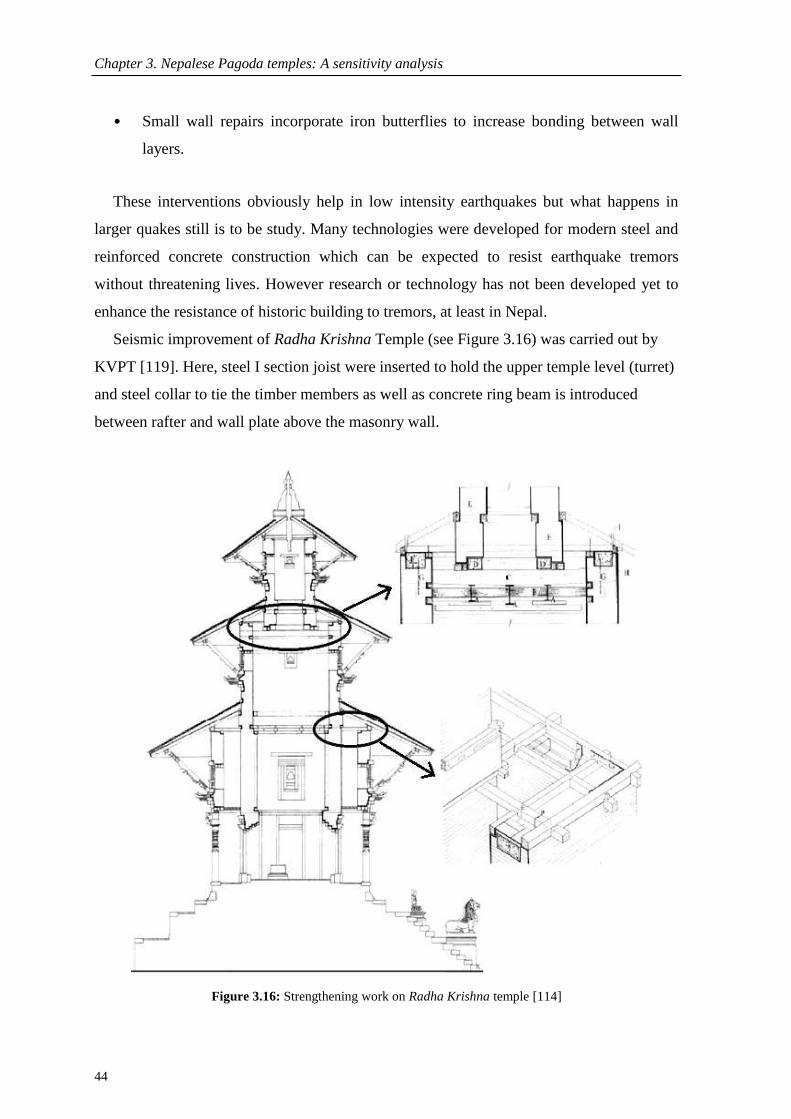
Chapter 3. Nepalese Pagoda temples: A sensitivity analysis
44
• Small wall repairs incorporate iron butterflies to increase bonding between wall
layers.
These interventions obviously help in low intensity earthquakes but what happens in
larger quakes still is to be study. Many technologies were developed for modern steel and
reinforced concrete construction which can be expected to resist earthquake tremors
without threatening lives. However research or technology has not been developed yet to
enhance the resistance of historic building to tremors, at least in Nepal.
Seismic improvement of Radha Krishna Temple (see Figure 3.16) was carried out by
KVPT [119]. Here, steel I section joist were inserted to hold the upper temple level (turret)
and steel collar to tie the timber members as well as concrete ring beam is introduced
between rafter and wall plate above the masonry wall.
Figure 3.16: Strengthening work on Radha Krishna temple [114]

Seismic vulnerability assessment of slender masonry structures
45
3.3 Seismic sensitivity analysis of the common structural components
3.3.1 Numerical modeling of temples
Every structural problem is primarily aimed to be solved by numerical studies and
calibrated by testing. However, because of various difficulties in numerical modeling,
some problems may require complicated experimental investigation to calibrate the results.
Therefore, an initial numerical analysis is necessary to understand the global behaviour and
response of structures. The main difficulties in numeric modeling of historic buildings and,
particularly, for temple structures are [120; 121]:
• Lack of data on geometric dimensions;
• Difficulties in identifying the characteristics of construction materials;
• Excessive cost of detailed laboratory testing;
• Variability of the data due to construction techniques and workmanship quality;
• Heterogeneous material properties for the same structural member due to traditional
long term construction process.
Even though many uncertainties, the three temples namely (a) Shiva temple, (b) Lashmi
Narayan temple and (c) Radha Krishna temple as shown in Figure 3.17, were selected to
be modeled for the parametric analysis carried out. The geometrical characteristics of these
three temples are listed in Table 3.7. The three temples are selected to be representative of
the most common types of Pagoda temples in Nepal. Nevertheless, every temple has
different features and many aspects that make it unique.
The first temple selected is Shiva temple, representing one roof plan symmetrical
temples, with uniform wall thickness throughout the height and with low plinth level. The
second temple is Lakshmi Narayan temple, which represents the majority temples in
Nepal. It is a temple with two roofs, having symmetric plan but presenting a vertical load
path discontinuity (i.e. top tower resting on timber joists due to walls misalignment in
height). Finally, the third selected temple is Radha Krishna temple, which represents a
limited number of temples, but which are very precious due to their marvelous
architecture. This last temple has a plan symmetrical with an extended gallery at the
ground floor and standing on a high plinth. The wall thickness is not uniform throughout
the height of the temple. A double wall at the second storey with a walkway floor between
walls exists in this type of temple. Also as in the two roof temple, it has a vertical load path
discontinuity (wall misalignment).

Chapter 3. Nepalese Pagoda temples: A sensitivity analysis
46
Figure 3.17: Three Nepalese Pagodas: a) Shiva; b) Lakshmi Narayan; c) Radha Krishna
Table 3.7: Dimensions of three selected temples
Temple
Height above
plinth
(m)
Base
cross–section
(m2)
Top
cross–section
(m2)
Wall thickness
at base
(m)
Wall
thickness
at top
(m)
Shiva 4.73 2.82 × 2.82 2.82 × 2.82 0.46 0.46
Lakshmi Narayan 5.92 2.52 × 2.52 1.27× 1.27 0.48 0.40
Radha Krishna 12.76 3.48 × 3.48 1.69 × 1.69 0.64 0.45
In the scope of this research, these three representative temple structures are modeled
resourcing to SAP 2000 [122] (see Figure 3.18). For modeling the temple, eight node solid
elements are used to model the masonry wall structure, frame elements are used to model
the timber structure and shell elements are used to model roof and floors structure. The
models take into account the presence of openings and the variation of wall thickness at
different levels. The base at the level of plinth was considered rigid since no reliable
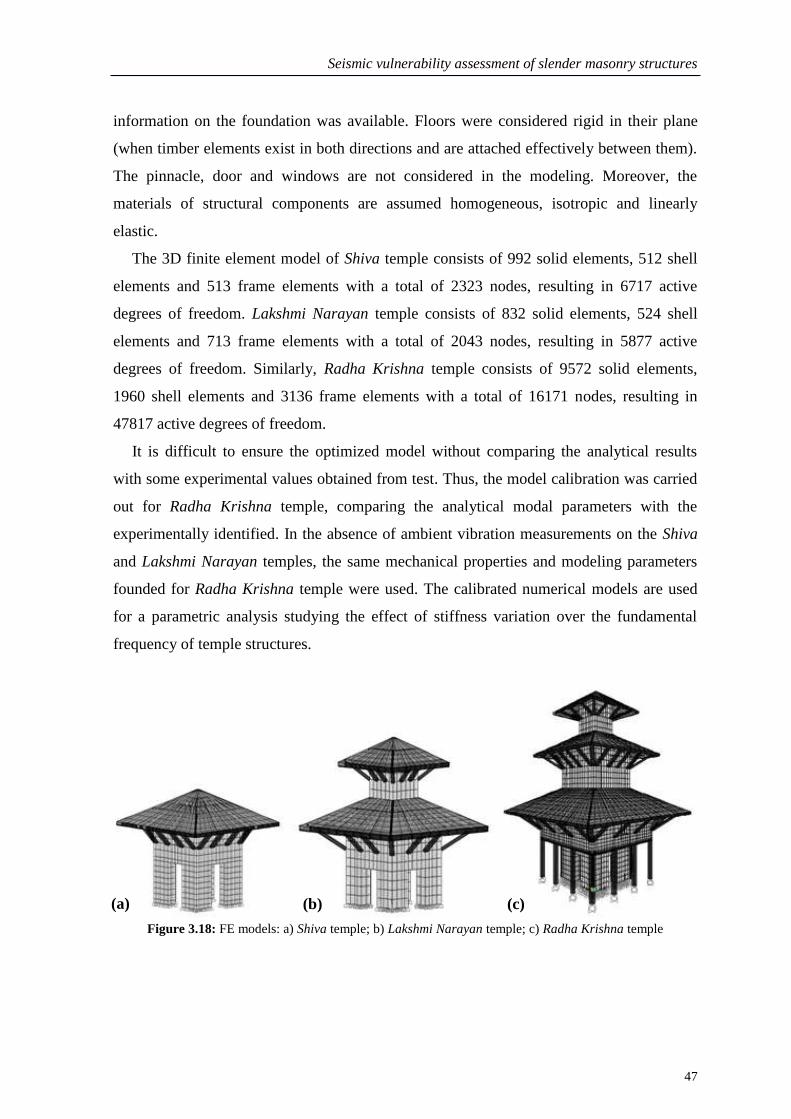
Seismic vulnerability assessment of slender masonry structures
47
information on the foundation was available. Floors were considered rigid in their plane
(when timber elements exist in both directions and are attached effectively between them).
The pinnacle, door and windows are not considered in the modeling. Moreover, the
materials of structural components are assumed homogeneous, isotropic and linearly
elastic.
The 3D finite element model of Shiva temple consists of 992 solid elements, 512 shell
elements and 513 frame elements with a total of 2323 nodes, resulting in 6717 active
degrees of freedom. Lakshmi Narayan temple consists of 832 solid elements, 524 shell
elements and 713 frame elements with a total of 2043 nodes, resulting in 5877 active
degrees of freedom. Similarly, Radha Krishna temple consists of 9572 solid elements,
1960 shell elements and 3136 frame elements with a total of 16171 nodes, resulting in
47817 active degrees of freedom.
It is difficult to ensure the optimized model without comparing the analytical results
with some experimental values obtained from test. Thus, the model calibration was carried
out for Radha Krishna temple, comparing the analytical modal parameters with the
experimentally identified. In the absence of ambient vibration measurements on the Shiva
and Lakshmi Narayan temples, the same mechanical properties and modeling parameters
founded for Radha Krishna temple were used. The calibrated numerical models are used
for a parametric analysis studying the effect of stiffness variation over the fundamental
frequency of temple structures.
Figure 3.18: FE models: a) Shiva temple; b) Lakshmi Narayan temple; c) Radha Krishna temple
(a) (b) (c)

Chapter 3. Nepalese Pagoda temples: A sensitivity analysis
48
3.3.2 Experimental modal identification and model updating
3.3.2.1 Ambient vibration test of Radha Krishna temple
An ambient vibration test was conducted on Radha Krishna temple to measure the
dynamic response. The goal of the measurements consisted in identifying the natural
frequencies and corresponding mode shapes, with the purpose of calibrating the finite
element model. Figure 3.19 shows a schematic representation of the sensors distribution.
The test was conducted using a 6 channel data acquisition system with 6 uniaxial
accelerometers. These accelerometers were used to record acceleration responses in two
directions (i.e. xx which corresponds to E–W and yy which corresponds to N–S directions)
simultaneously. For each channel, the ambient time histories (acceleration vs. time) were
recorded for 180 s at intervals of 0.005 s, which resulted in a total of 36,000 data points.
Figure 3.19: Location of accelerometers used in experimental modal identification of Radha Krishna temple

Seismic vulnerability assessment of slender masonry structures
49
The modal identification was performed using peak picking techniques of modal extraction in the frequency
domain (Frequency Domain Decomposition (FDD), Enhanced Frequency Domain Decomposition (EFDD)
and Curve–fit Frequency Domain Decomposition (CFDD)) implemented in ARTeMIS [123] software. These
techniques allow the estimation of not only the natural frequencies and modal damping but also each mode
shape [124; 48; 125; 75]. The power spectral densities for the set of performed measurements are presented
in Figure 3.20.
Figure 3.20: Identification of spectral peaks (FDD): a) E–W direction; b) N–S direction
Figure 3.21 shows the first six vibration mode shapes (2D model) estimated from the
recorded measurements and, in Table 3.8, the corresponding natural frequencies and modal
damping values are presented.
(b)
(a)

Chapter 3. Nepalese Pagoda temples: A sensitivity analysis
50
Figure 3.21: Vibration modes identified from ambient vibration measurement: a) first bending xx; b) first
bending yy; c) second bending xx; d) second bending yy; e) third bending yy; f) third bending xx
Table 3.8: Natural frequencies and modal damping from ambient vibration measurement
Mode FDD
(Hz)
EFDD
(Hz)
CFDD
(Hz)
Mean value
(Hz)
Damping
(%)
First bending xx (E–W) 2.051 2.043 2.089 2.061 3.540
First bending yy ( N–S) 2.051 2.046 2.090 2.062 3.302
Second bending xx (E–W) 4.297 4.277 4.275 4.283 3.025
Second bending yy ( N–S) 4.395 4.395 4.491 4.427 2.864
Third bending yy ( N–S) 7.227 7.336 7.304 7.289 1.382
Third bending xx(E–W) 7.324 7.359 7.359 7.347 1.933
3.3.2.2 Calibration and validation of numerical model
The parameters selected for the calibration procedure are the equivalent Young‟s
modulus of masonry walls and of the timber members. The experimental values from
previous research works on material properties were trialed for the calibration of the
equivalent Young's modulus values assigned to the masonry walls and timber members of
the temple structure. The adaptation of experimental mechanical properties provided by
Thapa [107] for masonry walls and by Jaishi et al. [97] for timber members result in
minimum differences between the frequencies and mode shapes obtained numerically, and
those resulting from the measurements performed on site. In Table 3.9, the mechanical
(d) (f)
(b) (a) (c)
(e)

Seismic vulnerability assessment of slender masonry structures
51
properties obtained after calibration of the finite element model to accurately reflect the
dynamic characteristics of the Radha Krishna temple are reported. In Table 3.10, the
comparison between the natural frequencies from dynamic identification and those from
the numerical model are shown. In Figure 3.22 the comparison between the analytical
mode shapes (3D model) obtained with FEM and the experimental obtained with FDD is
reported. But, the number and location of the sensors during environmental vibration
measurements were not satisfactory to catch the third mode shapes of the temple
(torsional). As can be observed in the result, the correlation between the measured and
calculated modes reveals a good match. In fact, when considering the modal frequencies, a
good approximation for the first six frequencies (excluding torsional frequency) with a
maximum error of 7.19% is observed.
Figure 3.22: Comparison between measured and computed vibration mode shape: a) first bending xx; b)
second bending xx; c) third bending xx
(a) (b) (c)

Chapter 3. Nepalese Pagoda temples: A sensitivity analysis
52
Table 3.9: Material properties used in FE modeling
Material Specific weight
(kN/m3)
Young‟s modulus
(MPa) Poisson‟s ratio
Timber 8 1250 0.12
Mud–mortar brick masonry 19 632 0.25
Table 3.10: Comparison between measured and computed frequencies
Mode Measured frequency (Hz) Computed frequency (Hz) Error (%)
1st (first bending xx) 2.061 2.034 1.31
2nd
(first bending yy) 2.062 2.034 1.37
3rd
(torsional) – 3.354 –
4th
(second bending xx) 4.283 4.413 –3.04
5th
(second bending yy) 4.427 4.413 0.32
6th
(third bending yy) 7.289 6.810 6.57
7th
(third bending xx) 7.347 6.819 7.19
3.3.3 Parametric analysis and results
In order to study the change of the fundamental frequency of the three temple structures
(Shiva, Lakshmi Narayan and Radha Krishna temple), due to variation in the stiffness
simulating in a simple manner, damage or degradation of vulnerable members, a number of
parametric analyses were carried out. Stiffness variation is carried out to simulate damage
or degradation of timber or masonry elements. Damage or degradation of members was
simulated, by reducing the Young‟s modulus of elasticity (E value) of those members [32;
126; 127]. Linear elastic parametric analysis was carried out to study the decrease in global
stiffness of the temple structures. These results were revealed in terms of change in
fundamental frequency of temple structures.
Modal analysis results reveal that, due to symmetry of the three structures in both
directions, the first and second modes, as well as fourth and fifth modes, have the same
frequency and are flexural mode shapes (bending), while the third mode shape is torsional
for all models (see Table 3.11).
Table 3.11: Analytical frequency of the three temples
Temple
Frequency (Hz)
First mode
(bending xx)
Second mode
(bending yy)
Third mode
(torsion)
Fourth mode
(bending xx)
Fifth mode
(bending yy)
Shiva 5.499 5.499 7.998 17.604 17.604
Lakshmi Narayan 4.205 4.205 7.911 9.158 9.158
Radha Krishna 2.034 2.034 3.354 4.413 4.413
Seismic vulnerability assessment of slender masonry structures
53
The parametric analyses were carried out to understand the effect of damage or
degradation of structural elements in fundamental frequencies of the temple structures. The
timber members selected for these parametric analyses are struts, columns and floors,
which are elements to which potential damage may occur. Similarly, masonry wall
portions were selected for these parametric analyses, namely: i) masonry wall corners, ii)
one–third height of the wall at base storey, and also iii) the wall section where timber joists
are inserted. Lastly, analyses are also made with the accumulation of all type of damages
or degradation/decay issues studied singularly. The percentage change in the fundamental
frequency calculated, due to damages or degradations, for the various potential vulnerable
members are summarized in Table 3.12.
Damages in vulnerable members decrease the fundamental frequency of the structures,
due to reduction of stiffness. The results of the parametric analyses show that the damages
in masonry walls are the major cause bringing change in fundamental frequency, when
compared to the damages in timber elements.
The results for all three temples modeled reveal that the damages to the one–third of the
base storey height of the masonry wall is the most vulnerable scenario among the studied,
since the percentage of fundamental frequency decreases by twice, for each 20% reduction
in the E value. The percentage decrease due to this damage is similar for Shiva and
Lakshmi Narayan temples, and it is noticeable that Radha Krishna temple has the lowest
relative decrease.
From the parametric analysis in the case of damage at masonry wall corners, results
reveal nearly the same decrease in the fundamental frequency for all three temples, but
Lakshmi Narayan (2 roof) temple shows slightly higher reduction than the other two
temples.
Similarly, the results of the parametric analysis carried out to understand the effect of
insertion of timber joists in the masonry walls, show a significant decrease in percentage of
the fundamental frequency in the Shiva and Lakshmi Narayan temples. Comparatively,
Radha Krishna temple, with the highest surface area, has lowest relative decrease of
frequencies. Regarding masonry wall damages, the large wall thickness of Radha Krishna
temple plays a fundamental role in the good structural response, resulting in the lowest
reduction in percentage of the fundamental frequency than the other two temples.

Chapter 3. Nepalese Pagoda temples: A sensitivity analysis
54
Table 3.12: Reduction in the fundamental frequency due to various damage scenarios
Degraded
member
Phenomenon
(cause) Temple
Reduction of E value
10% 30% 50% 70% 90%
Base storey
wall
Bulging of outer
layer of wall when
water penetrates
and leads to erosion
due to up splashing
rain water or
insufficient damp
proof course.
Shiva 2.13% 7.29% 14.31% 24.88% 46.32%
Lakshmi Narayan 1.83% 6.44% 13.10% 23.92% 47.41%
Radha Krishna 0.88% 3.13% 6.54% 12.33% 25.64%
Wall corner
joint
Corner cracks or
separating of wall
faces due to lack of
seismic bands and
poor interlocking.
Shiva 1.42% 4.55% 8.16% 12.48% 18.03%
Lakshmi Narayan 1.95% 6.24% 11.21% 17.33% 26.49%
Radha Krishna 1.20% 3.79% 6.80% 10.53% 16.03%
Timber inserted
wall
Reduction in cross–
section of masonry
wall, where the
timber joists are
inserted, to hold
wall plates in
position.
Shiva 0.46% 1.55% 3.30% 6.68% 17.60%
Lakshmi Narayan 0.68% 2.48% 5.34% 10.72% 26.70%
Radha Krishna 0.15% 0.57% 1.26% 2.72% 8.53%
Timber strut
Reduction in cross–
section due to
material decay,
degradation, fungal
attack, moisture
attack, etc.
Shiva 0.00% 0.00% 0.01% 0.01% 0.02%
Lakshmi Narayan 0.00% 0.01% 0.01% 0.02% 0.05%
Radha Krishna 0.00% 0.01% 0.01% 0.02% 0.04%
Floor joist
Moisture and/or
fungal attack,
particularly, where
joists are inserted
into walls.
Shiva
No relevant effect Lakshmi Narayan
Radha Krishna
Timber column
Rapid decay due to
lack of damp proof
course and up–
splashing rain
water.
Radha Krishna 1.01% 3.35% 6.38% 10.34% 15.87%
Cumulative of all above effects
Shiva 3.07% 10.01% 18.84% 31.28% 54.16%
Lakshmi Narayan 3.19% 10.50% 19.68% 32.48% 55.49%
Radha Krishna 2.75% 9.07% 17.04% 28.17% 48.59%
The parametric analysis for the evaluation of the effect of damages to the timber strut
shows no appreciable change in fundamental frequency. The timber columns, in case of
Radha Krishna temple, definitely show important influence. The damage simulated in
floor timber battens show no relevant change in the fundamental frequency.

Seismic vulnerability assessment of slender masonry structures
55
Results regarding the analysis carried out simultaneously considering the entire
phenomenon (represented by equal percentage of E value reduction) reveal, as expected
the highest percentage decrease in the fundamental frequency than for individual damages.
The percentage decrease due to this damage phenomenon is similar for Shiva and Lakshmi
Narayan temples. The percentage decrease due to cumulative damage for Radha Krishna
temple is twice to thrice (depending upon percentage reduction of the E value) in respect to
base storey masonry wall damage phenomenon, while in the case of Shiva and Lakshmi
Narayan there is no significant difference. Similarly, the percentage decrease due to
cumulative damage for Shiva and Lakshmi Narayan is twice to thrice (depending upon
percentage reduction of E value) in respect to masonry wall corners damage phenomenon,
while the decrease is thrice for Radha Krishna temple.
3.4 Conclusions
The chapter presents the ambient vibration based investigation carried out to assess the
dynamic behaviour of the Radha Krishna temple. The good match between measured and
predicted modal parameters was reached while updating the numerical model which
increases the reliability on adopting material properties for the structural components. Due
to the good correlation between experimental and theoretical models for Radha Krishna
temple, the updated model seems to be adequate to provide reliable prediction to assess the
structural behaviour.
The results of parametric analysis carried out on the three Nepalese Pagoda temples
chosen as representative show that the masonry wall structure (which represents 70–80%
of total mass of temple) as the most vulnerable structural component to be safeguarded
from damages and conserved. More precisely, damage or degradation to one–third height
of the base storey masonry wall and masonry wall corners is fundamental in the reduction
of stiffness of the temple structures. Considerable wall thickness of temples over with
roofs has made these structures stiffer. The results reveal no effect of the timber strut and
floor damage in the overall stiffness of the temple structures. In summary, it can be
concluded that more local modeling is needed to understand the local behaviour of timber
components and structural vulnerability. These numerical analyses have allowed for better
Chapter 3. Nepalese Pagoda temples: A sensitivity analysis
56
understanding the main structural fragility and influence of damage or degradation
phenomenon over these architectural valued monuments.
Nepalese Pagoda temples are unique cultural heritage standing on seismic prone area.
These structures were built with best available material and skill of that time, but following
very simple construction rules and details, to comply with seismic resistance requirements.
There is lack of sufficient research and conservation works on these structures. So, it is
essential to carry out vulnerability assessment and strengthening work to preserve built
heritage from future earthquakes.

57
CHAPTER 4
SEISMIC VULNERABILITY ASSESSMENT METHODOLOGY
Summary This chapter presents a simplified methodology for assessing the seismic
vulnerability of slender masonry structures based on vulnerability index evaluation method.
Moreover, this chapter also present the implementation of this methodology in different types
of slender masonry structures to develop vulnerability curves for these structure types.
Chapter outline
4.1 Introduction
4.2 Proposed methodology for the vulnerability assessment
4.3 Modeling strategy adopted for parametric analysis
4.4 Calibration of proposed methodology for vulnerability assessment
4.4.1 Definition of vulnerability assessment parameters
4.4.2 Definition of parameters weight
4.5 Implementation of proposed methodology on slender masonry structures
4.5.1 Vulnerability assessment of slender masonry structures
4.5.1.1 Nepalese Pagoda temples
4.5.1.2 Masonry towers
4.5.1.3 Masonry minarets
4.5.1.4 Industrial masonry chimneys
4.5.2 Vulnerability curves for slender masonry structures
4.6 Conclusion
4.1 Introduction
At present, a number of studies are available in the technical literature dealing with
numerical and experimental analyses of slender masonry structures. However, there is no
sufficient research work carried out on developing the relevant seismic vulnerability
assessment tools for such structures. It is fact, seismic vulnerability assessment of these
types of historical constructions is a difficult task due to the complexity of several factors
involved, including the heterogeneity and uncertainty typical of the constituent materials,
the intricate geometry configurations, often modified by previous structural or architectural
interventions, and the cultural and artistic importance of this type of structure [62].
In general terms, seismic vulnerability measures the amount of damage caused by an
earthquake of given intensity over a structure. However, “amount of damage” and “seismic
intensity” are concepts without a clear and rigorous numerical definition [128]. According

Chapter 4. Seismic vulnerability assessment methodology
58
to Sandi [129], seismic vulnerability is an intrinsic property of the structure, a
characteristic of its own behaviour due to the action of an earthquake described trough a
law of cause–effect, where the cause is the seismic action and the effect is the damage.
However, the amount of damage identified in the seismic vulnerability assessment of
buildings depends on many factors such as intensity of the seismic action, soil conditions,
constructive materials, structural elements and conservation state.
In 2005, Speranza et al. [130] developed a vulnerability assessment method for towers
known as VULNeT which was further modified by Sepe et al. [1] in 2008, based on
GNDT II level approach [131]. This method is commonly used to identify and to
characterize the potential seismic deficiencies of a building or group of buildings by means
of a qualification by points for every significant component of the structure. This allows
the user the determination of a seismic vulnerability index, . One of the most famous
methods usually found in the relevant literature corresponds to the developed by Benedetti
and Petrini [132] and the GNDT–1990 [133]. This method has been widely used in Italy
during the last years and has been upgraded as a result of the continuous experimentation
and observed damage of certain types of structures (mainly unreinforced masonry
buildings) after earthquakes of different intensities, resulting in an extensive database of
damage and vulnerability.
In this chapter a simplified methodology for seismic vulnerability assessment of slender
masonry structures is proposed. This methodology evaluate of the seismic vulnerability
index for the structure. The evaluated vulnerability index can then be used to estimate
structural damage after correlation to a specified intensity of a seismic event. Here,
qualitative as well as quantitative parameters are defined to evaluate the vulnerability
index. Nonlinear parametric analyses are carried out to calibrate most of the quantitative
parameters and weight of each parameter. Finally, this methodology is applied to different
types of slender masonry structures, as developing vulnerability curves for these structures.
4.2 Proposed methodology for the vulnerability assessment
There are a variety of methodologies proposed by different authors for the seismic
vulnerability assessment of buildings. The selection of a certain methodology of evaluation
depends on the next aspects: nature and objective of the study, available information,
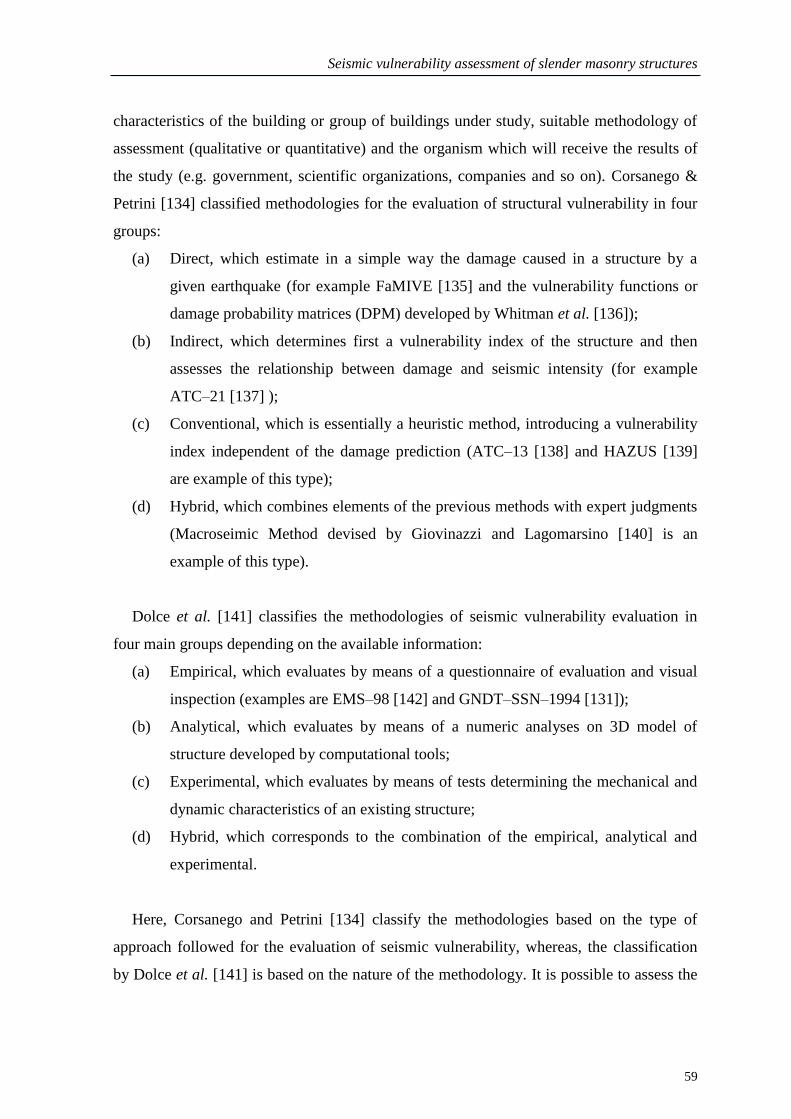
Seismic vulnerability assessment of slender masonry structures
59
characteristics of the building or group of buildings under study, suitable methodology of
assessment (qualitative or quantitative) and the organism which will receive the results of
the study (e.g. government, scientific organizations, companies and so on). Corsanego &
Petrini [134] classified methodologies for the evaluation of structural vulnerability in four
groups:
(a) Direct, which estimate in a simple way the damage caused in a structure by a
given earthquake (for example FaMIVE [135] and the vulnerability functions or
damage probability matrices (DPM) developed by Whitman et al. [136]);
(b) Indirect, which determines first a vulnerability index of the structure and then
assesses the relationship between damage and seismic intensity (for example
ATC–21 [137] );
(c) Conventional, which is essentially a heuristic method, introducing a vulnerability
index independent of the damage prediction (ATC–13 [138] and HAZUS [139]
are example of this type);
(d) Hybrid, which combines elements of the previous methods with expert judgments
(Macroseimic Method devised by Giovinazzi and Lagomarsino [140] is an
example of this type).
Dolce et al. [141] classifies the methodologies of seismic vulnerability evaluation in
four main groups depending on the available information:
(a) Empirical, which evaluates by means of a questionnaire of evaluation and visual
inspection (examples are EMS–98 [142] and GNDT–SSN–1994 [131]);
(b) Analytical, which evaluates by means of a numeric analyses on 3D model of
structure developed by computational tools;
(c) Experimental, which evaluates by means of tests determining the mechanical and
dynamic characteristics of an existing structure;
(d) Hybrid, which corresponds to the combination of the empirical, analytical and
experimental.
Here, Corsanego and Petrini [134] classify the methodologies based on the type of
approach followed for the evaluation of seismic vulnerability, whereas, the classification
by Dolce et al. [141] is based on the nature of the methodology. It is possible to assess the

Chapter 4. Seismic vulnerability assessment methodology
60
seismic vulnerability of a large group of buildings in a quite general manner (roughly)
following simple methodologies (qualitative), or to only evaluate one building in a detailed
way by means of refined methodologies (quantitative). Qualitative methodologies allow
obtaining a qualification of the buildings or group of buildings in terms of seismic
vulnerability that could range from low to high, whereas the quantitative ones in numerical
terms (e.g. ultimate force and displacement capacity). However, the selection of one of
these methods depends on the objectives of the study, the type of the results required and
on the available information. On the other hand, fragility functions, damage probability
matrices and vulnerability functions obtained from observed structural damages during
past earthquakes in a seismic area were the preferred tools in seismic risk studies
performed in the past [132].
The vulnerability index formulation adopted here is based essentially on the GNDT II
level approach, presented in GNDT–SSN–1994 [131], for the vulnerability assessment of
residential masonry buildings. In this approach, the overall vulnerability is calculated as
the weighted sum of 12 parameters (see Table 4.1) used in the formulation of the seismic
vulnerability index. These parameters are related to 4 classes of increasing vulnerability:
A, B, C and D.
Table 4.1: Vulnerability index ( )
Parameter group Parameter Class ( ) Weight
( )
Vulnerability
index A B C D
1. Structural
system
P1: Type of resisting system 0 5 20 50 1.00
∑
P2: Quality of the resisting system 0 5 20 50 1.50
P3: Conventional strength 0 5 20 50 1.50
P4: Slenderness ratio 0 5 20 50 1.50
P5: Location and soil conditions 0 5 20 50 0.75
2. Irregularities
and interaction
P6: Position and interaction 0 5 20 50 1.50
P7: Irregularity in plan 0 5 20 50 1.00
P8: Irregularity in elevation 0 5 20 50 1.50
P9: Number, size and location of wall
openings 0 5 20 50 1.00
3. Horizontal
structure and
roofing
P10: Flooring and roofing system 0 5 20 50 0.50 Normalized
index
4. Conservation
status and other
elements
P11: Fragilities and conservation state 0 5 20 50 1.00
P12: Non–structural elements 0 5 20 50 0.25
Depending on the parameter and the selected class, the method assigns a numerical
value ( ) ranging from 0 to 50, which is affected by a coefficient of importance (Weight
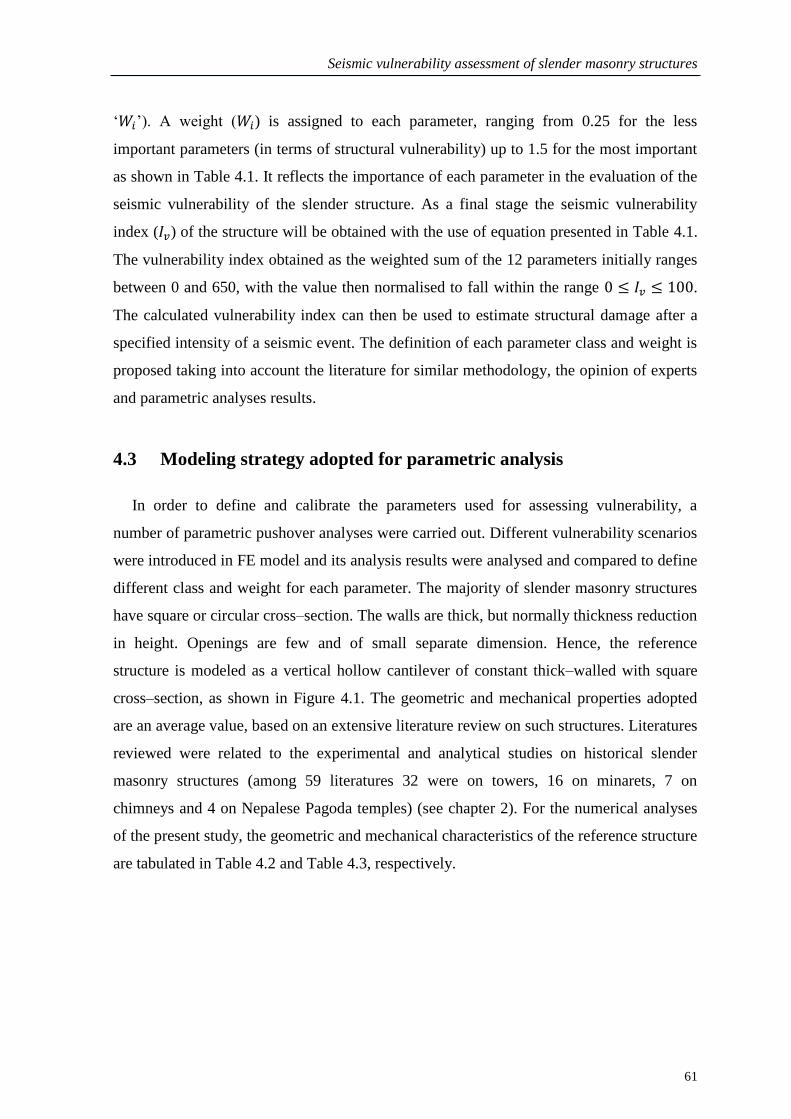
Seismic vulnerability assessment of slender masonry structures
61
„ ‟). A weight ( ) is assigned to each parameter, ranging from 0.25 for the less
important parameters (in terms of structural vulnerability) up to 1.5 for the most important
as shown in Table 4.1. It reflects the importance of each parameter in the evaluation of the
seismic vulnerability of the slender structure. As a final stage the seismic vulnerability
index ( ) of the structure will be obtained with the use of equation presented in Table 4.1.
The vulnerability index obtained as the weighted sum of the 12 parameters initially ranges
between 0 and 650, with the value then normalised to fall within the range .
The calculated vulnerability index can then be used to estimate structural damage after a
specified intensity of a seismic event. The definition of each parameter class and weight is
proposed taking into account the literature for similar methodology, the opinion of experts
and parametric analyses results.
4.3 Modeling strategy adopted for parametric analysis
In order to define and calibrate the parameters used for assessing vulnerability, a
number of parametric pushover analyses were carried out. Different vulnerability scenarios
were introduced in FE model and its analysis results were analysed and compared to define
different class and weight for each parameter. The majority of slender masonry structures
have square or circular cross–section. The walls are thick, but normally thickness reduction
in height. Openings are few and of small separate dimension. Hence, the reference
structure is modeled as a vertical hollow cantilever of constant thick–walled with square
cross–section, as shown in Figure 4.1. The geometric and mechanical properties adopted
are an average value, based on an extensive literature review on such structures. Literatures
reviewed were related to the experimental and analytical studies on historical slender
masonry structures (among 59 literatures 32 were on towers, 16 on minarets, 7 on
chimneys and 4 on Nepalese Pagoda temples) (see chapter 2). For the numerical analyses
of the present study, the geometric and mechanical characteristics of the reference structure
are tabulated in Table 4.2 and Table 4.3, respectively.
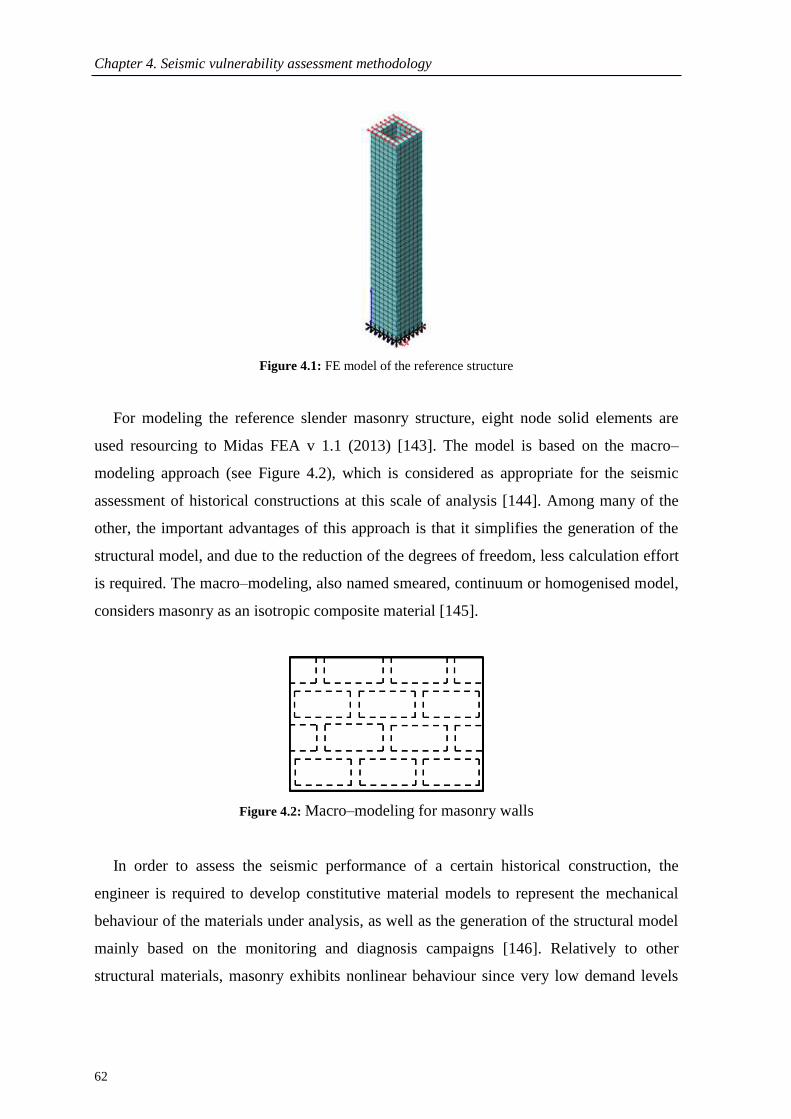
Chapter 4. Seismic vulnerability assessment methodology
62
Figure 4.1: FE model of the reference structure
For modeling the reference slender masonry structure, eight node solid elements are
used resourcing to Midas FEA v 1.1 (2013) [143]. The model is based on the macro–
modeling approach (see Figure 4.2), which is considered as appropriate for the seismic
assessment of historical constructions at this scale of analysis [144]. Among many of the
other, the important advantages of this approach is that it simplifies the generation of the
structural model, and due to the reduction of the degrees of freedom, less calculation effort
is required. The macro–modeling, also named smeared, continuum or homogenised model,
considers masonry as an isotropic composite material [145].
Figure 4.2: Macro–modeling for masonry walls
In order to assess the seismic performance of a certain historical construction, the
engineer is required to develop constitutive material models to represent the mechanical
behaviour of the materials under analysis, as well as the generation of the structural model
mainly based on the monitoring and diagnosis campaigns [146]. Relatively to other
structural materials, masonry exhibits nonlinear behaviour since very low demand levels

Seismic vulnerability assessment of slender masonry structures
63
due to the nonlinear material properties and its poor tensile and shear strength. Moreover,
the anisotropic behaviour of masonry is determined by the physical and mechanical
characteristics of its components (mortar joints and units). The nonlinear and anisotropic
behaviour of masonry imposes the use of seismic analyses based in nonlinear rules to
better represent the real behaviour of this material.
This research work does not intended to develop a constitutive material model for
masonry or to extend and existing one. Here, the constitutive material model named total
strain crack model introduced by Vecchio and Collins [147] is applied, which is integrated
in the program Midas FEA. This constitutive material model is based on total strain where
stress is described as a function of the strain and follows a smeared crack approach. The
basic concept of the total strain crack models is that the stress is evaluated in the directions
which are given by the crack direction. Following the explanations of Chen [148] and
Lourenço [149], the tension uniaxial behaviour is characterized by post–peak exponential
softening and the compressive uniaxial behaviour is characterized by a linear stress–strain
relation until one–third of the compressive strength, followed by a parabolic relation for the
hardening regime until reaching the compressive strength and another parabolic for post–
peak softening (see Figure 4.3a and Figure 4.3b). When total strain fixed crack model is
used also the shear retention needs to be defined. In the case of masonry, constant shear
retention is used, where the factor defines the amount of shear stiffness that remains after
cracking (see Fig 4.3c). Moreover, the module adopted for the crack bandwidth is left as
the default value, i.e. square root of total in–plane area of the 3D element.
Table 4.2: Geometrical characteristics of the reference structure
Characteristics Dimension
Total height (H) 40m
External side (B×L) 6×6m2
Mean wall thickness (t) 1m
Figure 4.3: Stress–Strain relations applied to the total strain crack model: a) behaviour of material with
softening under uniaxial tension; b) behaviour of material with hardening/softening under uniaxial
compression; c) behaviour of material with constant shear retention factor under uniaxial shear [143]

Chapter 4. Seismic vulnerability assessment methodology
64
Table 4.3: Masonry mechanical properties used as input for FE modeling
Parameters Symbol Value
Young‟s modulus (N/mm2) E 3500
Specific weight (kN/m3) 19
Poisson‟s ratio 0.19
Compressive strength (N/mm2) fc 3.50
Compressive fracture energy (N/mm) Gc 0.35
Tensile strength (N/mm2) ft 0.35
Tensile fracture energy (N/mm) Gf 0.07
Shear retation factor 0.01
4.4 Calibration of proposed methodology for vulnerability assessment
4.4.1 Definition of vulnerability assessment parameters
Overall vulnerability is calculated as the weighted sum of 12 parameters used in the
formulation of the seismic vulnerability index. These 12 parameters are grouped into four
groups. The first group includes parameters that characterize the building resisting system
(P1) and the type and quality of masonry (P2), from the material (size, shape and stone
type), masonry fabric and arrangement and quality of connections amongst walls, shear
strength capacity of the structure (P3), slenderness ratio of the structures (P4) and the soil
foundation conditions (P5). The second group of parameters is mainly focused on the
buildings relative location and on its interaction with other buildings (P6), evaluates the
irregularity in plan (P7) and elevation (P8) and identifies the wall openings number, size
and location (P9). The third group of parameter evaluates horizontal structural systems
(P10), namely the type of connection of the timber floors and the impulsive nature of the
pitched roofing systems. Finally, the fourth group of parameters evaluates the structural
fragilities and conservation state of the structures (P11), as well as the negative influence
of non–structural elements (P12) with poor connection conditions to the main structural
system. Definition and calibration of each parameter is carried out considering the
literature for similar methodology, the opinion of experts and parametric analyses results.
Definition and calibration of each parameter is detailed in the following sections:
P1: Types of resisting system
This parameter measures the resilient type of system, in terms of organization and
quality of the wall design and distribution of the structure, the efficiency of connections
between walls. It is essential to evaluate the distribution of walls, as well as connections

Seismic vulnerability assessment of slender masonry structures
65
between orthogonal walls and their connection to horizontal diaphragm, without regard to
the constitution of the masonry (which will be evaluated by another parameter).
To assess the level of connection between orthogonal walls particular attention should
be given to the corner angles, identifying the size and arrangement of the units. The
interlocking between the units of the masonry wall is particularly vulnerable to
detachment, which may be simply triggered by aging or by temperature and moisture
variation (temperature cycles). The definition of classes of vulnerability for this parameter
is presented in Table 4.4. Figure 4.4 shows some typical retrofitting solutions connecting
orthogonal walls.
Figure 4.4: Different aspects of the link between orthogonal walls [4; 150]
Table 4.4: Definition of the vulnerability classes for parameter P1
Class Description
A
Structures built according to earthquake resistant construction codes. Strengthening or consolidation
of the building masonry complying to rules earthquake resistance codes, thus ensuring the connection
requirements and efficient connection between orthogonal walls.
B
The structure has good links and bonding between orthogonal walls. Existence of ring beams and/or
steel ties well distributed in sufficient number with good anchorage, thus ensuring the conditions for
binding and effective connection between the vertical elements.
C
The structure does not have the effective connections defined in class B, however it presents good
connection quality between orthogonal walls, guaranteed by the appropriate bonding or interlocking
units in all the walls.
D The structure does not present effective connection of loadbearing walls. Total absence of steel tie
rods and/or ring beams.

Chapter 4. Seismic vulnerability assessment methodology
66
P2: Quality of resisting system
The masonry found in traditional structures is very heterogeneous, with different
material components, and techniques for nesting dimensions, which give different levels of
resistance and durability. This parameter assesses the quality of masonry walls, according
to three features: (a) homogeneity of the material, shape, size and nature of the units
(bricks, blocks or stones); (b) unit laying configuration and arrangement of the masonry
units; (c) type of cross–linking elements.
The first aspect is to identify the type of material (natural or artificial origin). The
resistant characteristics are very dependent on the type of unit or material, and its size. The
type of mortar is also an inseparable aspect, as it influences the bearing capacity of
masonry. The second aspect relates to the homogeneity and regularity in the arrangement
of units masonry, which is essentially of two types: a settlement with units carved with
vertical and horizontal joints well defined. The third part analyses the possible presence of
cross–connecting elements such as rows, which usually joins the two pieces of wall
(internal and external), giving it a degree of monolithic nature. The definition of
vulnerability classes is described in Table 4.5. Particular description of class A, B, C and D
type masonry with examples are presented in Table 4.6, Table 4.7, Table 4.8 and Table 4.9
respectively.
Table 4.5: Definition of the vulnerability classes for parameter P2
Class Description
A
Brick masonry of good quality. Well cut stone masonry units (squared) with homogeneous and
uniform in size throughout the length of the walls. Irregular stone masonry well mortared and
locked/arranged, existence of cross–connection between the two sides of the wall.
B
Brick masonry of average quality and carved stone masonry units with homogeneity over the whole
extension of the walls. Stone masonry with irregular cross–link elements between the two sides of
the wall.
C
Brick masonry of low quality with irregularities in laying and bonding. Masonry stone units, not
squared and heterogeneous dimensions. Irregular stone masonry without cross–linking elements, and
average mortar quality.
D
Brick masonry of poor quality with inlay of stone fragments. Stone masonry with very irregular
units, nesting irregularly and without locking care (creating gaps). Irregular stone masonry without
cross–connection and poor mortar quality.

Seismic vulnerability assessment of slender masonry structures
67
Table 4.6: Description of the masonry Class A [151]
Description of the masonry Examples of masonry Class A
Stone masonry consisting of homogeneous units (in terms of material
and dimensions), and well cut (parallelepiped form) with good laying
techniques and use of good quality mortar, good filling vertical and
horizontal joints.
Stone masonry of low porosity with good laying techniques and
locking with well–arranged vertical and horizontal joints. Mortar of
good quality.
Masonry units with perforated clay brick or cement blocks (15 to 45%
voids) with well–arranged vertical and horizontal joints, with good
quality mortar.
Stone masonry with timber structure, or frontal walls, under good
storage conditions with efficient connections between elements of
wood and without apparent deterioration of wood by biological attack
or by the action of water.
–
Masonry of solid brick or solid blocks well layed and locked with
vertical and horizontal joints filled with mortar of good quality.
Consolidated masonry and reinforced masonry with appropriate
techniques. –
Table 4.7: Description of the masonry Class B [151]
Description of the masonry Examples of masonry Class B
Stone masonry units consisting of non–homogeneous (in terms of
dimensions), but well locked and arranged longitudinally and transversely.
Mortar of good quality.
Stone masonry (slightly worked) with the use of stone or ceramic elements
with dimensions similar to wall thickness, so that the wall confers one
cross–linking unit throughout its thickness. Mortar of good quality.
Adobe masonry, with single or one and a half adobe thick, mortar with good
quality.
Perforated brick masonry or concrete blocks with good laying techniques
but arranged only with horizontal joints. Mortar of average quality. –
Stone Masonry of low porosity, with good laying techniques and locking
with vertical and horizontal arranged joints. Mortar of average quality. –
Stone masonry with wood or frontal walls in good repair with efficient
connections, with signs of wood decay by biological attack or rain water.
This will include the cases where there is disruption of wood elements.
–
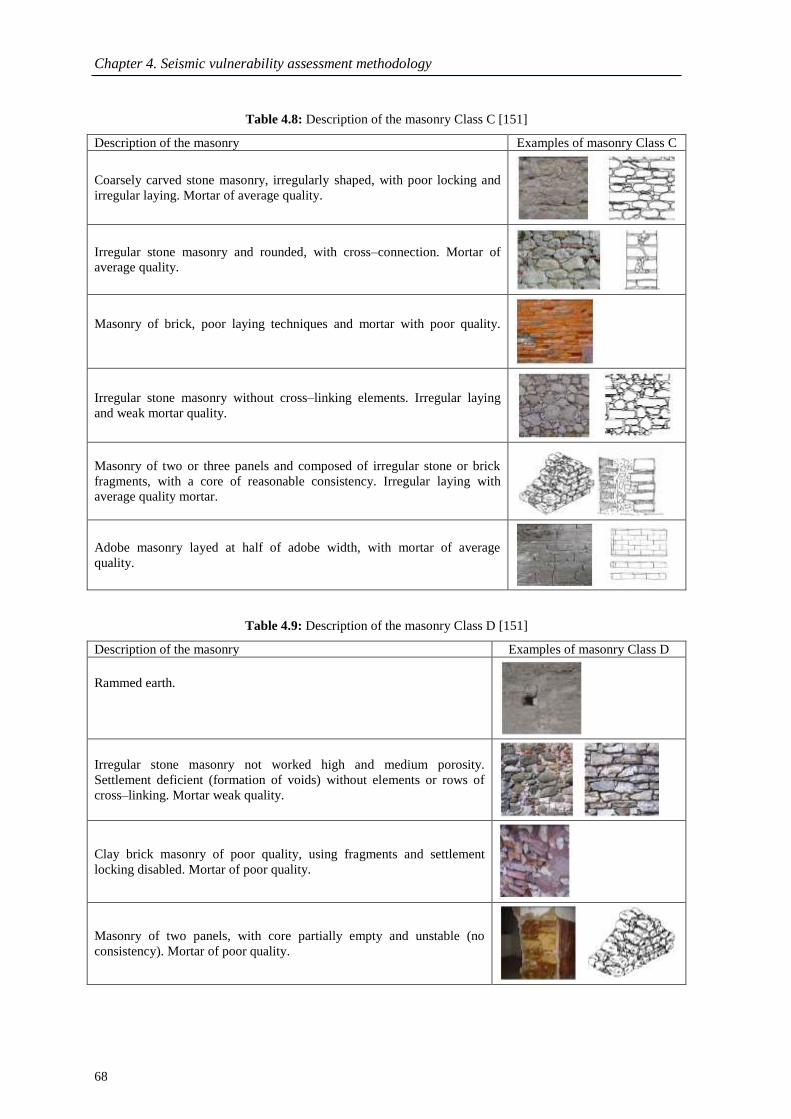
Chapter 4. Seismic vulnerability assessment methodology
68
Table 4.8: Description of the masonry Class C [151]
Description of the masonry Examples of masonry Class C
Coarsely carved stone masonry, irregularly shaped, with poor locking and
irregular laying. Mortar of average quality.
Irregular stone masonry and rounded, with cross–connection. Mortar of
average quality.
Masonry of brick, poor laying techniques and mortar with poor quality.
Irregular stone masonry without cross–linking elements. Irregular laying
and weak mortar quality.
Masonry of two or three panels and composed of irregular stone or brick
fragments, with a core of reasonable consistency. Irregular laying with
average quality mortar.
Adobe masonry layed at half of adobe width, with mortar of average
quality.
Table 4.9: Description of the masonry Class D [151]
Description of the masonry Examples of masonry Class D
Rammed earth.
Irregular stone masonry not worked high and medium porosity.
Settlement deficient (formation of voids) without elements or rows of
cross–linking. Mortar weak quality.
Clay brick masonry of poor quality, using fragments and settlement
locking disabled. Mortar of poor quality.
Masonry of two panels, with core partially empty and unstable (no
consistency). Mortar of poor quality.
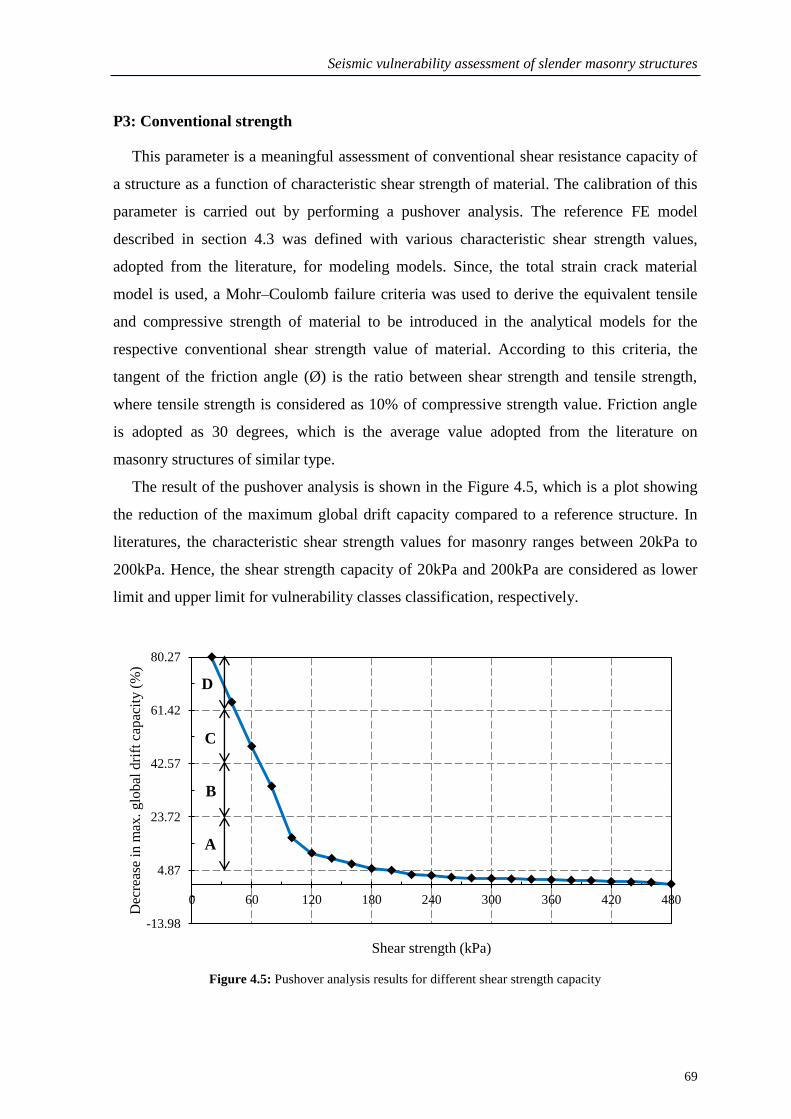
Seismic vulnerability assessment of slender masonry structures
69
P3: Conventional strength
This parameter is a meaningful assessment of conventional shear resistance capacity of
a structure as a function of characteristic shear strength of material. The calibration of this
parameter is carried out by performing a pushover analysis. The reference FE model
described in section 4.3 was defined with various characteristic shear strength values,
adopted from the literature, for modeling models. Since, the total strain crack material
model is used, a Mohr–Coulomb failure criteria was used to derive the equivalent tensile
and compressive strength of material to be introduced in the analytical models for the
respective conventional shear strength value of material. According to this criteria, the
tangent of the friction angle (Ø) is the ratio between shear strength and tensile strength,
where tensile strength is considered as 10% of compressive strength value. Friction angle
is adopted as 30 degrees, which is the average value adopted from the literature on
masonry structures of similar type.
The result of the pushover analysis is shown in the Figure 4.5, which is a plot showing
the reduction of the maximum global drift capacity compared to a reference structure. In
literatures, the characteristic shear strength values for masonry ranges between 20kPa to
200kPa. Hence, the shear strength capacity of 20kPa and 200kPa are considered as lower
limit and upper limit for vulnerability classes classification, respectively.
Figure 4.5: Pushover analysis results for different shear strength capacity
-13.98
4.87
23.72
42.57
61.42
80.27
0 60 120 180 240 300 360 420 480
Dec
reas
e in
max
. glo
bal
dri
ft c
apac
ity (
%)
Shear strength (kPa)
A
B
C
D

Chapter 4. Seismic vulnerability assessment methodology
70
The percentage of decrease in maximum global drift capacity between upper limit
(80.27%) and lower limit (4.86 %) is divided equally into two divisions (i.e. 4.86%–
23.71%, 23.71%–42.56% , 42.56%–61.42% and 61.42%–80.27%) and the relative shear
strength capacity is defined as the limiting range for the vulnerability classes B and D
respectively (see Table 4.10).
Table 4.10: Definition of the vulnerability classes for parameter P3
Class A B C D
Limit >100kPa 80kPa< ≤100kPa 60kPa< ≤80kPa ≤60kPa
In the absence of experimental characteristic shear strength value for assessing
structure, it can be sought to some literature values (see Tables 4.11). It is recalled that the
shear strain resistant is dependent on the type of units, the nature of the material, the laying
and the type of mortar used.
Table 4.11: Characteristic values of shear strength capacity (GNDT–SSN–1994 [131] and González [152])
Types of masonry wall (kPa)
Solid brick with poor laying mortar 60–120
GNDT–SSN–1994 [131]
Blocks with poor laying mortar 80
Concrete or cellular concrete block with poor mortar 180
Stone in poor condition (irregular format)
20 Stone (in the case of having cross–linking elements
the value be increased 30%)
Simple stone well layed 70–90
Irregular stone in good condition 40
Volcanic tuff block 100
Two leafs masonry 40
Masonry of volcanic tuff 70
González [152])
Stone masonry rounded 40
Solid clay brick of average quality 60–120
Solid clay brick of good quality 180
Solid cement block 180
New masonry of solid clay brick 200
Hollow clay brick masonry 180
Limestone masonry of regular dimension 100
P4: Slenderness ratio
Slenderness ratio is the ratio of the effective length of a structural member to its least
radius of gyration (as expressed in Eq. ( )) and generally is considered as height to
breadth ratio. This parameter evaluates the slenderness of the structures which is crucial to
Seismic vulnerability assessment of slender masonry structures
71
evaluate, since, it highly raises the stresses produced by static and dynamic loads at the
base, particularly with regard to horizontal loading induced by a strong–motion. This
parameter is vital to define the vulnerability of slender masonry structures.
The definition of vulnerability classes for this parameter is carried out by calculating the
maximum top displacement assuming the slender masonry structures as vertical cantilever
hollow beam members, as expressed by Eq. ( ). In this study, the lateral load assumed
was 18% (design value of horizontal seismic coefficient) of its self–weight which was
distributed linearly as an inverted triangular distribution throughout its height. The design
value of horizontal seismic coefficient ( ), in the Response Spectrum methods (according
to IS–1893 [153]) is computed as given by the Eq. ( ).
Slenderness ratio
Maximum top displacement
Horizontal seismic coefficient
where,
is the height of the structure;
is the radius of gyration √
;
is the cross–sectional area ;
is the minimum moment of inertia;
is the young‟s modulus;
is the lateral load intensity ;
is a coefficient depending upon the soil foundation = 1.5 (considering un–reinforced
strip foundations);
is a factor depending upon the importance of the structures = 1.5 (considering
monumental structures);
is a seismic zone factor for average acceleration spectra = 0.4 (considering zone V);
is an average acceleration coefficient = 0.2 (considering natural period of vibration
0.7sec with 2% damping).

Chapter 4. Seismic vulnerability assessment methodology
72
The maximum global drift is calculated for different types of slender masonry structures
(i.e. 78 Pagoda temples, 72 towers, 32 minarets and 8 chimneys) using the information
gathered from the literature review, whereas for Pagoda temples geometric characteristics
were obtained from field survey. Maximum global drift versus slenderness ratio and
height to breadth ratio is shown in Figure 4.6 and Figure 4.7 respectively for each type of
structure.
The definition of vulnerability classes is carried out using the following procedure:
(a) Firstly, structures of same type are sorted in increasing order in respect to
maximum global drift percentage (for example maximum global drift for 72 towers
ranges from 0.013% to 1.987%);
(b) Secondly, these sorted structures are divided into 4 groups, with equal number of
structures in each group (for example, 4 groups of 72 towers consist of 18 in each
group and with limiting value of maximum global drift ranging from 0.013% to
0.087%, 0.087% to 0.17%, 0.17% to 0.357% and 0.357% to 1.987%);
(c) Finally, the corresponding value of the slenderness ratio and height to breadth ratio
for limiting the value of maximum global drift percentage of each group following
the trendline defines the vulnerability classes A, B, C and D for that structure type
(see Table 4.12).
Figure 4.6: Comparison between slenderness ratio vs max. global drift percentage for different types of
slender masonry structures
0.0
0.5
1.0
1.5
2.0
0 20 40 60 80 100
Max
. glo
bal
dri
ft (%
)
Slenderness ratio (λ)
Towers
Chimneys
Minarets
Pagoda temples
Towers
Chimneys
Minarets
Pagoda temples

Seismic vulnerability assessment of slender masonry structures
73
Figure 4.7: Comparison between height/breadth ratio vs max. global drift percentage for different types of
slender masonry structures
Table 4.12: Definition of the vulnerability classes for parameter P4, in function of slenderness ratio and
height/breadth ratio (according to their influence over the global drift)
Cla
ss Type of structure
Bell tower Chimney Minaret Pagoda temple
A
λ ≤23
[11]
λ ≤38
[91]
λ ≤40
[26;41]
λ ≤11
≤3.75
≤6
≤6
≤2
B
23< λ ≤32
[48; 70; 76]
40< λ ≤66
[93]
40< λ ≤64
[26]
11< λ ≤15
3.75<
≤5.25 6<
≤9.5 6<
≤9 2<
≤2.5
C
32< λ ≤44
[82; 81; 38]
66< λ ≤84
64< λ ≤90
[26]
15< λ ≤18
5.25<
≤7 9.5<
≤10.5 9<
≤12 2.5<
≤3
D
λ >44
[3;154]
λ >84
[15]
λ >90
[26; 89]
λ >18
>7
>10.5
>12
>3
Here, : Slenderness ratio, : Height of the structure and : Wall breadth at the base (minimum)
0.0
0.5
1.0
1.5
2.0
0 3 6 9 12 15
Max
. glo
bal
dri
ft (
%)
Height/Breadth
Towers
Chimneys
Minarets
Pagoda temples
Towers
Chimneys
Minarets
Pagoda temples

Chapter 4. Seismic vulnerability assessment methodology
74
P5: Location and soil conditions
This parameter assesses the importance of factors such as the topography, type and
consistency of the ground foundation and also evaluates the risk of landslide or slipping of
foundation soils, when subjected to seismic action (see Figure 4.8). In this procedure, the
difficulty of assessing the ground–structure interaction is simplified in each case.
It is common in old structures only an extension of the wall depth, a situation that is not
classifiable as a foundation. However, it is considered that the typical "thickening" of the
base of the wall structure can be classified as a foundation. If existing geophysical
reconnaissance elements (geology soil stratification) that allow more accurate
identification of the soil foundation types, also allowing their classification assessing the
definition of the vulnerability classes as indicated in Table 4.13.
The designation used for the type of soil is proposed in Eurocode 8 (EC8) (i.e. A, B, C,
D, E, S1, and S2) [155]. The class assignment is made in respect to the worst conditions
identified. It is not considered in the classification in Table 4.13, the risk of other
phenomena, such as liquefaction slip and drop. If the study area is recognized to have
potential occurrence of liquefaction of saturated granular soils (soil type S1 and S2
according to the EC8 classification) when subjected to an earthquake, it should be
considered a vulnerability class D. Note that it is not integrated in this methodology to
evaluate the possibility of an effect of soil amplification.
Figure 4.8: Location of the structure in various slope of the land [151]

Seismic vulnerability assessment of slender masonry structures
75
Table 4.13: Definition of the vulnerability classes for parameter P5
Foundation soil Foundation land slope „p‟ (%) Class
Soil type A with or without the foundation
or soil type B and C with the foundation
A
B
C
D
Soil type B and C without the foundation
A
B
C
D
Soil type D and E with the foundation C
D
Soil type D and E without the foundation C
D
P6: Position and interaction
The evaluation of the regularity of slender structures, built in with or adjacent to other
buildings, should not be analysed individually. One must take into account the interaction
with the adjacent structure to which it is connected, that limits its seismic response (i.e. to
the deformation requirements due to the interaction point or section).
The response of the structure to horizontal action is influenced by its position,
confinement and interaction, which can produce a high stress concentration at the point of
connection and contact with adjacent structures. Figure 4.9 shows the damage occurred in
slender structures due to interaction with adjacent structures. Figure 4.10 shows the
possible position of such type of structures and vulnerability classes according to location
and interaction as described in Table 4.14.
Figure 4.9: Earthquake damage at the bond provided by the adjacent structure [21]
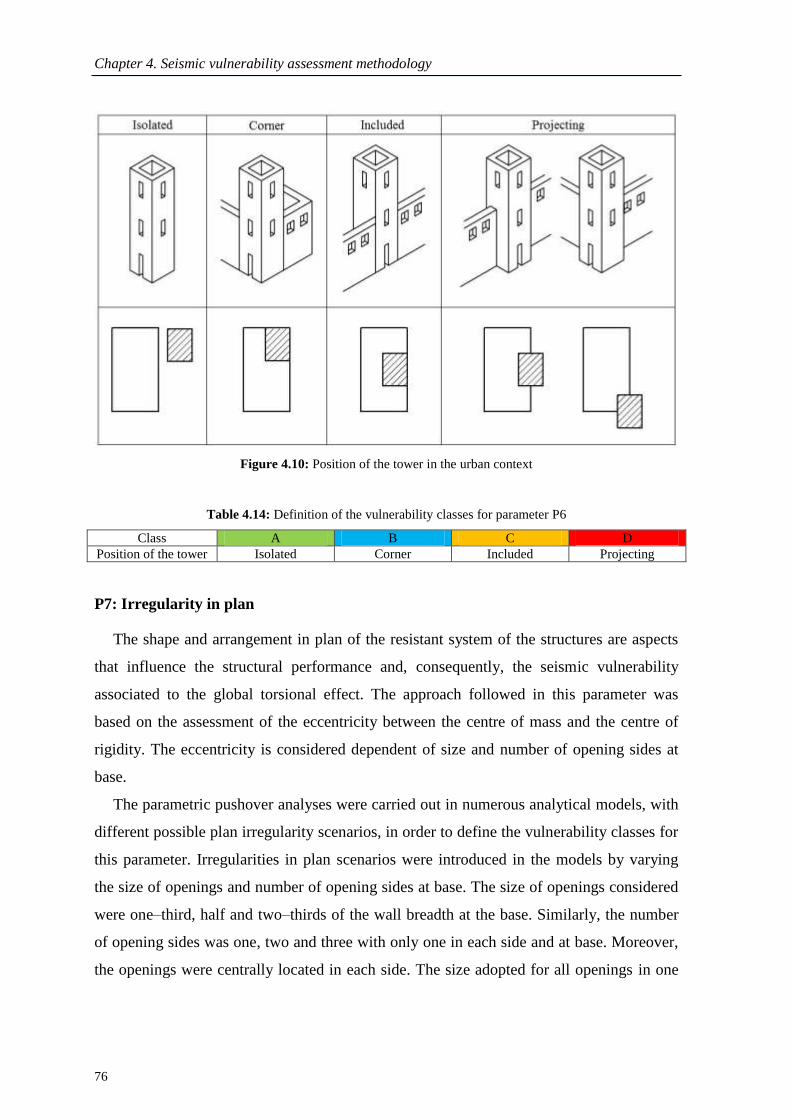
Chapter 4. Seismic vulnerability assessment methodology
76
Figure 4.10: Position of the tower in the urban context
Table 4.14: Definition of the vulnerability classes for parameter P6
Class A B C D
Position of the tower Isolated Corner Included Projecting
P7: Irregularity in plan
The shape and arrangement in plan of the resistant system of the structures are aspects
that influence the structural performance and, consequently, the seismic vulnerability
associated to the global torsional effect. The approach followed in this parameter was
based on the assessment of the eccentricity between the centre of mass and the centre of
rigidity. The eccentricity is considered dependent of size and number of opening sides at
base.
The parametric pushover analyses were carried out in numerous analytical models, with
different possible plan irregularity scenarios, in order to define the vulnerability classes for
this parameter. Irregularities in plan scenarios were introduced in the models by varying
the size of openings and number of opening sides at base. The size of openings considered
were one–third, half and two–thirds of the wall breadth at the base. Similarly, the number
of opening sides was one, two and three with only one in each side and at base. Moreover,
the openings were centrally located in each side. The size adopted for all openings in one

Seismic vulnerability assessment of slender masonry structures
77
model was equal, if it has more than one opening. The results of parametric pushover
analyses, in terms of maximum global drift capacity, from these models were compared
with the results of the reference structure. Figure 4.11 shows the influence of size of
openings and number of opening sides at base in the decrease of maximum global drift
capacity (in percentage) in comparison to the reference structure.
Here, the model with one side opening and opening size of two–thirds of wall breadth at
the base shows the highest decrease in maximum global drift capacity (i.e. 48%). Result of
pushover analysis carried out on model by increasing the size of openings further shows
that it could not withstand any lateral load. Hence, 48% decrease in maximum global drift
capacity was considered as upper limit for vulnerability classes classification. Based on
this upper limit, the percentage decrease in maximum global drift capacity was divided
equally into four ranges (i.e. 0%–12%, 12%–24% , 24%–36% and 24%–48%) and the
relative opening size at base is defined as the limiting range for the vulnerability classes A,
B, C and D, respectively (see Table 4.15). Similarly, the relative eccentricity ( ) of the
structures with openings‟ size as defined above was estimated. These estimated values
define the vulnerability classes in function of the relative eccentricity as shown in Table
4.16.
Figure 4.11: Influence of size of openings and number of opening sides at base in the max. global drift
capacity
0
12
24
36
48
0 10 20 30 40 50 60 70
Dec
reas
e in
max
. glo
bal
dri
ft ca
pac
ity (
%)
Opening size at bottom (% of wall breadth)
1 side opening at base
2 sides opening at base
3 sides opening at base
A
B
C
D

Chapter 4. Seismic vulnerability assessment methodology
78
Table 4.15: Definition of the vulnerability classes for parameter P7, in function of the size of openings and
number of opening sides at base (dimension of openings are considered centered and equal in all sides)
Cla
ss Size of openings at base „OB‟
Location Example Square section
(% of breadth at base)
Circular section
(% of diameter at base)
Nu
mb
er o
f si
des
wit
h o
pen
ing
1
A OB ≤46% OB ≤39%
[ 11]
B 47%< OB ≤53% 40%< OB ≤45%
[80; 63; 38]
C 53%< OB ≤57% 45%< OB ≤49%
[28]
D OB >57% OB >49%
–
2
A OB ≤45% OB ≤38%
[156; 157]
B 45%< OB ≤46% 38%< OB ≤39%
–
D OB >46% OB >39%
–
3
A OB ≤22% OB ≤20%
–
B 22%< OB ≤29% 20%< OB ≤25%
–
D BO>29% BO>25%
Table 4.16: Definition of the vulnerability classes for parameter P7, in function of the max. relative
eccentricity (% of wall breadth)
Class A B C D
Number of
sides of
opening
1 ≤15% 15%< ≤22% 22%< ≤25% >25%
2 ≤12% 12%< ≤13% – >13%
3 ≤6% 6%< ≤12% – >12%

Seismic vulnerability assessment of slender masonry structures
79
P8: Irregularity in elevation
This parameter assesses the vulnerability associated to the irregularity in elevation. The
irregularity in elevation was defined as a function of stiffness variation along the height of
the structure. The approach followed in this parameter is based on the assessment of
discontinuity in masonry wall regarding: (a) reduction in the wall thickness (see Figure
4.12a) and (b) presence of non–supported wall portion (see Figure 4.12b).
Figure 4.12: Vertical irregularity scenario: a) reduction in wall thickness; b) presence of non–supported wall
portion
The parametric pushover analyses were carried out in numerous analytical models,
modeled with different possible scenarios of irregularity in elevation, to define the
vulnerability classes for this parameter. Firstly, models were considered with an internally,
both ways and externally reduction of the wall thickness (i.e. 25%, 50% and 75%) above
different levels (i.e. one–fourth, half and three–fourths of total height) as shown in Figure
4.13. Secondly, models were considered with the non–supported wall portion, i.e.
thickness of wall portion equal to 25%, 50%, 75% and 100% of its own thickness was not
supported by the continuous base wall beneath as shown in Figure 4.14. Furthermore, the
non–supported wall portion was accumulated with reduction in the wall thickness (i.e.
25%, 50%, and 75% of base wall thickness) above different levels (i.e. one–fourth, half
and three–fourths of the total height). The results of these parametric pushover analyses, in
terms of maximum global drift capacity, obtained with these models were compared with
the results for the reference structure.

Chapter 4. Seismic vulnerability assessment methodology
80
Figure 4.13: Reduction in wall thickness scenario for parametric analysis: a) linearly thickness reduction
through overall height internally, both way and externally; b), c), d) 75%, 50% and 25% thickness reduction
above 1/4th
of overall height internally, both way and externally; e), f), g) 75%, 50% and 25% thickness
reduction above 1/2 of overall height internally, both way and externally; h), i), j) 75%, 50% and 25%
thickness reduction above height 3/4th
of overall height internally, both way and externally
Figure 4.14: Discontinuous scenario in masonry wall section for parametric analysis
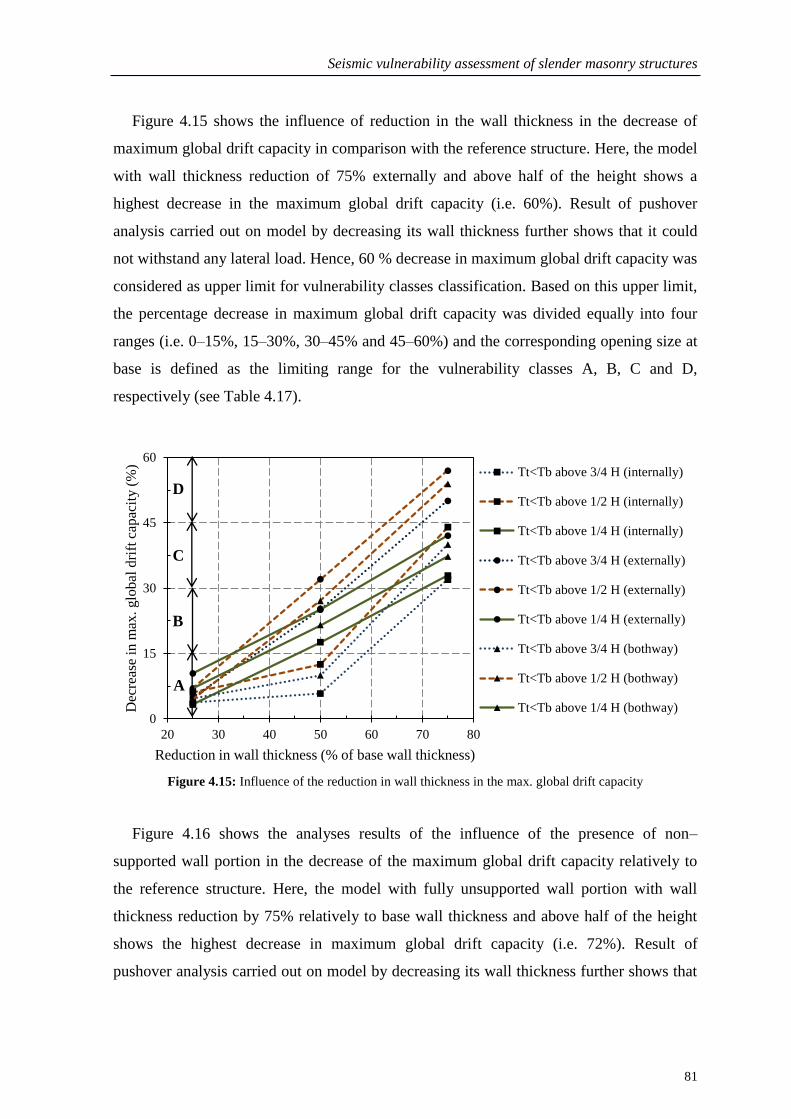
Seismic vulnerability assessment of slender masonry structures
81
Figure 4.15 shows the influence of reduction in the wall thickness in the decrease of
maximum global drift capacity in comparison with the reference structure. Here, the model
with wall thickness reduction of 75% externally and above half of the height shows a
highest decrease in the maximum global drift capacity (i.e. 60%). Result of pushover
analysis carried out on model by decreasing its wall thickness further shows that it could
not withstand any lateral load. Hence, 60 % decrease in maximum global drift capacity was
considered as upper limit for vulnerability classes classification. Based on this upper limit,
the percentage decrease in maximum global drift capacity was divided equally into four
ranges (i.e. 0–15%, 15–30%, 30–45% and 45–60%) and the corresponding opening size at
base is defined as the limiting range for the vulnerability classes A, B, C and D,
respectively (see Table 4.17).
Figure 4.15: Influence of the reduction in wall thickness in the max. global drift capacity
Figure 4.16 shows the analyses results of the influence of the presence of non–
supported wall portion in the decrease of the maximum global drift capacity relatively to
the reference structure. Here, the model with fully unsupported wall portion with wall
thickness reduction by 75% relatively to base wall thickness and above half of the height
shows the highest decrease in maximum global drift capacity (i.e. 72%). Result of
pushover analysis carried out on model by decreasing its wall thickness further shows that
0
15
30
45
60
20 30 40 50 60 70 80
Dec
reas
e in
max
. glo
bal
dri
ft c
apac
ity (
%)
Reduction in wall thickness (% of base wall thickness)
Tt<Tb above 3/4 H (internally)
Tt<Tb above 1/2 H (internally)
Tt<Tb above 1/4 H (internally)
Tt<Tb above 3/4 H (externally)
Tt<Tb above 1/2 H (externally)
Tt<Tb above 1/4 H (externally)
Tt<Tb above 3/4 H (bothway)
Tt<Tb above 1/2 H (bothway)
Tt<Tb above 1/4 H (bothway)
A
B
C
D

Chapter 4. Seismic vulnerability assessment methodology
82
it could not withstand any lateral load. Hence, 72% decrease in maximum global drift
capacity was considered as upper limit for vulnerability classes classification. Based on
this upper limit, the percentage decrease in maximum global drift capacity was divided
equally into four ranges (i.e. 0–18%, 18–36%, 36–54% and 54–72%) and the relative
opening size at base is defined as the limiting range for the vulnerability classes A, B, C
and D respectively (see Table 4.18).
Table 4.17: Definition of the vulnerability classes for parameter P8 due to variation of wall thickness
Cla
ss
Constant thickness up to 3/4th
of height and above that
thickness reduction section
Constant thickness up to 1/2 of
height and above that thickness
reduction section
Constant thickness up to 1/4th
of
height and above that thickness
reduction section
Internally or
Both ways Externally Internally
Externally or
Both ways
Internally Both
ways Externally
A
Tt≥
0.4
6T
b
[79]
Tt≥
0.6
3T
b
[124]
Tt≥
0.4
8T
b
[20]
Tt≥
0.6
7T
b
[13]
Tt≥
0.5
5T
b
[67]
Tt≥
0.6
1T
b
Tt≥
0.6
7T
b
[11]
B
0.4
6T
b>
Tt≥
0.3
3T
b
[62]
0.6
3T
b>
Tt≥
0.4
5T
b
[32]
0.4
8T
b>
Tt≥
0.3
6T
b
[158]
0.6
7T
b>
Tt≥
0.5
2T
b
[22]
0.5
5T
b>
Tt≥
0.3
0T
b
[91]
0.6
1T
b>
Tt≥
0.3
7T
b
0.6
7T
b>
Tt≥
0.4
3T
b
[22]
C
Tt<
0.3
3T
b
[11]
0.4
5T
b<
Tt≥
0.3
0T
b
[159]
Tt<
0.3
6T
b
[74]
0.5
2T
b>
Tt≥
0.3
7T
b
[87]
Tt<
0.3
0T
b
–
Tt<
0.3
7T
b
Tt<
0.4
3T
b
[16]
D –
Tt<
0.3
0T
b
–
Tt<
0.3
7T
b
[26]
–

Seismic vulnerability assessment of slender masonry structures
83
Figure 4.16: Influence of the presence of non–supported wall portion in the max. global drift capacity
Table 4.18: Definition of the vulnerability classes for parameter P8 due to the presence of discontinuities in
wall (i.e. non–supported wall portion)
Class Discontinuous wall above
3/4th
of height
Discontinuous wall above 1/2
of height
Discontinuous wall above 1/4th
of
height
A
Tn
≤0
.72
Tt
and
0.7
5T
b<
Tt≤
Tb
[78] T
n≤
0.5
8T
t an
d
0.7
5T
b<
Tt≤
Tb
[160] T
n≤
0.6
3T
t an
d
0.7
5T
b<
Tt≤
Tb
[82]
B
0.72Tt<Tn≤Tt and
0.75Tb<Tt≤Tb
or
Tn≤0.87Tt and
0.5Tb<Tt≤0.75Tb [60]
0.58Tt<Tn≤Tt and
0.75Tb<Tt≤Tb
or
Tn≤0.70Tt and
0.5Tb<Tt≤0.75Tb [106]
0.63<Tn≤Tt and
0.75Tb<Tt≤Tb
or
Tn≤0.82Tt and
0.5Tb≤Tt<0.75Tb [106]
C
0.87Tt<Tn≤Tt and
0.5Tb<Tt≤0.75Tb
0.70Tt<Tn≤Tt and
0.5Tb<Tt≤0.75Tb
0.82<Tn≤Tt and
0.5Tb<Tt≤0.75Tb
[106]
Tn≤Tt and 0.25Tb<Tt≤0.5Tb
D Tn≤Tt and Tt≤0.25Tb
[106]
0
18
36
54
72
10 30 50 70 90 110
Dec
reas
e in
max
. glo
bal
dri
ft c
apac
ity (
%)
Non–supported wall portion (% of top wall thickness)
Tt=Tb above 3/4 H
Tt=0.75Tb above 3/4 H
Tt=0.5Tb above 3/4 H
Tt=0.25Tb above 3/4 H
Tt=Tb above 1/2 H
Tt=0.75Tb above 1/2 H
Tt=0.5Tb above 1/2 H
Tt=0.25Tb above 1/2 H
Tt=Tb above 1/4 H
Tt=0.75Tb above 1/4 H
Tt=0.5Tb above 1/4 H
Tt=0.25Tb above 1/4 HA
B
C
D

Chapter 4. Seismic vulnerability assessment methodology
84
The structures with constant thickness throughout the height or linearly reduction in
wall thickness are considered as belonging to the vulnerability class A. The irregularity in
elevation is evaluated on the basis of geometrical criteria (variation of wall thickness or
presence of a non–supported wall portion). However, the variation of masonry wall
arrangement/fabric and material is also important and may limit the structural performance
to horizontal actions. Therefore, if a variation of wall masonry material is observed, the
vulnerability class should be downgraded by one class.
P9: Wall openings number, size and location
Vulnerability of slender masonry structures is influenced by its mass and stiffness
distribution in height, links to adjacent structures, material properties, aspect ratio and its
slenderness. The area and location of structural openings in the walls highly influence the
damage mechanisms in–plane or out–of–plane of the wall.
Parametric pushover analyses were carried out in numerous analytical models, to define
the vulnerability classes for this parameter. The models were considered with openings of
different sizes (i.e. one–third, half and two–thirds of wall breadth) and number (i.e. one,
two and three), which were located at different levels (i.e. base, middle and top) (see
Figure 4.17). Here, openings in the opposite façades are considered identical making the
model symmetric in X and Y direction. The results of the parametric pushover analyses, in
terms of maximum global drift capacity, obtained with these models were compared with
the results for the reference structure.
Figure 4.17: FE models for parametric analysis
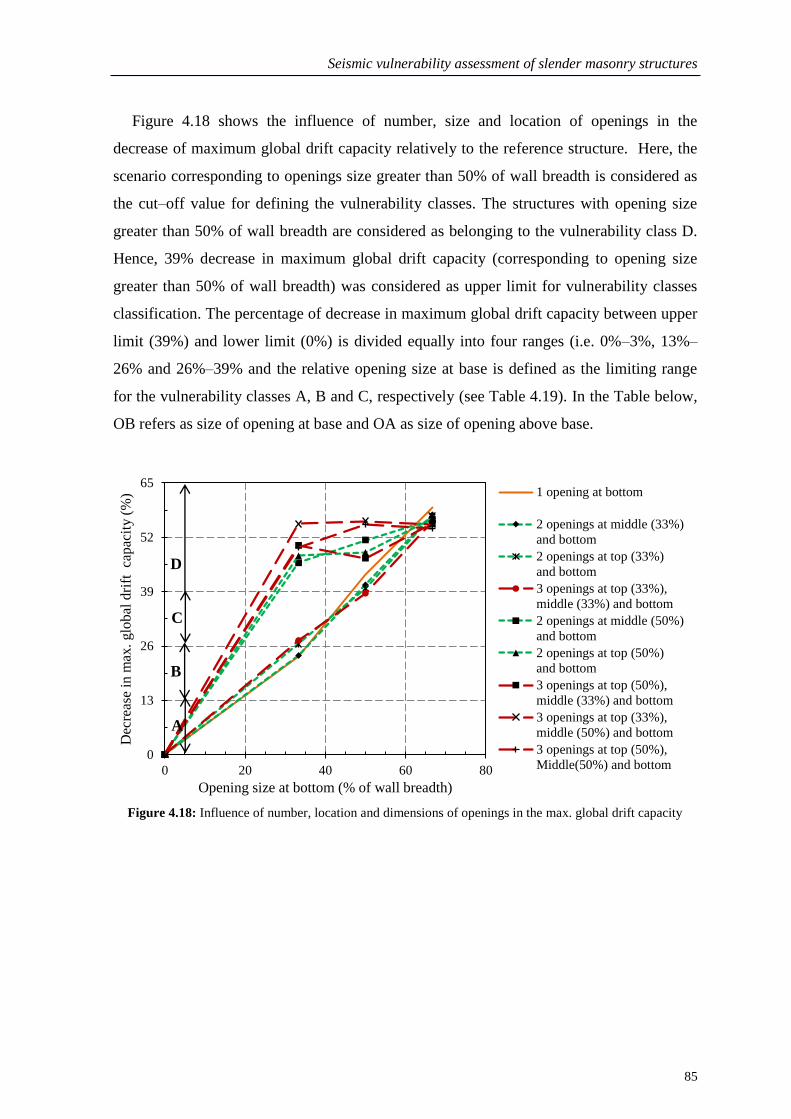
Seismic vulnerability assessment of slender masonry structures
85
Figure 4.18 shows the influence of number, size and location of openings in the
decrease of maximum global drift capacity relatively to the reference structure. Here, the
scenario corresponding to openings size greater than 50% of wall breadth is considered as
the cut–off value for defining the vulnerability classes. The structures with opening size
greater than 50% of wall breadth are considered as belonging to the vulnerability class D.
Hence, 39% decrease in maximum global drift capacity (corresponding to opening size
greater than 50% of wall breadth) was considered as upper limit for vulnerability classes
classification. The percentage of decrease in maximum global drift capacity between upper
limit (39%) and lower limit (0%) is divided equally into four ranges (i.e. 0%–3%, 13%–
26% and 26%–39% and the relative opening size at base is defined as the limiting range
for the vulnerability classes A, B and C, respectively (see Table 4.19). In the Table below,
OB refers as size of opening at base and OA as size of opening above base.
Figure 4.18: Influence of number, location and dimensions of openings in the max. global drift capacity
0
13
26
39
52
65
0 20 40 60 80
Dec
reas
e in
max
. glo
bal
dri
ft ca
pac
ity (
%)
Opening size at bottom (% of wall breadth)
1 opening at bottom
2 openings at middle (33%)
and bottom
2 openings at top (33%)
and bottom
3 openings at top (33%),
middle (33%) and bottom
2 openings at middle (50%)
and bottom
2 openings at top (50%)
and bottom
3 openings at top (50%),
middle (33%) and bottom
3 openings at top (33%),
middle (50%) and bottom
3 openings at top (50%),
Middle(50%) and bottom
B
D
C
A

Chapter 4. Seismic vulnerability assessment methodology
86
Tables 4.19: Definition of the vulnerability classes for parameter P9, in function of the number, location and
size of openings (according to their influence in the global drift)
Cla
ss
Opening at one level Openings at two level Openings at three or more
level
Square
cross–
section
(% of wall
breadth )
Circular
cross–
section
(% of
diameter)
Ex
amp
le Square
cross–
section
(% of wall
breadth)
Circular
cross–
section
(% of
diameter)
Ex
amp
le Square
cross–
section
(% of wall
breadth)
Circular
cross–
section
(% of
diameter)
Ex
amp
le
A
OB
≤1
8%
OB
≤1
6%
[42]
OB
≤1
7%
an
d 0
%≤
OA
≤33
%
or
OB
≤9
% a
nd
33
%≤
OA
≤50
%
OB
≤1
5%
an
d 0
%≤
OA
≤28
%
or
OB
≤8
% a
nd
28
%≤
OA
≤43
%
[16]
[70]
OB
≤1
6%
an
d 0
%≤
OA
≤33
%
or
OB
≤8
% a
nd
33
%≤
OA
≤50
%
OB
14
% a
nd 0
%≤
OA
≤2
8%
or
OB
≤7
% a
nd
28
%≤
OA
≤43
%
[32]
B
18%
<O
B≤
36
%
16%
<O
B≤
31
%
17%
≤O
B≤
34%
an
d 0
%≤
OA
≤3
3%
or
9%
≤O
B≤
18%
and
33%
≤O
A≤
50%
15%
≤O
B≤
29%
an
d 0
%≤
OA
≤2
8%
or
8%
≤O
B≤
16%
and
28%
≤O
A≤
43%
[161]
[162] 1
6%
≤O
B≤
32%
an
d 0
%≤
OA
≤3
3%
or
8%
≤O
B≤
17%
and
33%
≤O
A≤
50%
14%
≤O
B≤
27%
an
d 0
%≤
OA
≤2
8%
or
7%
≤O
B≤
15%
and
28%
≤O
A≤
43%
[11]
C
36%
<O
B ≤
50%
31%
<O
B≤
43
%
34%
≤O
B≤
48%
an
d 0
%≤
OA
≤3
3%
or
18%
≤O
A≤
27
% a
nd 3
3%
≤O
A≤
50%
29%
≤O
B≤
41%
an
d 0
%≤
OA
≤2
8%
or
16%
≤O
B≤
23%
an
d 2
8%
≤O
A≤
43%
[49]
32%
≤O
B≤
46%
an
d 0
%≤
OA
≤3
3%
or
17%
≤O
B≤
26%
an
d 3
3%
≤O
A≤
50%
27%
≤O
B≤
39%
an
d 2
8%
≤O
A≤
43%
or
15%
≤O
B≤
22%
an
d 2
8%
≤O
A≤
43%
D
OB
>5
0%
OB
>4
3%
OB
>4
8%
and
0%
≤O
A≤
33
%
or
OB
>2
7%
and
3
3%
≤O
A≤
50%
OB
>4
1%
and
0
%≤
OA
≤28
%
or
OB
>2
3%
and
28
≤O
A≤
43
%
[163]
OB
>4
6%
and
0
%≤
OA
≤33
%
or
OB
>2
6%
and
33%
≤O
A≤
50%
OB
>3
9%
and
0%
≤O
A≤
28
%
or
OB
>2
2%
and
28%
≤O
A≤
43%
[164]

Seismic vulnerability assessment of slender masonry structures
87
P10: Flooring and roofing system
The quality and type of structural system of the floors and roof has a remarkable
influence on the overall structural behaviour. It is proposed in this parameter the definition
of the classes according to the state of conservation of floors and roofs, as this affects their
connection conditions to the walls, as well as its own. It is important that the floors are
well connected to the walls, so that, they transmit vertical and horizontal loads (see Figure
4.19). The deficiency of these connections creates instability in structure, the floor losing
its ability to lock the walls (increasing its slenderness, and hence reducing its carrying
capacity). Floors with insufficient stiffness in its plane induce a brittle behaviour of the
structure, not mobilizing the response of the walls globally.
Figure 4.19: Different aspects of the link between wall and floor [151]
This criteria also considers the configuration of roofing. The possibility of coverage
triggering lateral impulses to walls is undoubtedly an aspect in conditioning performance
of the structures. The existence of elements connecting the roof to the wall, the possible
presence of a perimetral beam or tie rods, and also their conservation status may influence
the seismic performance of the structures. The impulsive nature of the roof is especially
important because it may increase the seismic forces on the walls, eventually causing out–
of–plan collapse (see Figure 4.20). Definitions of classes of vulnerability for the parameter
P10 are presented in Table 4.20.
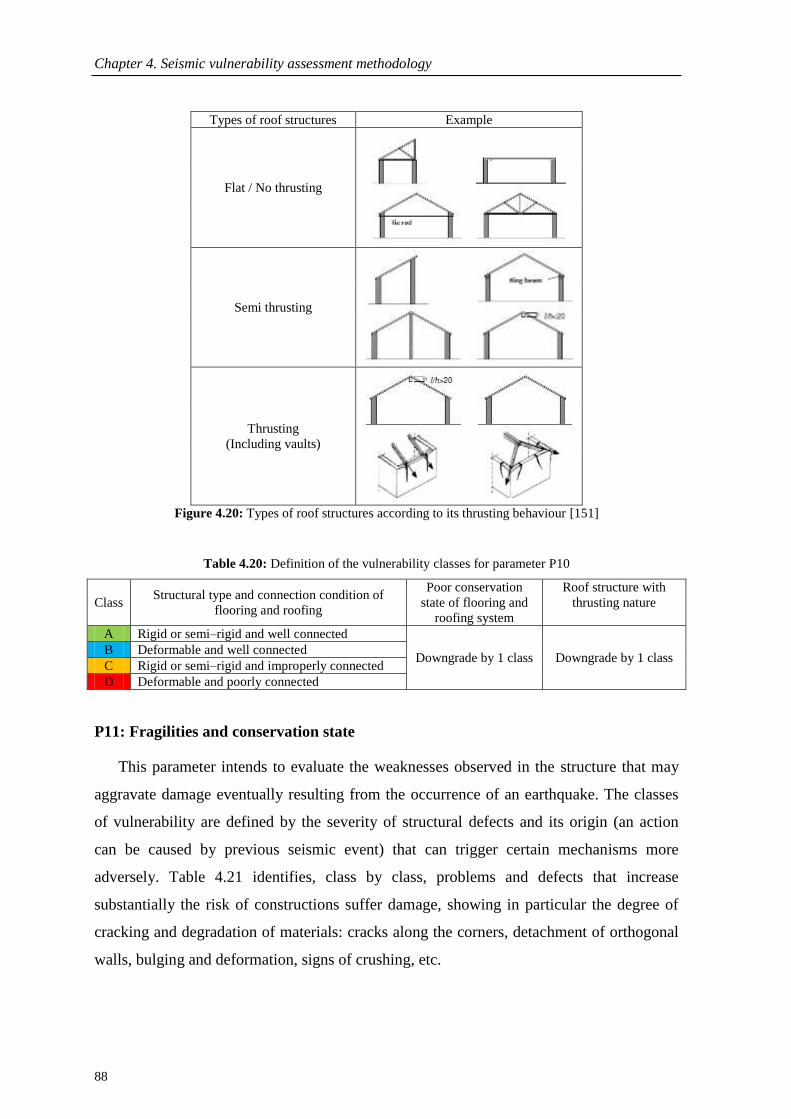
Chapter 4. Seismic vulnerability assessment methodology
88
Types of roof structures Example
Flat / No thrusting
Semi thrusting
Thrusting
(Including vaults)
Figure 4.20: Types of roof structures according to its thrusting behaviour [151]
Table 4.20: Definition of the vulnerability classes for parameter P10
Class Structural type and connection condition of
flooring and roofing
Poor conservation
state of flooring and
roofing system
Roof structure with
thrusting nature
A Rigid or semi–rigid and well connected
Downgrade by 1 class Downgrade by 1 class B Deformable and well connected
C Rigid or semi–rigid and improperly connected
D Deformable and poorly connected
P11: Fragilities and conservation state
This parameter intends to evaluate the weaknesses observed in the structure that may
aggravate damage eventually resulting from the occurrence of an earthquake. The classes
of vulnerability are defined by the severity of structural defects and its origin (an action
can be caused by previous seismic event) that can trigger certain mechanisms more
adversely. Table 4.21 identifies, class by class, problems and defects that increase
substantially the risk of constructions suffer damage, showing in particular the degree of
cracking and degradation of materials: cracks along the corners, detachment of orthogonal
walls, bulging and deformation, signs of crushing, etc.

Seismic vulnerability assessment of slender masonry structures
89
Table 4.21: Definition of the vulnerability classes for parameter P11 [151]
Class Description
A Masonry walls in good condition with no visible damage.
B Walls with small cracks (less than 0.5mm), was not widespread. Signs of moisture problems which
deteriorates the characteristics of the masonry and lead to degradation or decay of wood.
C Walls crack opening of about 2 to 3mm. Structures with a state of poor conservation of masonry
walls. Serious problems of deformability in the structural members.
D
Walls with deterioration and even if not widespread severe cracking. Walls with physical features
and materials that show very poor or severe decrease of resistance. Cracking in locations, such, as
near the corners (signs of disconnection between orthogonal walls). Damage introduced by thrusts
transmitted by the roof, bulging of load–bearing walls, cracking due to settlement of foundations.
Slip wooden framework with respect to the walls of the framework. Decomposition and degradation
of wood along the walls. Signs of rotation and walls out of plumb.
P12: Non–structural elements
This parameter measures the effect of elements that are not part of the structural system,
such as bells, pinnacles, cornices, parapets, balconies or other projecting members that are
attached to the structure (see Figure 4.21). During the seismic event, there connections
with the structure weaken and increase the level of damage in structural elements. The
definition of vulnerability class of this parameter is classified only as classes A, B and C,
as presented in Table 4.22.
(a) (b) (c)
Figure 4.21: Non–structural elements: a) bells on bell towers [21]; b) balcony in minarets [26]; c) pinnacles
in Pagoda temples
Table 4.22: Definition of the vulnerability classes for parameter P12
Class Description
A No hanging or emerging elements such as bells, pinnacles, cornices, parapets, balconies, turrets, etc.
B Structure with hanging or emerging elements well connected to the walls, turrets with reduced size
and weight.
C Structure with hanging or emerging elements poorly connected to the walls, slender turrets with
considerable weight.

Chapter 4. Seismic vulnerability assessment methodology
90
4.4.2 Definition of parameters weight
Parameter weight ( ) is the coefficient multiplying the vulnerability class numeric
value ( ), depending upon its importance, ranging within 0.25 to 1.5. It reflects the
importance of each parameter in the seismic vulnerability of the structure. This coefficient
is assigned taking into account values proposed in the literature for similar methodology,
the opinion of experts and parametric analyses results. To collect information of weight
from expert, a questionnaire survey was carried out. The survey response relatively to the
weight for each parameter obtained from 18 experts (all over the world and precisely
working in similar types of structures), then were tabulated and analysed. Similarly, to
define the weight using parametric analyses, numerous models were constructed and
pushover analyses were carried out (see Table 4.23).
The result corresponding to the worst scenario in terms of maximum global drift and
base shear force for each parameter, in comparison to results for the reference structure is
considered as the upper limit for that parameter (see Figure 4.22). The highest change in
maximum global drift (i.e. nearly 190%) and in base share force (i.e. nearly 98%), among
all the 9 parameters analysed, was divided into three ranges as presented in Table 4.24.
Each range corresponds to the numeric value (weight) of 0.75, 1 and 1.5. For each
parameter the weight corresponding to its maximum changes in global drift or base shear
force was adopted. For all parameters except P2, P3, P6 and P8, the weight is determined
by both criteria (global drift or base shear force) matches. For parameters P2, P3, P6 and
P8, it was adopted the greater weight among the obtained with the both criteria.
The final weight adopted for each parameter was defined after comparing the weight
assigned according to values proposed in the literature, opinion of experts and results of
the parametric analyses done, as shown in Table 4.25. For each parameter, it was adopted
the most coherent weight amongst all source of information except for parameter P1 and
P10. For parameters, P10 (Flooring and roofing system), P11 (Fragilities and conservation
state) and P12 (Non–structural elements), parametric pushover analysis were not carried
out due to wide range of scenarios and difficulties associated in modeling them.

Seismic vulnerability assessment of slender masonry structures
91
Table 4.23: Sensitivity analysis performed and results obtained
Parameter
Strategy adopted for the
sensitivity analysis carried out
with non–linear numerical
analysis by varying
Worst scenario
(corresponding to scenario when
structure can‟t withstand any
lateral load beyond it)
Pushover analysis
results (relatively to
the reference
structure)
Max.
change
in global
drift
Max.
change
in base
shear
force
P1: Type of
resisting
system
Young‟s modulus (E) of
masonry wall section at corner
angles
E value = 30% of the reference
structure‟s E value 16.68% 15.87%
P2: Quality of
the resisting
system
Young‟s modulus (E) of
masonry wall section
E value = 30% of the reference
structure‟s E value 189.74% 11.48%
P3:
Conventional
strength
characteristic shear strength (τ)
capacity of masonry wall
section
τ value = 20kPa 80.27% 97.98%
P4:
Slenderness
ratio
slenderness ratio (height to
breadth ratio,
) of the structure
value = 225% of the
reference structure‟s
value
109.95% 85.43%
P5: Location
and soil
conditions
slope angle of foundation of the
structure foundation slope angle = 40˚ 20.05% 18.39%
P6: Position
and
interaction
different restraining scenarios
with the adjacent building, as
described in section 4.4.1
two sided projecting nature 29.28% 56.01%
P7:
Irregularity in
plan
the results from vulnerability
classes defined in section 4.4.1
were adopted
structure with only one opening
at base and size of two–thirds of
wall breadth
47.18% 44.86%
P8:
Irregularity in
elevation
wall portion above half the
height of structure, un–
supported by base wall and
having thickness of 25% of base
wall
70% 79.17%
P9: Wall
openings
number, size
and location
structure with only one opening
at base and its size of two–
thirds of wall breadth
59.07% 46.27%
Table 4.24: Definition of weights as a function of the results for two criteria (global drift and base shear
force)
Parameter weight
( )
Maximum change in global drift
(%)
Maximum change in base shear force
(%)
0.75 –47.5 to 47.5 0 to –24.5
1.00 –47.5 to –95 or 47.5 to 95 –24.5 to –49
1.50 95 to 190 –49 to –98

Chapter 4. Seismic vulnerability assessment methodology
92
Figure 4.22: Percentage change in max. global drift (left) and base shear force (right)
Table 4.25: Comparison of weight ( ) for vulnerability assessment parameters
Parameter
Parameter weight ( )
Similar methodology
Ex
per
t op
inio
n
Parametric
analysis
Val
ue
ado
pte
d
GN
DT
–S
SN
–1
99
4
[13
1]
Vic
ente
et
al.
[1
65
]
VU
LN
eT [
1]
Co
nsi
der
ing
th
e %
chan
ge
in m
ax.
top
dis
pla
cem
ent
Co
nsi
der
ing
to
%
chan
ge
in m
ax. b
ase
shea
r fo
rce
P1: Type of resisting system 1.00 0.75 1.00 1.41 0.75 0.75 1.00
P2: Quality of the resisting system 0.25 1.00 0.50 1.49 1.50 0.75 1.50
P3: Conventional strength 1.50 1.50 0.80 1.14 1.00 1.50 1.50
P4: Slenderness ratio – – – 1.05 1.50 1.50 1.50
P5: Location and soil conditions 0.75 0.75 0.75 1.00 0.75 0.75 0.75
P6: Position and interaction – 1.50 – 0.64 0.75 1.50 1.50
P7: Irregularity in plan 0.50 0.75 – 1.05 1.00 1.00 1.00
P8: Irregularity in elevation 0.50–
1.00 0.75 1.50 1.27 1.00 1.50 1.50
P9: Wall openings number, size and
location – 0.05 – 0.98 1.00 1.00 1.00
P10: Flooring and roofing system 0.50–
1.00 1.00 0.80 0.86 – – 0.50
P11: Fragilities and conservation state 1.00 1.00 1.00 0.90 – – 1.00
P12: Non–structural elements 0.25 0.50 0.40 0.25 – – 0.25
-95.0
-47.5
0.0
47.5
95.0
142.5
190.0
-1 0 1
Ch
ange
in m
ax.
glo
bal
dri
ft (
%)
Range of variation
P1
P2
P3
P4
P5
P6
P7
P8
P9-98.00
-73.50
-49.00
-24.50
0.00
-1 0 1
Ch
ange
in m
ax.
bas
e sh
ear
forc
e (%
) Range of variation
P1
P2
P3
P4
P5
P6
P7
P8
P9

Seismic vulnerability assessment of slender masonry structures
93
4.5 Implementation of proposed methodology on slender masonry
structures
4.5.1 Vulnerability assessment of slender masonry structures
The proposed vulnerability assessment methodology was implemented on different
types of slender masonry structures. In case of towers, minarets and chimneys the
information collected from literatures was used to assess the vulnerability class for each
parameter.
4.5.1.1 Nepalese Pagoda temples
For the implementation of proposed vulnerability assessment methodology, a field
survey was done and required information was gathered on 78 Nepalese Pagoda temples.
The method proposed here is considered robust, taking into account that the inspection of
all the Pagoda temples was carried out in detail and accurate geometrical information was
available. Therefore, uncertainty in the assignment of vulnerability classes to each
parameter is considered low. Figure 4.23 illustrates the assignment of vulnerability class
for each parameter evaluated in the detailed vulnerability assessment over 78 Pagoda
temples. Further detail vulnerability assessment of Nepalese Pagoda temples is presented
in chapter 5.
The results of vulnerability assessment show the following important characteristics:
(a) Parameter P1 and P5 have a significant influence over the final vulnerability index,
as most of the Pagoda temples are classified as C, i.e. due to lack of tie rods or ring
beams, as well as weak connection between orthogonal walls. Locations of all
Pagoda temples are over soft to medium soil site over plane areas (P5 taken as class
C);
(b) Parameter P2 and P12 have an intermediate influence over the final vulnerability
index, as most of the Pagoda temples are classified as B or C, i.e. due to the
construction of these structures with average to poor quality of brick masonry and
presence of well to poorly connected non–structural elements, such as cornices,
pinnacle etc. respectively;
(c) Parameter P3 and P10 reveal a high influence over the final vulnerability index, as
all of the Pagoda temples are classified as D, i.e. due to minimum shear strength
capacity and flexible roofing structure with thrusting nature respectively;
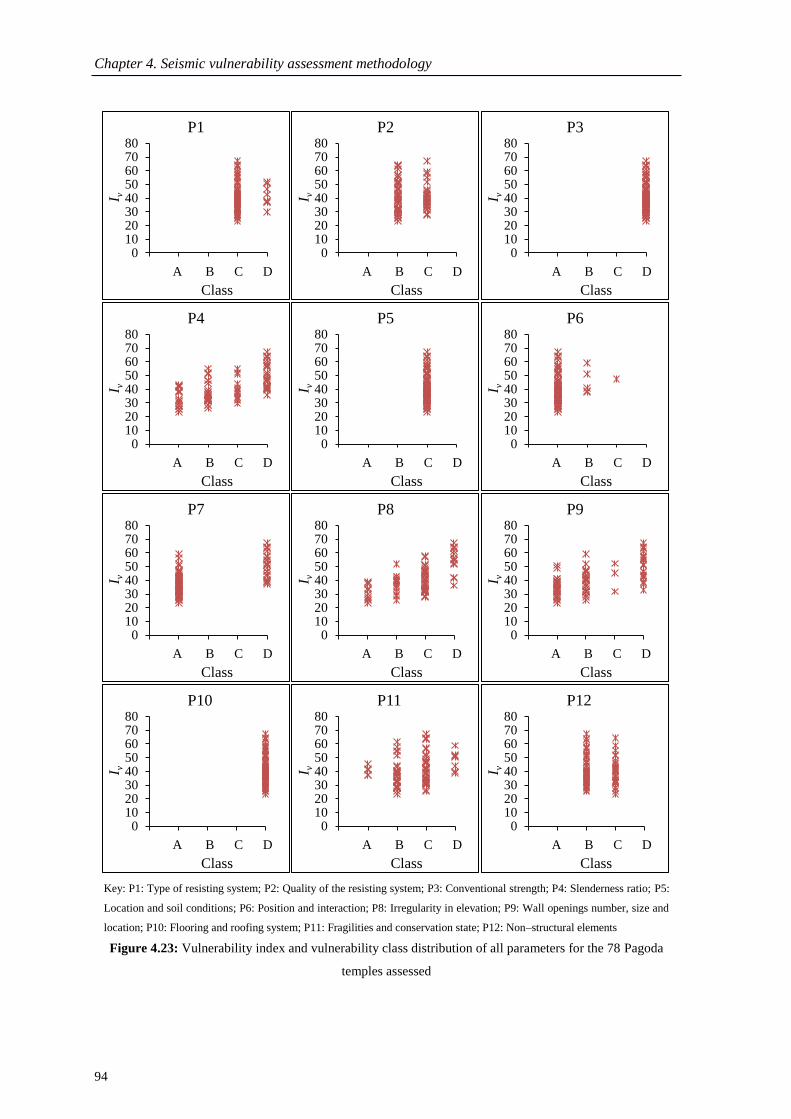
Chapter 4. Seismic vulnerability assessment methodology
94
Key: P1: Type of resisting system; P2: Quality of the resisting system; P3: Conventional strength; P4: Slenderness ratio; P5:
Location and soil conditions; P6: Position and interaction; P8: Irregularity in elevation; P9: Wall openings number, size and
location; P10: Flooring and roofing system; P11: Fragilities and conservation state; P12: Non–structural elements
Figure 4.23: Vulnerability index and vulnerability class distribution of all parameters for the 78 Pagoda
temples assessed
01020304050607080
0 1 2 3 4
I v
Class
P1
A B C D
01020304050607080
0 1 2 3 4
I v
Class
P2
A B C D
01020304050607080
0 1 2 3 4
I v
Class
P3
A B C D
01020304050607080
0 1 2 3 4
I v
Class
P4
A B C D
01020304050607080
0 1 2 3 4
I v
Class
P5
A B C D
01020304050607080
0 1 2 3 4
I v
Class
P6
A B C D
01020304050607080
0 1 2 3 4
I v
Class
P7
A B C D
01020304050607080
0 1 2 3 4
I v
Class
P8
A B C D
01020304050607080
0 1 2 3 4
I v
Class
P9
A B C D
01020304050607080
0 1 2 3 4
I v
Class
P10
A B C D
01020304050607080
0 1 2 3 4
I v
Class
P11
A B C D
01020304050607080
0 1 2 3 4
I v
Class
P12
A B C D

Seismic vulnerability assessment of slender masonry structures
95
(d) Parameter P4 and P8 are well distributed classes A, B, C, and D. Hence, its
influence in final vulnerability index is low to high, i.e. due to variation in
slenderness, wall thickness and presence of turrets among the Pagoda temples;
(e) Parameter P6 has almost no influence over the final vulnerability index, as most of
the Pagoda temples are highly classified as A, with some exceptional cases, i.e. due
to isolated nature of these structures;
(f) Parameter P7 has low to high influence over the final vulnerability index, as most
of the Pagoda temples are classified as A or D, i.e. due to size and number of door.
Pagodas with 1 and 4 doors are of class A and Pagodas with 3 doors are of class D;
(g) Parameter P9 is well distributed classes A, B, and D, with few class C cases.
Hence, its influence over the final vulnerability index goes from low to high, i.e.
due to variation in numbers, size and location of openings;
(h) Parameter P11 has an intermediate influence over the final vulnerability index, as
most of the Pagoda temples are classified as B or C corresponding to reasonable
conservation states (few classified as A and D).
4.5.1.2 Masonry towers
Existing historical masonry towers with different characteristics and functions are
distributed all over the world and constitute a relevant part of the architectural and cultural
heritage of humanity. These important vertical structures were built either isolated or
commonly included in the urban context, part of churches, castles, municipal buildings and
city fortress walls. Bell and clock towers, also named civic towers, were built quite tall
with the important purpose of informing people visually and with sounds by ringing bells
and striking clocks about time and extraordinary events such as civil defence or fire alarm,
and moreover to call the community to social meetings. Another reason that led to the
construction of tall civic towers was that they were seen as a symbol, representing by the
height and architecture sophistication, the richness and power of great families and
communities.
For the implementation of proposed vulnerability assessment methodology, a database
collection of 63 masonry tower structures was constituted through an intense literature
review. Data related with all the information which influences the vulnerability assessing

Chapter 4. Seismic vulnerability assessment methodology
96
parameters was collected, such as, geometric and mechanical characteristics, conservation
state and construction characteristics. The database information regarding geometric
characteristic reveals the total height of the such structures ranges from 16.86m (shortest)
to 112m (tallest) and the width of the wall at base varying from 3m (minimum) to 15.32m
(maximum). Figure 4.24 illustrates the assignment of vulnerability class for each parameter
evaluated in the detailed vulnerability assessment of the 63 towers (bell towers, clock
towers etc.).
The results of vulnerability assessment show the following important characteristics:
(a) Parameter P1 and P5 have a significant influence over the final vulnerability index,
as most of the towers are classified as C, i.e. due to lack of tie rods or ring beams
and weak connection between orthogonal walls in most of evaluated towers.
Insufficient information on soil and location of all towers it was assumed to be in
soft to medium soil site over plane areas (P5 taken as class C);
(b) Parameter P2, P3 and P12 has a low to intermediate influence over the final
vulnerability index, as most of the towers are classified as A, B and C, i.e. due to
construction of these structures with poor to good quality of masonry, variation of
shear strength capacity between low and high and absence or presence of well to
poorly connected non–structural elements, such as bells respectively;
(c) Parameter P4, P6, P8, P10 and P11 are well distributed classes A, B, C, and D.
Hence, its influence over the final vulnerability index is low to high, i.e. due to
variation in slenderness, construction of these structures in all positions, variation in
roofs and floor construction system and conservation state amongst the towers,
respectively;
(d) Parameter P7 has very low influence over the final vulnerability index, as most of
the towers are classified as A, with some exception (i.e. presence of small openings
at base causing low eccentricity between mass and rigidity centers);
(e) Parameter P9 has low influence over the final vulnerability, as most of towers are
classified as A and B (i.e. lesser and small size of openings in most of the towers).

Seismic vulnerability assessment of slender masonry structures
97
Key: P1: Type of resisting system; P2: Quality of the resisting system; P3: Conventional strength; P4: Slenderness ratio; P5:
Location and soil conditions; P6: Position and interaction; P8: Irregularity in elevation; P9: Wall openings number, size and
location; P10: Flooring and roofing system; P11: Fragilities and conservation state; P12: Non–structural elements
Figure 4.24: Vulnerability index and vulnerability class distribution of all parameters for the 63 masonry
towers assessed
0
10
20
30
40
50
0 1 2 3 4
I v
Class
P2
A B C D
0
10
20
30
40
50
0 1 2 3 4
I v
Class
P1
A B C D
0
10
20
30
40
50
0 1 2 3 4
Iv
Class
P3
A B C D
0
10
20
30
40
50
0 1 2 3 4
I v
Class
P4
A B C D
0
10
20
30
40
50
0 1 2 3 4
I v
Class
P5
A B C D
0
10
20
30
40
50
0 1 2 3 4
I v
Class
P6
A B C D
0
10
20
30
40
50
0 1 2 3 4
I v
Class
P7
A B C D
0
10
20
30
40
50
0 1 2 3 4
I v
Class
P8
A B C D
0
10
20
30
40
50
0 1 2 3 4
I v
Class
P9
A B C D
0
10
20
30
40
50
0 1 2 3 4
I v
Class
P11
A B C D
0
10
20
30
40
50
0 1 2 3 4
I v
Class
P10
A B C D
0
10
20
30
40
50
0 1 2 3 4
I v
Class
P12
A B C D

Chapter 4. Seismic vulnerability assessment methodology
98
4.5.1.3 Masonry minarets
Minarets are typical form of Islamic architecture. Minarets are very slender structures,
usually of cylindrical cross–section and they can stand alone or be contiguous and integral
with mosque structures. Minarets were formerly used by the Muezzin to call out the adhan
(ezan) to summon people to the pray [166]. In the present day, minarets are no longer used
for this function due to the use of loudspeakers, but they are still built as one of the most
distinctive components of the mosques. Minarets have become an integral part of Islamic
faith and culture. They are deemed as the lighthouses of faith. Minarets are spread
throughout the Islamic world and constitute an important heritage not only of religious
value, but also great cultural interest.
For the implementation of the proposed vulnerability assessment methodology, a
database collection of 32 minarets was constituted through an intense literature review.
The database information regarding geometric characteristics indicates the total height of
such structures ranges from 11.8m (shortest) to 74.4m (tallest). The vulnerability
assessment of the 32 minarets was carried out by evaluating the information gather from
detail literature reviews on individual minarets. Therefore, uncertainty in the assignment of
vulnerability classes to each parameter is considered low. Figure 4.25 illustrates the
assignment of vulnerability class for each parameter evaluated in the detailed vulnerability
assessment of the32 minarets.
The results of vulnerability assessment show the following important characteristics:
(a) Parameter P1 has a low influence over the final vulnerability index, as most of the
towers are classified as B, i.e. due to cylindrical wall section;
(b) Parameter P2, P3 has a low to intermediate influence over the final vulnerability
index, as most of the minarets are classified as A and B, with few classified as C
(i.e. minarets with poor to good quality of minarets construction and variation of
shear strength capacity between medium to high respectively);
(c) Parameter P4, P6, P8 and P12 are well distributed classes A, B, C, and D. Hence,
its influence over the final vulnerability index is low to high, i.e. due to variation in
slenderness amongst the minarets, construction of these structures in all positions as
defined for each class, variation in wall thickness along height and absence or
presence of well to poorly connected non–structural elements, respectively;

Seismic vulnerability assessment of slender masonry structures
99
Key: P1: Type of resisting system; P2: Quality of the resisting system; P3: Conventional strength; P4: Slenderness ratio; P5:
Location and soil conditions; P6: Position and interaction; P8: Irregularity in elevation; P9: Wall openings number, size and
location; P10: Flooring and roofing system; P11: Fragilities and conservation state; P12: Non–structural elements
Figure 4.25: Vulnerability index and vulnerability class distribution of all parameters for the 32 masonry
minarets assessed
0
5
10
15
20
25
30
35
0 1 2 3 4
I v
Class
P1
A B C D
0
5
10
15
20
25
30
35
0 1 2 3 4
I v
Class
P2
A B C D
0
5
10
15
20
25
30
35
0 1 2 3 4
Iv
Class
P3
A B C D
0
5
10
15
20
25
30
35
0 1 2 3 4
I v
Class
P4
A B C D
0
5
10
15
20
25
30
35
0 1 2 3 4
I v
Class
P5
A B C D
0
5
10
15
20
25
30
35
0 1 2 3 4
I v
Class
P6
A B C D
0
5
10
15
20
25
30
35
0 1 2 3 4
I v
Class
P7
A B C D
0
5
10
15
20
25
30
35
0 1 2 3 4
I v
Class
P8
A B C D
0
5
10
15
20
25
30
35
0 1 2 3 4
I v
Class
P9
A B C D
0
5
10
15
20
25
30
35
0 1 2 3 4
I v
Class
P10
A B C D
0
5
10
15
20
25
30
35
0 1 2 3 4
I v
Class
P11
A B C D
0
5
10
15
20
25
30
35
0 1 2 3 4
I v
Class
P12
A B C D

Chapter 4. Seismic vulnerability assessment methodology
100
(d) Parameter P5 has a significant influence over the final vulnerability index, as all of
the minarets are low classified as C, i.e. due to insufficient information on soil
property in literatures. Hence, location of all minarets is assumed to be in soft to
medium soil site over plane area;
(e) Parameter P7 and P9 has no influence over the final vulnerability index, as most of
the towers are highly classified as A, with some exception, i.e. due to absence or
presence of small openings at base causing no or low eccentricity between mass
and rigidity center and small size of openings in all of the minarets respectively;
(f) Parameter P10 has a significant influence over the final vulnerability index, as all of
the towers are classified as B and C (i.e. roofs construction system are semi–rigid or
flexible with thrusting nature among the minarets);
(g) Parameter P11 has a low to high influence over the final vulnerability index, as all
of the minarets are classified as A, B and C, i.e. due to variation in conservation
state among the minarets.
4.5.1.4 Industrial masonry chimneys
Industrial masonry chimneys began to appear around the middle of the 19th
century
during the industrial evolution. They were of considerable height and usually conical in
shape. Their function was to remove the smoke of combustion from the furnaces required
for industrial processes at that time. Very few of them remain in use, since they became
obsolete when new energy generation systems made their appearance in the 20th
century.
At the present time, many examples of these chimneys can still be found in different parts
of the world. In many cities these chimneys form a characteristic landscape and are often
protected by law as part of the cultural heritage. In places where the original factory has
been swallowed up by urban development, the chimney still survives as a witness to past
times, often forms part of the historical heritage of the local community and may even be
considered an attraction from the point of view of the cultural tourism, as part of industrial
itineraries.
For the implementation of proposed vulnerability assessment methodology, a database
collection of 8 industrial masonry chimney structures was constituted through an intense

Seismic vulnerability assessment of slender masonry structures
101
literature review. Data related with all the information which influences the vulnerability
assessing parameters was collected and assessed. The database information regarding
geometric characteristics indicates the total height of the structures ranges from 8.2m
(shortest) to 45.6m (tallest).The vulnerability assessment of 8 chimneys was carried out by
evaluating the information. Figure 4.26 illustrates the assignment of vulnerability class for
each parameter evaluated in the detailed vulnerability assessment of over minarets.
The results of vulnerability assessment show the following important characteristics:
(a) Parameter P1 has a low influence over the final vulnerability index, all of the
towers are low classified as B (i.e. cylindrical wall section and mostly confined
with metallic ring strip);
(b) Parameter P2, P6, P7, P9, P10 and P12 has an no influence over the final
vulnerability index, as most of the chimneys are classified as A, i.e. due to good
quality masonry construction, isolated constructions, absence or presence of small
openings at base causing no or low eccentricity between mass and rigidity center,
no openings above base, no influence of roof or floor as these structural component
are absence in chimney and absence non–structural elements respectively;
(c) Parameter P3 and P5 has significant influence over the final vulnerability index, as
most of all chimneys are classified as C, i.e. due to intermediate shear strength
capacity and insufficient information on soil conditions. Hence, location of all
chimneys is assumed to be in soft to medium soil site over plane area respectively;
(d) Parameter P4 is well distributed classes B, C, and D. Hence, its influence over final
vulnerability index is low to high (i.e. variation in slenderness ratio amongst the
chimneys);
(e) Parameter P8 and P11 has low to high influence over the final vulnerability index,
as most of the chimney are classified as A or as D, i.e. due to variation in wall
thickness along the height and poor or good conservation state amongst the
chimneys respectively.

Chapter 4. Seismic vulnerability assessment methodology
102
Key: P1: Type of resisting system; P2: Quality of the resisting system; P3: Conventional strength; P4: Slenderness ratio; P5:
Location and soil conditions; P6: Position and interaction; P8: Irregularity in elevation; P9: Wall openings number, size and
location; P10: Flooring and roofing system; P11: Fragilities and conservation state; P12: Non–structural elements
Figure 4.26: Vulnerability index and vulnerability class distribution of all parameters for the 8 industrial
masonry chimneys assessed
0
5
10
15
20
25
30
35
0 1 2 3 4
I v
Class
P1
A B C D
0
5
10
15
20
25
30
35
0 1 2 3 4
I v
Class
P2
A B C D
0
5
10
15
20
25
30
35
0 1 2 3 4
I v
Class
P3
A B C D
0
5
10
15
20
25
30
35
0 1 2 3 4
I v
Class
P4
A B C D
0
5
10
15
20
25
30
35
0 1 2 3 4
I v
Class
P5
A B C D
0
5
10
15
20
25
30
35
0 1 2 3 4
I v
Class
P6
A B C D
0
5
10
15
20
25
30
35
0 1 2 3 4
I v
Class
P7
A B C D
0
5
10
15
20
25
30
35
0 1 2 3 4
I v
Class
P8
A B C D
0
5
10
15
20
25
30
35
0 1 2 3 4
I v
Class
P9
A B C D
0
5
10
15
20
25
30
35
0 1 2 3 4
I v
Class
P10
A B C D
0
5
10
15
20
25
30
35
0 1 2 3 4
I v
Class
P11
A B C D
0
5
10
15
20
25
30
35
0 1 2 3 4
I v
Class
P12
A B C D

Seismic vulnerability assessment of slender masonry structures
103
4.5.2 Vulnerability curves for slender masonry structures
The method proposed here is based on the original GNDT II level approach [131]
although with some significant modifications (as discussed in Section 4.2). However the
„backbone‟ parameters, shared by every vulnerability assessment according to Combescure
et al. [167], are essentially the same. Considering this fact, the similarity in terms of the
definition of the vulnerability index of the two methodologies (original and improved)
enables the use of the same vulnerability functions relating vulnerability to a damage index
[132]. Since this study adopted the analytical vulnerability curves of the Macroseismic
Method [140], it is essential to establish the correspondence between the Macroseismic
Method and the GNDT II level approach.
The former method makes reference to the EMS–98 Macroseismic Scale [142], which
implicitly contains a model of vulnerability. On the basis of the definition of damage
described in the EMS–98 scale [142], it is possible to derive damage probability matrices
for each of the defined vulnerability classes (A to F). Through use of the linguistic
definitions (Few, Many and Most) and their respective numerical interpretation, complete
Damage Probability Matrices (DPM) for every vulnerability class may be obtained. Having
solved the incompleteness using probability theory, the ambiguity and overlap of the
linguistic definitions is then tackled using fuzzy set theory [168], in which upper and lower
boundary limits for the correlation between the macroseismic intensity and mean damage
grade ( ) of the distribution are defined and derived for each building typology and
vulnerability class [142]. Mean damage grade ( ) allow us to know the expected
distribution of the damage level (see Table 4.26), where the damage levels represent a
quantitative interpretation of the consequences caused by the earthquake on the structural
and non–structural elements [169].
Table 4.26: Interpretation of the mean damage grade ( ) [169]
0 1 2 3 4 5
Damage
level No damage
Negligible
damage
Light
damage
Medium
damage
Severe
damage Collapse
For the operational implementation of the methodology, an analytical expression
proposed by Lagomarsino and Podestà [170] for churches and adopted by Curti [21] and
Balbi et al. [171] for tower is adopted. This expression correlates seismic intensity with the

Chapter 4. Seismic vulnerability assessment methodology
104
mean damage grade (0 5) of the damage distribution (discrete beta distribution) in
terms of the vulnerability value, as shown in Eq. ( ).
[ (
)]
where, is the seismic hazard described in terms of macroseismic intensity, the
vulnerability index used in the Macroseismic Method and a ductility factor. The
vulnerability index, , determines the position of the curve, while the ductility factor, ,
determines the slope of the vulnerability function (rate of damage increasing with rising
intensity). In this study a ductility factor of 2 is adopted, a value suggested by Curti [21]
and Balbi et al. [171] for towers.
Figure 4.27 shows the comparison of vulnerability curves plotted for possible upper,
mean and lower values of vulnerability index using the proposed methodology for slender
masonry structures with the vulnerability index values presented by Giovinazzi and
Lagomarsino [140] for EMS–98 building topology. Although, there may be difference
between vulnerability index values between slender masonry structures and building
topologies, it has been adopted due to lack of sufficient vulnerability assessment
information for slender masonry structures. However, the vulnerability index values by
Giovinazzi and Lagomarsino [140], which closely resemble the masonry type of slender
structures have been considered (i.e. unreinforced brick and stone masonry). Moreover, the
mean value adopted here closely resemble with the value presented by Lagomarsino et al.
[169] for towers. However, the mean value is adopted here is slightly lower than the value
presented by Curti [21]. By comparing the two types of vulnerability curve with respect to
a central mean damage value ( = 2.5), the following analytical correlation was derived
between the vulnerability indexes indices of the two methods:
Via this relationship, the vulnerability index, , can be transformed into the
vulnerability index, (used in the Macroseismic Method), enabling the calculation of the
mean damage grade through Eq. ( ) and subsequently the estimation of damage and loss.
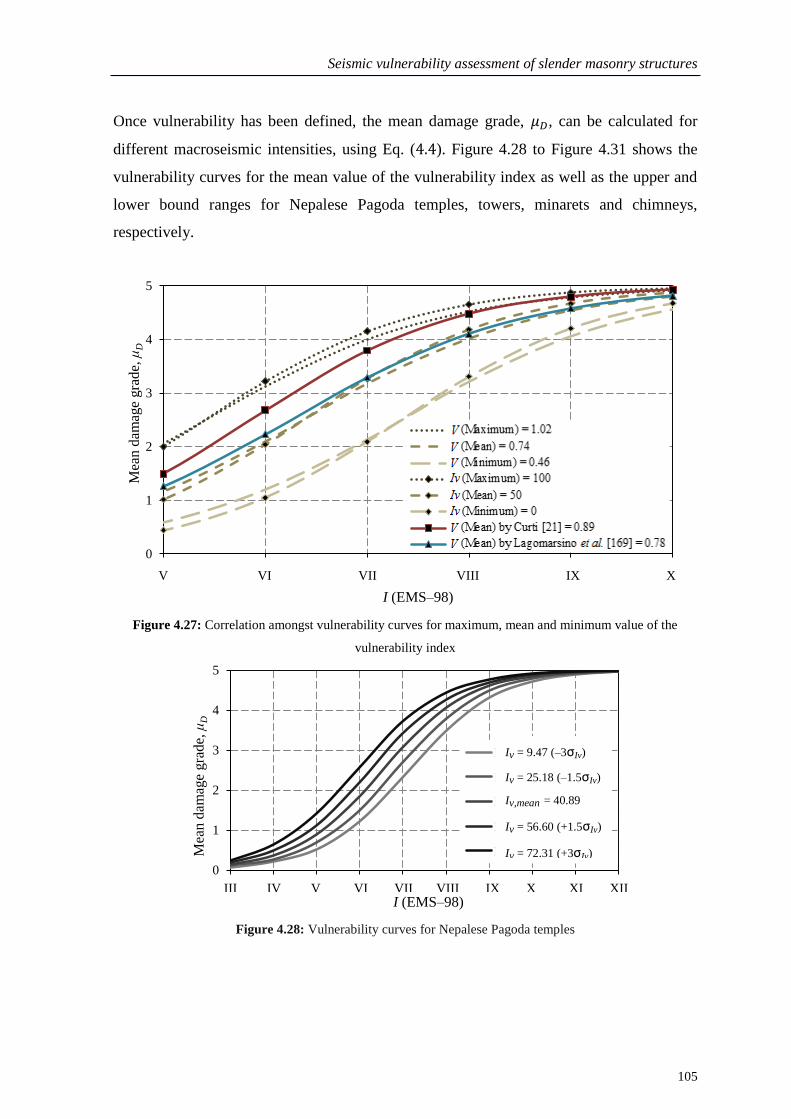
Seismic vulnerability assessment of slender masonry structures
105
Once vulnerability has been defined, the mean damage grade, , can be calculated for
different macroseismic intensities, using Eq. ( ). Figure 4.28 to Figure 4.31 shows the
vulnerability curves for the mean value of the vulnerability index as well as the upper and
lower bound ranges for Nepalese Pagoda temples, towers, minarets and chimneys,
respectively.
Figure 4.27: Correlation amongst vulnerability curves for maximum, mean and minimum value of the
vulnerability index
Figure 4.28: Vulnerability curves for Nepalese Pagoda temples
0
1
2
3
4
5
5 6 7 8 9 10
Mea
n d
amag
e gra
de,
μD
I (EMS–98)
V (Maximum) = 1.02
V (Mean) = 0.74
V (Minimum) = 0.46
Iv (Maximum) = 100
Iv (Mean) = 50
Iv (Minimum) = 0
V (Mean) by Curti [21] = 0.89
V (Mean) by Lagomarsino et al. [169] = 0.78
V VI VII VIII IX X
0
1
2
3
4
5
3 4 5 6 7 8 9 10 11 12
Mea
n d
amag
e gra
de,
μD
I (EMS–98)
Iv=9.47 (-3σIv)
Iv=25.18 (-1.5σIv)
Iv,mean=40.89
Iv=56.60 (+1.5σIv)
Iv=72.31(+3σIv)
III IV V VI VII VIII IX X XI XII
Iv = 9.47 (–3σIv)
Iv = 25.18 (–1.5σIv)
Iv,mean = 40.89
Iv = 56.60 (+1.5σIv)
Iv = 72.31 (+3σIv)

Chapter 4. Seismic vulnerability assessment methodology
106
Figure 4.29: Vulnerability curves for masonry towers
Figure 4.30: Vulnerability curves for masonry minarets
Figure 4.31: Vulnerability curves for industrial masonry chimneys
0
1
2
3
4
5
3 4 5 6 7 8 9 10 11 12
Mea
n d
amag
e gra
de,
μD
I (EMS–98)
Iv=5.50 (-2σIv)
Iv=15.79 (-1σIv)
Iv,mean=26.08
Iv=36.37 (+1σIv)
Iv=45.66(+2σIv)
III IV V VI VII VIII IX X XI XII
0
1
2
3
4
5
3 4 5 6 7 8 9 10 11 12
Mea
n d
amag
e gra
de,
μD
I (EMS–98)
Iv=6.32 (-2σIv)
Iv=13.35 (-1σIv)
Iv,mean=20.37
Iv=27.40 (+1σIv)
Iv=34.42 (+2σIv)
III IV V VI VII VIII IX X XI XII
0
1
2
3
4
5
3 4 5 6 7 8 9 10 11 12
Mea
n d
amag
e gra
de,
μD
I (EMS–98)
Iv=1.44 (-2σIv)
Iv=10.82 (-1σIv)
Iv,mean=20.19
Iv=29.57 (+1σIv)
Iv=38.94 (+2σIv)
III IV V VI VII VIII IX X XI XII
Iv = 1.44 (–2σIv)
Iv = 10.82 (–1σIv)
Iv,mean = 20.19
Iv = 29.57 (+1σIv)
Iv = 38.94 (+2σIv)
Iv = 4.63 (–2σIv)
Iv = 11.83 (–1σIv)
Iv,mean = 19.04
Iv = 26.24 (+1σIv)
Iv = 33.45 (+2σIv)
Iv = 3.95 (–2σIv)
Iv = 13.89 (–1σIv)
Iv,mean = 23.83
Iv = 33.77 (+1σIv)
Iv =43.71 (+2σIv)
Seismic vulnerability assessment of slender masonry structures
107
4.6 Conclusion
This chapter presented and discussed the development of a simplified seismic
vulnerability assessment methodology for slender masonry structures. The vulnerability
assessment method proposed here has been proven to be extremely useful and reliable for
the analysis of slender masonry construction characteristics and as a consequence so are
the results obtained from its use. Integration of this vulnerability assessment technique into
a Macroseismic method has enabled its application for the development of damage and
loss scenarios for risk mitigation and management. The proposed vulnerability assessment
method can easily be adapted for specific building features and adopted for assessment of
any type of slender masonry structure.
Methods of vulnerability assessment based on statistical approaches and damage
observation are more suitable for large scale analysis, essentially for two reasons: they
require less information and fewer resources while the currently available simplified
mechanical models still require experimental testing validation. However, the uncertainties
associated with the empirical vulnerability curves and the quality of vulnerability
classification data are still issues that must be studied further with respect to post–seismic
data collection.

108
109
CHAPTER 5
SEISMIC VULNERABILITY ASSESSMENT: A CASE STUDY
Summary This chapter presents the application of the proposed seismic vulnerability
assessment methodology on 78 Nepalese Pagoda temples as a case study. Finally, in this
chapter damage and vulnerability mapping of the Nepalese Pagoda temple structures along
with loss assessment and proposal of retrofitting strategy for loss mitigation is presented.
Chapter outline
5.1 Introduction
5.2 Historical seismicity in Nepal
5.3 Case study description
5.4 Vulnerability assessment of the Nepalese Pagoda temples
5.4.1 Seismic vulnerability assessment
5.4.2 Physical damage distribution and scenario
5.5 Seismic loss assessment of the Nepalese Pagoda temples
5.5.1 Collapsed and unusable Pagoda temples
5.5.2 Estimation of repair costs
5.6 Seismic vulnerability and loss comparison: Original state and retrofitted
5.6.1 Proposed repair and strengthening interventions
5.6.2 Results of proposed retrofitting actions over in vulnerability assessment and
loss estimation
5.7 Conclusions
5.1 Introduction
The seismic vulnerability assessment of Nepalese Pagoda temples is essential as these
monuments are recognized with high historical and heritage value. Many of these
architectural and culture heritage are listed in UNESCO World heritage. Rigorous
vulnerability assessment of these structures and the implementation of appropriate
retrofitting solutions can help to reduce the levels of physical damage and the economic
impact of future seismic events.
The main purpose of this chapter is to assess the seismic vulnerability of the Nepalese
Pagoda temples. Moreover, this research has contributed to structural vulnerability
identification and damage classification. Within this purpose, firstly, field survey has been
carried out to evaluate the vulnerability assessing parameters of 78 Nepalese Pagoda

Chapter 5. Seismic vulnerability assessment: A case study
110
temples, leading to the development of a database. The seismic vulnerability assessment of
the Nepalese Pagoda temples of the Kathmandu Valley was carried out using a simple
methodology presented in chapter 4. With the methodology adopted, a vulnerability
index, was evaluated for all 78 Pagoda temples. Secondly, the evaluated vulnerability
index, in relationship with seismic intensity was used to estimate the physical damage,
construct fragility curves and estimate losses. Moreover, the results of the vulnerability
assessment and damage classification were integrated into a GIS tool, allowing the spatial
visualation of damage scenarios, which is potentially useful for the planning of retrofitting
priorities to mitigate and manage seismic risk. Seismic vulnerability was mapped
resourcing to ArcGIS 10.2 [172]. Finally, the Pagoda temples were assumed to be
retrofitted for improvement of seismic performance of certain parameters and was
developed a seismic vulnerability comparison study between original and retrofitted
conditions.
5.2 Historical seismicity in Nepal
Nepal is a Himalayan country located in one of the most severe earthquake prone areas
of the world. The Bureau of Crises Prevention and Recovery of the United Nations
Development Program has ranked Nepal as the eleventh most prone location in terms of
earthquakes risk [173]. The Himalaya evolved as a result of the collision between the
Indian and Eurasian plates around 45 to 50 million of years ago. Because of its tectonics,
the Himalaya is one of the active seismic belts of the globe. Some of the devastating
earthquakes in the Himalaya region are listed in Table 5.1, which evidently indicates that
the entire Himalayan belt is one of the zones of significant seismic hazard.
The seismic history of Nepal shows the occurrence of a large devastating earthquake
every 60 to 70 years [174]. Record of past earthquakes show that Nepal registered two
major earthquakes in the last 100 years, i.e. 1934, Bihar–Nepal earthquake (magnitude
8.4), which effected over 200,000 buildings and temples that registered heavy to severe
damage, nearly 81,000 of which were in Eastern Nepal completely destroyed. In
Kathmandu alone, 55,000 buildings were affected, 12,397 of which were completely
destroyed. Similarly, in 1988, Udayapur earthquake (magnitude 6.5), epicenter in the
Southeast of Nepal caused 66,382 buildings to collapse [175]. Figure 5.1 shows the seismic

Seismic vulnerability assessment of slender masonry structures
111
intensity (MMI) distribution map of the Kathmandu Valley during 1934 and 1988
earthquakes.
Table 5.1: Major damaging earthquakes in Himalaya region and essential human casualties [176]
Site Date Magnitude Casualties
Shillong, India June 12, 1897 8.7 1542
Bihar–Nepal border January 1, 1934 8.4 >10,653
Quetta, Pakistan May 30, 1935 7.6 30,000
Assam, India August 15, 1950 8.6 1500
Udayapur, Nepal August 21, 1988 6.5 1000
Uttar Kashi, India October 20, 1991 6.6 >2,000
Chamoli, India March 29, 1999 6.8 >150
Hindukush, India November 11, 1999 6.2 0
Kashmir, Pakistan October 8, 2005 7.6 74,698
Figure 5.1: 1934 Earthquake intensity distribution map: a) 1934 Nepal–Bihar earthquake [177]; b) 1988
Udayapur earthquake [178; 179]
Figure 5.2 shows the estimated slip potential along the Himalaya, where Nepal lies.
Brown shaded areas with dates next to them surround epicenters and zones of rupture of
major past earthquakes in the Himalaya. Red segments along the bars show the slip
potential on a scale of 1 to 10 meters, i.e. the potential slip that has accumulated since the
last recorded great earthquake, or since 1800. The pink portions show possible additional
slip permitted by ignorance of the preceding historic record. The simplified cross–section
of the Himalaya indicates the locked sliding zone between Indian and Tibetan plates.
Vertical movement, horizontal contraction, and micro earthquake seismicity are currently
concentrated between them [180]. Geodetic measurements indicate that if an earthquake
occurred today in the central seismic gap (western Nepal) it could slip by more than 4m,
and probably by more than 6m, and possibly by as much as 10m. These ruptures

Chapter 5. Seismic vulnerability assessment: A case study
112
correspond roughly to M = 7.8, M = 8.0 or M = 8.3 magnitude earthquakes if the slip area
extends 100km (N–S direction) by 300km (E–W direction). It is difficult to estimate how
much casualties and damage will be caused if such earthquake strikes Nepal in present
time.
Figure 5.2: View of the Indo–Asian collision zone [180]
Moreover, JICA [181] has presented seismic intensity (MMI) distribution maps of the
Kathmandu Valley for three anticipated (or scenario) earthquakes models (see Figure 5.3).
These three scenario earthquake models was developed using attenuation formula,
considering the past earthquakes and fault models around the Kathmandu Valley as well as
incorporating the local subsurface amplification.

Seismic vulnerability assessment of slender masonry structures
113
Figure 5.3: Earthquake intensity distribution map of Kathmandu for three anticipated earthquakes models
[181]
5.3 Case study description
Vulnerability assessment was carried out in 78 Nepalese Pagoda temples. These Pagoda
temples were located in three different cities of Kathmandu Valley, Nepal (Kathmandu,
Lalitpur and Bhaktapur), as shown in map (Figure 5.4). Although, Pagoda temples were
surveyed in three different cities, most of Pagoda temples were found similar to each other
in many ways, such as: there construction procedure, material used for construction and the
period of construction.
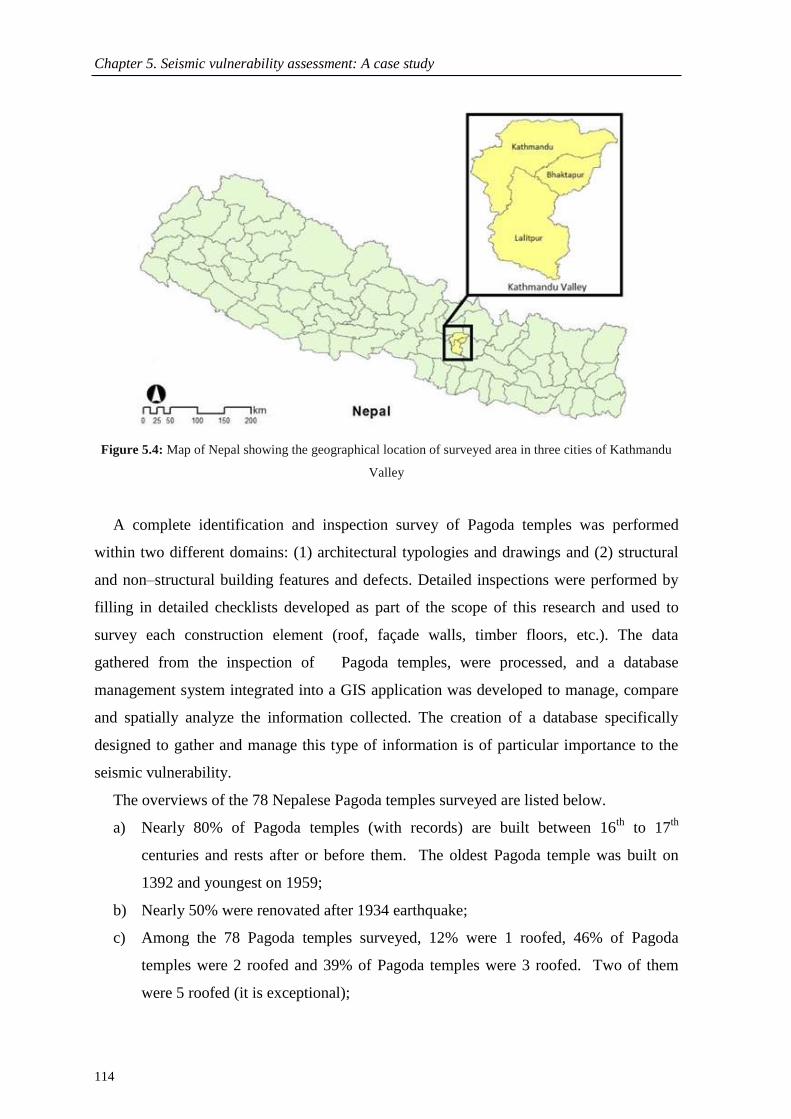
Chapter 5. Seismic vulnerability assessment: A case study
114
Figure 5.4: Map of Nepal showing the geographical location of surveyed area in three cities of Kathmandu
Valley
A complete identification and inspection survey of Pagoda temples was performed
within two different domains: (1) architectural typologies and drawings and (2) structural
and non–structural building features and defects. Detailed inspections were performed by
filling in detailed checklists developed as part of the scope of this research and used to
survey each construction element (roof, façade walls, timber floors, etc.). The data
gathered from the inspection of Pagoda temples, were processed, and a database
management system integrated into a GIS application was developed to manage, compare
and spatially analyze the information collected. The creation of a database specifically
designed to gather and manage this type of information is of particular importance to the
seismic vulnerability.
The overviews of the 78 Nepalese Pagoda temples surveyed are listed below.
a) Nearly 80% of Pagoda temples (with records) are built between 16th
to 17th
centuries and rests after or before them. The oldest Pagoda temple was built on
1392 and youngest on 1959;
b) Nearly 50% were renovated after 1934 earthquake;
c) Among the 78 Pagoda temples surveyed, 12% were 1 roofed, 46% of Pagoda
temples were 2 roofed and 39% of Pagoda temples were 3 roofed. Two of them
were 5 roofed (it is exceptional);
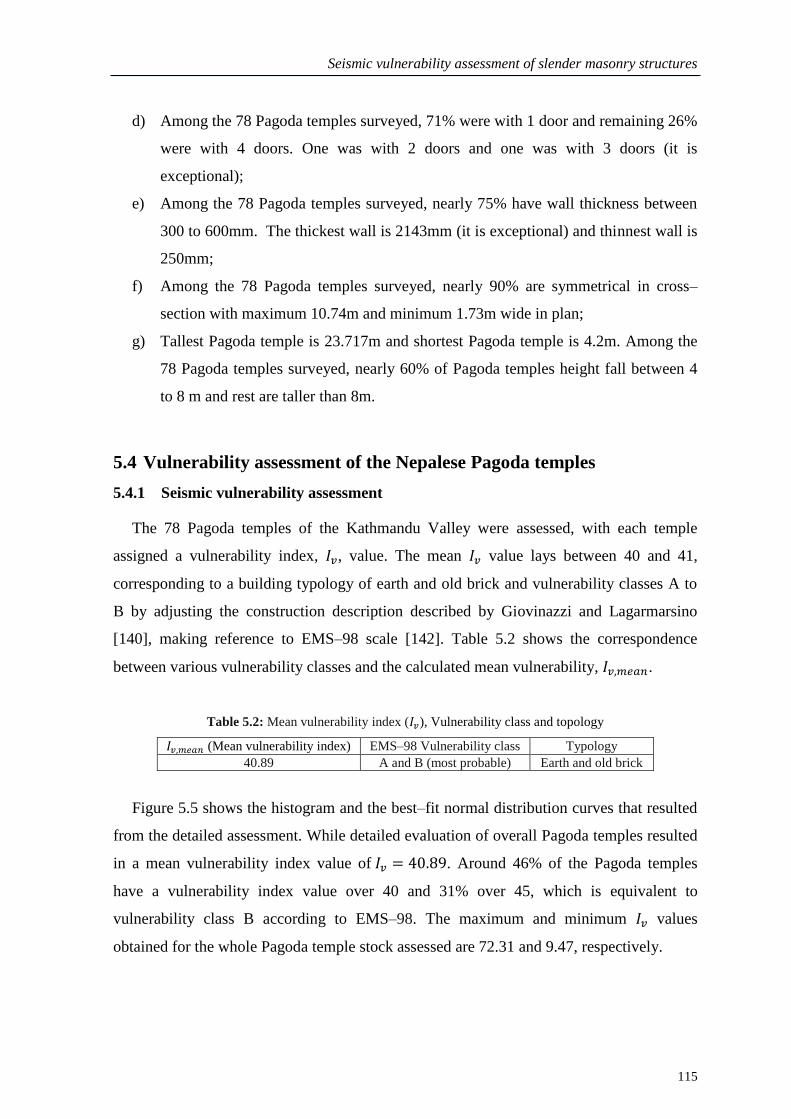
Seismic vulnerability assessment of slender masonry structures
115
d) Among the 78 Pagoda temples surveyed, 71% were with 1 door and remaining 26%
were with 4 doors. One was with 2 doors and one was with 3 doors (it is
exceptional);
e) Among the 78 Pagoda temples surveyed, nearly 75% have wall thickness between
300 to 600mm. The thickest wall is 2143mm (it is exceptional) and thinnest wall is
250mm;
f) Among the 78 Pagoda temples surveyed, nearly 90% are symmetrical in cross–
section with maximum 10.74m and minimum 1.73m wide in plan;
g) Tallest Pagoda temple is 23.717m and shortest Pagoda temple is 4.2m. Among the
78 Pagoda temples surveyed, nearly 60% of Pagoda temples height fall between 4
to 8 m and rest are taller than 8m.
5.4 Vulnerability assessment of the Nepalese Pagoda temples
5.4.1 Seismic vulnerability assessment
The 78 Pagoda temples of the Kathmandu Valley were assessed, with each temple
assigned a vulnerability index, , value. The mean value lays between 40 and 41,
corresponding to a building typology of earth and old brick and vulnerability classes A to
B by adjusting the construction description described by Giovinazzi and Lagarmarsino
[140], making reference to EMS–98 scale [142]. Table 5.2 shows the correspondence
between various vulnerability classes and the calculated mean vulnerability, .
Table 5.2: Mean vulnerability index ( ), Vulnerability class and topology
(Mean vulnerability index) EMS–98 Vulnerability class Typology
40.89 A and B (most probable) Earth and old brick
Figure 5.5 shows the histogram and the best–fit normal distribution curves that resulted
from the detailed assessment. While detailed evaluation of overall Pagoda temples resulted
in a mean vulnerability index value of . Around 46% of the Pagoda temples
have a vulnerability index value over 40 and 31% over 45, which is equivalent to
vulnerability class B according to EMS–98. The maximum and minimum values
obtained for the whole Pagoda temple stock assessed are 72.31 and 9.47, respectively.

Chapter 5. Seismic vulnerability assessment: A case study
116
Figure 5.5: Vulnerability index distributions: a) Histogram; b) Best fit normal distributions
Figure 5.6 shows the variation of vulnerability index with respect to slenderness ratio
which is evaluated as effective height to minimum radius of gyration and height to breadth
ratio and also with respect to height of Pagoda temple. Result shows that vulnerability of
the Nepalese Pagoda temples increases with the increase in slenderness ratio.
Approximately, it can be interpreted that Pagoda temples with high slenderness ratio are
more vulnerable than the Pagoda temples with low slenderness ratio. However, there are
many other parameters which influence the final vulnerability index of Pagoda temple
structure. Similarly, results also show that the vulnerability of the Pagoda temples is not a
function of height, which means that the increase or decrease in the height of Pagoda
temples should not be interpreted as the increase or decrease in vulnerability of the Pagoda
temple structures.
0
5
10
15
20
25P
ago
da
tem
pel
s (%
)
Iv (a)
0
5
10
15
20
25
0 10 20 30 40 50 60 70 80 90 100
Pag
oda
tem
pel
s (%
)
Iv (b)

Seismic vulnerability assessment of slender masonry structures
117
Figure 5.6: Vulnerability index distributions w.r.t.: a) Slenderness ratio; b) Height/Breadth ratio; c) Height
Figure 5.7 shows the spatial distribution of Pagoda temples. The construction of seismic
vulnerability scenarios using a spatial analysis tool can provide georeferenced information
and integrate the entire probabilistic algorithm into the generation of different intensity
defined risk scenarios [182]. Hence, such seismic vulnerability maps enable the
identification of more vulnerable Pagoda temples and their location, which can be very
useful for the planning of protection strategies.
0
10
20
30
40
50
60
70
80
0 5 10 15 20 25 30 35 40
I v
Slenderness ratio (λ) (a)
0
10
20
30
40
50
60
70
80
0 1 2 3 4 5 6
I v
Height/Breadth (H/B)
0
10
20
30
40
50
60
70
80
0 5 10 15 20 25
I v
Height (m) (c)
(b)

Chapter 5. Seismic vulnerability assessment: A case study
118
Figure 5.7: Vulnerability distribution map for Nepalese Pagoda temples of three different cities at
Kathmandu Valley: a) Lalitpur; b) Kathmandu; c) Bhaktapur

Seismic vulnerability assessment of slender masonry structures
119
5.4.2 Physical damage distribution and scenario
From mean damage grade values, , different damage distribution histograms for
events of varying seismic intensity and their respective vulnerability index values can be
defined, using a probabilistic approach. The idea is to complete the EMS–98 model
introducing a proper discrete probability distribution of damage grade. The most
commonly applied methods are based on the binomial probability mass function and the
beta probability density function and moreover, the damage distribution of masonry
buildings appears to quite well [183]. The probability mass function (PMF) of binomial
distribution is expressed in Eq. ( ).
(
)
(
)
The mean damage grade, , given by the Macroseismic Method represents the mean
damage value that is used to define a discrete damage distribution and is expressed by Eq.
( ). It ranges from 0 to 5 and is the barycentric value of the discrete damage distribution.
∑
where, is the probability of attaining a damage grade , with .
In this work the damage distribution adopted was fitted to a beta distribution function.
Research carried out by Giovinazzi [168] has shown that the beta distribution is the most
versatile, as by controlling the shape of the distribution, it enables the fitting of both very
narrow and broad damage distributions. This continuous beta probability density function
(PDF) is expressed as Eq. ( ).
where, , , and are the parameters of the distribution and is the gamma function.

Chapter 5. Seismic vulnerability assessment: A case study
120
As a function of the same parameters the mean value of the continuous variable ,
which ranges between and and its variance are related to and as expressed in Eq.
( ) and Eq. ( ).
(
)
Parameters and control the shape of the distribution. In this study, the unique value
for parameter is adopted as proposed by Giovinazzi [168] for unreinforced old brick
masonry building topology, where . In order to use the beta distribution, it is
necessary to reference damage grade, defined in Table 5.3.
Table 5.3: Interpretation of damage grade, [168]
0 1 2 3 4 5
Damage level No damage Slight Moderate Heavy Very heavy Destruction
Assuming, , and , it is possible to calculate the probability associated to
each damage grade, with , using following equations.
∫
∫
∫
The mean damage grade, , is obtained as a function of the vulnerability index ( ) and
intensity ( ), as expressed in Eq. ( ), while the variance of the distributions is defined
using the previously assumed value of 5 for parameter . Figure 5.8 presents examples of
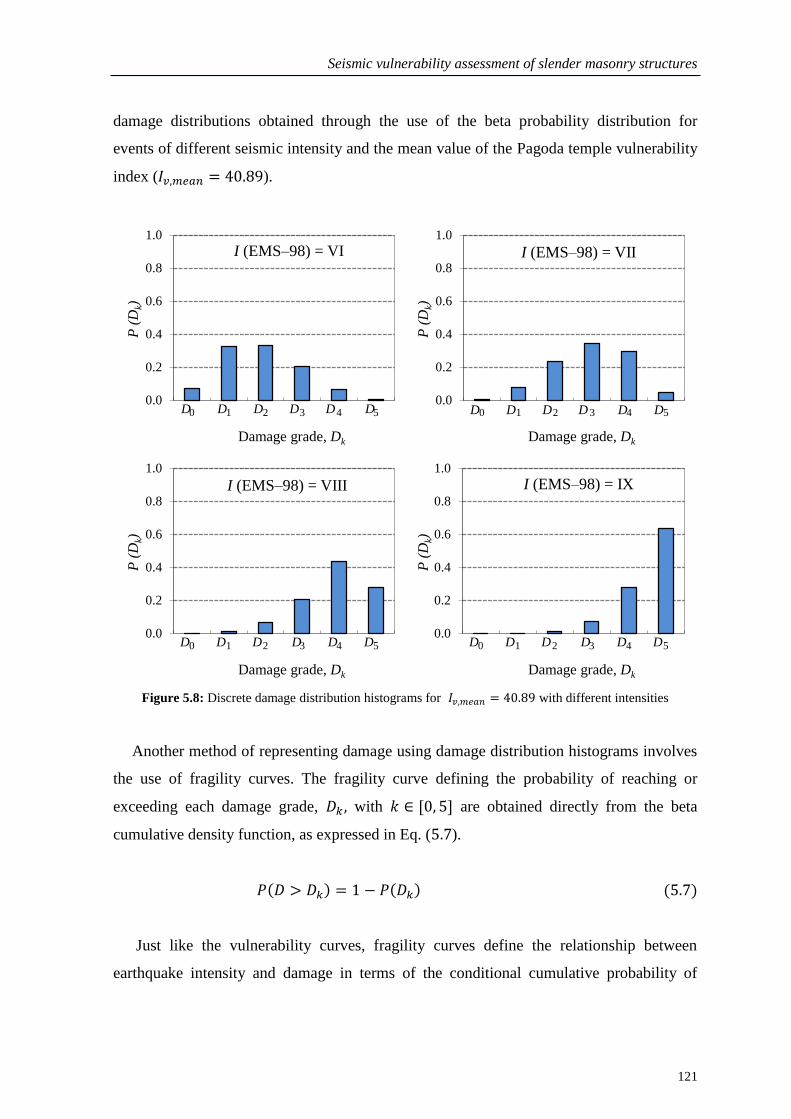
Seismic vulnerability assessment of slender masonry structures
121
damage distributions obtained through the use of the beta probability distribution for
events of different seismic intensity and the mean value of the Pagoda temple vulnerability
index ( ).
Figure 5.8: Discrete damage distribution histograms for with different intensities
Another method of representing damage using damage distribution histograms involves
the use of fragility curves. The fragility curve defining the probability of reaching or
exceeding each damage grade, with are obtained directly from the beta
cumulative density function, as expressed in Eq. ( ).
Just like the vulnerability curves, fragility curves define the relationship between
earthquake intensity and damage in terms of the conditional cumulative probability of
0.0
0.2
0.4
0.6
0.8
1.0
0 1 2 3 4 5
P (
Dk)
Damage grade, Dk
I (EMS–98) = VI
D D D D D D 0.0
0.2
0.4
0.6
0.8
1.0
0 1 2 3 4 5P
(D
k)
Damage grade, Dk
I (EMS–98) = VII
D D D D D D
0.0
0.2
0.4
0.6
0.8
1.0
0 1 2 3 4 5
P (
Dk)
Damage grade, Dk
I (EMS–98) = VIII
D D D D D D 0.0
0.2
0.4
0.6
0.8
1.0
0 1 2 3 4 5
P (
Dk)
Damage grade, Dk
I (EMS–98) = IX
D D D D D D

Chapter 5. Seismic vulnerability assessment: A case study
122
reaching a certain damage state. Fragility curves are influenced by the parameters of the
beta distribution function and allow the estimation of damage as a continuous probability
function. Figure 5.9 shows fragility curves corresponding to the damage distribution
histograms of the mean vulnerability index value as well as for
.
Figure 5.9: Fragility curves for different values of : a) b)
Figure 5.10 and Figure 5.11 present the damage scenarios using GIS, combining Pagoda
temples vulnerability and seismic hazard data for earthquake intensities of VI and IX
respectively. These two seismic scenarios correspond to the strongest historically
earthquake ever experienced in the Kathmandu valley (in 1988 and 1934 respectively).
Damage estimation ranges from 1.47 to 2.45 for the earthquake scenario using (EMS–98)
= VI and from 4.46 to 4.75 for (EMS–98) = IX.
Figure 5.12 and Figure 5.13 present the damage scenarios mean damage grade
assessment, combining Pagoda temples vulnerability and seismic hazard data for
earthquake intensities of VII and VIII. These two seismic scenarios correspond to the
possible strongest anticipated earthquake in the Kathmandu valley [181]. Damage
estimation ranges from 2.65 to 3.62 for the earthquake scenario using (EMS–98) = VII
and from 3.77 to 4.38 for (EMS–98) = VIII.
0.0
0.2
0.4
0.6
0.8
1.0
5 6 7 8 9 10 11 12
P (
D>
Dk)
I (EMS–98)
D1
D2
D3
D4
D5
V VI VII VIII IX X XI XII
(a)
0.0
0.2
0.4
0.6
0.8
1.0
5 6 7 8 9 10 11 12
P (
D>
Dk)
I (EMS–98)
D1
D2
D3
D4
D5
V VI VII VIII IX X XI XII
(b)
D1
D2
D3
D4
D5
D1
D2
D3
D4
D5
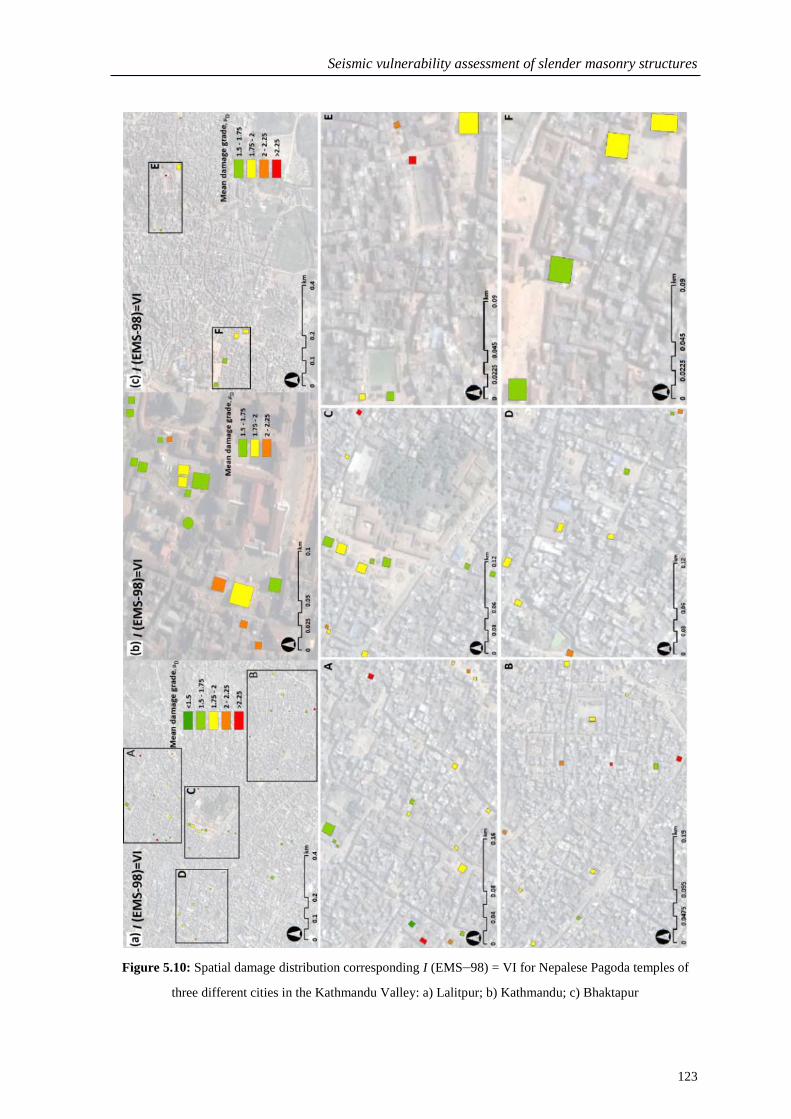
Seismic vulnerability assessment of slender masonry structures
123
Figure 5.10: Spatial damage distribution corresponding I (EMS–98) = VI for Nepalese Pagoda temples of
three different cities in the Kathmandu Valley: a) Lalitpur; b) Kathmandu; c) Bhaktapur
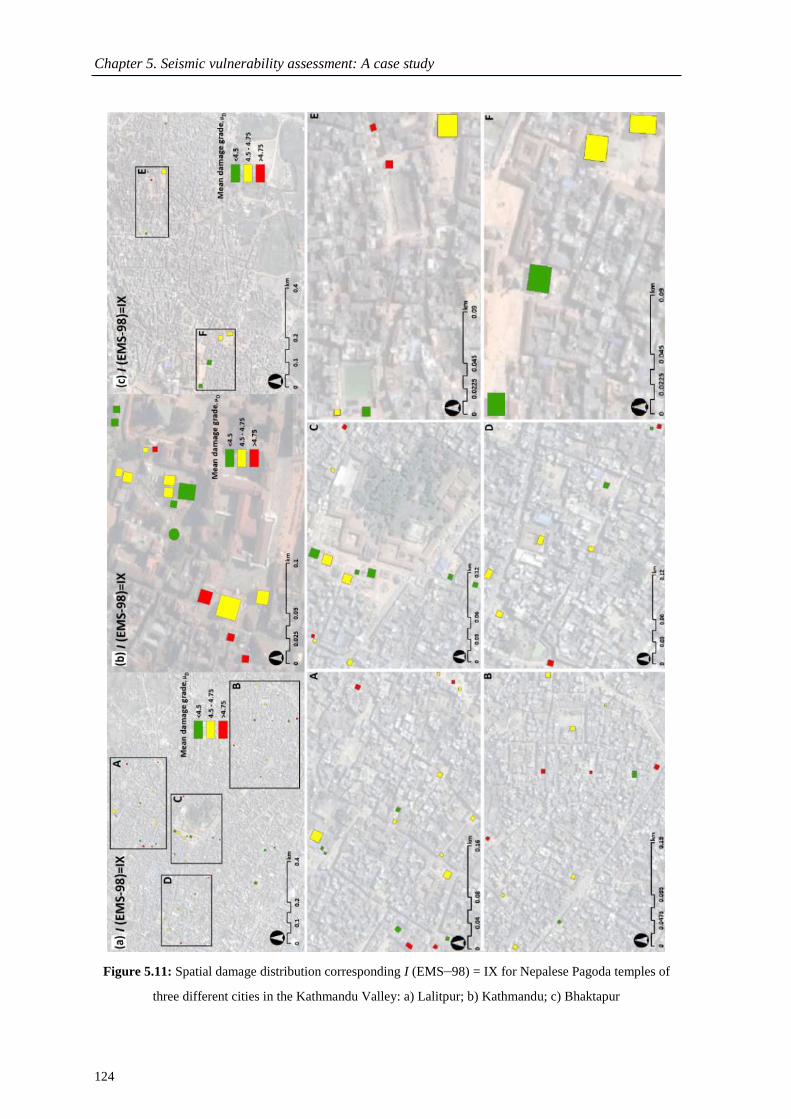
Chapter 5. Seismic vulnerability assessment: A case study
124
Figure 5.11: Spatial damage distribution corresponding I (EMS–98) = IX for Nepalese Pagoda temples of
three different cities in the Kathmandu Valley: a) Lalitpur; b) Kathmandu; c) Bhaktapur

Seismic vulnerability assessment of slender masonry structures
125
5.5 Seismic loss assessment of the Nepalese Pagoda temples
5.5.1 Collapsed and unusable Pagoda temples
Nepal felt a major earthquake in 1934, photographic evidence shows that a vast number
of monuments were infected, but due to the lack of research in this field, there is no loss
estimation model for Nepalese Pagoda temple. Hence, the loss estimation model adopted in
this research is based on damage grades that relate the probability of exceeding a certain
damage level with the probability of collapse and functional loss. Among the existing
approaches based on observed damage data, the one adopted in this work has been
proposed by the Italian National Seismic Survey, based on the work of Bramerini et al.
[184]. This approach involves the analysis of data associated with the probability of
unusable buildings to minor and moderate earthquakes that produce lower levels of
structural and non–structural damage and higher mean damage values that are associated to
the probability of collapse [185]. In Italy, data processing undertaken by Bramerini et al.
[184] has enabled the establishment of these weighted factors and respective expressions
for their use in the estimation of losses. Eq. ( ) and Eq. ( ) were used for the analysis
of collapsed and unusable Pagoda temples respectively.
where, is the probability of the occurrence of a certain level of damage ( to
) and are weights indicating the percentage of buildings associated with
the damage level , that are considered unusable or have suffered collapse respectively.
For the analysis of Nepalese Pagoda temples the following weights were applied:
; .
Figures 5.12 and 5.13 presents the probability of collapse and unusable Pagoda temples
for the mean value of the vulnerability index, and for other characteristic
values of the vulnerability index ( ; ; ;
), respectively. It is important to note that the number of unusable Pagoda
temples decrease with the intensity, as the number of Pagoda temples that suffered collapse

Chapter 5. Seismic vulnerability assessment: A case study
126
increased. The overall results for moderate to strong–intensity seismic events, considering
macroseismic intensities of VI to X on the EMS–98 scale, and for the mean value of the
estimated vulnerability obtained for the 78 Pagoda temples evaluated in the cities of
Kathmandu Valley are listed in Table 5.4.
Figure 5.12: Probability of collapsed Pagoda temples for different vulnerability index values
Figure 5.13: Probability of unusable Pagoda temples for different vulnerability index values
0.0
0.2
0.4
0.6
0.8
1.0
5 6 7 8 9 10 11 12
PC
oll
ap
se
I (EMS–98)
Iv=9.47 (-3σIv)
Iv=25.18 (-1.5σIv)
Iv,mean=40.89
Iv=56.60 (+1.5σIv)
Iv=72.31(+3σIv)
V VI VII VIII IX X XI XII
0.0
0.2
0.4
0.6
0.8
1.0
5 6 7 8 9 10 11 12
PU
nu
sab
le
I (EMS–98)
Iv=9.47 (-3σIv)
Iv=25.18 (-1.5σIv)
Iv,mean=40.89
Iv=56.60 (+1.5σIv)
Iv=72.31(+3σIv)
V VI VII VIII IX X XI XII
Iv = 9.47 (–3σIv)
Iv = 25.18 (–1.5σIv)
Iv,mean = 40.89
Iv = 56.60 (+1.5σIv)
Iv = 72.31 (+3σIv)
Iv = 9.47 (–3σIv)
Iv = 25.18 (–1.5σIv)
Iv,mean = 40.89
Iv = 56.60 (+1.5σIv)
Iv = 72.31 (+3σIv)

Seismic vulnerability assessment of slender masonry structures
127
Table 5.4: Estimation of the number of collapsed and unusable Pagoda temples
Pagoda temples (78) Intensity, (EMS–98)
VI VII VIII IX X
Collapsed Pagoda temples 0 (0%) 4 (5%) 22 (28%) 50 (64%) 67 (85%)
Unusable Pagoda temples 6(7%) 21 (26%) 29 (38%) 19 (24%) 8 (11%)
5.5.2 Estimation of repair costs
The estimated damage grade can be interpreted either economically or as an economic
damage index that represents the ratio between the repair costs and the replacement costs
(i.e. building value) [132]. The correlation between damage grades and the
repair/rebuilding costs can be obtained by the processing and analysis of post–earthquake
damage data [186]. The correlation adopted in this work has been established by Dolce et
al. [186]. The statistical values obtained by these authors are derived from analysis of the
data collected, using the GNDT–SSN–1994 [131] procedure, after the 1997 Umbria–
Marche and 1998 Pollino earthquakes and are based on the estimated cost of typical repair
actions for more than 50,000 buildings [165].
The repair cost probabilities for a certain seismic event characterized by an
intensity , , can be obtained from the product of the conditional probability of the
repair cost for each damage level, , with the conditional probability of the damage
condition for each level of building vulnerability and seismic intensity, , given
by Eq. (5.10).
∑ ∑
To estimate the repair costs associated with the different vulnerability values used in the
loss evaluation ( ; ), an average repair cost value per
unit area of 7000 $/m2 was considered for the Nepalese Pagoda temple according to KVPT
[119].
Figure 5.14 shows the estimated global costs of repair for the entire study of 78 Pagoda
temples. Based on observation of Figure 5.14, it should be stressed that for intensities
within the range of V to VIII, the difference between the minimum and maximum repair
costs estimated for the vulnerability scenarios under consideration is quite significant. This

Chapter 5. Seismic vulnerability assessment: A case study
128
difference is much smaller for higher earthquake intensities due to the high damage levels
caused by severe seismic events.
Figure 5.14: Estimation of repair costs
5.6 Seismic vulnerability and loss comparison: Original state and
retrofitted
5.6.1 Proposed repair and strengthening interventions
Proper restoration of cultural heritage must focus on preserving the original features of
the structure. If repair or strengthening actions are needed, they should cause the minimum
possible alteration. Compatibility, durability and reversibility are the fundamental features
recommended in the literature to be taken into account when strengthening cultural valued
heritage buildings. Presently, there is a broad of techniques and materials available for the
protection of historical constructions. Among them, two main techniques are distinguished,
the rehabilitation or restoration and the retrofitting. The rehabilitation or restoration works
aim to use materials of similar characteristics of original construction and to mainly apply
the same construction techniques, in order to locally correct the damage of certain
structural elements, e.g. sealing of cracks and reposition of mortar and masonry units. In
general terms, the objective of these works is to preserve the construction in good
conditions, mainly to withstand the vertical loading generated by self–weight. On the other
hand, the structural retrofitting resourcing to modern techniques and in addition of
0
2
4
6
8
10
12
1 2 3 4 5 6 7 8
Rep
air
cost
(m
illi
on
s o
f $
)
I (EMS–98)
Iv=9.47 (-3σIv)
Iv,mean=40.89
Iv=72.31(+3σIv)
V VI VII VIII IX X XI XII
Iv = 9.47 (–3σIv)
Iv,mean = 40.89
Iv = 72.31 (+3σIv)
Seismic vulnerability assessment of slender masonry structures
129
advanced materials in order to mainly improve the seismic performance of the buildings,
by increasing its ultimate lateral load capacity (strength), ductility and energy dissipation.
Dismantling and reassembling or substituting is the current trend of restoration
procedure followed in Nepalese Pagoda temples. This consists on the complete dismantling
of an element or a structure to repair, extract or substitute part of the components, and then
rebuilding it accurately according the original organization and shape. The purpose is to
recover the functionality of a structure while maintaining its historical and cultural value.
In order to improve the structural behaviour of the Nepalese Pagoda temples, a series of
repair and strengthening techniques are proposed to be executed both at a local and global
level. Some remarks regarding the basic design choices and the selection of the most
appropriate materials and techniques for the restoration of the Nepalese Pagoda temples are
presented in this section.
Following are some proposed retrofitting actions for seismic vulnerability reduction of
the Nepalese Pagoda temples:
a) The observations of masonry buildings when subjected to earthquakes have shown
that the structural behaviour is strongly dependent on how the walls are
interconnected and anchored to floors and roofs. Hence, tie beam (timber or RC)
and metallic tie rods on several sections along the height of the temples prove to be
efficient intervention strategy for improving the connectivity between walls.
Furthermore, the wooden structures (roofs and floors) can be anchored by metal
elements nailed on the beams and restrained to the wall;
b) Deep repointing is a widely applied technique in all types of masonry. This
operation involves the partial replacement of the mortar joints with better quality
mortar, in order to improve the masonry mechanical characteristics, and it should
be applied in the case of localized deterioration of the mortar joint. This method
can increase the masonry resistance for vertical and horizontal loads, but the best
results are obtained especially in terms of deformation, which are also greatly
reduced due to the confinement effect of the joints;
c) The application of the reinforced repointing technique diffused on various portions
of the walls to counteract the creep damage, and concentrated on some pilaster
strips to strengthen the corners. Adequate durability of the reinforcement

Chapter 5. Seismic vulnerability assessment: A case study
130
(especially when using metals), as well as adequate mechanical connection, require
the placement of the bars at sufficient depth within the bed joint;
d) Injection of fluid mortar or other adequate repair materials through cracks or holes
previously drilled. The purpose is to fill cracks, existing cavities and internal voids.
Injection improves the continuity of masonry and contributes to enhance the
average mechanical properties of masonry. Injection should only be carried out
using injected materials with proven compatibility with the original masonry fabric;
e) Crack stitching is another repair work that can be done in Nepalese Pagoda
temples. In general, crack stitching is locally joining two independent wall sections,
which can rock or overturn about their base. However, the effectiveness of the
crack stitching in terms of restoring structural continuity or uniform load
distribution of horizontal loads on a wall is related to the diffusion of the
intervention, since force transfer is limited to the points where the stitches are
introduced;
f) Metallic plates and diagonals can be used in roofs and floors to reduce their
flexibility and ensure effective horizontal diaphragm behaviour (mobilizing a
global response of the walls equitably);
g) Seismic improvement of Nepalese Pagoda temples can be carried out by
strengthening the traditional timber peg joinery between different timber members
with bolt and steel plate. These interventions obviously aid in low intensity
earthquakes, but what happens in larger quakes still is to be study;
h) It is also important to improve the connectivity of non–structural elements (e.g.
pinnacle, cornices, tympanum etc.) with the structural members. Since, its improper
connection can increase the level of damage during earthquake.
5.6.2 Results of proposed retrofitting actions over vulnerability assessment and loss
estimation
The Pagoda temples are assumed to be retrofitted with the proposed retrofitting
techniques referred section 5.6.1, in order to carry out the comparison study between
original and retrofitted conditions. Although, effectiveness of retrofitting depends on
various inherent factors, such as: quality, quantity, techniques etc. In this comparison, the
level of seismic vulnerability reduction is assessed in terms of vulnerability index ( ),

Seismic vulnerability assessment of slender masonry structures
131
damage grades ( ), damages probability ( ) and repair costs for different seismic
intensities ( ).
The improvement in seismic behaviour of Nepalese Pagoda temples is assumed in this
study by upgrading the vulnerability class of six vulnerability parameters. The six
vulnerability parameters are: P1 (Type of resisting system), P2 (Quality of the resisting
system), P3 (Conventional strength), P10 (Flooring and roofing system), P11 (Fragilities
and conservation state) and P12 (Non–structural elements) are selected for upgrading and it
was assumed that they are upgraded by one vulnerability class (i.e. B to A, C to B and D to
C) reflecting retrofitting measure discussed before. The seismic performance of the
structural system defined by these selected parameters can be easily improved by applying
the retrofitting strategy explained in section 5.6.1, where as it is not easy or possible in
case of the remaining six other vulnerability parameters (i.e. P4 (Slenderness ratio), P5
(Location and soil conditions), P6 (Position and interaction), P7 (Irregularity in plan), P8
(Irregularity in elevation) and P9 (Number, size and location of wall openings)).
Figure 5.15 shows the comparison of histogram and the best–fit normal distribution
curves that resulted from the detailed assessment of original and retrofitted Pagoda
temples. After upgrading the six parameters by one vulnerability class of overall Pagoda
temples, it resulted in a mean vulnerability index value of , which corresponds
to a 39% reduction. Originally, around 46% of the Pagoda temples have a vulnerability
index value of over 40, and 31% over 45 (equivalent to vulnerability class B according to
EMS–98) which will be reduced to 11% and 5% respectively, after retrofitting.
Figure 5.15: Comparison of histogram and the best–fit normal distribution curves
0
5
10
15
20
25
30
Pag
od
a te
mp
les
(%)
Iv
Retrofitted
Orginal
0
5
10
15
20
25
0 10 20 30 40 50 60 70 80 90 100
Pag
od
a te
mp
les
(%)
Iv
Retrofitted
Original

Chapter 5. Seismic vulnerability assessment: A case study
132
Figure 5.16 shows the comparison of damage distributions obtained through the use of
the beta probability function for events of different seismic intensity and the mean values
of the Pagoda temples vulnerability index ( and
). Results show that, if the Nepalese Pagoda temples are
retrofitted as proposed than there will be an important reduction of the damage probability
of higher damage grades ( ).
Figure 5.16: Comparison of discrete damage distribution histograms for and
with different intensities
Figure 5.17 shows the comparison of the fragility curves corresponding to the damage
distribution histograms of the mean vulnerability index values (
and ). Fragility curves show that, if the Pagoda temples are
retrofitted as proposed than there will be significant reduction in probability of exceeding
each damage grade in comparison to original state.
0.0
0.2
0.4
0.6
0.8
1.0
0 1 2 3 4 5
P (
Dk)
Damage grade, Dk
I (EMS–98) = VI Retrofitted
Original
D D D D D D 0.0
0.2
0.4
0.6
0.8
1.0
0 1 2 3 4 5
P (
Dk)
Damage grade, Dk
I (EMS–98) = VII Retrofitted
Original
D D D D D D
0.0
0.2
0.4
0.6
0.8
1.0
0 1 2 3 4 5
P (
Dk)
Damage grade, Dk
I (EMS–98) = VIII Retrofitted
Original
D D D D D D 0.0
0.2
0.4
0.6
0.8
1.0
0 1 2 3 4 5
P (
Dk)
Damage grade, Dk
I (EMS–98) = IX Retrofitted
Original
D D D D D D

Seismic vulnerability assessment of slender masonry structures
133
Figure 5.17: Comparison of Fragility curves for and
Figure 5.18 and Figure 5.19 shows the comparison of probability of Pagoda temples
collapse and unusable Pagoda temples for the mean values of the vulnerability index,
and , respectively. The results
regarding percentage reduction in the probability of retrofitted Pagoda temples to collapse
and unusable in comparison to original condition for the mean values of vulnerability
index ( and ) are listed in Table
5.5. It is important to note that the percentage of unusable Pagoda temples increases with
intensity (for intensities IX and X) as compared to original unusable Pagoda temples, as
the percentage of Pagoda temples that suffer collapse decrease.
Table 5.5: Estimation of the reduction of collapsed and unusable Pagoda temples after retrofitting actions
Total Pagoda temples (78) Intensity, (EMS–98)
VI VII VIII IX X
Reduction of collapsed Pagoda temples 0% 3% 10% 11% 4%
Reduction of unusable Pagoda temples 3% 6% 1% 5% 3%
0.0
0.2
0.4
0.6
0.8
1.0
5 6 7 8 9 10 11 12
P (
D>
Dk)
I (EMS–98)
D1 (Retrofitted)
D2 (Retrofitted)
D3 (Retrofitted)
D4 (Retrofitted)
D5 (Retrofitted)
D1 (Original)
D2 (Original)
D3 (Original)
D4 (Original)
D5 (Original)
V VI VII VIII IX X XI XII
D1 (Retrofitted)
D2 (Retrofitted)
D3 (Retrofitted)
D4 (Retrofitted)
D5 (Retrofitted)
D1 (Original)
D2 (Original)
D3 (Original)
D4 (Original)
D5 (Original)

Chapter 5. Seismic vulnerability assessment: A case study
134
Figure 5.18: Comparison of probability of collapse Pagoda temples for and
Figure 5.19: Comparison of probability of unusable Pagoda temples for and
Figure 5.20 shows the comparison of the estimated global costs of repair for the mean
values of the vulnerability index, and
, within the intensities range of V to VIII. The results show that if the Nepalese
Pagoda temples are retrofitted as proposed than there will be decrease in repair costs of
0.0
0.2
0.4
0.6
0.8
1.0
5 6 7 8 9 10 11 12
Pco
lla
pse
I (EMS–98)
Iv,mean (Retrofitted)=24.92
Iv,mean (Original)=40.89
V VI VII VIII IX X XI XII
0.0
0.2
0.4
0.6
0.8
1.0
5 6 7 8 9 10 11 12
Pu
nu
sab
le
I (EMS–98)
Iv,mean (Retrofitted)=24.92
Iv,mean (Original)=40.89
V VI VII VIII IX X XI XII
Iv,mean (Retrofitted) = 24.92
Iv,mean (Original) = 40.89
Iv,mean (Retrofitted) = 24.92
Iv,mean (Original) = 40.89

Seismic vulnerability assessment of slender masonry structures
135
minimum (0.2 million dollars) to maximum (0.8 million dollars), within the intensities
range of V to VIII, as compared to original repair costs. For I (EMS–98) = VII, maximum
difference in repair cost of 0.8 million dollars is estimated amongst the other earthquake
intensities. Here, the repair cost of 4 million dollars is reduced to 3.2 million dollars.
Nevertheless, significant reduction in repair cost highly depends upon the effectiveness of
retrofitting. For example, if the vulnerability class of six parameters described above were
upgraded by two classes instead of one class, which means more effective retrofitting, than
the reduction in repair cost would be more significant, i.e. minimum of 0.2 million dollars
to maximum of 1.2 million dollars, within the intensities range of V to VIII. In this case,
for I (EMS–98) = VII, maximum difference of 1.2 million dollars is estimated. Moreover,
not much significant reduction in repair cost is seen for earthquake intensities greater than
VIII due to the high damage levels caused by severe seismic events.
Figure 5.20: Comparison of repair cost for and
5.7 Conclusions
The seismic vulnerability assessment methodology adapted in this case study is
specially developed for slender masonry structures, like Nepalese Pagoda temples.
However, the uncertainties associated with the empirical vulnerability curves and the
quality of vulnerability classification data are still issues that must be studied further with
respect to post–seismic data collection to obtain even more reliable results. Correlation of
0
1
2
3
4
5
6
7
8
1 2 3 4
Rep
air
cost
(m
illi
ons
of
$)
I (EMS–98)
Iv,mean
(Retrofitted)=24.92Iv,mean (Original)=40.89
V VI VII VIII
Iv,mean (Retrofitted) = 24.92
Iv,mean (Original) = 40.89

Chapter 5. Seismic vulnerability assessment: A case study
136
this vulnerability assessment methodology with the Macroseismic method has enabled the
development of damage and loss scenarios for seismic risk reduction and management.
Analysis of the deterministic scenarios of damage and loss created in this study allow for
the verification of these scenarios‟ relationship with the identified structural fragilities and
construction features of Nepalese Pagoda temples.
The application of a GIS tool in this study has enabled the storage of Pagoda temples
features and survey information, assessment of seismic vulnerability and damage scenario
construction at a large scale. These features, which provide the possibility of spatial result
presentation, make GIS an effective tool in the support of mitigation strategies and
management of seismic risk.
The cities of Kathmandu Valley are located in a high seismic hazard region; hence, the
level of damage associated with moderate to high seismic events is considerable. The level
of damage estimated for these Pagoda temples is an indicator of their low resistance to
seismic actions, and the moderate to high values of damage and loss obtained for
intensities VI and IX are a consequence of these Pagoda temples‟ high vulnerability.
Therefore, interventions focusing on the improvement of seismic performance and
conservation of cultural heritage, assisted by materials‟ characterization and mechanical
modelling, are required for seismic risk reduction. Moreover, the comparative study
presented in the last section of this chapter has shown the impact and importance of
retrofitting actions in seismic risk reduction and cost effectiveness. More precisely
considering the same earthquake intensities, the comparative study shows a reduction in
repair cost for 78 Nepalese Pagoda temples studied by 0.8 to 1.2 million dollars after
retrofitting.
In conclusion, a rigorous vulnerability assessment and the implementation of
appropriated retrofitting solutions can significantly reduce physical damage and economic
losses from future seismic events. In this sense, studies based on macroseismic approaches
play an important role in the seismic vulnerability assessment of a cultural heritage in
seismic prone regions. This research enables the development of a framework for a
comprehensive database and guidance tool for local authorities responsible for
rehabilitation and restoration of Nepalese Pagoda temples.
137
CHAPTER 6
SYNOPSIS AND FUTURE RESEARCH
Summary This final chapter presents a summary and conclusions of the most relevant
comments highlighted in the previous chapters as well as some work for future research is
discussed.
Chapter outline
6.1 Summary 6.2 Conclusions and futures research
6.1 Summary
Existing historical slender masonry structures with different characteristics and
functions are distributed all over the world and constitute a relevant part of the
architectural and cultural heritage of humanity. The cultural importance of these structures
poses the problem for their safeguarding and preservation. Unfortunately, several historical
constructions suffered partial or total collapse in the course of time due to earthquakes,
fatigue, deterioration, soil movements, etc. These losses are simply not economically
quantifiable, neither lives nor cultural heritage can be reinstated by post–earthquake
reconstruction plans. Their protection is a topic of great concern among the scientific
community. This concern mainly arises from the observed damages after every strong
earthquake and the need and interest to preserve them. Although the recent progress in
technology, seismology and earthquake engineering, the preservation of these brittle and
massive monuments still represent a major challenge. Since the seismic hazard is
unavoidable and is not in our hands to reduce or modify it, therefore efforts are to be made
for reducing the structural vulnerability by the implementation of seismic strengthening
strategies. Before carrying out a multi–disciplinary seismic strengthening strategy
approach it requires an intensive seismic vulnerability assessment. At present, a number of
studies are available in the technical literature dealing with numerical and experimental
analyses of slender masonry structures. However, there is no sufficient research work

Chapter 6. Synopsis and future research
138
carried out on developing the relevant seismic vulnerability assessment tools for such
structures at a wider scale.
In the present research work, a simplified methodology for vulnerability assessment of
slender masonry structures is proposed. This methodology estimates the seismic
vulnerability index for the structure. The evaluated vulnerability index can then be used to
estimate structural damage in respect to a specified intensity of a seismic event. Firstly, the
research was carried out with intensive literature review. The objective of this literature
review was to identify major parameter influencing the vulnerability of slender masonry
structures. The knowledge of dynamic properties, together with local site seismicity and
stratigraphy, is the starting point for an accurate estimation of the seismic safety of such
structures. Hence, the parameter influencing the dynamic properties, precisely fundamental
frequency of the structures was to be identified. Comparative analysis between
experimental fundamental frequency and predictive fundamental frequency was carried out
to develop empirical formulas capable of predicting reliable fundamental frequency for
slender masonry structures.
Secondly, Sensitivity analysis was carried out over Nepalese Pagoda temples, which
was specially considered for case study among different types of slender masonry
structures. Three different Nepalese Pagoda temples were selected for parametric analysis.
These three Pagoda temples were analytically modelled and one was calibrated using
ambient vibration test results and following the same procedure for the remaining. In order
to study the change of the fundamental frequency of the three selected temple structures,
due to variation in the stiffness simulating in a simple manner, damage or degradation of
vulnerable members, a number of parametric analyses were carried out. Stiffness variation
is carried out to simulate damage or degradation of timber or masonry elements. Damage
or degradation of members was simulated, by reducing the Young‟s modulus of elasticity
(E value) of different members. Linear elastic parametric analyses were carried out to
study the decrease in global stiffness of the temple structures. These results were revealed
in terms of change in fundamental frequency of temple structures.
Finally, a simplified methodology for seismic vulnerability assessment of slender
masonry structures is proposed. This method is based on vulnerability index formulation
proposed on the GNDT II level approach, for the vulnerability assessment of residential
masonry buildings. In this approach, the overall vulnerability is calculated as the weighted

Seismic vulnerability assessment of slender masonry structures
139
sum of 12 parameters used in the formulation of the seismic vulnerability index. The
definition of each parameter class and weight is proposed taking into account values
proposed in the literature for similar methodology, the opinion of experts and parametric
analyses results.
Furthermore, this research work devoted to assess the seismic vulnerability of the
Nepalese Pagoda temples as a case study. Within this purpose, firstly, field survey has
been carried out to evaluate the vulnerability assessing parameters of 78 Nepalese Pagoda
temples, leading to the development of a database. The seismic vulnerability assessment of
the Nepalese Pagoda temples of the Kathmandu Valley was carried out using the proposed
methodology. With the methodology adopted, a vulnerability index, was evaluated for
all 78 Pagoda temples. Secondly, the evaluated vulnerability index, in relationship with
seismic intensity was used to estimate the physical damage, construct fragility curves and
estimate losses. Moreover, the results of the vulnerability assessment and damage
classification were integrated into a GIS tool, allowing the spatial visualation of damage
scenarios, which is potentially useful for the planning of retrofitting priorities to mitigate
and manage seismic risk. Finally, the Pagoda temples were assumed to be retrofitted for
improvement of seismic performance of certain parameters and was developed a seismic
vulnerability comparison between the original and retrofitted conditions.
6.2 Conclusions and future research
In this thesis the proposal of a seismic vulnerability assessment method has been
addressed with the main objective of their implementation in the framework of a seismic
vulnerability assessment, in order to draw damage and consequence scenarios for risk
reduction and risk management purposes.
The research carried out in these years permitted to identify the most important aspects
that determine the vulnerability of slender masonry structures under earthquake ground
motion. A deep understanding of these aspects was the basis towards the development of a
vulnerability assessment methodology, which corresponds to the main objective of this
thesis. It is concluded in the initial stage of this research that fundamental frequency, one
of the important dynamic properties which defines seismic behaviour of slender masonry
structures, is significantly influenced by its geometric characteristics. Moreover four

Chapter 6. Synopsis and future research
140
empirical formulas are proposed for efficient and reliable evaluation of the fundamental
frequency of such structures.
The results of parametric analysis carried out on the three Nepalese Pagoda temples
chosen as representative show that the masonry wall structure (which represents 70–80%
of total mass of temple) as the most vulnerable structural component to be safeguarded
from damages and conserved. More precisely, damage or degradation to one–third of the
height of the base storey masonry wall and masonry wall corners is fundamental in the
reduction of stiffness of the temple structures. The results reveal no effect of the timber
strut and floor damage in the overall stiffness of the temple structures. In summary, it is
concluded that more local modeling is needed to understand the local behaviour of timber
components and structural vulnerability and should be carried out in future research work.
The seismic analyses were developed on the Nepalese Pagoda temples by assuming the
materials of structural components as a homogeneous, isotropic and linearly elastic model
due to the material model´s limitation and to simplify the simulations. However, most of
the Nepalese Pagoda temples have been built with complex materials, therefore further
intensive research is recommended on the mechanical experimental campaigns. In all the
cases the Nepalese Pagoda temples were assumed as fixed disregarding the actual state of
the foundation and soil. Even when the soil–structure interaction has been a topic of
intensive research in this decade, so less could be found in literature about these types of
ancient masonry structures, being an interesting topic for further research.
The seismic vulnerability assessment method proposed here has been proven to be
extremely useful and reliable for the analysis of slender masonry construction
characteristics and as a consequence so are the results obtained from its use. Integration of
this vulnerability assessment technique into a Macroseismic method has enabled its
application for the development of damage and loss scenarios for risk mitigation and
management. The proposed vulnerability assessment method can easily be adapted for
specific building features and adopted for assessment of any type of slender masonry
structure. Methods of vulnerability assessment based on statistical approaches and damage
observation are far more suitable for large scale analysis, essentially for two reasons: they
require less information and fewer resources while the currently available simplified
mechanical models still require experimental testing validation. However, the uncertainties
associated with the empirical vulnerability curves and the quality of vulnerability

Seismic vulnerability assessment of slender masonry structures
141
classification data are still issues that must be studied further with respect to post–seismic
data collection.
The level of damage estimated for these Pagoda temples is an indicator of their low
resistance to seismic action, and the moderate to high values of damage and loss obtained
for intensities VI to IX are a consequence of these Pagoda temples‟ high vulnerability.
Therefore, interventions focusing on the improvement of seismic performance and
conservation of cultural heritage, assisted by materials‟ characterization and mechanical
modeling, are required for seismic risk reduction. Moreover, the comparative study
presented in chapter 5 has shown the impact and importance of retrofitting in seismic risk
reduction. However, future research is recommended to carry out a performance based design
philosophy to find a simple device which is able to successfully reduce the seismic risk of
these structures as well as maintain the cultural and technological value.
In correspondence with this methodology, the application of GIS tools and database
management system in the future enables the storage of building features and survey
information, assessment of seismic vulnerability and damage and risk scenario prediction,
as well as allowing the upgrading and improvement of data. This integrated tool can be
helpful for the development of strengthening strategies, cost–benefit analyses, civil
protection and emergency planning.
In conclusion, a rigorous vulnerability assessment and the implementation of
appropriated retrofitting solutions can significantly reduce physical damage and economic
losses from future seismic events. In this sense, studies based on macroseismic approaches
may play an important role in the seismic vulnerability assessment of cultural heritage in
seismic–prone regions. It is believed that this research could enable the development of a
framework for a comprehensive database and guidance tool for local authorities
responsible for rehabilitation and restoration of Nepalese Pagoda temples.

142

143
REFERENCES
[1] Sepe V, Speranza E, Viskovic A, A method for large–scale vulnerability assessment
of historic towers. J. Struct. Ctrl. Health Monit. 2008; 15:389–415.
[2] Casolo S, Milani G, Uva G, Alessandri C, Comparative seismic vulnerability
analysis on ten masonry towers in the coastal Po Valley in Italy. J. Eng. Struct.
2012; 49:465–90.
[3] Salvatore W, Bennti S, Maggiora MD, On the collapse of masonry tower subjected
to Earthquake loadings. Earthquake Resistant Engineering Structures IV 2003,
ISSN: 1743–3509, doi: 10.2495/ER030141.
[4] Modena C, Valluzzi MR, Folli RT, Binda L, Design choices and intervention
techniques for repairing and strengthening of the Monza cathedral bell–tower. J.
Constr. Build. Mater. 2002; 16:385–95.
[5] Binda L, Gatti G, Mangano G, Poggi C, Landriani GS, The Collapse of the Civic
Tower of Pavia: a Survey of the Materials and Structure. Masonry International
1992; 11–20.
[6] Casolo S, Pena F, Dynamics of slender masonry towers considering hysteretic
behaviour and damage. In: Proceedings of the ECCOMAS Thematic Conference on
Computational Methods in Structural Dynamics and Earthquake Engineering, June
13–16, Rethymno, Crete, Greece, 2007.
[7] Pineda P, Robador MD, Gil–Martí1 MA, Seismic Damage Propagation Prediction in
Ancient Masonry Structures: an Application in the Non–Linear Range Via
Numerical Models. The Open Construction and Building Technology Journal 2011;
5 (Suppl 1–M4):71–9.
[8] Abruzzese D, Miccoli L, Vari A, Ferraioli M, Mandara A, Froncillo S, Dynamic
investigation of medieval masonry towers: Seismic resistance and strengthening
techniques. In: Proceedings of the international conference on protection of
historical buildings (PROHITEC), Rome, 2009.
[9] D‟Ambrisi A, Mariani V, Mezzi M, Seismic assessment of a historical masonry
tower with nonlinear static and dynamic analysis tuned on ambient vibration tests.
J. Eng. Struct. 2012; 36:210–19.

References
144
[10] Lermitte SJ, Fournely E, Lamadon T, Juraszek N, Learning from the post–
earthquake mission following the L‟Aquila earthquake. Bull. Soc. Geol. France.
2011; 182(4):381–8.
[11] Ferraioli M, Mandara A, Abruzzese D, Miccoli L, Dynamic identification and
seismic safety of masonry bell towers. In: Proceedings of the 14th
conference of
Associazione Nazionale Italiana di Ingegneria Sismica (ANIDIS), September 18–22,
Bari, Italy, 2011.
[12] Rainieri C, Fabbrocin G, Predictive correlations for the estimation of the elastic
period of masonry towers. In: Proceedings of the Experimental Vibration Analysis
for Civil Engineering Structures EVACES, October 3–5, Varenna, Italy, 2011, pp.
513–20.
[13] Bartoli G, Betti M, Giordano S, In situ static and dynamic investigations on the
„„Torre Grossa‟‟ masonry tower. J. Eng. Struct. 2013; 52:718–33.
[14] Pekgökgöz RK, Gürel MA, Mammadov Z, Çili F, Dynamic Analysis of Vertically
Post–Tensioned Masonry Minarets. J. Earthq. Eng. 2013, 17:560–89.
[15] Lopes V, Guedes JM, Paupério E, Arêde A, Costa A, Ambient vibration testing and
seismic analysis of a masonry chimney, Palgrave Macmillan 1742–8262. J. Build.
Appr. 2009; 5 (2):101–21.
[16] Russo G, Bergamo O, Damiani L, Lugato D, Experimental analysis of the ``Saint
Andrea'' Masonry Bell Tower in Venice. A new method for the determination of
Tower Global Young's Modulus E''. J. Eng. Struct. 2010; 32:353–60.
[17] Corradi M, Borri A, Vignoli A, Strengthening techniques tested on masonry
structures struck by the Umbrian–Marche earthquake of 1997–1998. J. Const. Build.
Mater. 2002; 16(4):229–39.
[18] Buffarini G, Clemente P, Cimellaro GP, De Stefano A, Experimental dynamic
analysis of Palazzo Margherita in L'Aquila after the April 6th
, 2009. In: Proceedings
of the Earthquake. Experimental Vibration Analysis for Civil Engineering Structures,
EVACES, October 3–5, Varenna, Italy, 2011, pp. 247–54.
[19] Curti E, Lagomarsino S, Podestà S, Dynamic models for the seismic analysis of
ancient bell towers. In: Proceedings of the 5th
Structural analysis of historical
constructions (SAHC), 6–8 November, New Delhi, India, 2006, ISBN 972–8692–27–
7.

Seismic vulnerability assessment of slender masonry structures
145
[20] Milani G, Russo S, PizzolatoM, Tralli A, Seismic Behaviour of the San Pietro di
Coppito Church Bell Tower in L‟Aquila, Italy. The Open Civil Engineering Journal,
2012; 6(Suppl 1–M3):131–47.
[21] Curti E, Vulnerabiltà sismica delle Torri Campanarie: modelli meccanici e
macrosismici. PhD Thesis, Dipartimento di Ingegneria delle Costruzioni, Università
degli Studi di genova, dell‟Ambiente e del Territorio, 2007. (In Italian)
[22] Dogangun A, Acar R, Sezen H, Livaoglu R, Investigation of dynamic response of
minaret structures. Bull. Earthq.Eng. 2008; 6:505–17, doi: 10.1007/s10518–008–
9066–5.
[23] Lamei S, Destruction of Sacral and Profane Buildings in Historic Cairo, CHWB
cultural heritage without border. Seminar Earthquake protection in historical
buildings, Kotar, September 2005.
[24] Curti E, Parodi S, Podesta S, Simplified models for seismic vulnerability analysis of
bell towers. In: Proceedings of the 6th
International Conference on Structural
Analysis of Historical Constructions (SAHC), July 2–4, Bath, UK, 2008.
[25] Firat YG, A study of the structure response of minarets in 1999 Anatolian
earthquakes. MSc Thesis, Purdue University, 2001.
[26] Oliveira CS, Cakti E, Stengel D and Branco M, Minaret behaviour under earthquake
loading: The case of historical Istanbul. J. Earthq. Eng. Struct. Dyn. 2012; 41:19–39.
[27] Anzani A, Garavaglia E, Binda L, Long–term damage of Historic Masonry: a
probabilistic model. J. Constr. Build. Mater. 2009; 23:713–24.
[28] Bennati S, Nardini L, Salvatore W, Dynamic behaviour of a Medieval Masonry Bell
Tower. II: measurement and modeling of the tower motion. J. Struct. Eng. 2005;
131:1656–64.
[29] Binda L, Zanzi L, Lualdi M, Condoleo P, The use of georadar to assess damage to a
Masonry bell tower in Cremona, Italy. J. NDT & E Int. 2005; 38:171–79.
[30] Bonato P, Ceravolo R, De Stefano A, Molinari F, Cross–time frequency techniques
for the identification of Masonry buildings. J. Mech. Syst. Signal Process. 2000;
14:91–109.
[31] Carpinteri A, Lacidogna G, Damage evaluation of Three Masonry towers by
acoustic emission. J. Eng. Struct. 2007; 29:1569–79.
References
146
[32] Gentile C, Saisi A, Ambient vibration testing of Historic Masonry towers for
structural identification and damage assessment. J. Constr. Build. Mater. 2007;
21:1311–21.
[33] Giannini R, Pagnoni T, Pinto PE, Vanzi I, Risk analysis of a medieval tower before
and after strengthening. J. Struct. Safety 1996; 18:81–100.
[34] Lucchesi M, Pintucchi B, A numerical model for non–linear dynamic analysis of
Slender Masonry structures. Eur. J. Mech. A/Solids 2007; 26:88–105.
[35] Reale E, Paguni C, Floridia S, Static and dynamic analysis of S. Peter tower in
Modica, Ragusa, Sicily. Lourenço PB & Roca P (eds.) Historical Constructions
2001: Possibilities of Numerical and Experimental Techniques, pp. 887–96.
University of Minho, Guimarães, Portugal, 2001.
http://www.civil.uminho.pt/masonry/.
[36] Riva P, Perotti F, Guidoboni E, Boschi E, Seismic analysis of the Asinelli tower and
earthquakes in Bologna. J. Soil Dyn. Earthq. Eng. 1998; 17:525–50.
[37] Valluzzi MR, On the vulnerability of Historical Masonry structures: analysis and
mitigation. J. Mater. Struct. 2007; 4:723–43.
[38] Ivorra S, Pallares FJ, Dynamic investigation on a masonry bell tower. J. Eng. Struct.
2006; 28:660–67.
[39] Julio ENBS, DA Silva Rebelo CA, Dias–DA–Costa D, Structural assessment of the
tower of the University of Coimbra by modal identification. J. Eng. Struct. 2008;
30:3648–77.
[40] Lepidi M, Gattulli V, Foti D, Swinging –bell resonance ant their cancellation
identified by dynamic analysis in a modern bell tower. J. Eng. Struct. 2009;
31(7):1486–1500.
[41] El–Attar AG, Saleh AM, Zaghw AH, Conservation of a slender historical Mamluk–
style minaret by passive control technique. J. Struct. Ctrl Health monit. 2005;
12:157–77.
[42] Pesci A, Casula G, Bonchi E, Laser scanning the Garisenda and Asinelli towers in
Bologna (Italy): detail deformation patterned of two ancient leaning buildings. J.
Cult. Herit. 2010; 12:117–27.
Seismic vulnerability assessment of slender masonry structures
147
[43] Valluzzi MR, Porto F, Modenza C, Structural investigation and strengthening of the
civic tower in Vicenza. In: Proceedings of the structural faults and repairs, London,
UK, 2003.
[44] Carpinteri A, Lacidogna G, Structural monitoring and diagnostic by the acoustic
emission technique: Scaling of dissipated energy in compression. In: Proceedings of
the 9th
int. congress on sound and vibration, 2002, Paper no. 166.
[45] Carpinteri A, Lacidogna G, Structural monitoring and integrity assessment of
medieval towers. J. Struct. Eng. (ASCE) 2006; 1681–90.
[46] De Stefano A, Clemente P, S.H.M. on historical heritage: Robust methods to face
large uncertaines. SAMCO Final Report. 2006. pp. 1–18.
[47] Carpinteri A, Invernizzi S, Lacidogna G, In situ damage assessment and nonlinear
modeling of a historical masonry tower. J. Eng. Struct. 2005; 27:387–95.
[48] Bayraktar A, Türker T, Sevım B, Altunisik, AC, Yildirim F, Modal Parameter
Identification of Hagia Sophia Bell–Tower via Ambient Vibration Test. J.
Nondestructive Evaluation 2009; 28:37–47.
[49] Bernardeschi K, Padovani C, Pasquinelli G, Numerical modeling of the structural
behaviour of Buti‟s bell tower. J. Cult. Herit. 2004; 5:371–78.
[50] De Sortis A, Antonacci E, Vestroni F, Dynamic identification of a masonry building
using forced vibration tests. J. Eng. Struct.2005; 27:155–65.
[51] Abruzzese D, Miccoli L, Yuan J, Mechanical behaviour of leaning masonry Huzhu
Pagoda. J. Cult. Herit. 2009; 10:480–86.
[52] Peña F, Lourenço PB, Mendes N, Oliveira DV, Numerical models for the seismic
assessment of an old masonry tower. J. Eng. Struct. 2010; 32:1466–78.
[53] Crispino M, D‟Apuzzo M, Measurement and prediction of traffic–induced vibrations
in a heritage building. J. Sound and Vibration 2001; 246(2):319–35.
[54] Jaras A, Kačianauskas R, Markauskas D, Stupak E, FE modeling of wall structures
of Vilnius Arch–Cathedral Belfry. In: Proceedings of the 8th
Conference on Shell
Structures: Theory and Applications. October 12–14, Jurata, Poland, 2005. Taylor
and Francis, pp. 563–67.
[55] Carpinteri A, Invernizzi S, Lacidogna G, Numerical assessment of three medieval
masonry towers subjected to different loading conditions. Masonry International
2006; 19:65–75.

References
148
[56] Heyman J, Leaning towers, Meccanica 1992; 27: 153–9.
[57] Casolo S, A three dimensional model for vulnerability analyses of slender masonry
Medieval towers. J. Earthq. Eng. 1998; 2(4):487–512.
[58] Casolo S, Significant ground motion parameters for evaluation of the seismic
performance of slender masonry tower. J. Earthq. Eng. 2001; 5(2):187–204.
[59] Anzani A, Binda L, Carpinteri A, Invernizzi S, Lacidogna G, A multilevel approach
for the damage assessment of Historic masonry towers. J. Cult. Herit. 2010; 11:459–
70.
[60] Lourenço PB, Assessment, diagnosis and strengthening of Outeiro Church, Portugal.
J. Constr. Build. Mater. 2005; 19:634–45.
[61] Binda L, Saisi A, Tiraboschi C, Investigation Procedures for the Diagnosis of
Historic Masonries. J. Const. Build. Mater. 2000; 14:199–34.
[62] Ceroni F, Pecce M, Manfredi G, Seismic Assessment of the Bell Tower of Santa
Maria Del Carmine: Problems and Solutions. J. Earthq. Eng. 2010; 14:30–56.
[63] Stavroulaki ME, Bartoli G, Betti M, Stavrolakis GE, Strengthening of masonry using
metal reinforcement: A parametric numerical investigation. In: Proceedings of the
Protection of Historical Buildings PROHITECH 09, Mazzolani FM (ed), 2009,
ISBN 978–0–415–55803–7.
[64] Figueiras JA, Povoas RHCF, Modeling of prestress in non–linear analysis of
concrete structures. J. Comp. Struct. 1994; 53:173–87.
[65] Leftheris B, Tzanaki E, Stavroulaki ME, Dynamic criterion for reinforcement of
old buildings. In: Proceedings of the STREMA 93, Structural Studies, Repairs and
Maintenance of Historical buildings III’, Brebbia CA & Frewer RJB (eds), UK,
1993.
[66] Leftheris B, Stavroulaki ME, Sapounaki AC, Stavroulakis GE, Computational
methods for heritage structures. WIT Press, Southampton, U.K, 2006.
[67] Bongiovanni G, Clemente P, Buffarini G, Analysis of the seismic response of a
damaged masonry bell tower. In: Proceedings of the 12th
World Conference on
Earthquake Engineering, January 30–February 4, Auckland, New Zealand, 2000.
[68] Camata G, Cifelli L, Spacone E, Conte J, Torrese P, Safety analysis of the bell
tower of S. Maria Maggiore cathedra in Guardiagrele (Italy). In: Proceedings of the

Seismic vulnerability assessment of slender masonry structures
149
14th
World Conference on Earthquake Engineering, October 12–17, Beijing, China,
2008.
[69] Carone AS, Foti D, Giannoccaro NI, Nobile R, Non–destructive characterization and
dynamic identification of an historical bell tower. In: Proceedings of the 4th
International Conference on Integrity, Reliability and Failure, June 23–27,
Funchal/Madeira, 2013, Paper no. 3988.
[70] Ramos LF, Marques L, Lourenco PB, De Roeck G, Costa A, Roque J, Monitoring
historical masonry structures with operational modal analysis: Two case studies. J.
Mech. Syst. Signal Process. 2010; 24:1291–1305.
[71] Tomaszewska A, Influence of statistical errors on damage detection based on
structural flexibility and mode shape curvature. J. Comp. Struct. 2010; 88:154–64.
[72] Guerreiro L, Azevedo J, Análise e reforço da torres do relógio da Horta, Faial. In:
Proceedings of the 5th
Encontro national de sismologia e engenharia sismica,
October 24–27, 2001, pp. 639–50. (In Portugese)
[73] Pelella T, Mannara G, Cosenza E, Iervolino I, Lecce L, Structural dynamic
investigations on the bell tower from the S. Lucia‟s church–Serras. Quirico
(Ancona). In: Proceedings of the 7th
International Seminar on Seismic Isolation,
Passive Energy Dissipation and Active Control of Vibrations of Structures, October
2–5, Assisi, Italy, 2001.
[74] Ceriotti M, Luca Mottola L, Picco GP, Murphy AL, Guna S, Corrà M, Pozz M,
Zonta D, Zanon P, Monitoring Heritage Buildings with Wireless Sensor Networks:
The Torre Aquila Deployment. In: Proceedings of the 8th
ACM/IEEE International
Conference on Information Processing in Sensor Networks, April 13–16, San
Francisco, CA, 2009 .
[75] Foti D, Chorro SI, Sabbà MF, Dynamic Investigation of an Ancient Masonry Bell
Tower with Operational Modal Analysis: A Non–Destructive Experimental
Technique to Obtain the Dynamic Characteristics of a Structure. The Open
Construction and Building Technology Journal 2012; 6:384–91.
[76] Ivorra S, Pallares FJ, Adam JM, Tomas R, An evaluation of the incidence of soil
subsidence on the dynamic behaviour of a Gothic bell tower. J. Eng. Struct. 2010;
32:2318–25.

References
150
[77] Gentile C, Sais A, Operational modal testing of historic structures at different levels
of excitation. J. Constr. Build. Mater. 2013; 48:1273–85.
[78] Ivorra S, Cervera JR, Analysis of the dynamic actions when bells are swinging on
the bell tower of Bonreposi Mirambell Church (Valencia, Spain). In: Proceedings of
the Historical Constructions, Lourenço PB & Roca P (eds), Guimarães, Portugal,
2001.
[79] Casciati S, Al–Saleh R, Dynamic behaviour of a masonry civic belfry under
operational conditions. J. Acta. Mech. 2010; 215:211–24, doi: 10.1007/s00707–010–
0343–4.
[80] Balduzzi B, Mazza D, Papis D, Rossi C, Rossi PP, Experimental and numerical
analysis for the strengthening intervention of the bell tower of St. Sistόs Church in
Bergamo. In: Proceedings of the 5th
International Conference on Structural Analysis
of Historical Constructions (SAHC), 6–8 November, New Delhi, India, 2006, ISBN
972–8692–27–7.
[81] Peeters B, Sforza G, Sbaraglia L, Germano F, Efficient operational modal testing
and analysis for design verification and restoration baseline assessment: Italian case
studies. In: Proceedings of the Experimental Vibration Analysis for Civil
Engineering Structures (EVACES), October 3–5, Varenna, Italy, 2011.
[82] Kohan PH, Nallim LG, Gea SB, Dynamic characterization of beam type structures:
Analytical, numerical and experimental applications. J. Applied Acoustics 2011;
72:975–81.
[83] Jaras A, Kliukas R, Kačianauskas R, The dynamic loading of Vilnius archcathedral
belfry –Investigation and analysis. In: Proceedings of the 10th
international
conference on Modern Building materials, Structures and Techniques, May 19–21,
Vilnius, Lithuania, 2010, pp. 635–40.
[84] Costa A, Ambient vibration measurement of bell tower. Porto. University of Aveiro,
Portugal, 2011.
[85] Diaferio M, Foti D, Giannoccaro NI, Vitti M, On the use of modal analysis and
ground penetrating radar test for the physical parameter identification of an historical
bell tower. In: Proceedings of the Vienna Congress on Recent Advances in
Earthquake Engineering and structural Dynamics (VEESD), August 28–30, Vienna,
Austria, 2013, Paper no. 560.

Seismic vulnerability assessment of slender masonry structures
151
[86] Pieraccini M, Fratini M, Dei D, Atzeni C, Structural testing of Historical Heritage
Site Towers by microwave remote sensing. J. Cult. Herit. 2009; 10:174–82.
[87] Zaki MA, Hassan AF, Mourad SA, Osman AM, Evaluation of the structural integrity
of historical stone minarets. In: Proceedings of the 14th
World Conference on
Earthquake Engineering, October 12–17, Beijing, China, 2008.
[88] Pau A, Vestroni F, Dynamic Characterization of Ancient Masonry Structures.
Advances in Vibration Analysis Research, 2011, pp. 213–30.
[89] Turk AM, Cosgun C, Seismic Behaviour and Retrofit of Historic Masonry Minaret.
GRADEVINAR 64 2012; 1:39–45.
[90] Krstevska L, Tashkov L, Gramatikov KK, Landolfo R, Mammana O, Portioli F,
Mazzolani F, Large–Scale Experimental Investigation on Mustafa Pasha Mosque. J.
Earthq. Eng. 2010; 14:842–73.
[91] Aoki T, Sabia D, Theoretical and Experimental Analysis of Brick Chimneys,
Tokoname, Japan. Computational Mechanics, WCCM VI in conjunction with
APCOM‟04, September 5–10, 2004, Beijing, China, 2004, Tsinghua University
Press & Springer–Verlag.
[92] Costa A, Relatόrio de inspeção de uma chaminé sita em Vila franca de Xira,
relatόrio técnico. Projecto e Flscallzaҫão Lda, malo, 2010. (In Portuguese)
[93] Yamamoto T, Maeda T, Earthquake safety assessment of a tall brick chimney in
Tokoname based on the micro–tremor measurement. In: Proceedings of the 14th
World Conference on Earthquake Engineering, October 12–17, Beijing, China,
2008.
[94] Grande R, Aҫores SM, Relatόrio dos ensaios dinmicos de vibraҫao ambiental e
avaliaҫao de seguranҫa estrutural face à acҫao sismica. University of Porto, 2009.
(In Portuguese)
[95] Eusani F, Benedettini F, Modal and Structural Identification of a Masonry Chimney.
In: Proceedings of the 19th
Congress of Italian Association for Theoretical and
Applied Mechanics, September 14–17, Ancona, Italy, 2009.
[96] Costa A, Guedes J, Silva B, Lopes V, Inspecҫão diagnóstico e caracterização
material– chaminé em Matosinhos. Relatόrio técnico, Marҫo, 2011. (In Portuguese)
[97] Jaishi B, Ren WX, Zong ZH, Maskey PN, Dynamic and seismic performance of old
multi–tiered temples in Nepal. J. Eng. Struct. 2003; 25:1827–39.

References
152
[98] Shakya M, Varum H, Vicente R, Costa A, Seismic sensitivity analysis of the
common structural components of Nepalese Pagoda temples. Bull. Earthq. Eng.
2013, doi: 10.1007/s10518–013–9569–6.
[99] Faccio P, Podestà S, Saetta A, Campanile della Chiesa di Sant’Antonin, Esempio 5,
in Linee Guida per la valutazione e riduzione del rischio sismico del patrimonio
culturale allineate alle nuove Norme tecniche per le costruzioni (D.M. 14/01/2008).
Circolare 26/2010. Venezia, 2011. (In Italian)
[100] NSCE–02, Norma de Construcciòn Sismorresistente. Parte General y Edificaciòn
(Spanish Standard). Ministerio de Fomento, Spain, 2002. (In Spanish)
[101] Clough RW, Penzien J, Dynamics of Structures. 2nd
Ed., McGraw–Hill Book
Company, New York, 1993.
[102] Parajuli YK, Bhaktapur Development Project (BDP): Experiences in preservation
and restoration in medieval town (1974–1985). Frankfurt: Deutsche Gesellschaft
fuer Technisches Zuzammenarbeit (GTZ), 1986.
[103] Ranjitkar RK, Heritage homeowner‟s preservation manual. Kathmandu Valley
World Heritage site, Nepal: advice for maintenance of historic houses in the
Kathmandu Valley. Integrated Community Development and Cultural Heritage Site
Preservation in Asia and the Pacific through Local Effort Programme (LEAP),
UNESCO Bangkok, UNESCO Kathmandu, 2006.
[104] Tiwari SR, Temples of the Nepal Valley. Himal Books, Kathmandu, Nepal, 2009,
ISBN: 9789937814430.
[105] Nienhuys S, Options for reconstruction and retrofitting of historic Pagoda Temples.
Reconstruction of Temples in Kathmandu, HUYS ADVIES, September 2003.
http://www.nienhuys.info/mediapool/49/493498/data/Retrofitting_KVPT_HA_2003.
[106] Kathmandu valley preservation trust (KVPT), Patan, Nepal/Bhaktapur municipality
(BKT), Bhaktapur, Nepal, The collection of information and drawings of Nepalese
Pagoda temples, 2011. http://www.kvptnepal.org, http://www.bkt–
municipality.gov.np
[107] Thapa JB, Test and simulation of brick masonry wall of historic buildings. Msc
thesis. Institute of Engineering, Pulchowk campus, Tribhuvan University, Nepal,
2011.

Seismic vulnerability assessment of slender masonry structures
153
[108] Indirli M, Kouris LAS, Formisano A, Borg RP, Mazzolani FM, Seismic damage
assessment of unreinforced masonry structures after the Abruzzo 2009 earthquake:
the case study of the historical centers of L'Aquila and Castelvecchio Subequo. Int. J.
of Architectural Herit. 2013; 7:536–78.
[109] Ranjitkar RK, Seismic Strengthening of the Nepalese Pagoda: Progress report,
Earthquake–Safe: Lessons to Be Learned from Traditional Construction. In:
Proceedings of the International Conference on the Seismic Performance of
Traditional Buildings: November 16–18, Istanbul, Turkey, 2000. Istanbul: ICOMOS
International Wood Committee, http://www.icomos.org/iiwc/seismic/Ranjitkan.pdf
[110] Faggiano B, Marzo A, Formisano A, Mazzolani FM, Innovative steel connections for
the retrofit of timber floors in ancient buildings: A numerical investigation. J. Compt.
& Struct. 2009; 87:1–13.
[111] Bonapace B, Sestini V, Traditional materials and construction technologies used in
the Kathmandu valley. Paragraphic for the United Nations Educational, Scientific
and Cultural, 7 Place de Fontenoy, 75352 Paris 07 SP, France.
[112] Neves F, Costa A, Vicente R, Oliveira CS, Varum H, Seismic vulnerability
assessment and characterization of the buildings on Faial Island, Azores. Bull.
Earthq. Eng. 2012; 10:27–44, doi: 10.1007/s10518–011–9276–0.
[113] Pradhan R, Seismicity and Traditional Buildings of Kathmandu Valley, Nepal,
Earthquake–Safe: Lessons to Be Learned from Traditional Construction. In:
Proceedings of the International Conference on the Seismic Performance of
Traditional Buildings: November 16–18, Istanbul, Turkey, 2000. Istanbul: ICOMOS
International Wood Committee. http://www.icomos.org/iiwc/seismic/Pradhan.pdf
[114] Theophile E, Ranjitkar RK, Timber conservation problems of the Nepalese Pagoda
temple. In: Proceedings of the 8th
int. Symposyum of ICOMOS International Wood
Committee, Norway, 1992, pp. 85–124.
[115] Faggiano B, Grippa MR, Marzo A, Mazzolani FM, Experimental study for non–
destructive mechanical evaluation of ancient chestnut timber. J. Civil Struct. Health
Monit. 2011; 1:103–12.
[116] Tomazevic M, Sheppard P, Zarnic R, Assessment of earthquake resistance of old
urban and rural nuclei. Institute for Testing and Research in Materials and
Structures, 12, 61000 Ljubljana, Yugoslavia, 1985.

References
154
[117] Parajuli HR, Kiyono J, Taniguch H, Toki K, Furukawa A, Maskey PN, Parametric
Study and Dynamic Analysis of a Historical Masonry Building of Kathmandu.
Disaster Mitigation of Cultural Heritage and Historic Cities 2010; Vol. 4.
[118] Jaishi B, Seismic capacity evaluation of multi–tiered temples of Nepal. Msc thesis,
Pulchowk campus, Tribhuvan University, Nepal, December, 2001.
[119] KVPT, Retrofitting, Restoration, and Reconstruction of Nepalese Pagoda temples.
Kathmandu valley preservation trust, Patan Darbar Square, Nepal, 2014.
http://www.kvptnepal.org
[120] Shakya M, Modal analysis using ambient vibration measurement and damage
identification of three–tiered Radha Krishna Temple. ME thesis, Purbanchal
University, Nepal, 2010.
[121] Shakya M, Varum H, Vicente R, Costa A,Structural Vulnerability of Nepalese
Pagoda Temples. In: Proceedings of the 15th
World Conference on Earthquake
Engineering, September 24–28, Lisbon, Portugal, 2012, Paper no. 2919.
[122] SAP 2000 Ultimate 15.0.0., Structural analysis program. Computer and Structures.
Inc. 1976–2011, Berkeley, CA, 2011.
[123] ARTeMIS, Extractor Pro software. Issued by Structural Vibration Solutions Aps.
NOVI Science Park, Niels Jernes Vej 10, DK 9220 Aalborg East, Denmark, 2011.
[124] Júlio ENBS, Silva Rebelo CA, Dias–da–Costa DASG, Structural assessment of the
tower of the University of Coimbra by modal identification. J. Eng. Struct. 2008;
30:3468–77.
[125] Krstevska L, Tashkov L, Naumovski N, Florio G, Formisano A, Fornaro A,
Landolfo R, In–situ experimental testing of four historical buildings damaged during
the 2009 L'Aquila earthquake. In: Proceedings of the COST Action C26 Final
Conference "Urban Habitat Constructions under Catastrophic Events", September
16–18, Naples, 2010, CRC Press, Taylor & Francis Group, London, ISBN: 978–0–
415–60685–1, pp. 427–32.
[126] Aras F, Krstevska L, Altay G, Tashkov L, Experimental and numerical modal
analyses of a historical masonry palace. J. Eng. Struct. 2011; 25:81–91.
[127] Chen JF, Morozov EV, Shankar K, A combined elastoplastic damage model for
progressive failure analysis of composite materials and structures. J. Composite
Struct. 2012; 94:3478–89.

Seismic vulnerability assessment of slender masonry structures
155
[128] Orduña A, Preciado A, Galván JF, Araiza JC, Vulnerability assessment of churches
at Colima by 3D limit analysis models. In: Proceedings of the 6th
International
Conference on Structural Analysis of Historical Constructions (SAHC), July 2–4,
Bath, UK, 2008.
[129] Sandi H, Vulnerability and risk analysis for individual structures and system, Report
of the European Association of Structural Engineering. In: Proceedings of the 8th
Congress of the ECEE, Lisbon, Portugal, 1986.
[130] Speranza E, Viskovic A, Sepe V, Integrated methods for the assessment of the
structural vulnerability of historic towers. In: Proceedings of the 5th
International
Conference on Structural Analysis of Historical Constructions (SAHC), 6–8
November, New Delhi, India, 2006, pp. 651–58.
[131] GNDT–SSN–1994, Gruppo Nazionale per la Difesa dai Terremoti, Scheda di
esposizione e vulnerabilità e di rilevamento danni di primo livello e secondo livello
(muratura e cemento armato). Gruppo Nazionale per la Difesa dai Terremoti: Roma,
Italy, 1994. (In Italian)
[132] Benedetti D, Petrini V, Sulla vulnerabilitá sismica di edifici in muratura i proposte di
un metodo di valutazione. L'industria delle Construzioni 1984; 149:66–74.
[133] GNDT–1990, Seismic risk of public buildings, National Council of Investigation.
Gruppo Nazionale per la Difesa dai Terremoti, Italy, 1990. (In Italian)
[134] Corsanego A, Petrini V, Seismic vulnerability of buildings. In: Proceedings of the
SEISMED 3. Trieste, Italy, 1990.
[135] Speranza E, An integrated method for the assessment of the seismic vulnerability of
historic buildings. Phd thesis, Department of Architecture and Civil Engineering,
University of Bath, U.K., 2003.
[136] Whitman RV, Reed JW, Hong ST, Earthquake damage probability matrices. In:
Proceedings of the 5th
world conference on earthquake engineering, Rome, 1974,
Paper no. 2531.
[137] ATC–21, Rapid visual screening of building for potential seismic hazards: a
handbook. Applied Technology Council, FEMA 145, Redwood City, California,
1988.
[138] ATC–13, Earthquake damage evaluation data for California. Applied Technology
Council, California, 1985.

References
156
[139] HAZUS MH, Earthquake loss estimation methodology–technical and user manuals.
Federal Emergency Management Agency, Washington, D.C., 1999.
[140] Giovinazzi S, Lagomarsino S, A macroseismic model for the vulnerability
assessment of buildings. In: Proceedings of the 13th
world conference on earthquake
engineering, August 1–6, Vancouver, Canada, 2004, Paper no. 896.
[141] Dolce M, Kappos A, Zuccaro G, Coburn AW, Report of the EAEE working group 3:
vulnerability and risk analysis, Technical Report. In: Proceedings of the 10th
European Conference on Earthquake Engineering, Vienna, No. 4, 1994, pp. 3049–
77.
[142] Grünthal G, European Macroseismic Scale EMS–98. Notes of the European Center
of Geodynamics and Seismology, Volume 15, Luxembourg, 1998.
[143] Midas FEA, Nonlinear and detail FE Analysis System for civil structures. Midas
Information Technology Co., 2013.
[144] Calderini C, Lagomarsino S, A micromechanical inelastic model for historical
masonry. J. Earthq. Eng. 2006; 10(4):453–79.
[145] Gambarotta L, Lagomarsino S, Damage models for the seismic response of brick
masonry shear walls, Part I and II. J. Earthquake Eng. & Struct. Mech.1997; 26:441–
62.
[146] Preciado A, Seismic Vulnerability Reduction of Historical Masonry Towers by
External Prestressing Devices. PhD thesis, Department of Architecture, Civil
Engineering and Environmental Sciences University of Braunschweig–Institute of
Technology, Germany, September 2011.
[147] Vecchio FJ, Collins MP, The Modified Compression Field Theory for Reinforced
Concrete Elements Subjected to Shear. ACI J. 1986; 83(22):219–31.
[148] Chen W, Han DJ, Plasticity for Structural Engineers. New York: Springer–Verlag,
1988.
[149] Lourenço P, Computational strategies for masonry structures. PhD Thesis, Delft
University. Netherlands, 1996.
[150] Pieraccini M, Parrini F, Dei D, Fratini M, Atzeni C, Spinelli P, Dynamic
characterization of a bell tower by interferometric sensor, NDT&E International
2007; 40:390–496.

Seismic vulnerability assessment of slender masonry structures
157
[151] Vicente RS, Strategies and methodologies for urban rehabilitation interventions. The
vulnerability assessment and risk evaluation of the old city centre of Coimbra. PhD
Thesis, University of Aveiro, 2008. (In Portuguese)
[152] González JRA, Introducción al estudio de la vulnerabilidade sísmica de los edifícios
históricos de Granada. 2003. (In Spanish)
[153] Indian Standard, Criterion for earthquake resistant design of structures. IS: 1893–
1984.
[154] Binda L, Poggi C, Roberti GM, Folli RT, On site investigation and monitoring of the
Torrazzo of Cremona, Polytechnique de Milan. University of Reggio Calabria, 2000.
[155] CEN, Eurocode 8: design of structures for earthquake resistance–Part 1: general
rules. seismic actions and rules for buildings, Standardization, European Committee
for Brussels, 2008.
[156] Pineda P, Robador MD, Perez–Rodriguez JL, Characterization and repair measures
of the medieval building materials of a Hispanic–Islamic construction. J. Const. &
Bldg. Mater. 2013; 41:612–33.
[157] Arêde A, Costa A, Moreira D, Neves N, Seismic analysis and strengthening of Pico
Island Churches. Bull. Earthq. Eng. 2012; 10:181–209, doi: 10.1007/s10518–011–
9325–8.
[158] Cosenza E, Iervolino I, Case Study: Seismic Retrofitting of a Medieval Bell Tower
with FRP. J. Composites for Const. ASCE, DOI: 10.1061/ (ASCE) 1090–0268
(2007) 11:3 (319)
[159] Zonta D, Pozzi M, Zanon P, Anese GA, Busetto A, Real–time probabilistic health
monitoring of the Portogruaro Civic Tower. Structural Analysis of Historic
Construction – D‟Ayala & Fodde (eds), 2008, Taylor & Francis Group, London,
ISBN 978–0–415–46872–5.
[160] Kliukas R, Kacianauskas R, Jaras A, A monument of historical heritage– Vilnius
arch cathedral belfry: The dynamic investigation. J. Civil Eng. & Mgmt. 2008; 14(2):
139–146
[161] Bayraktar A, Şahin A, Özcan A, Yildirim F, Numerical damage assessment of
Haghia Sophia bell tower by nonlinear FE modeling. J. Applied Mathematical
Modeling 2010; 34:92–121.

References
158
[162] Okuyucu D, Aydin AC, An Evaluation On Erzurum Double Minaret Madrasah By
Structural Engineerıng Perspective, KSU. J. Eng. Sciences 2010; 13(1):24–44
[163] Kouris SS, Weber MKK, Numerical Analysis of Masonry Bell–Towers under
Dynamic Loading Journal of Civil Engineering and Architecture. ISSN 1934–7359,
USA, August 2011, Volume 5, No. 8 (Serial No. 45), pp. 715–22.
[164] Soyluk A, İlerisoy ZY, Dynamic analysis of Dolmabahce masonry clock tower.
GRAĐEVINAR 65 2013; 4:345–52, UDK 725.94.001.5:699.84(496.1)
[165] Vicente R, Parodi S, Lagomarsino S, Varum H, Mendes S, Seismic vulnerability and
risk assessment: case study of the historic city centre of Coimbra, Portugal. Bull.
Earthq. Eng 2011; 9:1067–96, doi: 10.1007/s10518–010–9233–3.
[166] Dogangun A, Tuluk OI, Livaoglu R, Acar R, Traditional Turkish minarets on the
basis of architectural and engineering concepts. In: Proceedings of the 1st
International Conference on Restoration of Heritage Masonry Structures, Cairo,
Egypt, April 24–27, 2006, P34, pp. 1–10.
[167] Combescure D, Guéguen P, Lebrun B, Vulnérabilité sismique du bâti existant:
approche d‟ensemble. Cahier technique AFPS 25:121, 2005. (In Italian)
[168] Giovinazzi S, The vulnerability assessment and damage scenario in seismic risk
analysis. PhD Thesis, International doctorate, University of Florence, Technical
University of Carolo–Wilhelmina, 2005.
[169] Lagomarsino S, Podestà S, Resemini S, Observation and mechanical models for the
vulnerability assessment of monument buildings. In: Proceedings of the 13th
world
conference on earthquake engineering, August 1– 6, 2004, Vancouver, Canada,
Paper no. 942.
[170] Lagomarsino S, Podestà S, Seismic Vulnerability of Ancient Churches: II. Statistical
Analysis of Surveyed Data and Methods for Risk Analysis. J. Earth. Spectra 2004;
20(2):395–412
[171] Balbi A, Lagomarsino S, Parodi S, Vulnerabilità sismica e rilevanza dei centri
strorici e delle emergenze architettoniche: un‟applicazione alla provincia di Imperia.
In: Proceedings of the La messa in sicurezza del terriotorio da eventi calamitosi di
tipo naturale: Esperienze e nuove prosptettive, Lerici, Italy, Sepetmber 12 2005,
Minciardi R, Ugolini P (eds), Alinea, Ialy, 2007. (In Italian)

Seismic vulnerability assessment of slender masonry structures
159
[172] ESRI, Geographic information systems (GIS). 380 New York Street, Redlands, CA
92373–8100, USA, 2013.
[173] UNDP/BCPR, Reducing Disaster Risk: A Challenge for Development A Global
Report. New York: United Nations Development Programme/Bureau for Crisis
Prevention and Recovery, 2004.
[174] Chaulagain H, Rodrigues R, Jara J, Spacone E, Varum H, Seismic response of
current RC buildings in Nepal: A comparative analysis of different
design/construction. J. Eng. Struct. 2013; 49:284–94.
[175] Ministry of Home Affairs (MoHA) and Nepal Disaster Preparedness Network–Nepal
(DPNet), Nepal Disaster Report: The Hazardscape and Vulnerability. ISBN: 9937–
2–1301–1, 2009.
[176] Chamlagain D, Earthquake scenario and recent efforts toward earthquake risk
reduction in Nepal. J. South Asia Disaster studies 2009, Vol. 2.
[177] Roy SC, Dunn J, Auden JA, Ghosh AMN, The Bihar–Nepal Earthquake of 1934.
Memoirs of the Geological Survey of India, v.73, 1939.
[178] Bhattarai GK, Chamlagain D, Rajaure S, Seismic hazard assessment for eastern
Nepal using 1934 and 1988 earthquakes. J. Nepal Geological Society 2011; 42:85–
93.
[179] Dixit AM, Geological effects and intensity distribution of the Udayapur (Nepal)
Earthuquake of August 20, 1988. J. Nepal Geological Society1991; 7:1–17.
[180] Bilham R, Gaur VK, Molnar P, Himalayan Seismic Hazard, Science 2001; 293
(5534):1442–44.
[181] JICA, The study on earthquake disaster mitigation in the Kathmandu Valley
Kingdom of Nepal. Japan International Cooperation Agency (JICA) and Ministry of
Home Affairs, His Majesty‟s Government of Nepal, vol. 1, 2002.
[182] Ferreira T, Vicente R, Mendes da Silva JAR, Varum H, Aníbal Costa A, Seismic
vulnerability assessment of historical urban centres: case study of the old city centre
in Seixal. Portugal. Bull. Earthq. Eng. 2013, doi: 10.1007/s10518–013–9447–2.
[183] Spence R, Bommer J, Del Re D, Bird J, Aydinoglu N, Tabuchi S, Comparison Loss
Estimation with Observed Damage: A study of the 1999 Kocaceli Earthquake in
Turkey. Bull. Earthq. Eng. 2003; 1:83–113.

References
160
[184] Bramerini F, Di Pasquale G, Orsini A, Pugliese A, Romeo R, Sabetta F, Rischio
sismico del territorio italiano. Proposta per una metodologia e risultati preliminari.
Servizio Sismico Nazionale, Rapporto Tecnico, SSN/RT/95/01, Roma, 1995.
[185] Coburn AW, Spence R, PomodisA, Factors determining human casualty levels in
earthquakes: mortality prediction in building collapse, In: Proceedings of the 10th
World Conference of Earthquake Engineering, Madrid, 1992, pp. 5989–94.
[186] Dolce M, Kappos A, Masi A, Penelis G, Vona M, Vulnerability assessment and
earthquake damage scenarios of the building stock of Potenza (Southern Italy) using
Italian and Greek methodologies. J. Eng. Struct. 2006; 28(3):357–71.9


