Challenges of dairy farming in south America
Dr. Marcos Inácio Marcondes
Universidade Federal de Viçosa
Animal Science Department
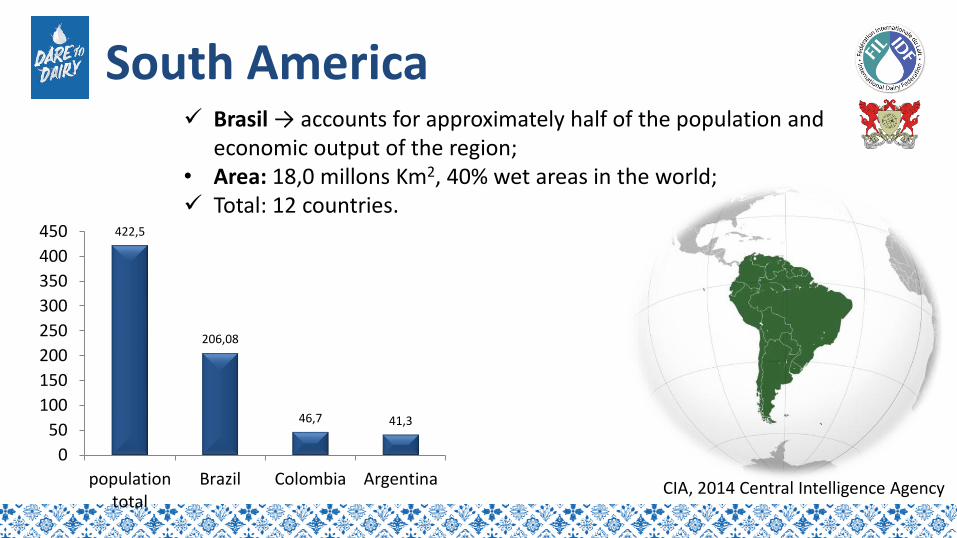
South America
422,5
206,08
46,7 41,3
0
50
100
150
200
250
300
350
400
450
populationtotal
Brazil Colombia Argentina
Brasil → accounts for approximately half of the population and economic output of the region;
• Area: 18,0 millons Km2, 40% wet areas in the world; Total: 12 countries.
CIA, 2014 Central Intelligence Agency
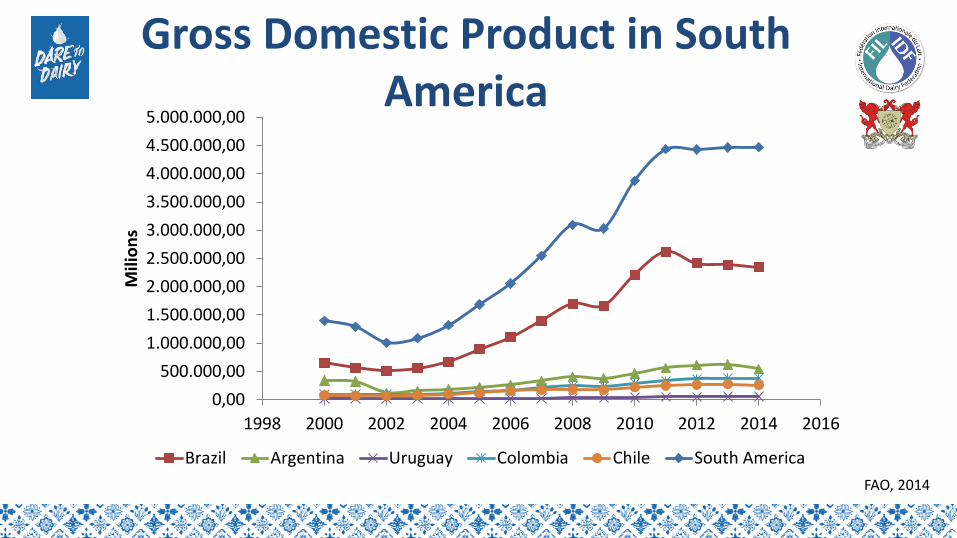
Gross Domestic Product in South America
0,00
500.000,00
1.000.000,00
1.500.000,00
2.000.000,00
2.500.000,00
3.000.000,00
3.500.000,00
4.000.000,00
4.500.000,00
5.000.000,00
1998 2000 2002 2004 2006 2008 2010 2012 2014 2016
Mili
on
s
Brazil Argentina Uruguay Colombia Chile South America
FAO, 2014
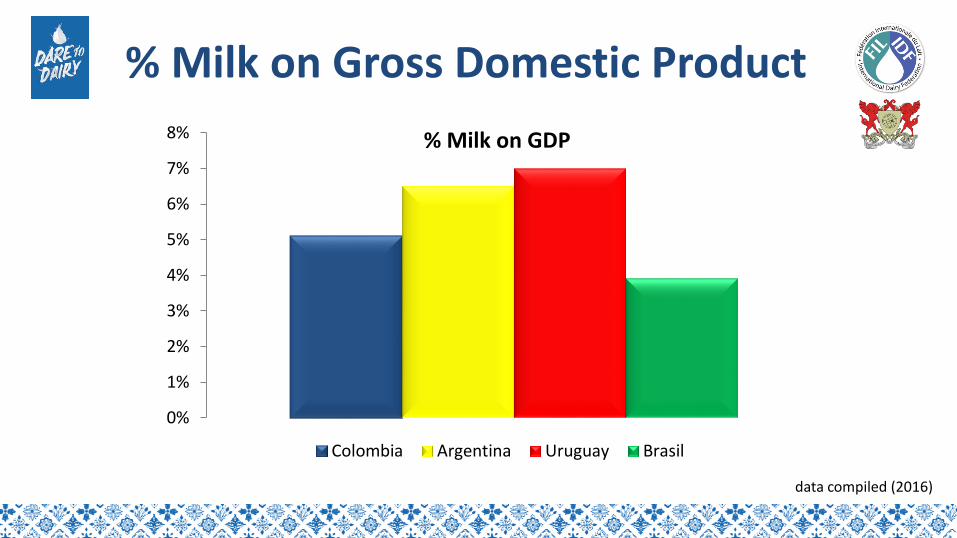
% Milk on Gross Domestic Product
data compiled (2016)
0%
1%
2%
3%
4%
5%
6%
7%
8% % Milk on GDP
Colombia Argentina Uruguay Brasil
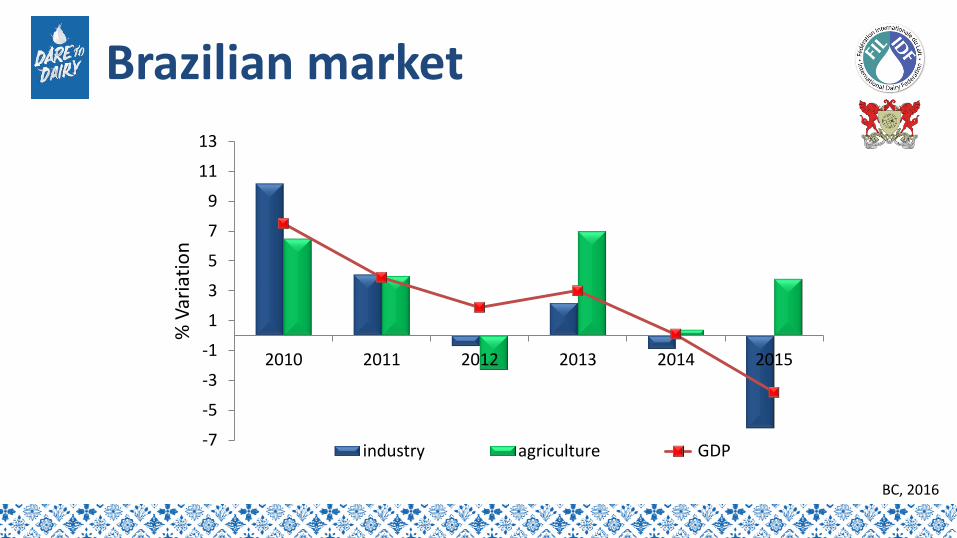
Brazilian market
-7
-5
-3
-1
1
3
5
7
9
11
13
2010 2011 2012 2013 2014 2015
% V
aria
tio
n
industry agriculture GDP
BC, 2016
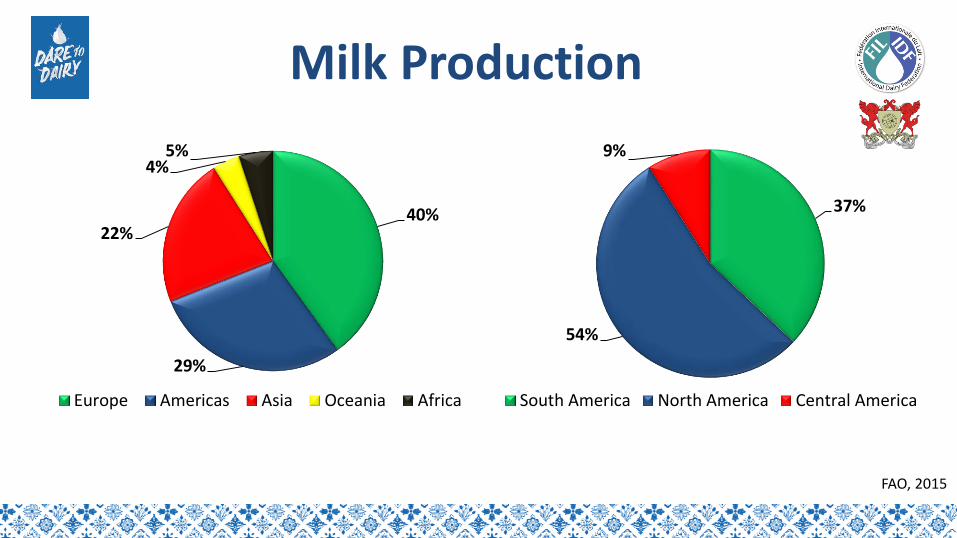
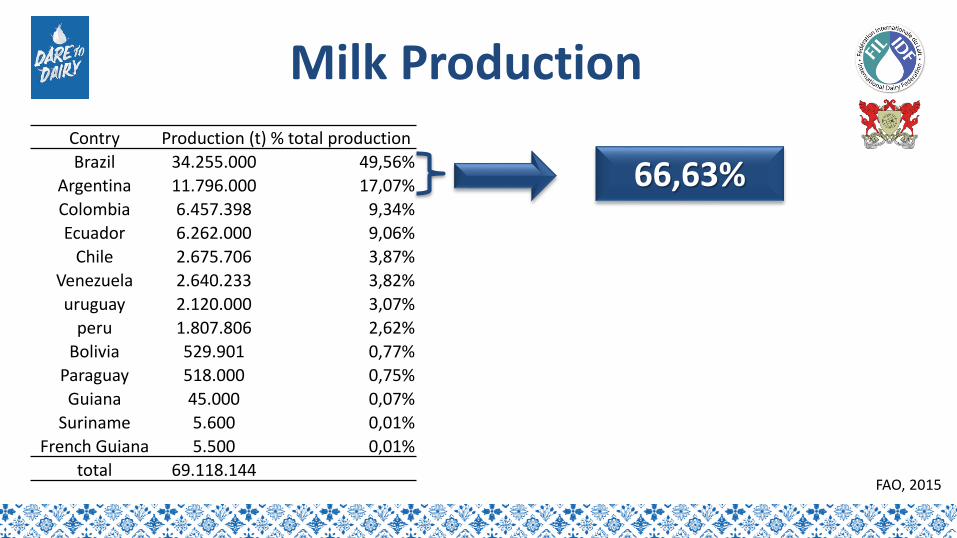
Milk Production
FAO, 2015
40%
29%
22%
4%5%
Europe Americas Asia Oceania Africa
37%
54%
9%
South America North America Central America
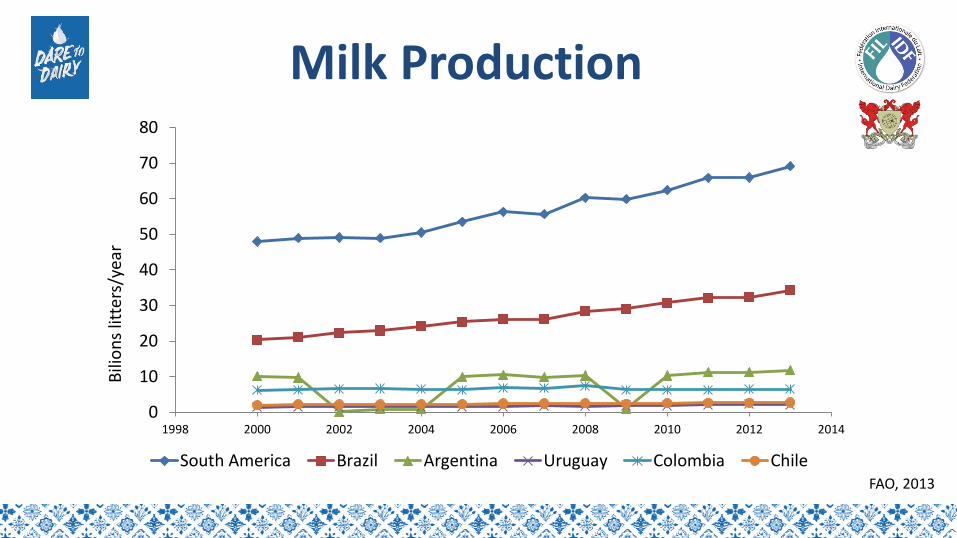
Milk Production
FAO, 2013
0
10
20
30
40
50
60
70
80
1998 2000 2002 2004 2006 2008 2010 2012 2014
Bili
on
slit
ters
/yea
r
South America Brazil Argentina Uruguay Colombia Chile
FAO, 2015
Contry Production (t) % total production
Brazil 34.255.000 49,56%
Argentina 11.796.000 17,07%
Colombia 6.457.398 9,34%
Ecuador 6.262.000 9,06%
Chile 2.675.706 3,87%
Venezuela 2.640.233 3,82%
uruguay 2.120.000 3,07%
peru 1.807.806 2,62%
Bolivia 529.901 0,77%
Paraguay 518.000 0,75%
Guiana 45.000 0,07%
Suriname 5.600 0,01%
French Guiana 5.500 0,01%
total 69.118.144
Milk Production
66,63%

Exports and imports of dairy products from Latin America and the Caribbean
0
1000
2000
3000
4000
5000
6000
7000
2000 2009 2010 2011
tho
usa
nd
s o
f lit
ers
of
milk
Imports Exports
FAO/FEPALE; 2011

Import and Export in Brazil
MIDC
0
50
100
150
200
250
Mili
on
slit
ters
/yea
r
import export
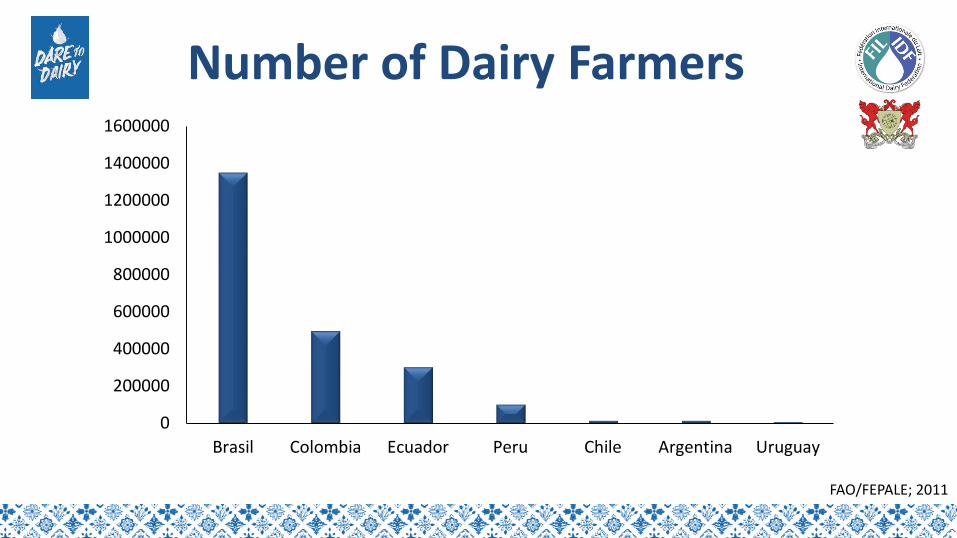
Number of Dairy Farmers
0
200000
400000
600000
800000
1000000
1200000
1400000
1600000
Brasil Colombia Ecuador Peru Chile Argentina Uruguay
FAO/FEPALE; 2011
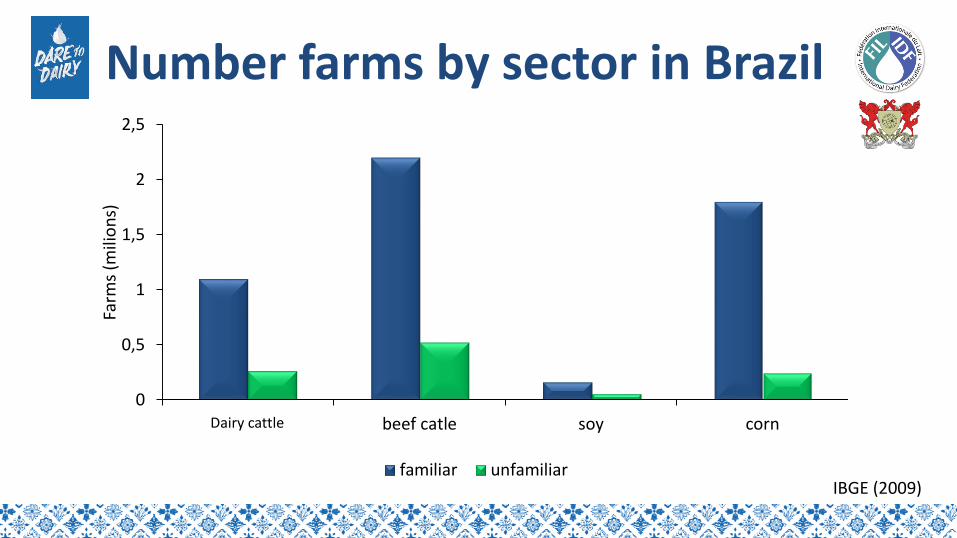
Number farms by sector in Brazil
0
0,5
1
1,5
2
2,5
Milk of cow beef catle soy corn
Farm
s (m
ilio
ns)
familiar unfamiliarIBGE (2009)
Dairy cattle

Importance of dairy cattle in Brazil
5,2
1,35
5
0
1
2
3
4
5
6
Farms Dairy farms Jobs
Mili
on
s
IBGE, 2012

Milk quality
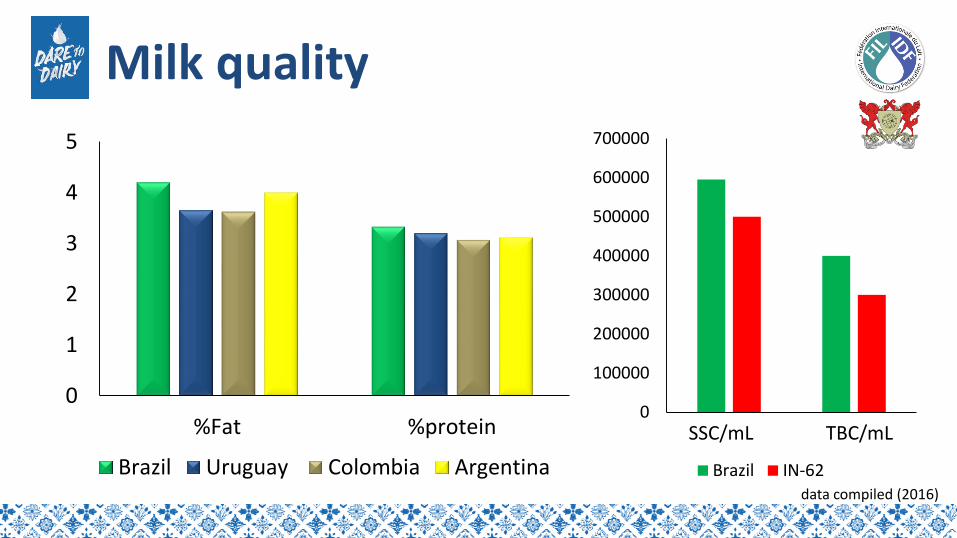
Milk quality
0
1
2
3
4
5
%Fat %protein
Brazil Uruguay Colombia Argentina
0
100000
200000
300000
400000
500000
600000
700000
CCS/ml CVT/ml
Brazil IN-62
SSC/mL TBC/mL
data compiled (2016)
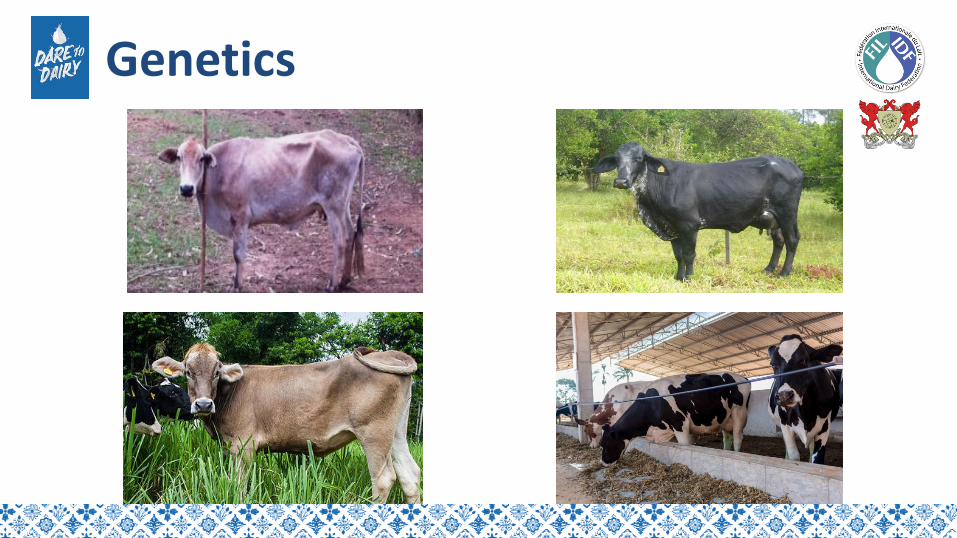
Genetics

Main milk breeds
0%
10%
20%
30%
40%
50%
60%
70%
80%
90%
Bolivia Holstein Colombia Crossbred Ecuador Crossbred Peru Crossbred Brazil Gyrolando
Canal Rural 2015; Contexto ganadero 2016Crossbred = Gyrolando?
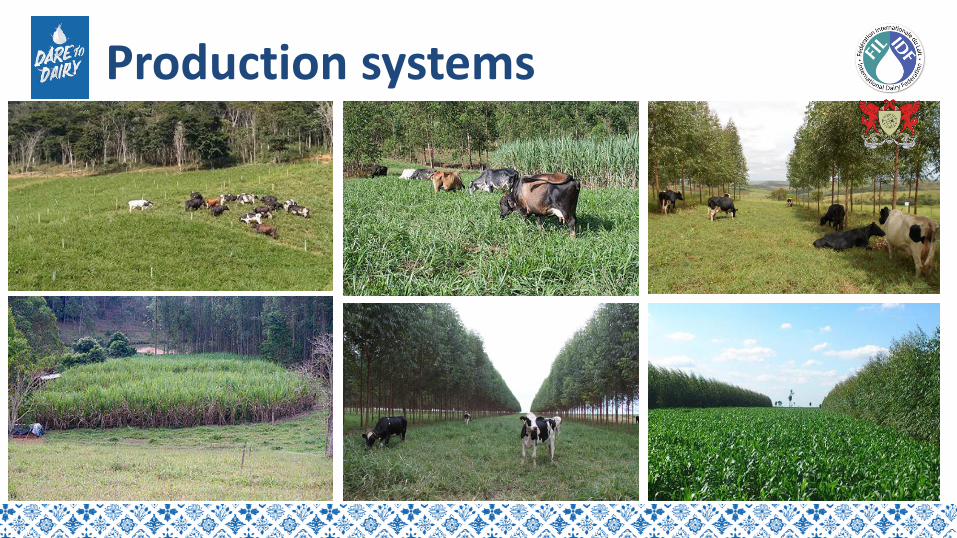
Production systems
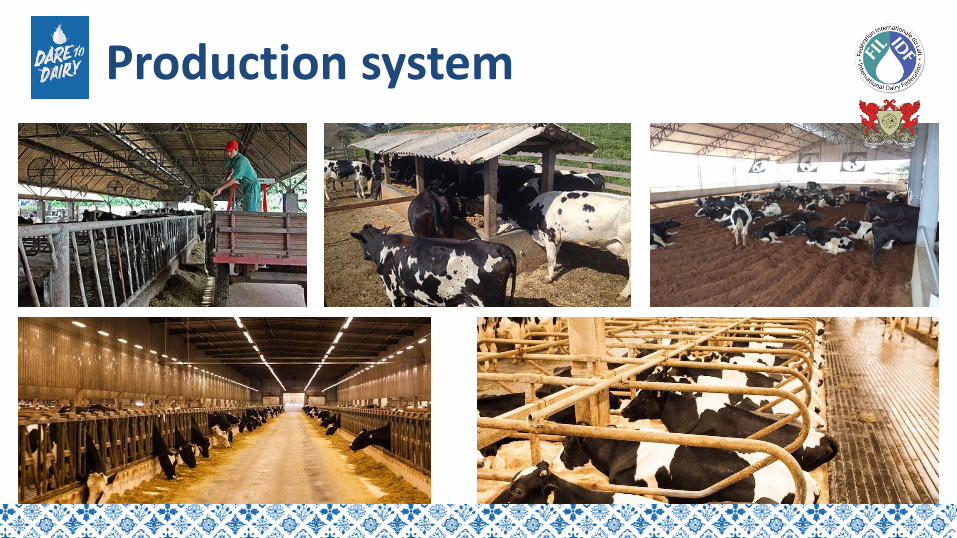
Production system

FAO, 2015
Production media per cow
0
1000
2000
3000
4000
5000
6000
Brazil Argentina Uruguay Colombia Chile Peru
Litt
ers
/co
wye
ar
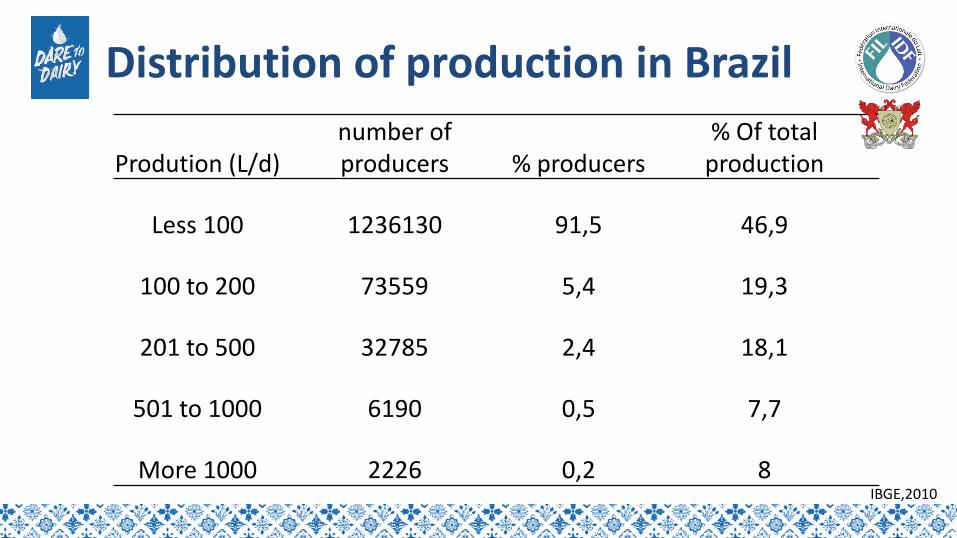
Distribution of production in Brazil
Prodution (L/d)number ofproducers % producers
% Of total production
Less 100 1236130 91,5 46,9
100 to 200 73559 5,4 19,3
201 to 500 32785 2,4 18,1
501 to 1000 6190 0,5 7,7
More 1000 2226 0,2 8IBGE,2010
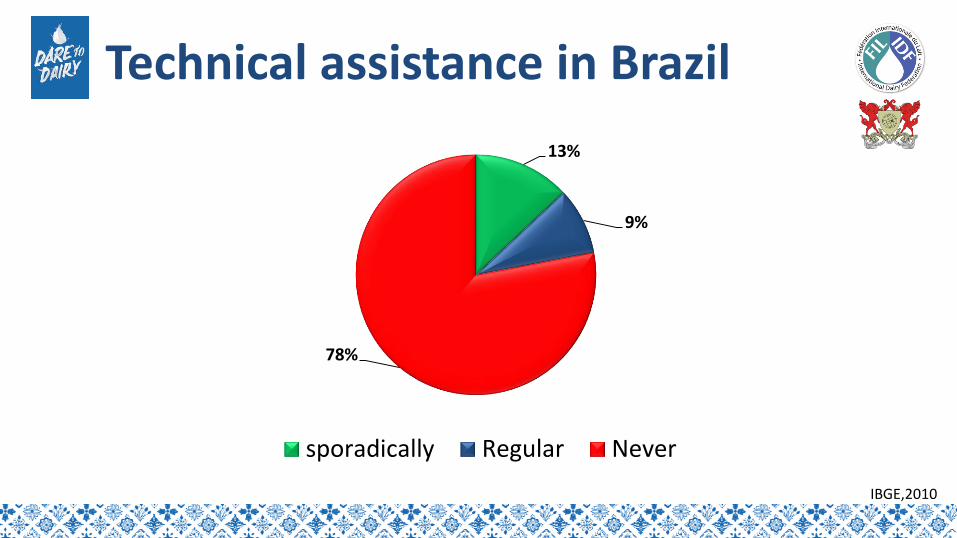
Technical assistance in Brazil
13%
9%
78%
sporadically Regular Never
IBGE,2010
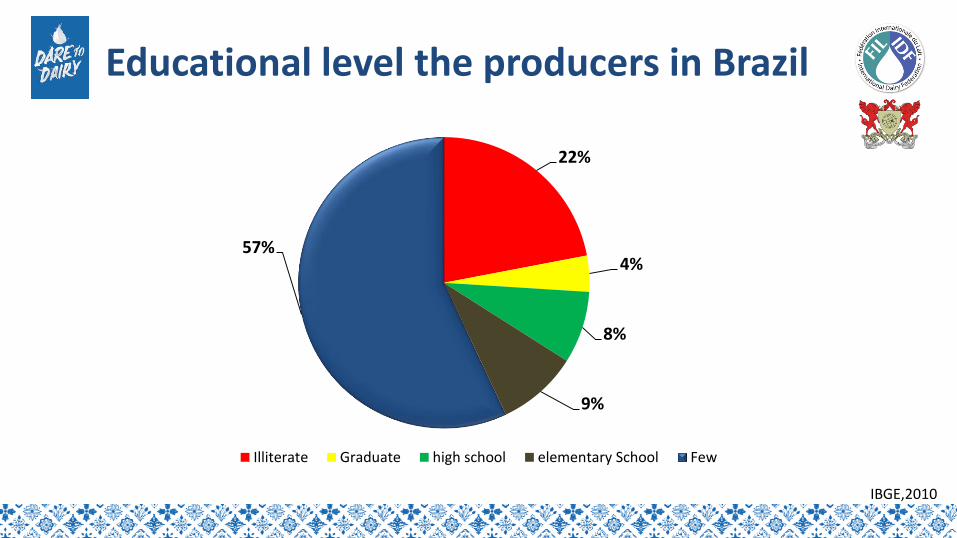
Educational level the producers in Brazil
22%
4%
8%
9%
57%
Illiterate Graduate high school elementary School Few
IBGE,2010
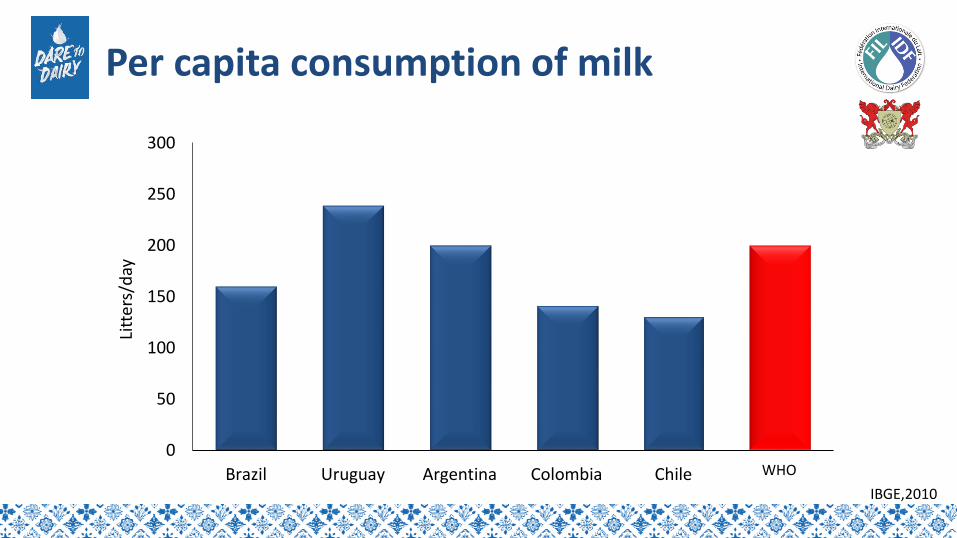
Per capita consumption of milk
IBGE,2010
0
50
100
150
200
250
300
Brazil Uruguay Argentina Colombia Chile OMS
Litt
ers/
day
WHO

Final considerations