
Maria Pia Amato
Dipartimento NEUROFARBASezione Neuroscienze
SOD Neurologia I – AOU Careggi
Nuove terapie orali per la SM
Firenze 2 dicembre 2013

Caratteristiche fondamentali della Sclerosi Multipla
Malattia infiammatoria e degenerativa, a carattere demielinizzante del SNC
Patogenesi autoimmune e eziologia non identificata Esordio tra i 20 ed i 40 anni, più frequente nel sesso
femminile (D:U 2-3:1). Il 3-5 % dei casi esordisce prima dei 18 aa. Evoluzione cronica con accumulo di disabilità
irreversibie nel tempo La più frequente causa di disabilità neurologica nei
giovani adulti, dopo gli incidenti stradali

Fattori di genere nella SM
• Maggiore prevalenza nel sesso femminile
• Incremento progressivo del rapporto F:M nelle ultime sei decadi
• Decorso favorevole in gravidanza con riduzione del tasso di ricaduta, «rebound» dopo il parto

Caso
GeniMutazioni post-genomiche
Eziopatogenesi MultifattorialeInterazione geni-ambiente
www.centers.it
Ambiente
HLA DR2 (HLA-DRB1*1501,HA-DQB1*0602)20-60% della suscettibilità genetica
circa 50 non-HLA loci, es. IL2-R, IL7-R, OR<1.3
EBVVit. DFumoSodio nella dieta

Caso
GeniMutazioni post-genomiche
Eziopatogenesi MultifattorialeInterazione geni-ambiente
www.centers.it
Ambiente
HLA DR 2Circa 50 loci non-HLA
EBVDeficit vit. D
Fumo ?

Systemic Immune-compartment BBB Central Nervous System
B
T
APC
IL-4IL-6
B
M
Reactivation & Expansion
TH1
TH 2
IL-10TGF-
-
MS immunopathogenesis
autoreactive repertoire
LNSystemic activation
Trafficking
Local reactivationInflammatory cascade
CNS damage
TH17

Ruolo eziologico di fattori genetici
Sesso: incidenza 2-4 volte superiore nel sesso femminile Rapporto tendenzialmente paritetico nei casi con età di esordio < 10aa. o >45aa.
Etnia: Più frequente nelle popolazioni caucasiche
HLA: associazione con DR2 nei caucasici• HLA-DRB1*1501,HA-DQB1*0602: 20-60% della suscettibilità genetica• circa 50 loci non-HLA (OR <1.3)
Ricorrenza familiare (15-20%)• maggior rischio di malattia nei familiari di primo grado del paziente• riduzione del rischio con l’allontanarsi del grado di parentela

Rischio di malattia in base al grado di parentela
Rischioricorrenza
(%)
Rischio Relativo vs. popolazine generale
% di condivisione genetica col
probando
Popolazione generale 0.2 1 0
Parenti 1° (fratelli) 3-5 15-25 50
Gemelli Dizigoti 3-5 15-25 50
Gemelli Monozigoti 35 190 100
Parenti 1° di Adottivi * 0.2 1 0
Fratellastri * 1.3 6.5 25
Nati da SM coniugale 29.5 147.5 50
Fratelli di pz nati da genitori consanguinei
9 45
(Sadovnick, 2001)
* Rischio non diverso se vita in comune/separata*non differenza se cresciuti nella stessa famiglia o separati, effetto della trasmissione materna

Rischio di malattia aggiustato per età in base al grado di parentela
Recurrence risk (%)
Relative Risk to general population
% Genetic sharing whit the proband
General population 0.2 1 0
First-degree relative (sib) 3-53-5 15-2515-25 5050
Dizygotic twin 3-5 15-25 50
Monozygotic twin 3535 190190 100100
Adpted first-degree relative 0.2 1 0
Half-sib (*) 1.3 6.5 25
Offspring of conjugal MS 29.5 147.5 50
Sib. of probands born from consanguineous mating
9 45
(Sadovnick, 2001)
(*) no difference in risk in case of growth in the same or in different environment
Presence of a maternal parent of origin effect

Studi sui gemelli Studio Gemellarità Concordanza %
Bammer, 1960Bammer, 1960 MZDZ
2944
Bobovik, 1978Bobovik, 1978 MZDZ
330
French Group, 1992French Group, 1992 MZDZ
111155
Mumford, 1994Mumford, 1994 MZDZ
406
Willer, 2003Willer, 2003 MZDZ
318
Hansen, 2005Hansen, 2005 MZDZ
306
Ristori, 2005Ristori, 2005 MZDZ
141444

Ruolo eziologico di fattori ambientali
Discordanza nei gemelli monozigoti
Distribuzione geografica disomogenea: gradiente latitudinale di prevalenza
“Clusters” (es. Isole Faroe)
“Trend” temporali di incidenza
Studi sui migranti (età critica di esposizione: prime due decadi di vita)

Prevalenza (N. casi x 100.000 abitanti) della SM nel mondo
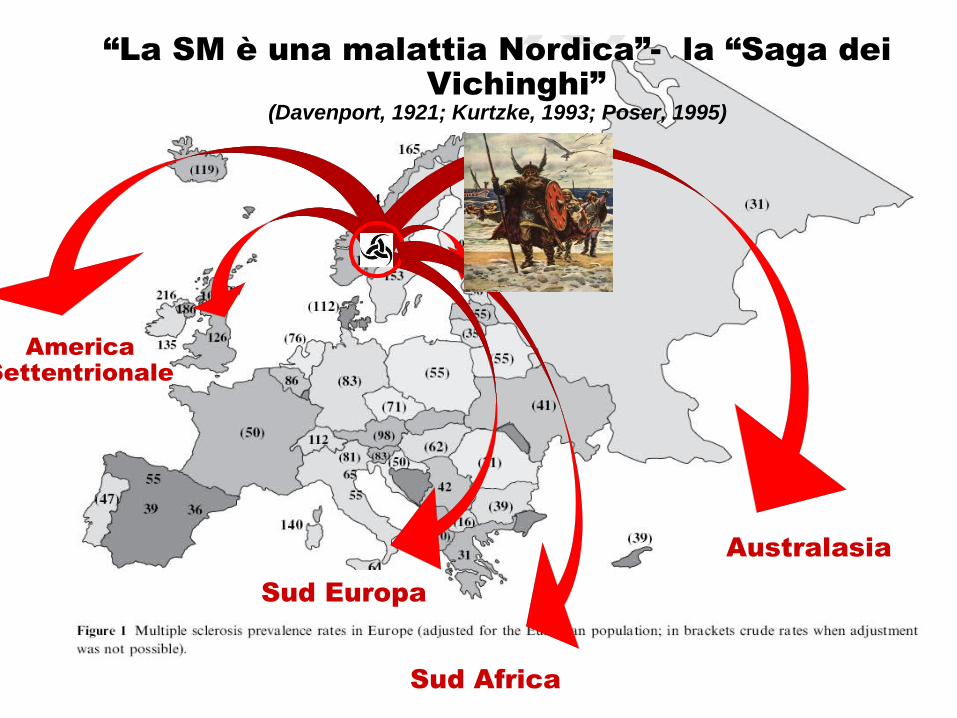
“La SM è una malattia Nordica”- la “Saga dei Vichinghi”
(Davenport, 1921; Kurtzke, 1993; Poser, 1995)
AmericaSettentrionale
AustralasiaSud Europa
Sud Africa

1201201313
1501506060
5353
6565
171713135353
69694040
2525
50506060
1010
3030120120
8080
3030
2626808040409090 4040
60607070
120120
8585
110110
96967575
9393
5555
280280
140140165165
100100
9292
9494
Prevalenza x 100.000 della SM Prevalenza x 100.000 della SM in Europa e in Italiain Europa e in Italia
Prevalenza stimata nazionale circa 100 per 100.000

120120150150
6060
5353
6565
171713135353
69694040
2525
50506060
1010
3030120120
8080
3030
2626808040409090 4040
60607070
120120
8585
110110
96967575
9393
5555
280280
140140165165
100100
9292
9494
Prevalenza x 100.000 della SM Prevalenza x 100.000 della SM in Europa e in Italiain Europa e in Italia


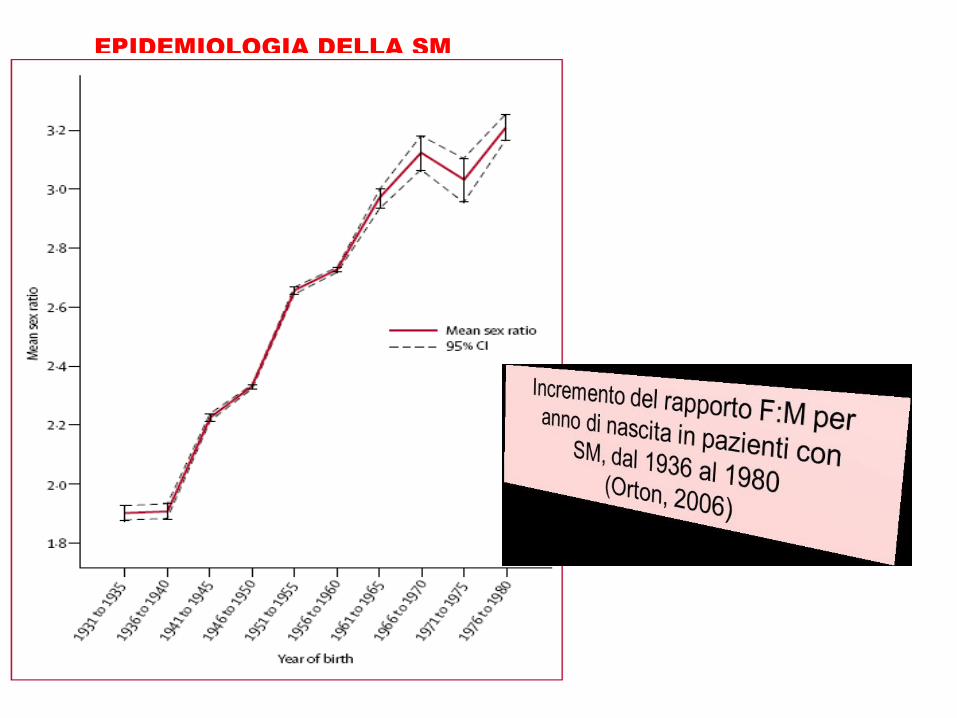
EIDEMIOLOGIA DELLA SM
Incremento del rapporto F:M per anno di nascita in pazienti con SM, dal 1936 al 1980
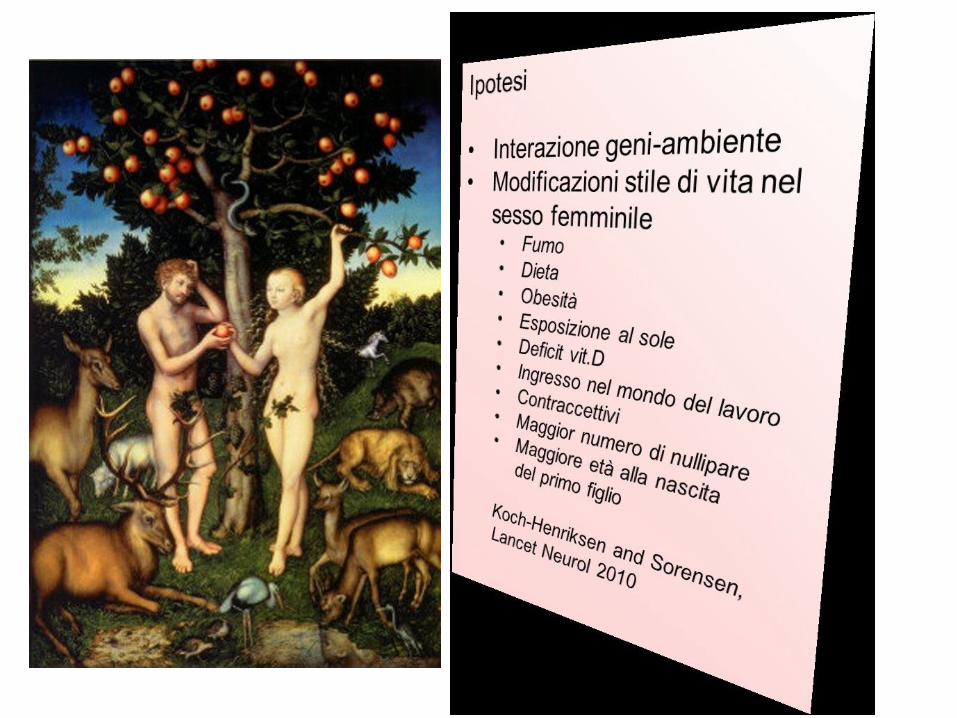
Ipotesi
•Modificazioni ambientali•Interazione geni-ambiente
• Fumo• Ingresso nel mondo del lavoro• Maggior numero di nullipare• Maggiore età alla nascita del primo figlio
Koch-Henriksen, Sorensen, Lancet Neurol 2010
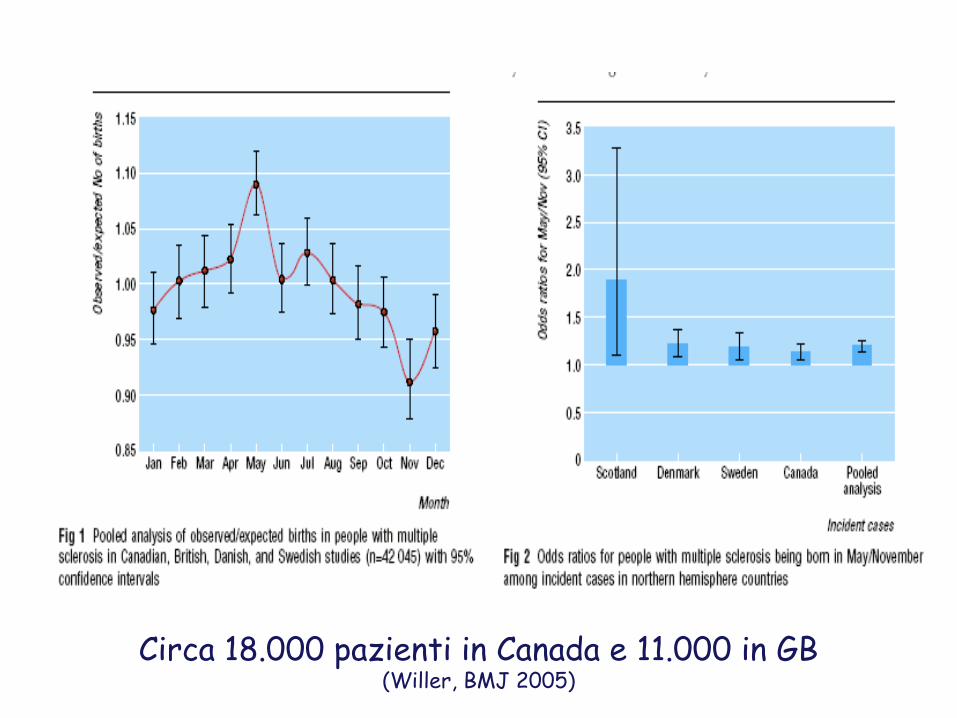
Circa 18.000 pazienti in Canada e 11.000 in GB(Willer, BMJ 2005)

2012

Rapporto F/M in pazienti con SM Rapporto F/M in pazienti con SM Paesi Nord-Europei e Sud-EuropeiPaesi Nord-Europei e Sud-Europei

Rapporto F/M nei pazienti con SM Rapporto F/M nei pazienti con SM stratificati per decorso RR o PPstratificati per decorso RR o PP
Paesi latitudine Nord Paesi Nord-Europei
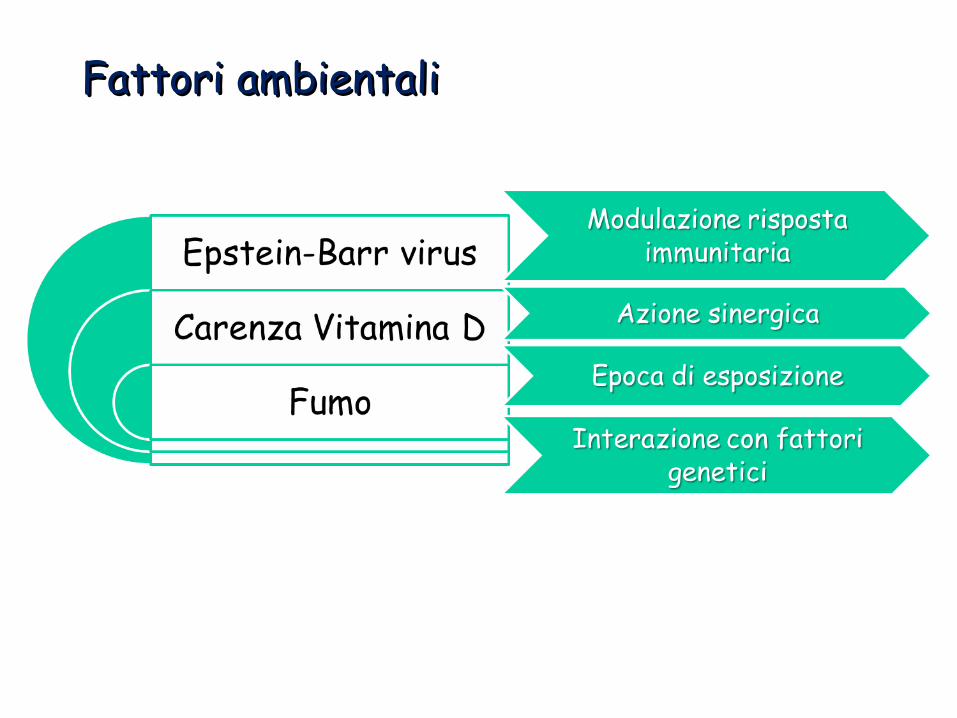
Fattori ambientaliFattori ambientali
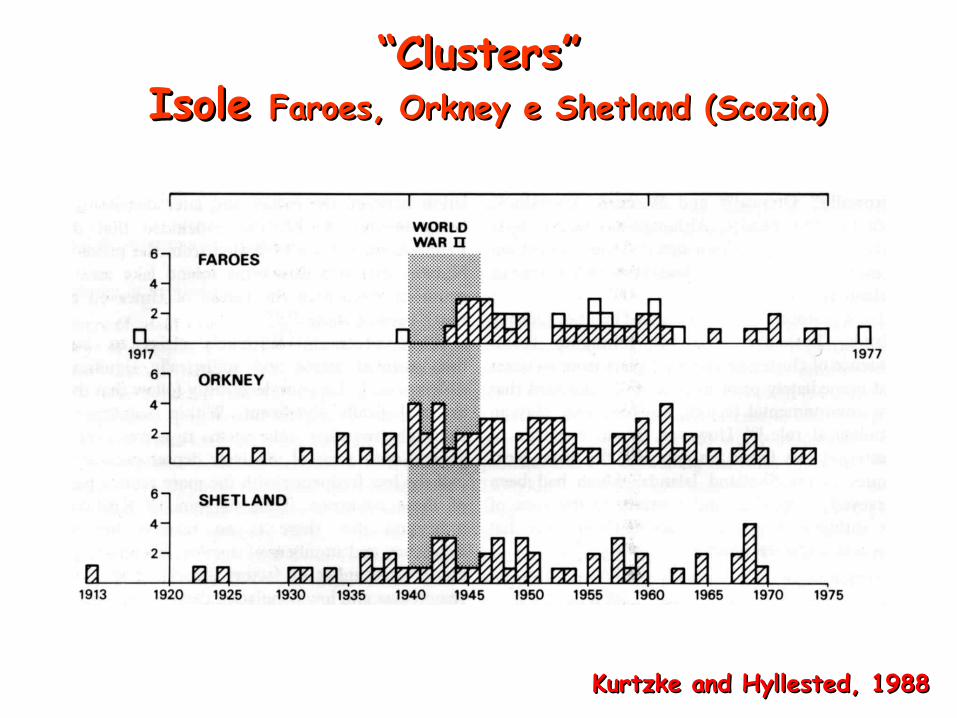
““Clusters”Clusters” Isole Isole Faroes, Orkney e Shetland (Scozia)Faroes, Orkney e Shetland (Scozia)
Kurtzke and Hyllested, 1988Kurtzke and Hyllested, 1988

Rischio del nuovo PaeseRischio del Paese di origine
< 15-20 aa> 15-20 aa
Età alla migrazione
Età alla migrazione e rischio di SMEtà alla migrazione e rischio di SM
Nascita

Studi sui migrantiStudi sui migranti
Corollari:
• Età critica di esposizione ai possibili fattori di rischio / causali correlati all’ambiente: prime 2 decadi di vita
• Periodo di latenza lungo tra esposizione e comparsa della malattia

Lista di agenti infettivi che sono stati associatiLista di agenti infettivi che sono stati associati alla SM alla SM
Rabies 1946 Measles 1964 Herpes simplex 1972 Virus parainfluenza I 1972 Chimpanzee cytomegalovirus 1979 Coronavirus 1979
Tick encephalitis 1982 HTLV-1 1985 Virus simian V 1987 MS-associated human
endogenous retrovirus (HERV) 1995
Human herpes virus 6 (HHV6) 1995
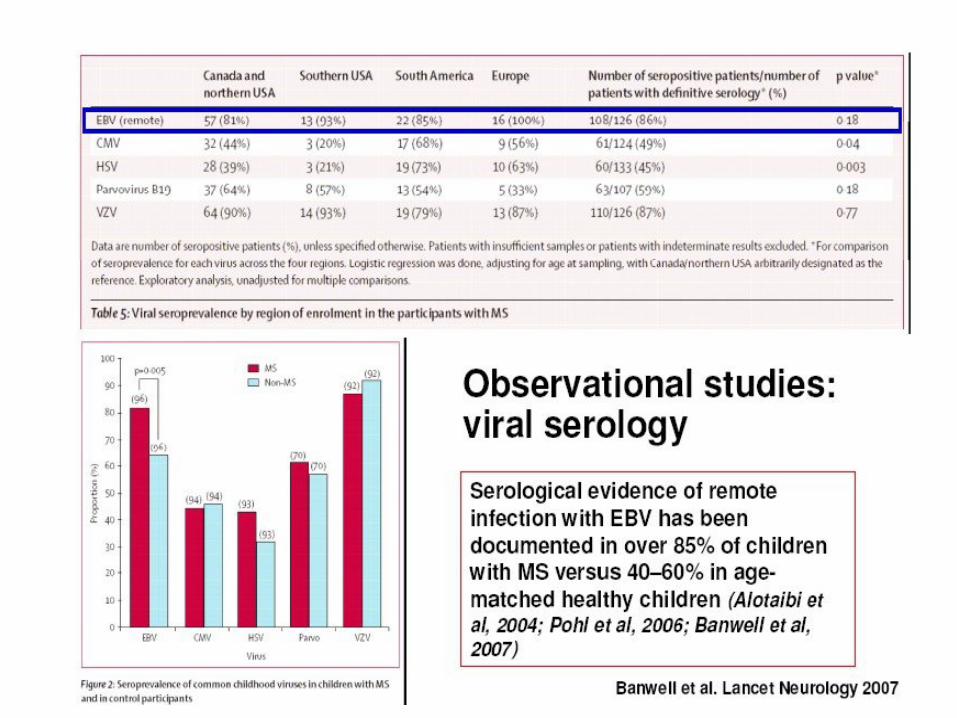
Epstain-Barr Virus Clamydia pneumoniae 1999


• Metanalisi di 14 studi caso-controllo e di coorte(Thacker et al, Ann Neurol 2006)
• I titoli di ATC anti EBVNA1 sono fortemente correlati al rischio di SM (Munger 2011, Ascherio 2012)
Mononucleosi infettiva (EBV) e rischio per SM
Nessuna infezione da EBV
Infezione infantile da EBV senza Mononucleosi Infettiva
Infezione tardiva da EBV con Mononucleosi Infettiva
Eziologia della SM e fattori ambientaliRuolo dell’EBV

EBV e SM: dati liquoraliEBV e SM: dati liquorali
Identificazione nel liquor di IgG reattive alle proteine dell’EBV da parte di 3 gruppi indipendenti:
Rand, J Neurol Sci 2000 Bray Neurology 1992 Cepok, J Clin Invest 2005

EBV e follicoli ectopici di cellule B EBV e follicoli ectopici di cellule B intrameningealiintrameningeali
(Serafini et al., JEM 2007)(Serafini et al., JEM 2007)
Su tessuti di pazienti trovati markers di presenza e attivazione dell’EBV, a livello di follicoli di cellule B submeningeali, specie in pazienti in fase progressiva di malattia
Ipotesi: La persistenza e la periodica riattivazione del virus nel SNC potrebbe giocare un ruolo nella patogenesi della SM

Follicoli ectopici intrameningeali di cellule Besprimono markers dell’EBV
Serafini, 2007Magliozzi, 2007
Dato controverso/non confermato in studi successivi
(Lassman 2010, Owens and Bennet 2012, Tracy, 2012)

Infezioni virali e autoimmunitàInfezioni virali e autoimmunità
Meccanismo dello “spettatore innocente”
Meccanismo di stimolazione superantigenica
Mimetismo molecolare

EZIOLOGIA DELLA SCLEROSI MULTIPLA: FATTORI AMBIENTALIRuolo del fumo
Possibile ruolo del fumo, anche passivo (Mikaeloff, 2007) come
fattore di rischio e fattore modificante il decorso nella SM
(Review article: Fleming and Cook, Neurology 2006)(Review article: Fleming and Cook, Neurology 2006)
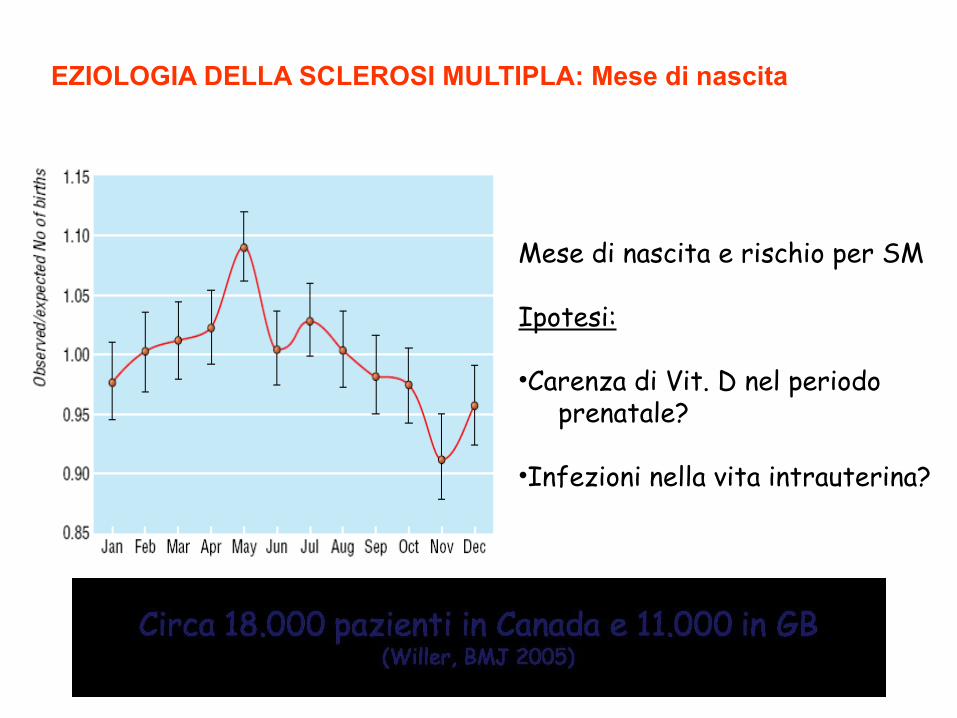
Mese di nascita e rischio per SM
Ipotesi:
•Carenza di Vit. D nel periodo prenatale?
•Infezioni nella vita intrauterina?
EZIOLOGIA DELLA SCLEROSI MULTIPLA: Mese di nascita

Metabolismo della vit. D


Possibile ruolo della vit.Dcome fattore di rischio e fattore modificante
il decorso di malattia
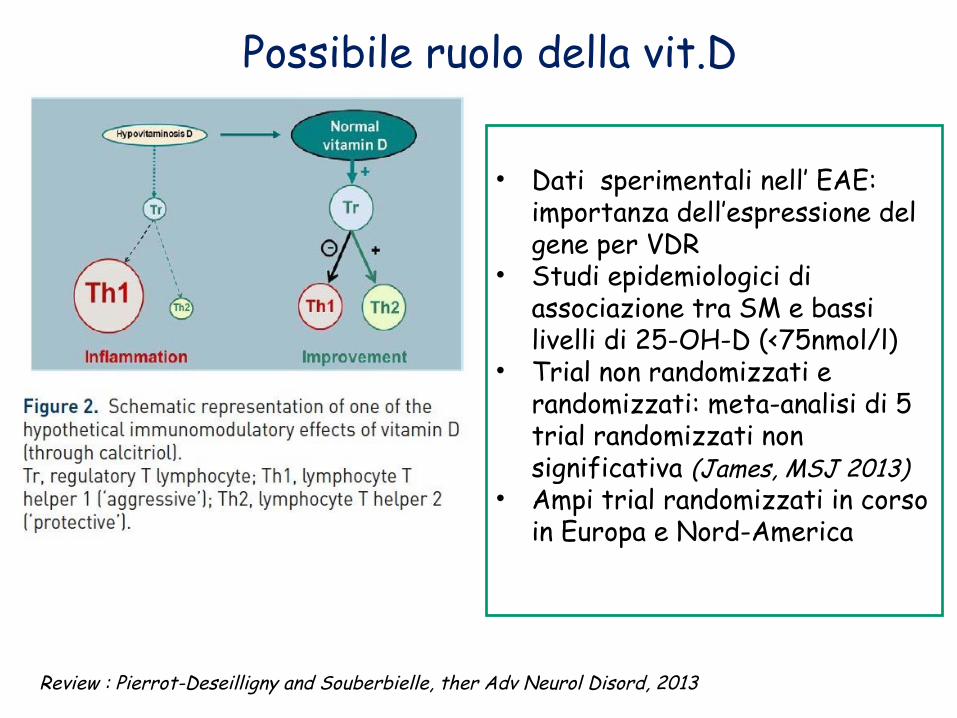
Possibile ruolo della vit.D
• Dati sperimentali nell’ EAE: importanza dell’espressione del gene per VDR
• Studi epidemiologici di associazione tra SM e bassi livelli di 25-OH-D (<75nmol/l)
• Trial non randomizzati e randomizzati: meta-analisi di 5 trial randomizzati non significativa (James, MSJ 2013)
• Ampi trial randomizzati in corso in Europa e Nord-America
Review : Pierrot-Deseilligny and Souberbielle, ther Adv Neurol Disord, 2013
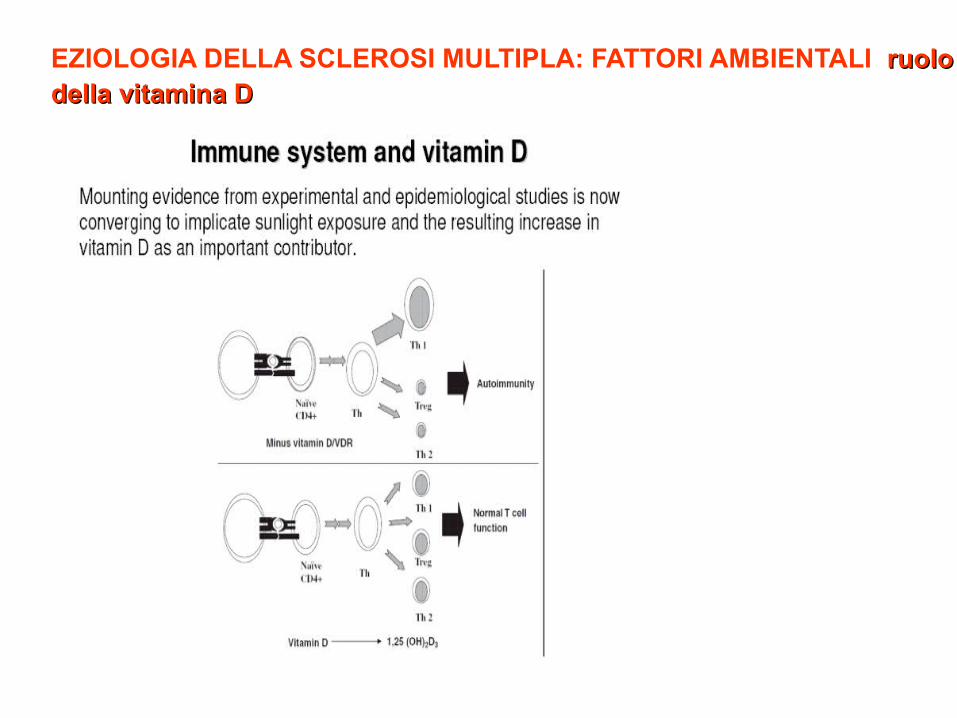
EZIOLOGIA DELLA SCLEROSI MULTIPLA: FATTORI AMBIENTALI ruolo ruolo della vitamina Ddella vitamina D

SM: patogenesi multifattoriale
EPIDEMIOLOGIA DELLA SM

2012

Rapporto F/M in pazienti con SM Rapporto F/M in pazienti con SM Paesi Nord-Europei e Sud-EuropeiPaesi Nord-Europei e Sud-Europei

Rapporto F/M nei pazienti con SM Rapporto F/M nei pazienti con SM stratificati per decorso RR o PPstratificati per decorso RR o PP
Paesi latitudine Nord Paesi Nord-Europei

Agenda
• Ipotesi eziopatogenetiche
• Inquadramento clinico e prognostico


Evidenze (indirette) di patogenesi autoimmune
• Infiltrato linfo-monocitario nelle lesioni• Presenza di bande oligoclonali (IgG) nel liquor• Associazione con ATG HLA, ed altri geni coinvolti
nella risposta immune• Associazione con altre patologie disimmuni• Efficacia delle terapie immunomodulanti e
immunosopppressive• Analogia con modelli sperimentali (EAS)

1. T cell priming (molecular mimicry?)
2. Diapedesis through the endothelium/BBB (effector/memory T cells)
Memory T cellEffector T cell
LFA-1VLA-4
VCAM ICAM
3. Antigen presentation in the CNS4. T cell effector function (production of cytokines, chemokines, B cell help, cytotoxicity)5. Recruitment of non- specific immune cells Cytokine/chemokine gradient6. Demyelination (TNF-, NO, O2 radicals, Ab/C-mediated lysis, cell mediated cytotoxicity, metabolic exhaustion)7. Axonal damage8. Suppression of inflam- mation/remission (apoptosis of activated T cells regulatory/suppressor T cells)9. Remyelination
Naïve T cell
APC
1.2.
Th1
3.
Th1
T cell -B cell interaction4.
Th15.
6.
Microglia
TNF-IFN-IL-2LT-RANTESMIP1-
Plasma cellAb production
Oligodendrocyte & OG-precursor
9.
7.
Th2
ThR
Apoptosis ofactivated cells
8.IL-4IL-10TGF-
Ab
TNF- � � � � O2 radicals
B.Bielekova

Systemic Immune-compartment BBB Central Nervous System
B
T
APC
IL-4IL-6
B
M
Reactivation & Expansion
TH1
TH 2
IL-10TGF-
-
MS immunopathogenesis
autoreactive repertoire
LNSystemic activation
Trafficking
Local reactivationInflammatory cascade
CNS damage
TH17

Anatomia patologica (Charcot, 1848)
Lesione fondamentale:
infiltrato infiammatorio nella SB del SNC
demielinizzazione focale
variabile danno assonale
evoluzione verso la cicatrice gliale
Infiltrato infiammatorioDemielinizzazione/gliosi astrocitaria Danno assonale (transezione)

Lesioni PeriventricolariLesioni Periventricolari Lesione Gd-positivaLesione Gd-positiva
Lesioni Lesioni InfratentorialiInfratentoriali
Lesioni Lesioni JuxtacorticaliJuxtacorticali
Lesione spinale
Sintomi- Localizzazione delle lesioni nella SB

Danno assonale precoce• La transezione assonale è irreversibile e molto abbondante nelle aree di infiammazine (Trapp et al. 1998)
• Il danno assonale acuto progredisce più rapidamente nelle prime fasi di malattia
(Kuhlmann et al. 2002)
Le conseguenze• La perdita assonale oltre la soglia di compensazione
(ridondanza, plasticità) si associa a disabilità irreversibile e progressione clinica di malattia (Rieckmann et al. 2005)
• Importanza della terapia precoce, per prevenire l’accumulo di danno assonale
Trapp et al., NEJM 1998

•Danno assonale cronico in lesioni apparentemente inattive
•Coinvolgimento della sostanza grigia
•Diffuso interessamento della sostanza bianca e grigia «apparentemente normali», al di fuori delle lesioni
INOLTRE
MRIVMTr DTI MRSI FMRIMRI-LV
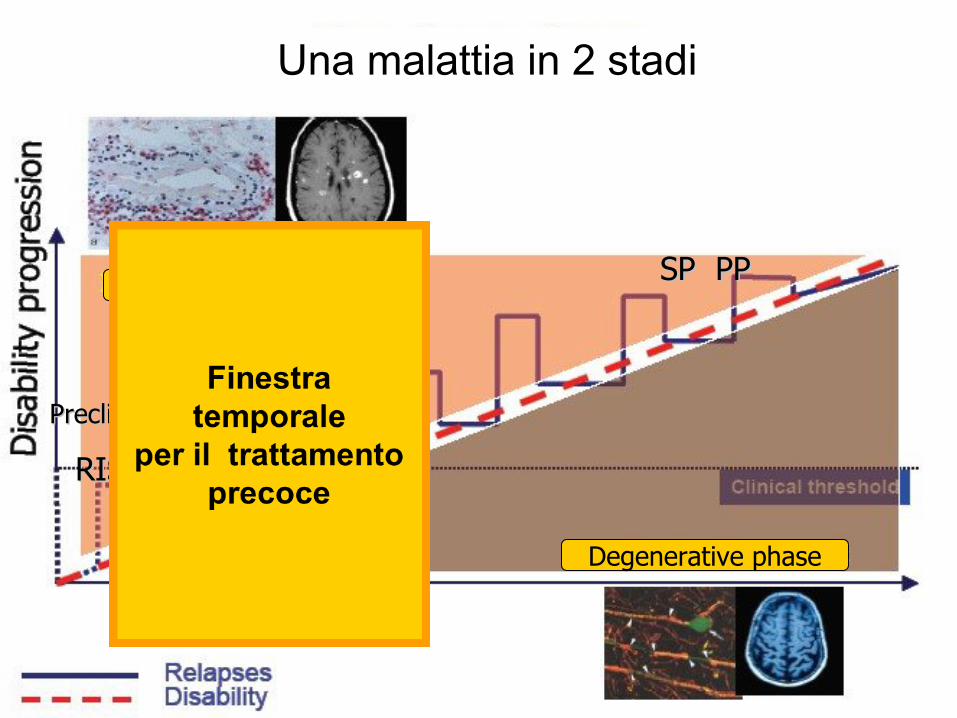
PreclinicalPreclinical
RIS?RIS?
CISCISRRMSRRMS
SP PPSP PPInflammatory phase
Degenerative phase
Una malattia in 2 stadi

MS: Pathological vs. Clinical Course of Disease
Time (Years)
Clinical Threshold
Axonal Loss
Demyelination
First Clinical Attack
Time Window for Early Treatment
Inflammation
Dis
ease
par
amet
er
Relapsing – Remitting Transitional Secondary ProgressiveCISRIS
New Diagnostic Criteria Have Changed the Definition of CIS
0
2.000
4.000
6.000
8.000
10.000
12.000
Active Chronic active edge
Chronic active core
NAWM Control white
11,236
3,138
87517 0,7

TIME IS BRAIN
In MS, irreversible damage leading to disability is silently accumulating, even with the first event and continues to do so, even in the absence of symptoms. Maybe we need a lesson from our stroke colleagues to recognize that in MS ‘time is also brain’, only we measure it in terms of weeks or months instead of seconds or minutes. (Mark S. Freedman)
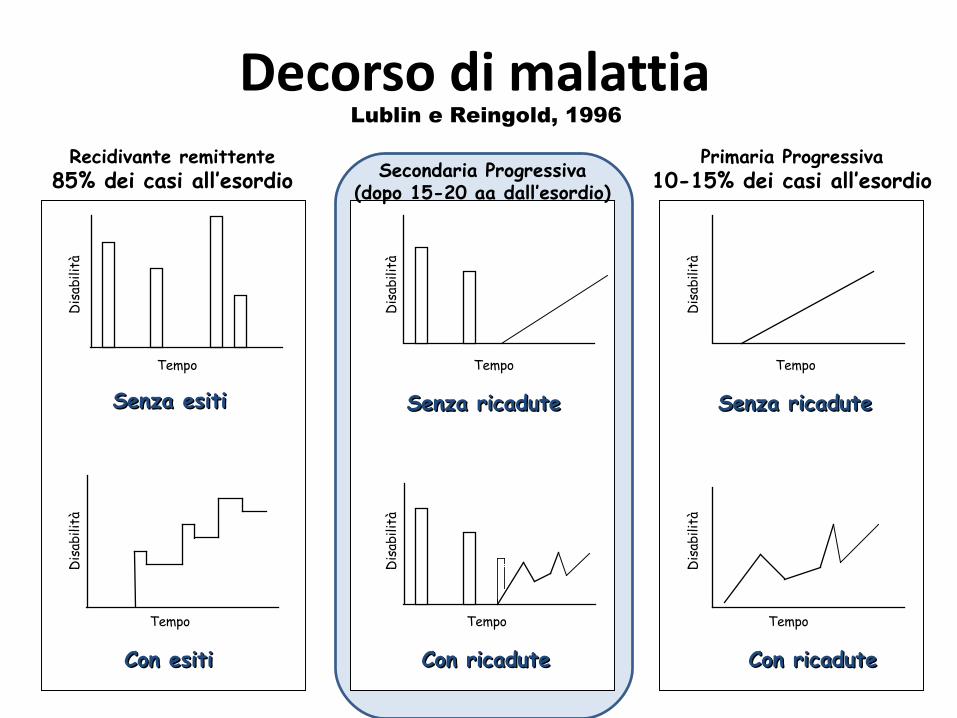
Decorso di malattia
Tempo
Dis
abili
tà
Tempo
Dis
abili
tà
Senza esitiSenza esiti
Con esitiCon esiti
Tempo
Dis
abili
tà
Tempo
Dis
abili
tà
Senza ricaduteSenza ricadute
Con ricaduteCon ricadute
Tempo
Dis
abili
tà
Tempo
Dis
abili
tàSenza ricaduteSenza ricadute
Con ricaduteCon ricadute
Recidivante remittente85% dei casi all’esordio Secondaria Progressiva
(dopo 15-20 aa dall’esordio)
Primaria Progressiva10-15% dei casi all’esordio
Lublin e Reingold, 1996

La misura della disabilità nella SM – Expanded Disability Status Scale-
(Kurtzke, 1983)

PROGRESSIONE DI MALATTIA NON TRATTATA :
50% dei pazienti con RRSM diventa SP in 15-20 aa. dall’esordio
Tremlett et al. Multiple Sclerosis 2008; 14: 314-324
11-15 years from onset
26 years from onset
30 years from onset
• 50% SPMS
•50% need cane
83% need cane
~ 34% restricted on bed
Time from onset to SPMS (years)
Proportion of patients

63Farmaci DMD hanno davvero cambiato la storia della SM?
Ann Neurol 2007

Meccanismi di recuperoMeccanismi di recupero• Risoluzione dell’infiammazione
• Ridistribuzione dei canali del Na+
• Rimielinizzazione a opera di precursori OG
• Rimodellamento assonale
• Plasticità funzionale/Ridondanza del SNC
Meccanismi di progressioneMeccanismi di progressione• Fallimento della rimielinizzazione
• Esaurimento dei precursori OG
• Superamento capacità di recupero/plasticità
• Accumolo di danno assonale irreversibile

Potenziali Evocati Visivi (PEV)Potenziali Evocati Visivi (PEV)
Alterazione caratteristica: aumento di latenza con morfologia conservata


Progressi nella gestione clinica del paziente con SM
Diagnosi più precoce Trattamento preventivo precoce
Migliori conoscenze patogenesi Nuovi targets (Mabs, nuovi orali)
Utilizzo di biomarkers Identificazione non-responders(RM, ATC anti IFN, anti Mabs)
Infiammazione e degenerazione Limiti delle terapie attuali
Importanza dei sintomi per la QdV Terapia sintomatica
Gestione moderna del pazientePresa in carico globale
Approccio multidisciplinareComplessità clinico-assistenziale

SM: UNA MALATTIA IN DUE STADI
Time (Years)
Relapsing – Remitting TransitionalSecondary
ProgressiveCISRIS
INFLAMMATORY ACTIVITY– Relapses– MRI
2° NEURODEGENERATION– Axonal Loss– Atrophy
PROGRESSION
Disease p
arameter

Terapeutic window : different evolution of disability progression according EDSS
Leray E. et al. Brain. 2010 Jul;133(Pt 7):1900-13.
Years since onset
EDSS

Aim of therapy in MS
To Suppress disease activity(Disease Free)
To suppress clinical activity (relapses) and subclinical activity (MRI) with reduction of permanent disability progression
To Increase Adherence/Compliance:•More efficacy•Easy to use/good tolerability
Gasperini et al; Expert Opin Emerg Drugs (2011), 16(4):697

The therapies in MS should be influence both the
inflammation and neurodegeneration
1. Hemmer B and Hartung H-P. Ann Neurol 2007; 2. Confavreux C.et al Clin Neurol Neurosurg 2006; 3. Barkhof F et al. Nat Rev Neurol 2009
The therapies actually used influence only inflammation
Inflammation
MSMS Failure of repair processesneurodegeneration/
demyelination
The new therapies should act directly on the CNS as well as on inflammatory processes1–3

Hartung and colleagues Trends Pharmacol Sci 2003;24:131-8
THE IMMUNOPATHOGENESIS OF MULTIPLE SCLEROSIS: from immunosoppresion to neuroprotection

T Lymphocytes: key roles in MS
CD8: cytotoxic cells
TH1
TH17+++

Pro-inflammatorycytokines
Regulatorycytokines
Activation of APC
APC
Bcells
Tcells
Antibodies
Antigen
MHCII
TCRBCR
Program of Cellular activation
B lymphocytes: not only antibodies
Cellular toxicity
Potent cytokine secretor
Antibodies-dépendentCellular toxicity
Ab and complement

patient
• Interferone• Glatiramer acetato
First line
• Natalizumab• Fingolimod• Mitoxantrone
Second Line
• BG 12• Teriflunomide• Alemtuzumab• Daclizumab• Ocrelizumab
Sperimentali
Clinical beneficial
Current vs future therapies
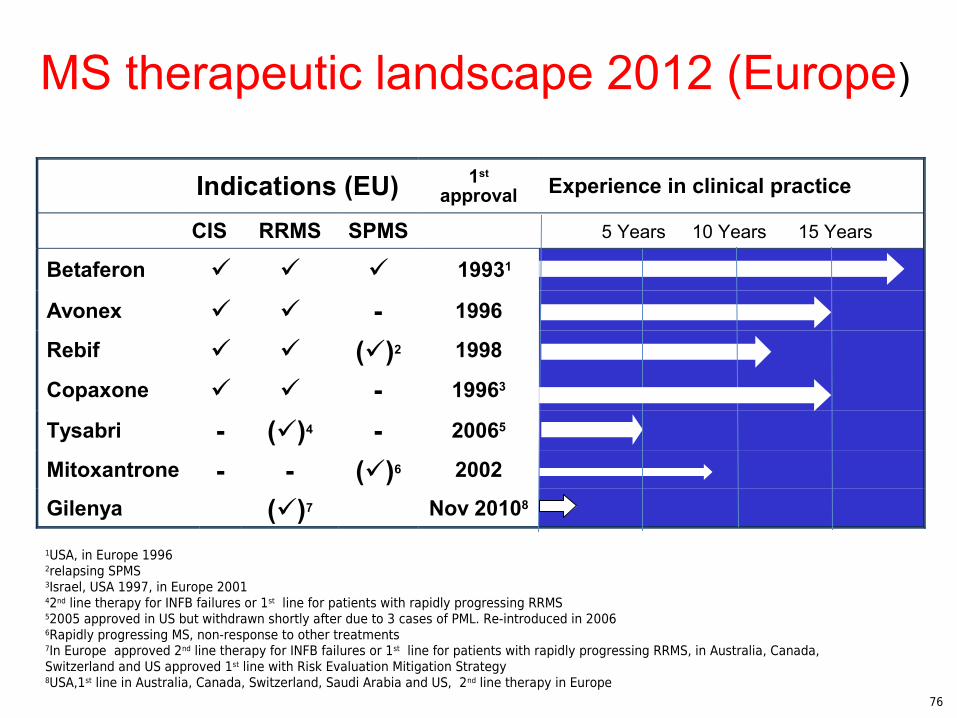
MS therapeutic landscape 2012 (Europe)
Indications (EU) 1st approval Experience in clinical practice
CIS RRMS SPMS 5 Years 10 Years 15 Years
Betaferon 19931
Avonex - 1996
Rebif ()2 1998
Copaxone - 19963
Tysabri - ()4 - 20065
Mitoxantrone - - ()6 2002
Gilenya ()7 Nov 20108
1USA, in Europe 19962relapsing SPMS3Israel, USA 1997, in Europe 200142nd line therapy for INFB failures or 1st line for patients with rapidly progressing RRMS52005 approved in US but withdrawn shortly after due to 3 cases of PML. Re-introduced in 20066Rapidly progressing MS, non-response to other treatments7In Europe approved 2nd line therapy for INFB failures or 1st line for patients with rapidly progressing RRMS, in Australia, Canada, Switzerland and US approved 1st line with Risk Evaluation Mitigation Strategy8USA,1st line in Australia, Canada, Switzerland, Saudi Arabia and US, 2nd line therapy in Europe
76

We broadly classify available treatments in 1st and 2nd line agents
• First-line agents• Well established benefit/risk profiles
over the short and long-term• Are ideally used earlier in the course
of the disease
• Second-line agents• Benefit/risk profiles not fully
established• Generally a stronger impact on the
immune system than first-line agents, e.g. immunosuppressive properties
• Safety concerns
Categorization according to European prescribing information *1st line for patients with rapidly progressing RRMS1. Weinshenker et al, Brain 1989; 112: 1419-1428 77
When making treatment decisions, we should keep in mind: MS often progresses over several decades1 and thus MS management requires a long-term approach

Characteristics of the first-line agents IFNB and glatiramer acetate (GA)
• Broad datasets available from many controlled studies as well as various clinical settings, support their use in MS – from CIS to approximately 20 years of treatment
They reduce:The frequency and severity of relapses
The development of new brain lesions (MRI)
The development of disability progression
Treatment needs to start early and therapy needs to be maintained over the long run
Safety profiles are well established
IFNB Study group 1993, 1995; Kappos et al. 2001, 2006, 2007, 2009; Jacobs et al. 1996, 2000; PRISMS Study group 1998, 2001; Johnson et al. 1995; Comi et al. 2009; Ebers et al. 2009; Reder et al. 2010; Kappos et al. 2006; Ford et al. 2010 78

Prevenzione ricadute DMDs: IM e IS
CIS RR SP
Riduzione della progressione della disabilità
(agenti neuroprotettivi, strategie di rigenerazione?)
Terapia in relazione al decorsoTerapia in relazione al decorso
Recuperodalla ricaduta:
MP ev; PE
Terapia sintomatica
Terapia sintomatica

Escalating versus InductionEscalating versus InductionImmunotherapy in MSImmunotherapy in MS

Recommendations for MS treatments
1st line1st line
2nd line2nd line
3rd line3rd line
4th line4th line
FTY/Natalizumab/MITOFTY/Natalizumab/MITO(ciclofosfamide)(ciclofosfamide)
Combo-therapyCombo-therapy
Alemtuzumab? Alemtuzumab?
BMTBMT
Beta-IFN/Glatiramer acetateBeta-IFN/Glatiramer acetate(azatioprina)(azatioprina)
Modificato da Multiple Sclerosis Therapy Consensus Group
Escalation therapy
Steroid therapy for Relapses
InductionInduction

Systemic Immune-compartment BBB Central Nervous System
B
T
APC
IL-4IL-6
B
M
Reactivation & Expansion
TH1
TH 2
IL-10TGF-
-
MS immunopathogenesis
autoreactive repertoire
LNSystemic activation
Trafficking
Local reactivationInflammatory cascade
CNS damage
TH17

Nuove prospettive terapeuticheNuove prospettive terapeuticheNuove prospettive terapeuticheNuove prospettive terapeuticheTERAPIE TERAPIE
ORALIORALIANTICORPIANTICORPI
MONOCLONALIMONOCLONALI

RCT
Pazienti con la patologia Z
Farmaco X efficace
Campione in studio
Pazienti con la patologia Z
Validità esterna livello 1
?
Validità esterna livello 2
•RCT non fornisce la risposta finale sugli effetti del farmaco nella “vita reale”•Non può evidenziare effetti indesiderati rari
Trial clinico Randomizzato Controllato di Fase 3limiti

«Complessità terapeutica» il farmaco giusto al paziente giusto
nel momento giusto
Caratteristiche del paziente e della patologia
Caratteristiche della terapia
Preferenze del paziente
Fattori geografici ed economici
• Età, sesso• Attività di malattia• Fattori prognostici• Storia di trattamento• Comobormidà
• Efficacia• Sicurezza• Tollerabilità• Somministrazione (via/frequenza)• Monitoraggio• Biomarkers
• Profilo socio-demografico (stile di vita, lavoro, famiglia)
• Propensione al rischio• Convenienza somministrazione• Aderenza
• Approvazione• Rimborso/accesso al farmaco
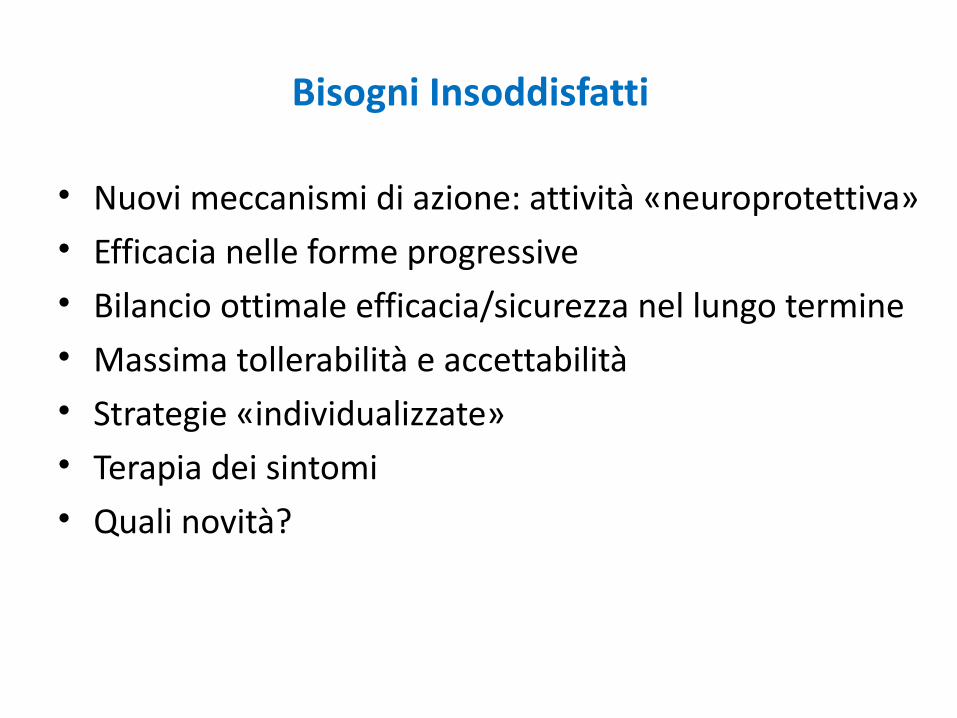
Bisogni Insoddisfatti
• Nuovi meccanismi di azione: attività «neuroprotettiva» • Efficacia nelle forme progressive• Bilancio ottimale efficacia/sicurezza nel lungo termine• Massima tollerabilità e accettabilità• Strategie «individualizzate»• Terapia dei sintomi• Quali novità?

2012201219951995
Terapie attuali Trattamenti futuri
20152015
TeriflunomideTeriflunomideTeriflunomideTeriflunomide
Orale
Multiple Sclerosis: pipelineMultiple Sclerosis: pipelineMultiple Sclerosis: pipelineMultiple Sclerosis: pipeline
AvonexAvonex(IFN beta-1a)(IFN beta-1a)
AvonexAvonex(IFN beta-1a)(IFN beta-1a)
RebifRebif(IFN beta 1-a)(IFN beta 1-a)
RebifRebif(IFN beta 1-a)(IFN beta 1-a)
CopaxoneCopaxone(Glat Acet)(Glat Acet)CopaxoneCopaxone(Glat Acet)(Glat Acet)
NovantroneNovantrone(Mitoxantrone(Mitoxantrone))NovantroneNovantrone
(Mitoxantrone(Mitoxantrone)) TysabriTysabri(Natalizumab)(Natalizumab)
TysabriTysabri(Natalizumab)(Natalizumab)
BetaferonBetaferon(IFN beta-1b)(IFN beta-1b)BetaferonBetaferon
(IFN beta-1b)(IFN beta-1b)ExtaviaExtavia
(IFN beta-1b)(IFN beta-1b)ExtaviaExtavia
(IFN beta-1b)(IFN beta-1b) LaquinimodLaquinimodLaquinimodLaquinimod
BG 12BG 12(Fumarate)(Fumarate)
BG 12BG 12(Fumarate)(Fumarate)
DaclizumabDaclizumabDaclizumabDaclizumab
RituximabRituximab
Ocrelizumab Ocrelizumab
RituximabRituximab
Ocrelizumab Ocrelizumab
AlemtuzumabAlemtuzumabAlemtuzumabAlemtuzumab
Auto-iniettabile Endovena
GilenyaGilenya(Fingolimod)(Fingolimod)
GilenyaGilenya(Fingolimod)(Fingolimod)

CLADRIBINACLADRIBINAAnalogo delle purine
Influenza la sintesi del DNA e il metabolismo cellulare soprattutto a
livello dei linfociti T
Mielosoppressione (dose-dipendente)
Infezioni opport.
Fase III
CLARITY (ext)
ONWARD
ORACLE
FINGOLIMODFINGOLIMODAgonista del recettore
delle sfingosine
Blocca il traffico dei linfociti T che rimangono
intrappolati nei linfonodi
Bradicardia
Ipertensione arteriosa
Ostruzione vie aeree
Encefalite HSV-1
Infezione da VZV
Neoplasie cutanee
Fase III
FREEDOMS
TRANSFORMS
INFORMS
X
Terapie Orali/1

TERIFLUNOMIDETERIFLUNOMIDE Inibitore della sintesi delle pirimidine
Metabolita attivo della Leflunomide
Effetto antiproliferativo
Nasofaringiti, artralgie
AlopeciaNausea, diarrea, ↑ ALT
Fase III
TEMSO
Add-on
IFN beta, GA
BG-12BG-12 Composto intermedio del ciclo di Krebs
Induce shift TH-1•TH-2
Effetto neuroprotettivo
Flushing,
Disturbi gastroenterici
Dolori muscolari
Cefalea
Fase III
CONFIRM
DEFINE
LAQUINOMIDELAQUINOMIDE Derivato della Linomide
Probabilmente induce shift TH-1•TH-2
Potenziale epatotossicità
Dispepsia
Edemi declivi
Fase III
BRAVO
ALLEGRO
Terapie Orali/2
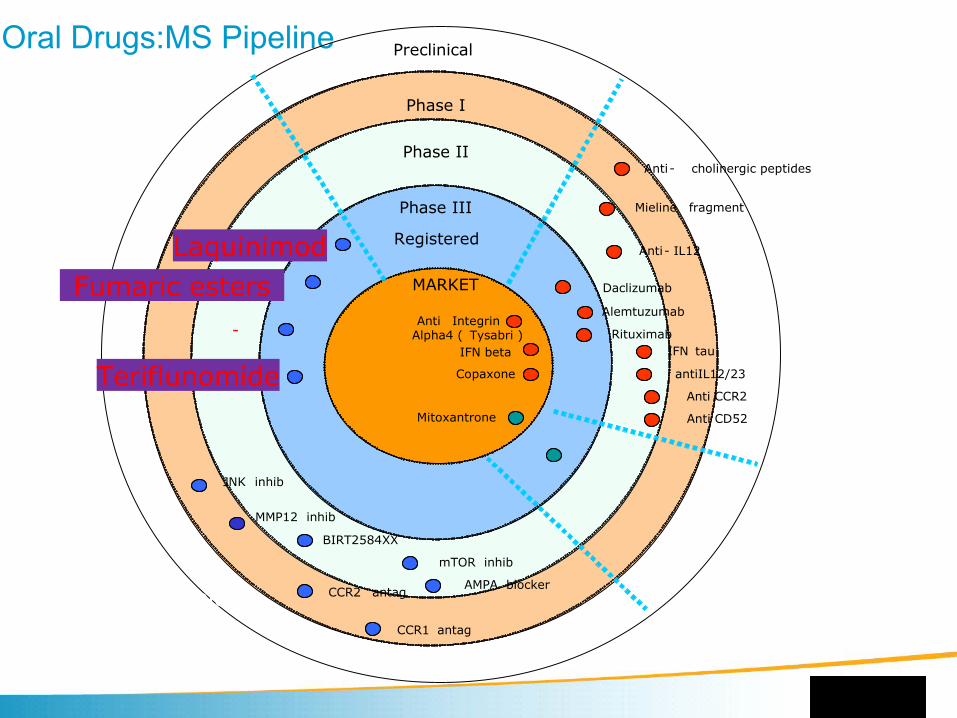
Oral Drugs:MS Pipeline Preclinical
Phase I
Phase II
Phase III
Registered
MARKET Protein - basedtherapeutcs
IFN beta
Anti IntegrinAlpha4 ( Tysabri )
Copaxone
Mitoxantrone
Rituximab
Anti- IL12
IFN tau
Mieline fragment
antiIL12/23
Daclizumab
Anti CCR2
Anti CD52
Anti- cholinergic peptides
BIRT2584XX
mTOR inhib
AMPA blockerCCR2 antag
JNK inhib
Teriflunomide
-
Fumaric estersLaquinimod
CCR1 antag
MMP12 inhib
Alemtuzumab
New oral treatments

Analogo sintetico di una sostanza naturale (“miriocina”) estratta da un fungo (Isaria sinclairii)
Fingolimod Gilenya ®
Fujita et al. J Antibiot 1994;47:208–15
NH2
HO
HO
HCl

Fingolimod è un analogo strutturale della sfingosina
La sua struttura chimica è molto simile a quella della sfingosina, uno sfingolipide naturale delle cellule di mammifero che viene fosforilato all'interno della cellula e che agisce
• tramite specifici recettori accoppiati alla proteina G (recettori S1P).
OH
N H2
O H
Sphingosine
O H
OH
N H2Fingolimod

Fingolimod inibisce la fuoriuscita dei linfociti dai linfonodi
Fingolimod determina:• Internalizzazione del
recettore S1P1
• Inibizione della fuoriuscita dei linfociti
Fingolimod
Linfa efferente
Linfonodo
[S1P] alto
[S1P] basso
Vaso sanguigno
X
Fingolimod trattiene i linfociti circolanti nei linfonodi riducendone la conta
periferica e la loro circolazione nei siti di infiammazione nel SNC
All’interno dei linfonodi comunque I linfociti rimangono attivi e capaci di
partecipare alla risposta immunitaria
Recettore S1P1
Linfocita
Linfa afferente
Espansione clonale

… trattenendo solo i linfociti che transitano regolarmente dagli organi linfatici…..
Tipi di linfocititrattenuti da fingolimod
Tipi di linfocitirisparmiati da fingolimod
TessutoCCR7+
CCR7-
In circolo:• Linfociti T naïve
Tn (CCR7+ CD45RA+)• Linfociti T centrali della
memoria (compresi TH17)
TCM (CCR7+ CD45RA-)• Linfociti B
X
Blood(10x109)
Maggiormente residenti nel sangue/tessuti:
• Linfociti T effettori della memoria
TEM (CCR7- CD45RA-)
TEMRA (CCR7- CD45RA+)
Linfonodi(190×109)
Sangue<2% dei linfociti totali
(10×109)

… l’effetto sui linfociti è reversibile
R Schmoulder et al. Pharmacodynamic effects of oral fingolimod (FTY720). Poster presentato all’ECTRIMS 2006
0.0
1.2
1.4
1.6
1.8
2.0
Giorni
1.0
0.8
0.6
0.4
0.2Con
ta li
nfoc
itaria
ass
olut
a (1
09/l)
Settimane
0 1 2 3 5 7 2* 3* 4* 5 10 15 16 20
Interruzione del
trattamento
Fine dello studio
Processo reversibile: recupero del livello di
normalità in 4-6 settimane dopo
l’interruzione del trattamento
Fingolimod 0,25 mg
Fingolimod 0,5 mg
Fingolimod 1,0 mg
Fingolimod 2,5 mg
*Due esami nei mesi 2, 3 e 4
Processo rapido: la conta linfocitaria si riduce in 4-6 ore e
raggiunge il nadir dopo 1-2 settimane
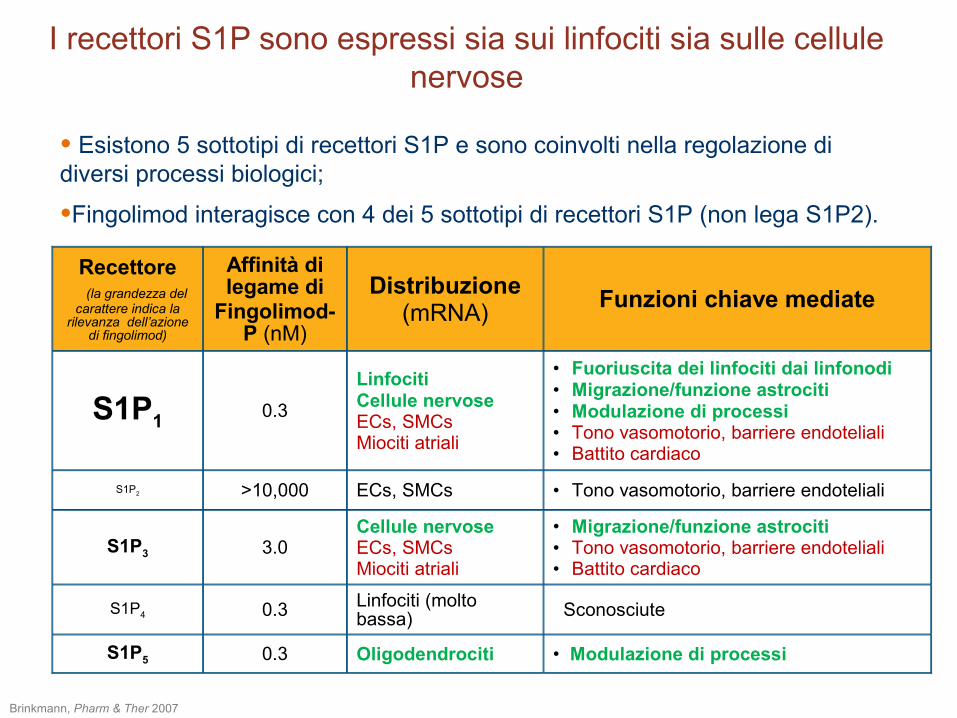
Recettore (la grandezza del carattere indica la
rilevanza dell’azione di fingolimod)
Affinità di legame di
Fingolimod-P (nM)
Distribuzione(mRNA)
Funzioni chiave mediate
S1P10.3
LinfocitiCellule nervoseECs, SMCs Miociti atriali
• Fuoriuscita dei linfociti dai linfonodi• Migrazione/funzione astrociti• Modulazione di processi• Tono vasomotorio, barriere endoteliali• Battito cardiaco
S1P2 >10,000 ECs, SMCs • Tono vasomotorio, barriere endoteliali
S1P3 3.0Cellule nervoseECs, SMCsMiociti atriali
• Migrazione/funzione astrociti• Tono vasomotorio, barriere endoteliali• Battito cardiaco
S1P4 0.3 Linfociti (molto bassa) Sconosciute
S1P5 0.3 Oligodendrociti • Modulazione di processi
I recettori S1P sono espressi sia sui linfociti sia sulle cellule nervose
• Esistono 5 sottotipi di recettori S1P e sono coinvolti nella regolazione di diversi processi biologici;
•Fingolimod interagisce con 4 dei 5 sottotipi di recettori S1P (non lega S1P2).
Brinkmann, Pharm & Ther 2007

• Fingolimod, grazie alla sua natura lipofila, attraversa la barriera emato-encefalica e raggiunge il sistema nervoso centrale
• Le cellule nervose (neuroni, astrociti, oligodendrociti, microglia) esprimono recettori S1P
• Studi preclinici suggeriscono un potenziale “neuroprotettivo”
Fingolimod ha azione diretta sui recettori S1P nel sistema nervoso centrale
Oligodendrocita(S1P5>1=2>3)
Microglia(S1P1>2>3=5)
Neurone (S1P1=3>2=5)
AstrocitaAstrocita (S1P3>1>2>5)
OPC: S1P1>S1P5>S1P3OLG: S1P5>S1P1>S1P3
Guaina
mielinica
E’ in corso uno studio con fingolimod sulle forme PPE’ in corso uno studio con fingolimod sulle forme PP

Mat
eria
le r
iser
vato
ad
escl
usiv
o us
o de
l pro
gett
o Q
uest
ione
di S
osta
nza
Naïve-WT EAE-WT EAE-S1P1- / - EAE-WT +fingolimod
Immunolabelling S1P1 present S1P1 present S1P1 absent on CNS cells
S1P1 present
Anti-GFAPAstrogliosis
FluoromyelinMyelination
Anti-neurofilamentAxonal staining
Fingolimod nel modello dell’ EAE preserva l’integrità del tessuto cerebrale
Histological data is from analysis of a slice of ventral lumbar spinal cord. Reproduced with permission. Choi JW, et al. Proc Natl Acad Sci U S A 2011;108(2):751-6
In these animals the disease severity was reduced
+
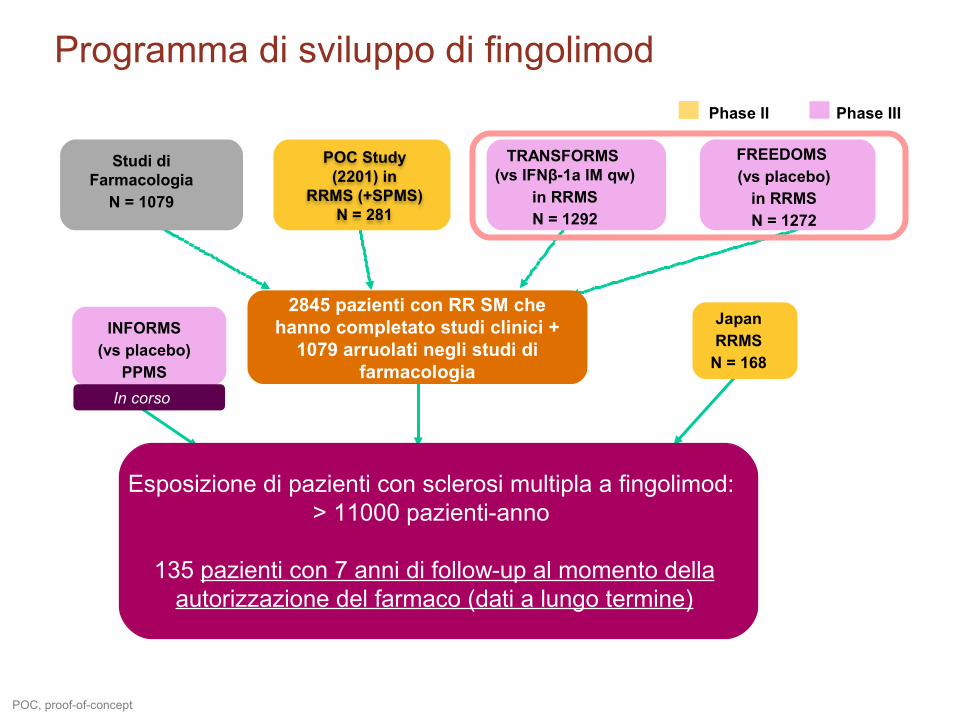
POC, proof-of-concept
JapanRRMS
N = 168
INFORMS(vs placebo)
PPMSN ~ 900In corso
Esposizione di pazienti con sclerosi multipla a fingolimod: > 11000 pazienti-anno
135 pazienti con 7 anni di follow-up al momento della autorizzazione del farmaco (dati a lungo termine)
2845 pazienti con RR SM che hanno completato studi clinici +
1079 arruolati negli studi di farmacologia
Phase II Phase III
POC Study(2201) in
RRMS (+SPMS)N = 281
FREEDOMS (vs placebo)
in RRMSN = 1272
TRANSFORMS (vs IFNβ-1a IM qw)
in RRMSN = 1292
Studi di Farmacologia
N = 1079
Programma di sviluppo di fingolimod

FREEDOMS (FTY720 Research Evaluating Effectsof Daily Oral therapy in Multiple Sclerosis)

Negative binomial regression model adjusted for treatment group, country, number of relapses in previous two years and baseline Expanded Disability Status Scale as covariates
0,160,18
0,40
0
0,1
0,2
0,3
0,4
Tas
so a
nnua
lizza
to d
i ric
adut
a
Placebo (n = 418)
Fingolimod 0,5 mg(n = 425)
Fingolimod 1,25 mg(n = 429)
−54% vs. placebop < 0,001
`
−60% vs. placebop < 0,001
ARR ridotto sia nei pazienti naïve sia nei pazienti precedentemente trattati (p < 0,01 per tutti i confronti)
FREEDOMS : tasso annualizzato di ricaduta

Fingolimod 1,25 mg vs placebo, HR = 0,68 p = 0,017
Fingolimod 0,5 mg vs placebo, HR = 0,70 p = 0,024
0
5
10
15
20
25
30
0 90 180 270 360 450 540 630 720
Tempo (giorni)
Per
cent
uale
di p
azie
nti c
on p
rogr
essi
one
di
disa
bilit
à so
sten
uta
a 3
mes
i
Fingolimod 1,25 mg
Fingolimod 0,5 mg
Placebo
Riduzione della progressione della disabilità di circa il 30% vs placebo
24,1%
17,7%
16,6%
Kappos et al. NEJM 2010;362(5):387–401
FREEDOMS Progressione della disabilità sulla EDSS confermata a 3 mesi
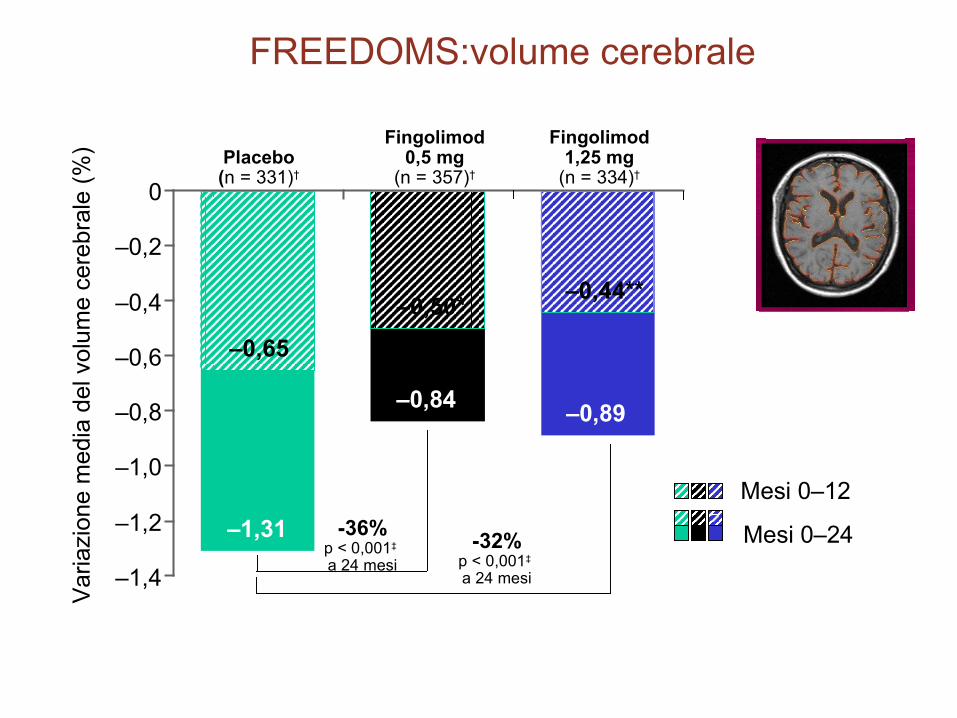
Mesi 0–24
Mesi 0–12
Fingolimod1,25 mg
(n = 334)†
–1,4
–0,84–0,89
–1,2
–1,0
–0,8
–0,6
–0,4
–0,2
0
–0,65
–0,50*–0,44**
–1,31
Placebo(n = 331)†
Fingolimod0,5 mg
(n = 357)†
Var
iazi
one
med
ia d
el v
olum
e ce
rebr
ale
(%)
-36%p < 0,001‡ a 24 mesi
-32%p < 0,001‡ a 24 mesi
FREEDOMS:volume cerebrale

TRANSFORMS TRial Assessing injectable interferoN vS FTY720 Oral in RRMS)

Ta
ss
o a
nn
ua
lizz
ato
di
ric
ad
uta
IFN-β-1a IM (n = 431)
Fingolimod 0,5 mg(n = 429)
Fingolimod 1,25 mg(n = 420)
−52% vs IFN-β-1a
p < 0,0001
−38% vs IFN-β-1a
p = 0,0004
TRANSFORMS: tasso annualizzato di ricaduta
Popolazione ITT. Modello di regressione binomiale negativa aggiustato per le covariate: gruppo di trattamento, nazione, numero di recidive nei 2 anni precedenti al basale e punteggio EDSS al basale; recidive confermate; p = 0,159 per fingolimod 0,5 vs. 1,25 mg
0,20
0
0,1
0,2
0,3
0,4
Riduzione del tasso annualizzato di ricaduta superiore al 50% al dosaggio di 0.5 mg rispetto a IFN-β-1a
0,200,16
0,33
Cohen et al. NEJM 2010;362(5);402–15

IFNβ-1a IM Fingolimod orale
(n = 431)0,5 mg
(n = 429)1,25 mg (n = 420)
Pazienti senza progressione di disabilità confermata a 3 mesi, %
(IC 95%)‡
92,1 (89,4, 94,7)
94,1 (91,8, 96,3)
p = 0,25
93,3 (90,9, 95,8)
p = 0,50
Variazione a 12 mesi rispetto al basale
EDSS* score, media ± DS +0,01 ± 0,78 –0,08 ± 0,79p = 0,06
–0,11 ± 0,90p = 0,02
TRANSFORMS : disabilità

Analysis included patients with available magnetic resonance imaging (MRI) scansGd+, gadolinium-enhancing; IFNβ-1a IM, interferon β-1a intramuscularlyCohen et al. NEJM 2010;362(5);402–15
0.14
0.23
0.51
0
0.1
0.2
0.3
0.4
0.5
0.6
Mea
n nu
mbe
r
Fingolimod 0,5 mg
(n = 374)
Fingolimod 1,25 mg(n = 352)
IFNβ-1a IM(n = 354)
Numero di lesioni Gd+ a 12 mesi
0
2.6
1.7 1.5
0.5
1.0
1.5
2.0
2.5
Mea
n nu
mbe
r
Fingolimod 0,5 mg
(n = 372)
Fingolimod 1,25 mg(n = 350)
IFNβ-1a IM(n = 361)
Numero di lesioni in T2 nuove/aumentate di volume a 12 mesi
3.0 − 35% vs IFN-β-1ap = 0,004
−42% vs IFN-β-1ap < 0,001
− 55% vs IFN-β-1ap < 0,001
− 73% vs IFN-β-1ap < 0,001
Entrambi i dosaggi di fingolimod riducono l’attività di malattia alla RM in confronto a IFN-β-1a
TRANSFORMS : attività alla risonanza magnetica
Mat
eria
le r
iser
vato
ad
escl
usiv
o us
o de
l pro
gett
o Q
uest
ione
di S
osta
nza
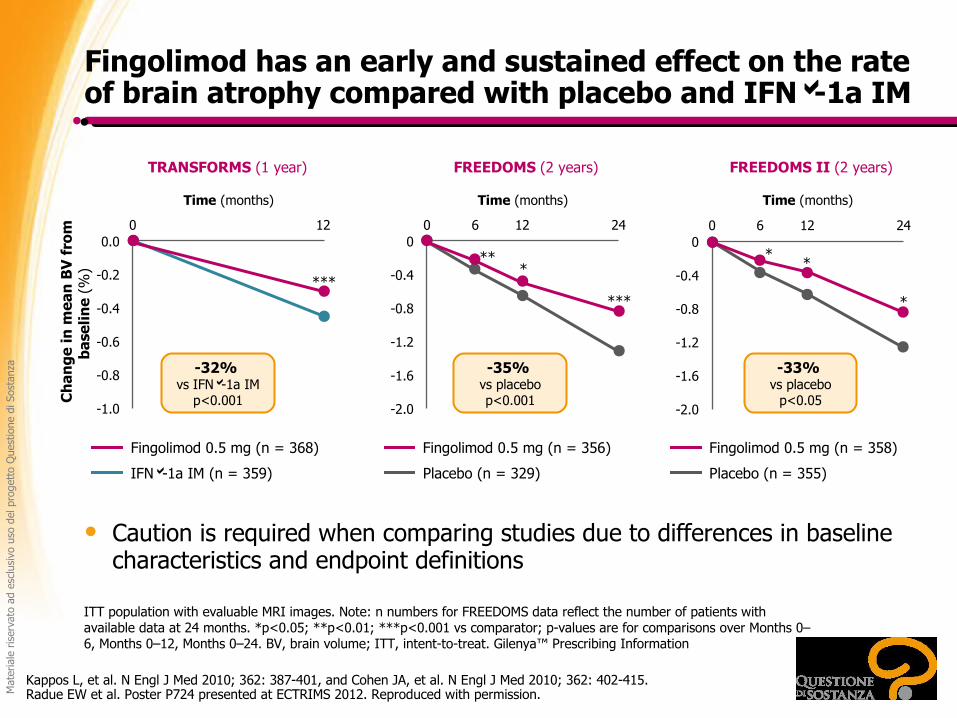
Kappos L, et al. N Engl J Med 2010; 362: 387-401, and Cohen JA, et al. N Engl J Med 2010; 362: 402-415.Radue EW et al. Poster P724 presented at ECTRIMS 2012. Reproduced with permission.
ITT population with evaluable MRI images. Note: n numbers for FREEDOMS data reflect the number of patients with available data at 24 months. *p<0.05; **p<0.01; ***p<0.001 vs comparator; p-values are for comparisons over Months 0–6, Months 0–12, Months 0–24. BV, brain volume; ITT, intent-to-treat. Gilenya™ Prescribing Information
Fingolimod has an early and sustained effect on the rate of brain atrophy compared with placebo and IFN-1a IM
Caution is required when comparing studies due to differences in baseline characteristics and endpoint definitions
FREEDOMS (2 years)
60 12 24
Time (months)
0
-0.4
-0.8
-1.2
-1.6
-2.0
TRANSFORMS (1 year)
0 12
Time (months)
0.0
-0.4
-0.6
-1.0
-32% vs IFN-1a IM
p<0.001
-0.2
-0.8
Ch
ang
e in
mea
n B
V f
rom
b
asel
ine
(%)
FREEDOMS II (2 years)
-0.4
-0.8
-1.2
-1.6
-2.0
60 12 24
Time (months)
0
******
***
*
**
-35% vs placebop<0.001
-33% vs placebo
p<0.05
Fingolimod 0.5 mg (n = 368)
IFN-1a IM (n = 359)
Fingolimod 0.5 mg (n = 356)
Placebo (n = 329)
Fingolimod 0.5 mg (n = 358)
Placebo (n = 355)

Fingolimod –solo la dose 0.5 mg -- è indicato come monoterapia disease-modifying nella SMRR ad elevata attività nei seguenti gruppi
di pazienti adulti:
Pazienti con un’elevata attività di malattia nonostante la terapia con interferone-beta. (non rispondenti a terapie di prima linea)
oppure
Pazienti con sclerosi multipla recidivante-remittente grave ad evoluzione rapida,
Indicazione approvata da EMA

Fingolimod: Fingolimod: sicurezza e tollerabilitàsicurezza e tollerabilità

Endotelio Vascolare
Miociti atriali
Muscolatura bronchiale liscia
Muscolatura vascolare liscia
Riduzione della frequenza cardiaca
Conduzione atrio-ventricolare
Vasodilatazione
Resistenza delle vie aeree
Tono vascolare
S1P3 (S1P1 nell’uomo?)
S1P3 (S1P1, S1P2?)
S1P3 / S1P1?
S1P3 (S1P1, S1P2?)
Angiogenesi
Aumento della barriera endoteliale
Diminuzione della barriera endoteliale
S1P1
S1P3
S1P1
Fingolimod ha affinità per 4 sottotipi dei recettori S1P (S1P1, S1P3, S1P4, S1P5)
Il profilo di tollerabilità di fingolimod dipende dalla sua farmacodinamica

• Eventi avversi più importanti in pazienti trattati con fingolimod:– Edema maculare: incidenza 0,2% con fingolimod 0,5 mg/die, (10 dei 13 casi
nei primi 4 mesi di esposizione, regressione/remissione all’interruzione del trattamento)
– Incremento del livello ematico di transaminasi: incremento reversibile e asintomatico di ALT >3×ULN nell’8% dei pazienti trattati con fingolimod 0,5 mg. Nessun caso di danno epatico permanente.
– Lieve incremento della pressione arteriosa: 1,1 mm Hg per fingolimod 0,5 mg/die a 2 anni
– Bradicardia: riduzione transitoria della frequenza cardiaca alla prima somministrazione di farmaco; nadir alla 4ª-5ª ora con diminuzione di 7-8 bpm con fingolimod 0,5 mg/die Bradicardia sintomatica <0,5% (3 casi) con fingolimod 0,5 mg/die.
Blocco AV di I grado nel 4,8% dei pazienti trattati con fingolimod 0,5 mg/die; blocco AV II grado nello 0,2% dei pazienti trattati con fingolimod 0,5 mg/die.
necessità di somministrare la prima dose in ospedale con monitoraggio PA, frequenza cardiaca ed ECG per almeno 6 ore
Il profilo di tollerabiltà di fingolimod(studi FREEDOMS E TRANSFORMS)

– Neoplasie cutanee :?? Controllo dermatologico con mappatura dei nei “a rischio” prima del trattamento, successivi controlli
– Infezioni
– 2 casi di infezioni herpetiche fatali nei CTs: 1 caso di priminfezione da VZ disseminata (epatite fulminante) e 1 di encefalite herpetica, entrambi nel gruppo ad alte dosi
• Solo la bassa dose (0.5 mg)è stata commercializzata
• Necessità di eseguire sierologia per VZ e, se negativa, vaccinazione per VZ un mese prima di iniziare la terapia
Il profilo di tollerabiltà di fingolimod(studi FREEDOMS E TRANSFORMS)
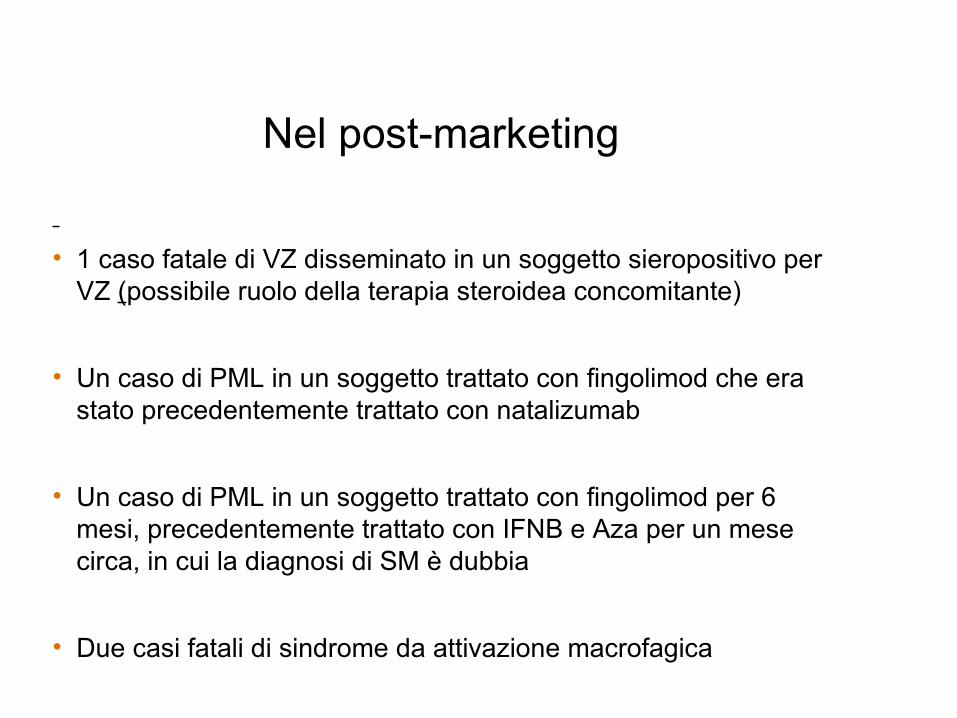
• 1 caso fatale di VZ disseminato in un soggetto sieropositivo per VZ (possibile ruolo della terapia steroidea concomitante)
• Un caso di PML in un soggetto trattato con fingolimod che era stato precedentemente trattato con natalizumab
• Un caso di PML in un soggetto trattato con fingolimod per 6 mesi, precedentemente trattato con IFNB e Aza per un mese circa, in cui la diagnosi di SM è dubbia
• Due casi fatali di sindrome da attivazione macrofagica
Nel post-marketing

Gravidanza
• FDA: categoria C
• In studi sull’animale il farmaco è risultato teratogeno (azione sull’angiogenesi).
• E’ consigliato eseguire test gravidico prima dell’inizio della terapia
• E’ consigliato un metodo contraccettivo durante la terapia
• In caso di gravidanza programmata è consigliato wash out per almeno 2 mesi
– Rebound alla sospensione?
• E’ stato istituito un registro delle gravidanze

Raccomandazioni per l’utilizzo di fingolimod nella pratica clinica
BradiaritmiaOsservazione della prima somministrazione di farmaco per tutti i pazienti (prime 6 ore). In caso di bradiaritmia, i pazienti devono essere mantenuti in osservazione fino a scomparsa dei sintomi. Richiesta una valutazione cardiologica prima dell‘inizio del trattamento in pazienti a rischio; Non utilizzo del farmaco in pts in trattamento con anti-aritmici di classe I o III; Re-start con monitoraggio delle 6 ore se interruzione prolungata (>14 giorni).
Infezioni (Emocromo) Se la conta linfocitaria < 0,2x 10⁹/L interrompere il trattamento fino a ripresa della conta normale. Posticipare l’inizio del trattamento in caso di severa infezione virale in corso. Considerare la sospensione del trattamento in caso di gravi infezioni (da definire caso per caso).
Sierologia VZV Controllo Ab antivaricella prima dell’inizio del trattamento in caso di pazienti naive o se il paziente non è stato vaccinato. Consigliata la vaccinazione e l’inizio del trattamento dopo 1 mese.
Edema maculare (Per pazienti con diabete o anamnesi di uveite, valutazione oftalmologica allo screening e durante il trattamento)Valutazione oftalmologica (non si menziona OCT) a 3-4 mesi dall’inizio del trattamento.Interruzione de trattamento in caso conferma di edema maculare.
Funzionalità epatica Monitoraggio più frequente se enzimi epatici > 5 ULN (transaminasi e bilirubina) e interruzione del trattamento in caso di rialzo permanente. Posticipare l’inizio del trattamento in caso di epatite virale attiva in corso.
Gravidanza Test di gravidanza negativo prima dell’inizio del trattamento. Utilizzo di un metodo contraccettivo adeguato in donne fertili durante il trattamento e per 2 mesi dopo l’interruzione. Interruzione del trattamento in caso di gravidanza. Registro delle gravidanze.
• Funzionalità epatica• Emocromo
• Bradiaritmia • Funzionalità epatica • Funzionalità epatica• Edema maculare
• Funzionalità epatica• (Edema maculare)• Sierologia VZV• Test gravidanza
• (Bradiaritmia)• Infezioni • Funzionalità epatica• (Edema maculare)

Conclusioni
Il dosaggio 0,5 mg/die ha evidenziato la stessa efficacia del dosaggio 1,25 mg/die con un miglior profilo di sicurezza/tollerabilità.
Il dossier registrativo, per il solo dosaggio 0,5 mg/die, è stato sottomesso a FDA ed EMA nel dicembre 2009.
FDA: approvazione del 21 settembre 2010
EMA: approvazione della Commissione Europea del 17 marzo 2011.

1. Mehling M et al. Neurology 2008;71(16):1261–7; 2. Dev KK et al. Pharmacol Ther 2008;117(1):77–93
Fingolimod: conclusioni
Riduzione significativa del tasso annualizzato di ricadute vs IFN β-1a pari al 52%
Riduzione significativa della progressione della disabilità (30% dopo 3 mesi; 37% dopo 6 mesi)
È il primo farmaco orale per la sclerosi multipla, con un nuovo meccanismo d’azione.
Fingolimod ha dimostrato di agire sulla componente infiammatoria della SM, ma potrebbe anche di avere effetti diretti sul sistema nervoso centrale1,
2 (in corso trial su SMPP)
Fingolimod

Fingolimod : ARRExtension Phase II Follow-up 7 years
Antel J et al, Poster P01.129 AAN 2012
Ann
ualiz
ed R
elap
se R
ate
(AR
R)
mesiPlacebo/fingolimod (n=93) Fingolimod 1.25 mg (n=94) Fingolimod 5 mg (n=94) Fingolimod tutte le dosi(n=281)

months
PC
BV
(FingolimodSignificant reduction on brain atrophy development over time
J. Antel et al, Poster P01.129 AAN 2012
Brain atrophy in healthy controls(0,1-0,4 % all’anno)
Follow-up 7 years
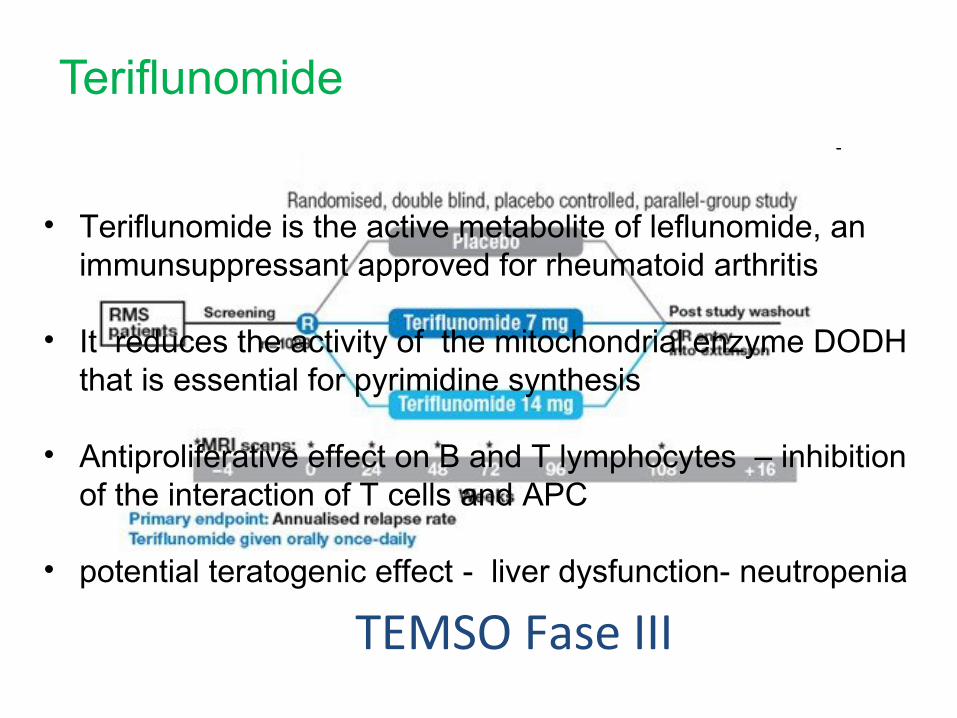
TEMSO Fase III
• Teriflunomide is the active metabolite of leflunomide, an immunsuppressant approved for rheumatoid arthritis
• It reduces the activity of the mitochondrial enzyme DODH that is essential for pyrimidine synthesis
• Antiproliferative effect on B and T lymphocytes – inhibition
of the interaction of T cells and APC
• potential teratogenic effect - liver dysfunction- neutropenia
Teriflunomide
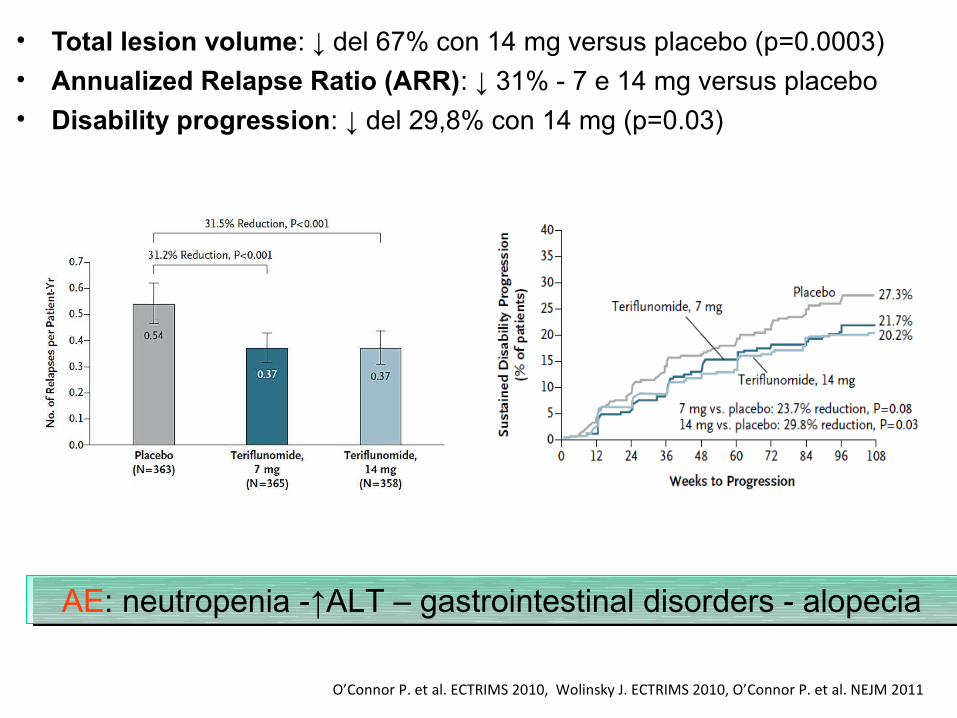
• Total lesion volume: ↓ del 67% con 14 mg versus placebo (p=0.0003)
• Annualized Relapse Ratio (ARR): ↓ 31% - 7 e 14 mg versus placebo
• Disability progression: ↓ del 29,8% con 14 mg (p=0.03)
O’Connor P. et al. ECTRIMS 2010, Wolinsky J. ECTRIMS 2010, O’Connor P. et al. NEJM 2011
AE: neutropenia -↑ALT – gastrointestinal disorders - alopeciaAE: neutropenia -↑ALT – gastrointestinal disorders - alopecia

Teriflunomide

Teriflunomide
• Teriflunomide è il principale metabolita attivo della leflunomide
• Leflunomide è indicata per la terapia dell’ artrite reumatoide negli adulti
• Teriflunomide inibisce selettivamente e reversibilmente la diidro-orotato deidrogenasi, un enzima mitocondriale chiave nella sintesi de novo delle pirimidine richiesta dai linfociti B e T attivati
– Attraverso questo effetto citostatico, teriflunomide può limitare la risposta immune nella SM2,3
1. Claussen M and Korn T. Clin Immunol. 2012;142:49-56; 2. Gold R and Wolinsky JS. Acta Neurol Scand. 2011;124:75-84; 3. Warnke C et al. Neuropsychiatr Dis Treat. 2009;5:333-340
124
Resting and slowly dividing cells
PYRIMIDINE DEMAND
MS-stimulated lymphocyte
DE NOVO SYNTHESIS
SALVAGE PATHWAY

TERIFLUNOMIDE (Aubagio®)
• Teriflunomide è approvata per il trattamento della SM recidivante-remittente in USA, Australia e Argentina
• Due dosi: 7 and 14 mg, una volta al dì
• Recentemente approvata da EMA: solo la dose 14 mg , una volta al dì
• Due trial di fase III, TEMSO and TOWER– TEMSO (TEriflunomide Multiple Sclerosis Oral) (NCT00134563)1
– TOWER (Teriflunomide Oral in people With relapsing multiplE scleRosis) (NCT00751881)2
1251. O’Connor P et al. N Engl J Med. 2011;365:1293-1303; 2. Kappos L et al. Mult Scler J. 2012;18:9–53

TERACLES
Teriflunomide Extensive Clinical Program
Monotherapy
Phase 2 IFN
Phase 2 GA
Phase 2 extension
Adjunctive therapy in RMS
Extension
RMS: Phase 2 - vs placebo
*Extensions ongoing for TOWER and TENERE. CIS, clinically isolated syndrome; GA, glatiramer acetate; IFN, interferon
2003 201320112010 20142012Studies completed
TERIVA: effects on vaccination
TOPIC: CIS – early MS / Phase 3 - vs placebo
TENERE: RMS / Phase 3 - vs IFNβ-1a* Extension
Extension
Extension
TOWER: RMS / Phase 3 - vs placebo*
TEMSO: RMS / Phase 3 - vs placebo

TEMSO and TOWER: Study Overviews
aFatigue Impact Scale; bShort Form-36 Health Survey. EDSS, Expanded Disease Status Scale1. McDonald WI et al. Ann Neurol. 2001;50:121-127 (TEMSO); 2. Polman C et al. Ann Neurol. 2005;58:840-846 (TOWER)
TEMSO TOWER
Study design Multicenter, multinational, randomized (1:1:1), double-blind, parallel-arm, placebo-controlled phase 3
Patients 1088 1169
Study durationFixed study treatment duration,
108 weeksVariable study treatment duration,
48–152 weeks (mean 78 weeks)Study ended when last patient randomized
completed 48 weeks of treatment
Patient population
Patients with relapsing MS (McDonald criteria)1,2
Age 18–55 yearsEDSS score ≤5.5 at screening
≥2 relapses within 2 years or 1 relapse within 1 year prior to randomization
Treatment armsPlacebo
Teriflunomide 7 mgTeriflunomide 14 mg
Primary outcome Annualized relapse rate (ARR)
Key secondary outcome Disability progression (confirmed over 12 weeks)
Secondary outcomesMRI measures of diseaseSubject-reported fatiguea
Safety and tolerability
Subject-reported fatiguea Subject-reported quality of lifeb
Safety and tolerability
127

TEMSO and TOWER: Annualized Relapse Rates
1. O'Connor P et al. N Engl J Med. 2011;365:1293-1303; 2. Kappos L et al. Mult Scler J. 2012;18:9-53. Modified intent-to-treat populations
TEMSO TOWER
Ann
ualiz
ed R
elap
se R
ate
31.2% p<0.001
31.5% p<0.001
Annu
aliz
ed R
elap
se R
ate
36.3% p<0.001
n=363 n=365 n=358 n=388 n=407 n=370
Placebo PlaceboTeriflunomide 7 mg
Teriflunomide 7 mg
Teriflunomide 14 mg
Teriflunomide 14 mg
22.3% p<0.02
128

TEMSO and TOWER: Disability Progression
27.3%21.7%20.2%
00 36 72 84 96 10848 60
Dis
abili
ty P
rogr
essi
on (%
)
30
24Week
10
20
12
PlaceboTeriflunomide 7 mgTeriflunomide 14 mg
40
21.0%22.2%
15.8%
40
0 12 24 36 48 60 72 84 96 108 120 132Week
30
20
0
10
TEMSO TOWER
1. O'Connor P et al. N Engl J Med. 2011;365:1293-1303; 2. Kappos L et al. Mult Scler J. 2012;18:9-53. Modified intent-to-treat populationsHR, hazard ratio. Disability progression is defined as an increase from baseline of ≥1.0 point on the EDSS, confirmed for at least 12 weeks
Dis
abili
ty P
rogr
essi
on (%
)TEMSO TOWER
7 mg vs placebo HR 0.763 p=0.0835 HR 0.955 p=0.7620
14 mg vs placebo HR 0.702 p=0.0279 HR 0.685 p=0.0442
129
PlaceboTeriflunomide 7 mgTeriflunomide 14 mg

TEMSO:MRI Outcomes
130
2.21
0.72
0.0
0.5
1.0
1.5
2.0
2.5
0.53
0.33
0.0
0.1
0.2
0.3
0.4
0.5
0.6
Num
ber o
f Gad
olin
ium
-Enh
anci
ng
T1 L
esio
ns p
er S
can
Placebo
Teriflunomide
14 mg
Burden of Diseasea
Gd-Enhancing Lesions
Unique Active Lesionsb
T1-Hypointense Lesion Volume
Chan
ge in
Les
ion
Volu
me
From
Ba
selin
e (m
L)
Num
ber o
f Uni
que
Activ
e Le
sion
s pe
r Sca
n
Chan
ge in
T1-
Hyp
oint
ense
Les
ion
Volu
me
From
Bas
elin
e (m
L)
67% 80% 69% 31%
aTotal volume of all abnormal brain tissue, calculated as the sum of the total volume of T2 lesion component and T1-hypointense lesion component; bEnhanced lesions plus unenhanced new and substantially enlarged T2-hyperintense lesions; cPercent relative reduction (percent change for treatment relative to placebo of the change from baseline [based on transformed data] at Week 108). Modified intent-to-treat populations1. O’Connor P et al. N Engl J Med. 2011;365:1293-1303; 2. Wolinsky J et al. Mult Scler J. 2013 [Epub ahead of print]
Placebo
Teriflunomide
14 mg Place
bo
Teriflunomide
14 mg Place
bo
Teriflunomide
14 mg
Relative Reduction 67% (p<0.001)c
Relative Risk Reduction 80% (p<0.001)
Relative Risk Reduction 69% (p<0.001)
Relative Reduction 31% (p=0.02)c
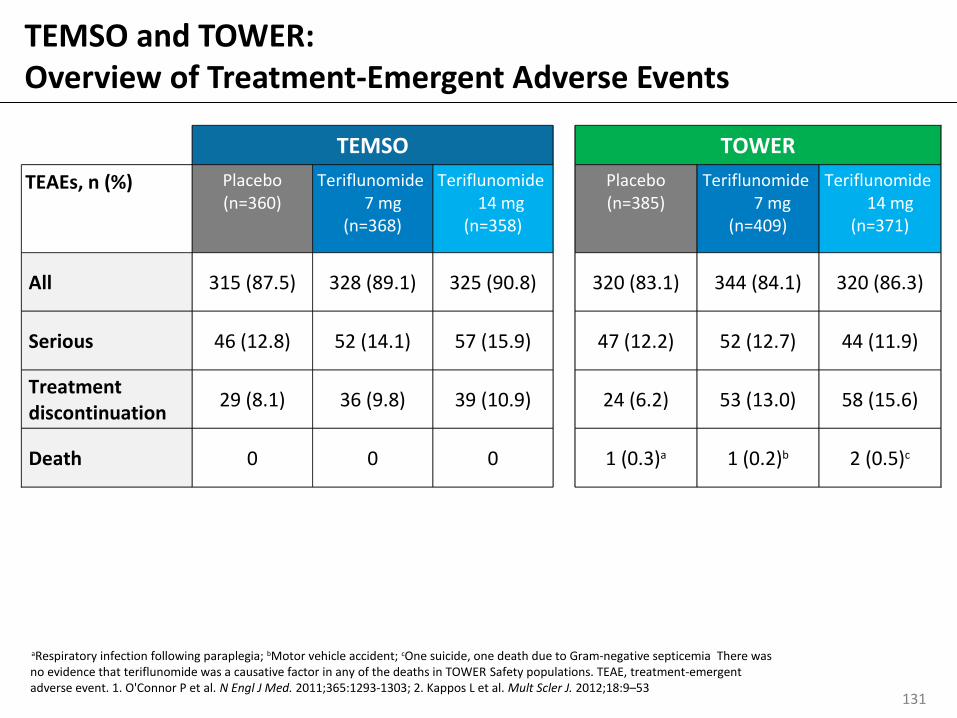
TEMSO and TOWER: Overview of Treatment-Emergent Adverse Events
TEMSO TOWERTEAEs, n (%) Placebo
(n=360)Teriflunomide
7 mg(n=368)
Teriflunomide 14 mg(n=358)
Placebo(n=385)
Teriflunomide 7 mg(n=409)
Teriflunomide 14 mg(n=371)
All 315 (87.5) 328 (89.1) 325 (90.8)
320 (83.1) 344 (84.1) 320 (86.3)
Serious 46 (12.8) 52 (14.1) 57 (15.9)
47 (12.2) 52 (12.7) 44 (11.9)
Treatment discontinuation
29 (8.1) 36 (9.8) 39 (10.9)
24 (6.2) 53 (13.0) 58 (15.6)
Death 0 0 0
1 (0.3)a 1 (0.2)b 2 (0.5)c
aRespiratory infection following paraplegia; bMotor vehicle accident; cOne suicide, one death due to Gram-negative septicemia There was no evidence that teriflunomide was a causative factor in any of the deaths in TOWER Safety populations. TEAE, treatment-emergent adverse event. 1. O'Connor P et al. N Engl J Med. 2011;365:1293-1303; 2. Kappos L et al. Mult Scler J. 2012;18:9–53
131
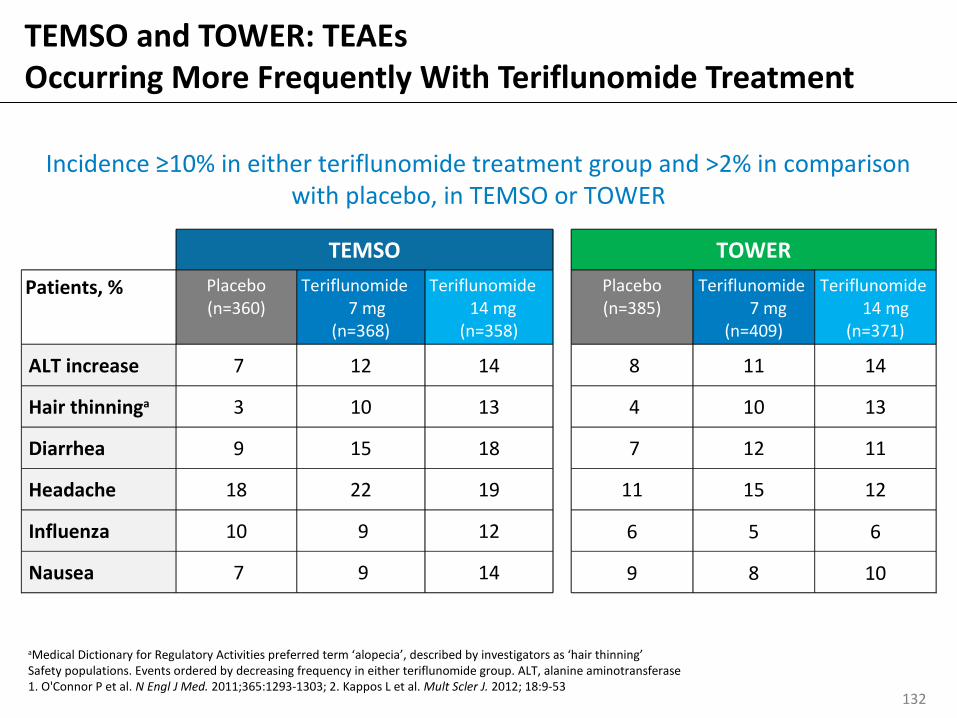
TEMSO TOWERPatients, % Placebo
(n=360)Teriflunomide
7 mg(n=368)
Teriflunomide 14 mg(n=358)
Placebo(n=385)
Teriflunomide 7 mg(n=409)
Teriflunomide 14 mg(n=371)
ALT increase 7 12 14 8 11 14
Hair thinninga 3 10 13 4 10 13
Diarrhea 9 15 18 7 12 11
Headache 18 22 19 11 15 12
Influenza 10 9 12 6 5 6
Nausea 7 9 14 9 8 10
aMedical Dictionary for Regulatory Activities preferred term ‘alopecia’, described by investigators as ‘hair thinning’Safety populations. Events ordered by decreasing frequency in either teriflunomide group. ALT, alanine aminotransferase1. O'Connor P et al. N Engl J Med. 2011;365:1293-1303; 2. Kappos L et al. Mult Scler J. 2012; 18:9-53
Incidence ≥10% in either teriflunomide treatment group and >2% in comparison with placebo, in TEMSO or TOWER
TEMSO and TOWER: TEAEs Occurring More Frequently With Teriflunomide Treatment
132

• The adjusted ARR was low in all treatment groups 5 years after randomization
• Disability progression was lower in patients initially randomized to teriflunomide
TEMSO Extension: ARR and Sustained Disability Progression
Adjusted ARR* Disability Progression*
Adjusted ARR
*No placebo comparison in open-label extension. 1. Comi et al. Mult Scler J. 2011;17(Suppl 17):S182.P439 133
Years

Time>
TENERE:Teriflunomide vs IFNβ-1a s.c.: Time to Failure
No statistical superiority was observed between teriflunomide (7 mg or 14 mg) and SC IFNβ-1a on time to failure, the primary composite endpoint
Additional analyses showed greater treatment satisfaction and fewer discontinuations with teriflunomide than IFNβ-1a therapy
Median duration of exposure (all treatment groups): 63.64 weeks; actual maximum duration: ~115 weeks. SC, subcutaneous1. Vermersch P et al. Fourth Cooperative Meeting of CMSC and ACTRIMS, 30 May–2 June 2012, San Diego, CA, USA
0
Failu
re (R
elap
se/T
reat
men
tD
isco
ntin
uatio
n) %
Weeks
Teriflunomide 7 mg
Teriflunomide 14 mg
SC IFNβ-1a
0
60
40
20
12 24 36 48 60 72 84 96
42.3%
80
48.6% (p=0.52 vs SC IFNβ-1a)
37.8% (p=0.60 vs SC IFNβ-1a)

TERIVA:Immune Response to Seasonal Influenza Vaccination
• Patients treated with teriflunomide generally mounted an effective immune response to seasonal influenza vaccination
• All treatment groups achieved antibody titers ≥40 in 70% of patients, in accordance with the European criteria for efficacy of influenza vaccination in adults aged 18 to 60 years1
Proportion of Patients With Influenza Antibody Titers ≥40 at 28 Days Post Vaccination
1. European Medicines Agency for the Evaluation of Medicinal Products guidelines. 2. Bar-Or A et al. Mult Scler J. 2012;18:(S4)279-508(P925)
*European criteria for 18 to 60 year olds requires achievement of antibody titers ≥40 by 70% of patients, indicated by the dashed line
135
Patie
nts
(%)
*

Teriflunomide: Summary
136
Efficacy
•In TEMSO and TOWER, both doses of teriflunomide significantly reduced ARR compared with placebo
•Teriflunomide 14 mg had a significant effect on the risk of 12-week disability progression compared with placebo in both studies; this was not observed with the 7 mg dose
•MRI-assessed disease activity was significantly decreased with both teriflunomide doses
•In the TEMSO extension study, after 5 years, disability progression was lower in patients initially randomized to teriflunomide
•The TENERE study showed greater patient satisfaction with teriflunomide than IFNβ-1a therapy
Safety
•Teriflunomide has a well-characterized safety profile
•Patients treated with teriflunomide mounted an effective immune response to seasonal influenza vaccination
Teriflunomide has a favorable benefit:risk ratio as a treatment for RMS

TEMSO and TOWER: Baseline Demographics and Disease Characteristics
1. O’Connor P et al. N Engl J Med. 2011;365:1293-1303; 2. Kappos L et al. Mult Scler J. 2012;18:9–53Randomized populations. DMT, disease-modifying therapy; SD, standard deviation
TEMSO TOWERAge, years Mean (SD) Median (range)
37.9 (8.8)38.0 (18-55)
37.9 (9.3)38.0 (18-56)
Female, n (%) 785 (72.2) 831 (71.1)
Race, n (%) Caucasian/White Asian Other
1058 (97.5) 15 (1.4) 12 (1.1)
960 (82.1)169 (14.5)
40 (3.4)
Time since first symptom of MS, years Mean (SD) Median (range)
8.7 (6.9)6.8 (0.3-35.7)
8.0 (6.7)6.3 (0.1-36.9)
Number of relapses within past 2 years Mean (SD) Median (range)
2.2 (1.1)2.0 (1-12)
2.1 (1.2)2.0 (1-9)
MS subtype, n (%) Relapsing–remitting Secondary progressive Progressive relapsing
995 (91.5)51 (4.7)42 (3.9)
1138 (97.5)9 (0.8)
20 (1.7)
Baseline EDSS score Mean (SD) Median (range)
2.68 (1.3)2.50 (0–6.0)
2.70 (1.4)2.50 (0–6.5)
Previous DMT received in past 2 years, n (%) 294 (27.0) 384 (32.8)
Dem
ogra
phic
sD
isea
se a
nd T
reat
men
t His
tory
137

TEMSO TOWER
Patients with infection, n (%)
Placebo(n=360)
Teriflunomide 7 mg(n=368)
Teriflunomide 14 mg(n=358)
Placebo(n=385)
Teriflunomide 7 mg(n=409)
Teriflunomide 14 mg(n=371)
All patients 209 (58.1) 220 (59.8) 222 (62.0) 197(51.2) 198 (48.4) 165 (44.5)
Serious infections 8 (2.2) 6 (1.6) 9 (2.5) 11 (2.9) 14 (3.4) 11 (3.0)
Leading to discontinuation
4 (1.1) 1 (0.3) 3 (0.8) 1 (0.3) 4 (1.0) 5 (1.3)
Suspected opportunistic infections
0 0 0 1 (0.3) 1 (0.2) 3 (0.8)
Deathsa 0 0 0 1 (0.3) 0 1 (0.3)
aTOWER placebo: respiratory infection; teriflunomide 14 mg: bacterial sepsis (Klebsiella)1. O’Connor P et al. N Engl J Med. 2011;365:1293-1303; 2. Genzyme data on file
TEMSO and TOWER: Infections
138
• A similar incidence of infections, serious infections, and infections leading to treatment discontinuation occurred across all treatment groups

TEMSO TOWER
Patients with hepatic AEs, n (%)
Placebo(n=360)
Teriflunomide 7 mg(n=368)
Teriflunomide 14 mg(n=358)
Placebo(n=385)
Teriflunomide 7 mg(n=409)
Teriflunomide 14 mg(n=371)
Any AE 43 (11.9) 71 (19.3) 69 (19.3) 58 (15.1) 75 (18.3) 81 (21.8)
Serious AEs 9 (2.5) 7 (1.9) 9 (2.5) 11 (2.9) 8 (2.0) 6 (1.6)
AEs leading to discontinuation
15 (4.2) 16 (4.3) 13 (3.6) 12 (43.1) 15 (3.7) 18 (4.9)
ALT
≥3x ULN
≥5x ULN
≥10x ULN
≥20x ULN
24 (6.7)9 (2.5)5 (1.4) 2 (0.6)
23 (6.3)9 (2.5)3 (0.8)1 (0.3)
24 (6.7)8 (2.2)4 (1.1)2 (0.6)
22 (5.7)14 (3.6)5 (1.3)2 (0.5)
31 (7.6)10 (2.5)2 (0.5)
0
29(7.8)11 (3.0)2 (0.5)
0
ALT ≥3x ULN + bilirubin ≥2x ULNa
1 (0.3) 1 (0.3) 1 (0.3) 2 (0.5) 1 (0.2) 0aCriteria for Hy’s Law; Alternative explanations for elevation were hepatitis C, gallbladder problems, and CMV infection (TEMSO); concomitant cortisone-pulse therapy and hepatitis C (placebo) Gilbert’s syndrome and alcoholic liver enzyme (teriflunomide 7 mg) (TOWER) ULN, upper limit of normal. 1. O’Connor P et al. N Engl J Med. 2011;365:1293-1303; 2. Genzyme data on file
TEMSO and TOWER: Hepatic Events
139
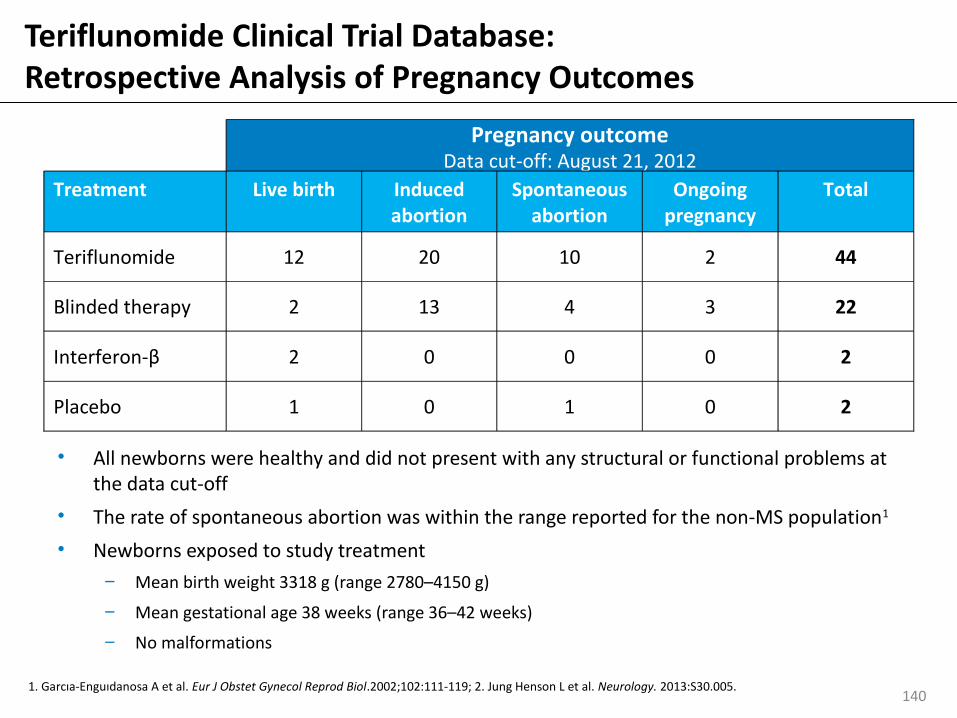
Teriflunomide Clinical Trial Database:Retrospective Analysis of Pregnancy Outcomes
• All newborns were healthy and did not present with any structural or functional problems at the data cut-off
• The rate of spontaneous abortion was within the range reported for the non-MS population1
• Newborns exposed to study treatment– Mean birth weight 3318 g (range 2780–4150 g)
– Mean gestational age 38 weeks (range 36–42 weeks)
– No malformations
1. Garcıa-Enguıdanosa A et al. Eur J Obstet Gynecol Reprod Biol.2002;102:111-119; 2. Jung Henson L et al. Neurology. 2013:S30.005.
Pregnancy outcomeData cut-off: August 21, 2012
Treatment Live birth Induced abortion
Spontaneous abortion
Ongoing pregnancy
Total
Teriflunomide 12 20 10 2 44
Blinded therapy 2 13 4 3 22
Interferon-β 2 0 0 0 2
Placebo 1 0 1 0 2
140

IFN-β Adjunct:Clinical Efficacy Outcomes
• Significant effect on reducing the risk of T1-Gd lesions per scan compared with IFNβ alone
– 14 mg dose also significantly reduced the volume of T1Gd-enhancing lesions per scan; not observed with 7 mg dose
• Dose-dependent effect on ARR was observed, but did not reach statistical significance compared with IFNβ alone1
1. Freedman MS et al. Neurology. 2012;78:1877-885
Placebo + IFNβ (n=41)Teriflunomide 7 mg + IFNβ (n=37)
0.570 0.5210.099 0.0800.024 0.0900
0.2
0.4
0.6
0.8
1
24 Weeks 48 Weeks
84.4% p=0.0001
82.6%p=0.0009
82.8% p<0.0001
84.6%p=0.0005
T1-Gd Lesions per Scan
T1-G
d Le
sion
s pe
r Sca
n
Teriflunomide 14 mg + IFNβ (n=38)
141

Sicurezza• Con teriflunomide in generale buona tollerabilità e
sicurezza– Aumento delle transaminasi
– Disturbi GI
– Assottigliamento dei capelli
– Neuropatia periferica
• Teratogenicità nell’animale –categoria FDA X
• Indicata la contraccezione nella donna e nell’uomo
• In caso di programma di gravidanza eliminazione tramite colestiramina o carbone attivo

Laquinimod
N
Cl O-Na+
O
CH3
O
N
Et
Ph
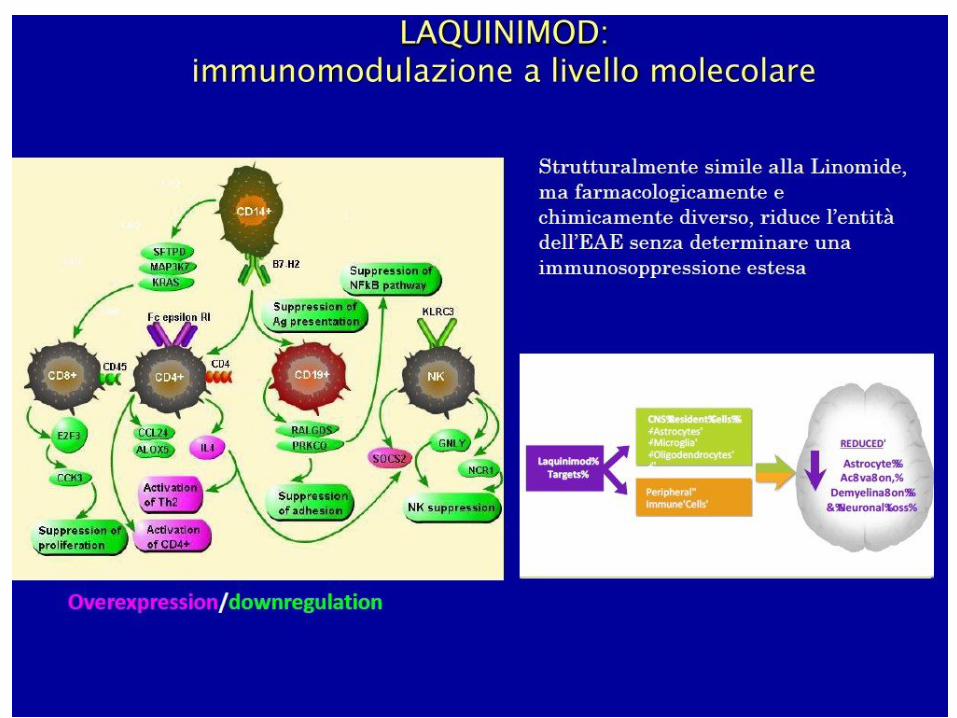

Mechanism of action
• The broad profile of efficacy in animal models of inflammatory diseases suggests that laquinimod affects a pivotal pathway of inflammation
• Laquinimod acts as an immunomodulator:
– Modulation of Th1/Th2 disease-specific proinflammatory autoimmune responses
– Reduced leukocyte infiltration
– Down regulation of inflammatory and of MHC class II genes
• Laquinimod does not affect the ability of animals to mount cellular and humoral immune responses


ALLEGRO STUDY DESIGN
Safety
Oral laquinimod 0.6 mg once daily (n=556)
Matching oral placebo once daily (n=550)
BASE
LINE Mo
1 2 3Mo 6 Mo 9 Mo 12 Mo 15 Mo 18 Mo 21 Mo 24
MRI
CORE STUDY
EXTENSION PHASE
Oral laquinimod 0.6 mg once daily
EDSS
Reference: Comi G et al. Presented at: 63rd Annual Meeting of the American Academy of Neurology; April 9-16, 2011; Honolulu, HI. Neurology. 2011;76(14).

LAQUINIMOD PROVIDES EARLY AND MARKEDREDUCTION IN DISABILITY PROGRESSION
A confirmed progression of EDSS is defined as at least 1 point increase from baseline on EDSS score if baseline EDSS was between 0 and 5.0,or at least 0.5 point increase if baseline EDSS was 5.5 or higher, confirmed 3 months later. Progression could not be confirmed during an MS relapse.
Reference: 1. Comi G et al. Presented at: 63rd Annual Meeting of the American Academy of Neurology; April 9-16, 2011; Honolulu, HI. Neurology. 2011;76(14).
P=0.0122Hazard Ratio=0.0641

Percentage Change of Brain Volume Months 0-24
LAQUINIMOD SIGNIFICANTLY REDUCES BRAIN TISSUE LOSS
Perc
ent B
rain
Vol
ume
Chan
ge F
rom
Bas
elin
e
0.395
Placebo Laquinimod 0.6 mg
-1.5
-1.0
-0.5
0
-32.8% Reduction of brain tissue loss in the treated group P<0.0001
Reference: 1. Comi G et al. Presented at: 63rd Annual Meeting of the American Academy of Neurology; April 9-16, 2011; Honolulu, HI. Neurology. 2011;76(14).
P<0.0001

SICUREZZA E TOLLERABILITA’ DI LAQUINIMOD NEI TRIAL
– Aumento degli enzimi epatici, TRANSITORIO
– Dolore addominale – Dolore lombare
– Tosse
• Buona tollerabilità e sicurezza, non segnali di immunosoppressione
• (infezioni oortunistiche, tumori)
Reference: 1. Comi G et al. Presented at: 63rd Annual Meeting of the American Academy of Neurology; April 9-16, 2011; Honolulu, HI. Neurology. 2011;76(14).

BRAVO Study Design
Purpose: To assess the efficacy, safety, and tolerability of laquinimod over placebo in a double-blind design and of a reference arm of Interferon -1a IM 30 mcg (Avonex®) in a rater-blinded design
Oral laquinimod 0.6 mg once daily
Matching oral placebo once daily
CORE STUDY
IFN-β-1a IM 30 mcg (Avonex®) once weekly
Safety
BA
SELI
NE
Mo1 2 3
Mo 6 Mo 9 Mo 12 Mo 15 Mo 18 Mo 21 Mo 24
MRI
EDSS
EXTENSION PHASE
Oral laquinimod 0.6 mg once daily
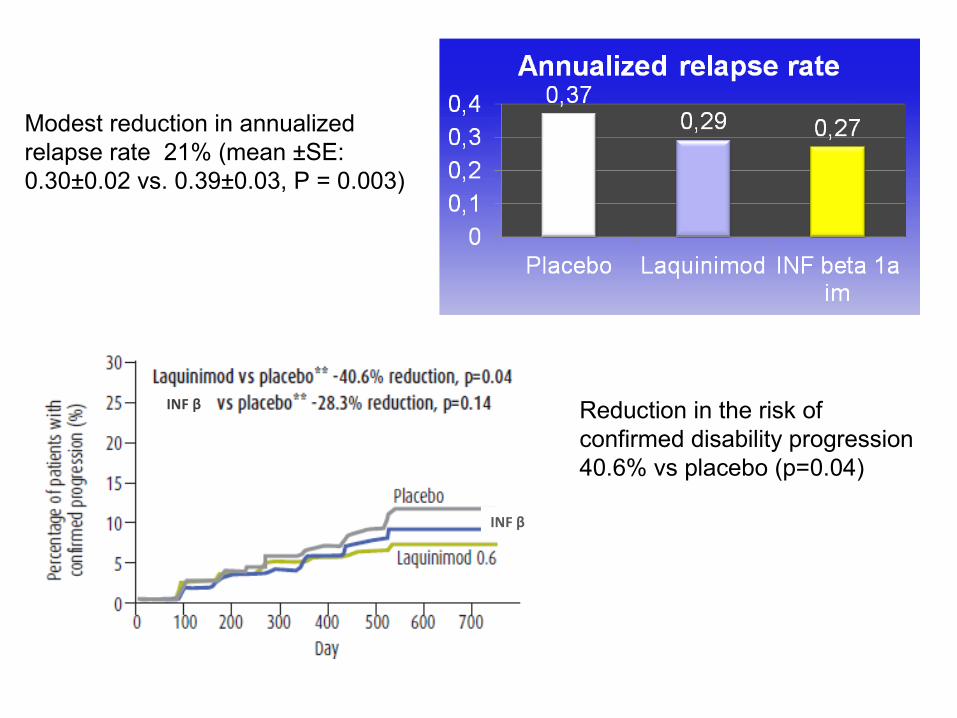
Reduction in the risk of confirmed disability progression 40.6% vs placebo (p=0.04)
INF β
INF β
Modest reduction in annualized relapse rate 21% (mean ±SE: 0.30±0.02 vs. 0.39±0.03, P = 0.003)
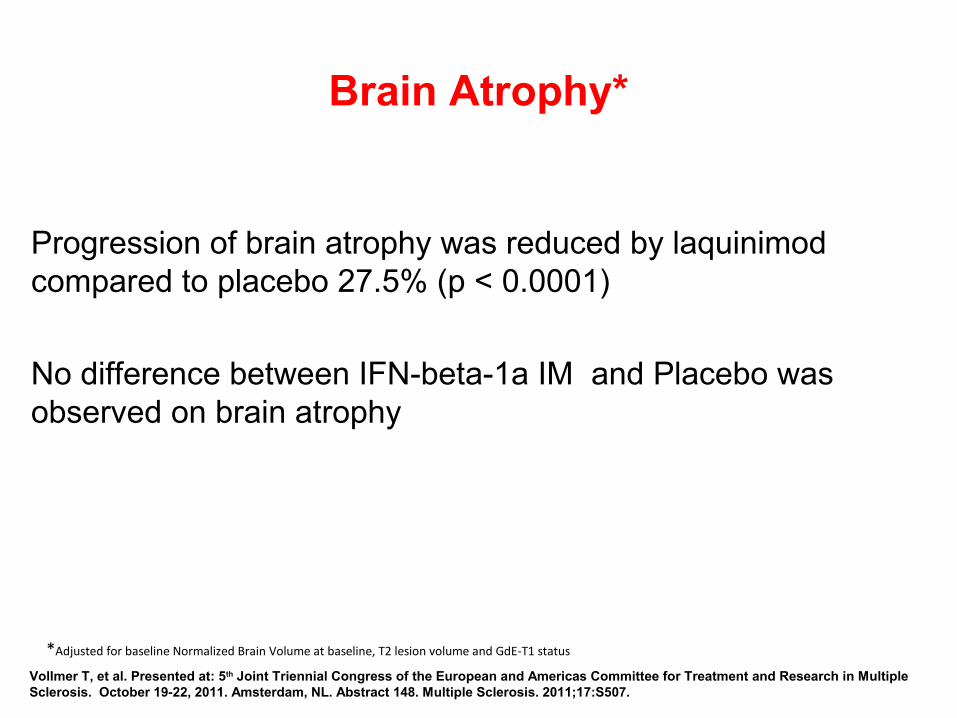
Brain Atrophy*
Progression of brain atrophy was reduced by laquinimod compared to placebo 27.5% (p < 0.0001)
No difference between IFN-beta-1a IM and Placebo was observed on brain atrophy
*Adjusted for baseline Normalized Brain Volume at baseline, T2 lesion volume and GdE-T1 status
Vollmer T, et al. Presented at: 5th Joint Triennial Congress of the European and Americas Committee for Treatment and Research in Multiple Sclerosis. October 19-22, 2011. Amsterdam, NL. Abstract 148. Multiple Sclerosis. 2011;17:S507.

• Safety and tolerability profile compared to placebo similar to that shown in ALLEGRO; no new safety signals
• No signal of immunosuppression
Safety & Tolerability
Vollmer T, et al. Presented at: 5th Joint Triennial Congress of the European and Americas Committee for Treatment and Research in Multiple Sclerosis. October 19-22, 2011. Amsterdam, NL. Abstract 148. Multiple Sclerosis. 2011;17:S507.

BG-12 (Tecfidera®)
• Il fumarato è una molecola essenziale per la respirazione ossidativa cellulare(ciclo dell’acido citrico)
• BG-12 è un derivato di seconda generazione del fumarato. Contiene DMF in capsule
• Forma farmaceutica che migliora la tollerabilità gastro intestinale.
• DMF dopo l’assorbimento è rapidamente convertito in MMF
DMF
Monomethyl fumarate(MMF)
Fumarate
↔BG-12
(dimethyl fumarate [DMF])
Rapid metabolis
m
Moharregh-Khiabani D et al. Curr Neuropharmacol. 2009;7:60-64.

FUMADERM® e BG-12
Componenti di FUMADERM® (enteric coated tablet)
Componenti di BG-12(enteric coated encapsulated micro-tablets within a gelatin capsule)
Dimethyl fumarate 120 mg Dimethyl fumarate 120 mg
Ethylhydrogen fumarate Ca-Salt
87 mg Ethylhydrogen fumarate Ca-Salt
---
Ethylhydrogen fumarate Mg-Salt
5 mg Ethylhydrogen fumarate Mg-Salt
---
Ethylhydrogen fumarate Zn-Salt
3 mg Ethylhydrogen fumarate Zn-Salt
---
• FUMADERM® è stato approvato per il trattamento della psoriasi volgare severa in Germania dal 1994; indicazione poi estesa anche alla psoriasi moderata

Potential Mechanisms of BG-12 Action
BG-12BG-12
Nrf2
Regulation of immune homeostasis Attenuation of pro-inflammatory cytokine
production Regulation of NFB activation Reduced activation of macrophages,
microglia, astrocytes Reduced CNS infiltration of immune cells Shift Th1/Th2/Th17 balance towards anti-
inflammatory phenotype Improved integrity of BBB
Enhanced anti-oxidant capacity Protection against toxic oxidative stress Regulation of OS stress-induced intracellular
Ca++ accumulation Enhanced mitochondrial function Potential protection against multiple forms of
neurodegenerative stimuli- Oxidative stress
- Demyelination- Excitotoxicity
Anti-Inflammatory Cytoprotection
159
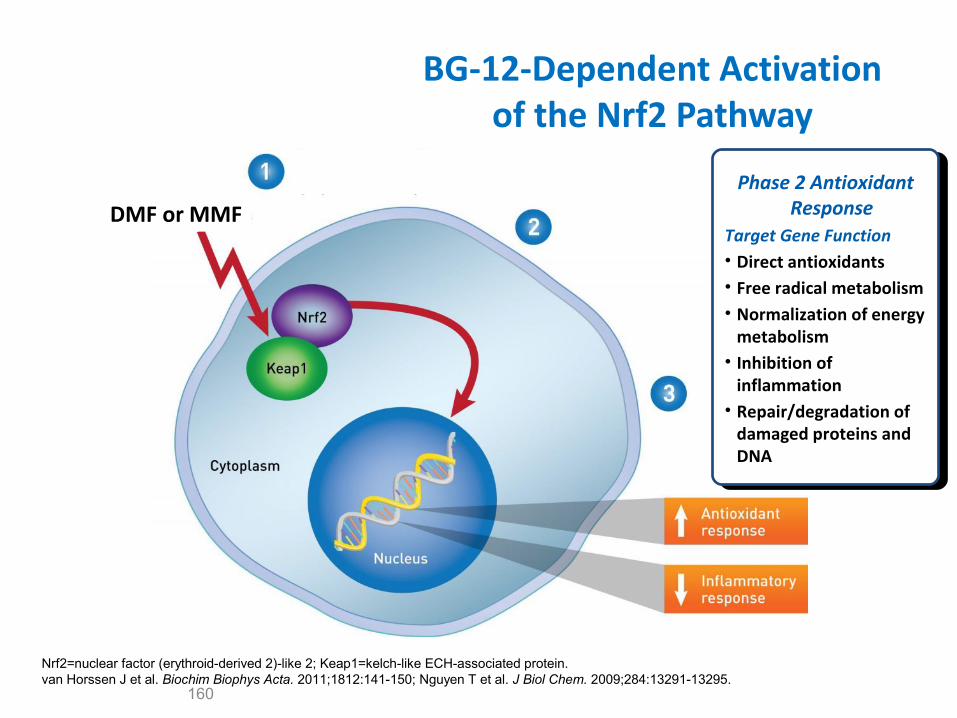
BG-12-Dependent Activationof the Nrf2 Pathway
160
Nrf2=nuclear factor (erythroid-derived 2)-like 2; Keap1=kelch-like ECH-associated protein.van Horssen J et al. Biochim Biophys Acta. 2011;1812:141-150; Nguyen T et al. J Biol Chem. 2009;284:13291-13295.
DMF or MMFPhase 2 Antioxidant
ResponseTarget Gene Function• Direct antioxidants• Free radical metabolism• Normalization of energy
metabolism• Inhibition of
inflammation• Repair/degradation of
damaged proteins and DNA
Phase 2 Antioxidant Response
Target Gene Function• Direct antioxidants• Free radical metabolism• Normalization of energy
metabolism• Inhibition of
inflammation• Repair/degradation of
damaged proteins and DNA

BG-12 attiva il pathway dell’Nrf2 un meccanismo di difesa naturale
contro lo stess ossidativo
161
ARE
Nucleus
CytoplasmCytoplasm
Nrf2=nuclear factor (erythroid-derived 2)-like 2; MOA=mechanism of action; DMF=dimethyl fumarate; MMF=monomethyl fumarate; Keap1=kelch-like ECH-associated protein 1; ARE=antioxidant response element.van Horssen J et al. Biochem Biophys Acta. 2011;1812:141-150; Linker RA et al. Brain. 2011;134:678-692.
Proteasome
Keap1
DMF or MMF
Phase 2 Antioxidant Response
Target Gene Function• Direct antioxidants• Free radical metabolism• Normalization of energy
metabolism• Inhibition of inflammation• Repair/degradation of
damaged proteins and DNA
Phase 2 Antioxidant Response
Target Gene Function• Direct antioxidants• Free radical metabolism• Normalization of energy
metabolism• Inhibition of inflammation• Repair/degradation of
damaged proteins and DNA
Nrf2Nrf2
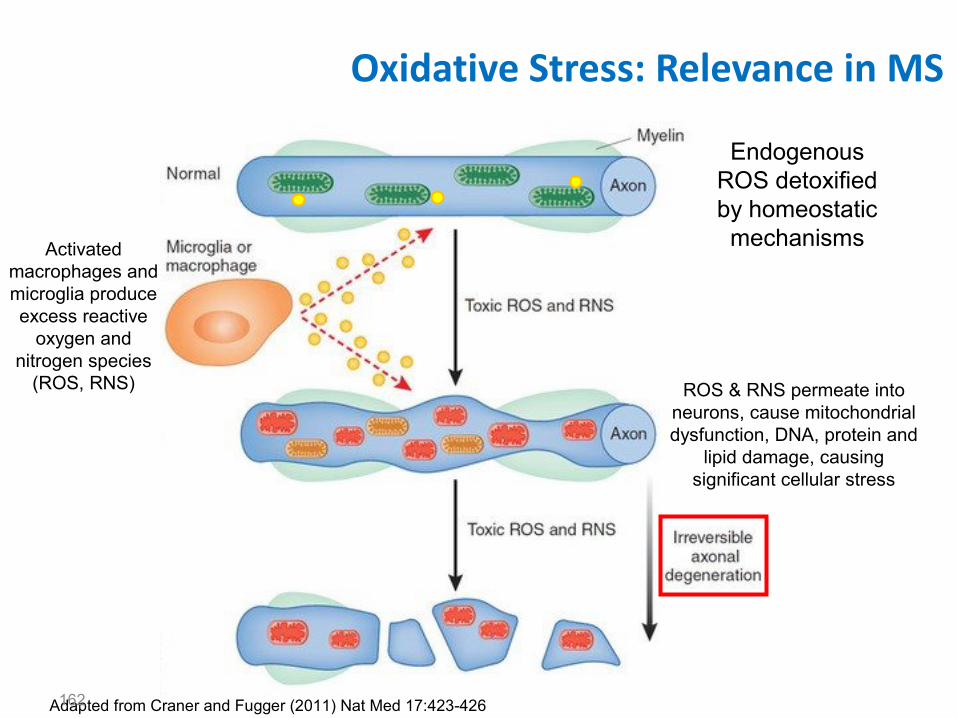
Oxidative Stress: Relevance in MS
Adapted from Craner and Fugger (2011) Nat Med 17:423-426
Activated macrophages and microglia produce excess reactive
oxygen and nitrogen species
(ROS, RNS) ROS & RNS permeate into neurons, cause mitochondrial dysfunction, DNA, protein and
lipid damage, causing significant cellular stress
Endogenous ROS detoxified by homeostatic mechanisms
162

Phase 2 Study Design
24 weeks 24 weeks
Placebo (n=65)
BG-12 120 mg TID (360 mg/day) (n=64)
Blinded Placebo-Controlled Treatment Phase
Blinded Safety-Extension Phase
BG-12 120 mg QD (120 mg/day) (n=64)
BG-12 240 mg TID (720 mg/day)* (n=63)
Randomizationn=257
BG-12 240 mg TID
4 8 12 16 20 240
Kappos L et al. Lancet 2008;372(9648):1463-1472
Primary endpoint:
Total number of new Gd+ lesions on MRI scans performed at Weeks 12-24

Phase 3 Studies in RRMS
Clinical trial program includes >2500 patients from ~35 countries
Two multicenter, parallel-group, randomized, placebo-controlled, dose-comparison, phase 3 clinical studies and an extension study on-going
DEFINE (Determination of the Efficacy and Safety of Oral Fumarate in Relapsing-Remitting Multiple Sclerosis)
CONFIRM (Comparator and an Oral Fumarate in Relapsing-Remitting Multiple Sclerosis)
ENDORSE (Extension Study of Dimethyl Fumarate to Evaluate Long-term Safety and Efficacy)

*Any patient with significant protocol-defined disability progression may switch to open-label MS treatment at any time; CONFIRM: any patient with 2 INEC-confirmed relapses at any time may switch to open-label MS treatment after 48 weeks on study; †double-blind only for DMF and placebo; rater-blinded for all arms; INEC fully blinded to all arms.DEFINE=Determination of the Efficacy and Safety of Oral Fumarate in Relapsing-Remitting MS; CONFIRM=Comparator and an Oral Fumarate in Relapsing-Remitting MS; PO=by mouth; TID=3 times daily; BID=twice daily; GA=glatiramer acetate; SC=subcutaneous; INEC=independent neurology evaluation committee.Gold R et al. N Engl J Med. 2012;367:1098-1107; Fox R et al. N Engl J Med. 2012;367:1087-1197.
*Any patient with significant protocol-defined disability progression may switch to open-label MS treatment at any time; DEFINE: any patient with 1 INEC-confirmed relapse on or after Week 24 may switch to open-label MS treatment after 48 weeks on study; †double-blind only for DMF and placebo; rater-blinded for all arms; INEC fully blinded to all arms.
DMF Phase 3 Study Schematic:DEFINE and CONFIRM
165
ScreeningScreening
DMF 240 mg PO BID (480 mg/day)DMF 240 mg PO BID (480 mg/day)
DMF 240 mg PO TID (720 mg/day) DMF 240 mg PO TID (720 mg/day)
Optional open-label MS treatment* Optional open-label MS treatment*
Placebo Placebo Randomization1:1:1
Year 1Year 1 Year 2Year 2
GA SC (20 mg/day)GA SC (20 mg/day)
Multicenter, double-blind, dose-comparison study (N=1237; MRI N=540)
Multicenter, double-blind, reference comparator, dose-comparison study (N=1430; MRI N=681)†
Randomization1:1:1:1
Randomization1:1:1:1
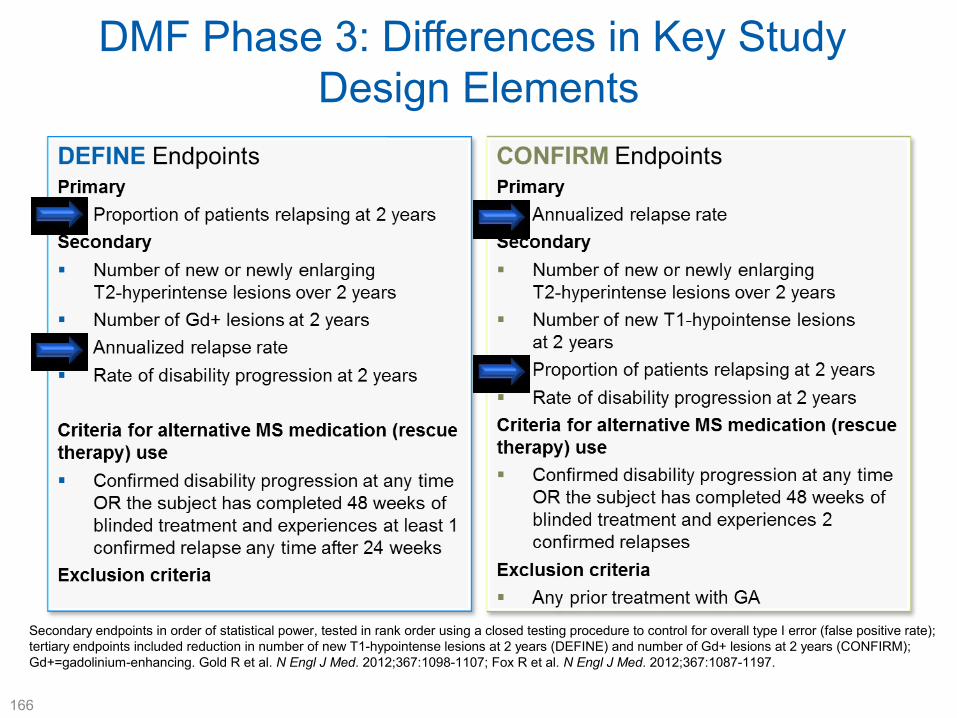
DMF Phase 3: Differences in Key Study Design Elements
166
Secondary endpoints in order of statistical power, tested in rank order using a closed testing procedure to control for overall type I error (false positive rate);tertiary endpoints included reduction in number of new T1-hypointense lesions at 2 years (DEFINE) and number of Gd+ lesions at 2 years (CONFIRM);Gd+=gadolinium-enhancing. Gold R et al. N Engl J Med. 2012;367:1098-1107; Fox R et al. N Engl J Med. 2012;367:1087-1197.

DMF Phase 3: Key Study Design Elements
167
Secondary endpoints in order of statistical power, tested in rank order using a closed testing procedure to control for overall type I error (false positive rate);tertiary endpoints included reduction in number of new T1-hypointense lesions at 2 years (DEFINE) and number of Gd+ lesions at 2 years (CONFIRM);Gd+=gadolinium-enhancing. Gold R et al. N Engl J Med. 2012;367:1098-1107; Fox R et al. N Engl J Med. 2012;367:1087-1197.

DMF Phase 3 Study Comparison
DEFINE CONFIRM
Characteristic PlaceboDMFBID
DMFTID Placebo DMF BID DMF TID GA
# of subjects per treatment group
408 410 416 363 359 345 350
Primary endpoint Proportion of subjects relapsed at 2 years
Annualized relapse rate at 2 years
Criteria for alternative MS medication (rescue therapy) use
Confirmed disability progression at any time OR the subject has completed 48 weeks of blinded treatment and experiences at least 1 confirmed relapse any time after 24 weeks
Confirmed disability progression at any time OR the subject has completed 48 weeks of blinded treatment and experiences 2 confirmed relapses
Inclusion/exclusion criteria
Any prior treatment with GA (exclusion criteria)
168
BID=twice daily; TID=3 times daily; GA=glatiramer acetate; MS=multiple sclerosis.Gold R et al. N Engl J Med. 2012;367:1098-1107; Fox R et al. N Engl J Med. 2012;367:1087-1197.
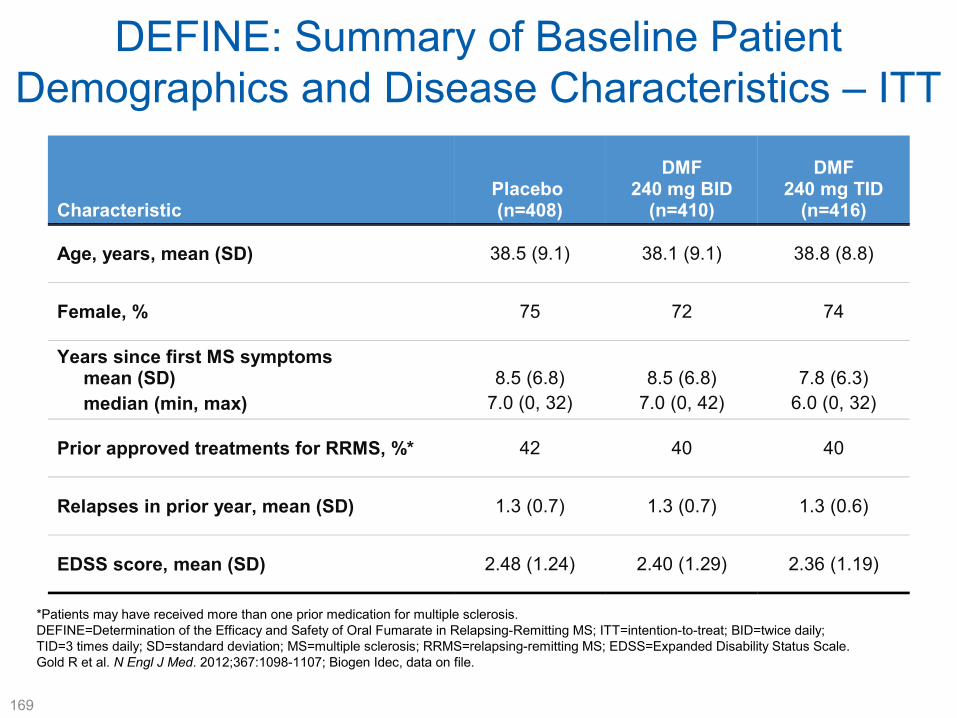
DEFINE: Summary of Baseline Patient Demographics and Disease Characteristics – ITT
Characteristic Placebo (n=408)
DMF240 mg BID
(n=410)
DMF240 mg TID
(n=416)
Age, years, mean (SD) 38.5 (9.1) 38.1 (9.1) 38.8 (8.8)
Female, % 75 72 74
Years since first MS symptoms mean (SD) median (min, max)
8.5 (6.8)7.0 (0, 32)
8.5 (6.8)7.0 (0, 42)
7.8 (6.3)6.0 (0, 32)
Prior approved treatments for RRMS, %* 42 40 40
Relapses in prior year, mean (SD) 1.3 (0.7) 1.3 (0.7) 1.3 (0.6)
EDSS score, mean (SD) 2.48 (1.24) 2.40 (1.29) 2.36 (1.19)
169
*Patients may have received more than one prior medication for multiple sclerosis.DEFINE=Determination of the Efficacy and Safety of Oral Fumarate in Relapsing-Remitting MS; ITT=intention-to-treat; BID=twice daily; TID=3 times daily; SD=standard deviation; MS=multiple sclerosis; RRMS=relapsing-remitting MS; EDSS=Expanded Disability Status Scale.Gold R et al. N Engl J Med. 2012;367:1098-1107; Biogen Idec, data on file.

CONFIRM: Summary of Baseline Patient Demographics and Disease Characteristics – ITT
170
CharacteristicPlacebo(n=363)
BG-1240 mg BID
(n=359)
BG-1240 mg TID
(n=345)G
(n=350)
Age, years, mean (SD) 36.9 (9.24) 37.8 (9.35) 37.8 (9.39) 36.7 (9.06)
Female, % 69 68 72 71
Years since first MS symptoms, mean (SD) median (min, max)
7.6 (5.98)6.0 (0, 33)
8.2 (6.89)7.0 (0, 35)
7.8 (6.70)6.0 (0, 33)
7.1 (5.92)6.0 (0, 29)
Prior approved treatments for RRMS, %*
31 28 29 29
Relapses in prior year,mean (SD)
1.4 (0.80) 1.3 (0.63) 1.4 (0.72) 1.4 (0.64)
EDSS score, mean (SD) 2.59 (1.17) 2.56 (1.20) 2.52 (1.19) 2.57 (1.22)
*Patients may have received more than one prior DMT. Prior use of GA was an exclusion criteria.CONFIRM=Comparator and an Oral Fumarate in Relapsing-Remitting MS; ITT=intention-to-treat; BID=twice daily; TID=3 times daily;GA=glatiramer acetate; SD=standard deviation; MS=multiple sclerosis; RRMS=relapsing-remitting MS; EDSS=Expanded Disability Status Scale; DMT=disease-modifying therapy.Fox R et al. Presented at AAN; April 21–28, 2012; New Orleans, LA. S01.003; Biogen Idec, data on file.

0.6
0.5
0.4
0.3
0.2
0.1
0
DEFINE and CONFIRM: Probability of Relapse
Hazard ratio (95% CI):BID vs placebo=0.51 (0.40, 0.66); 49% risk reduction; P<0.0001TID vs placebo=0.50 (0.39, 0.65); 50% risk reduction; P<0.0001
Placebo (n=408)DMF 240 mg BID (n=410)DMF 240 mg TID (n=416)
Time on Study (weeks)
Pro
bab
ilit
y o
f R
elap
se
BL 12 24 36 48 60 72 84 96
0.461
0.2700.260
171
INEC=Independent Neurology Evaluation Committee; CI=confidence interval; BID=twice daily;TID=three times daily; BL=baseline.
0.6
BL 12 24 36 48 60 72 84 960
0.1
0.2
0.3
0.4
0.5
Prob
abili
ty o
f Rel
apse
Time on Study (Weeks)
240 mg BID vs placebo=0.66 (0.51, 0.86): 34% reduction; P=0.0020240 mg TID vs placebo=0.55 (0.42, 0.73):
45% reduction; P<0.0001GA vs placebo=0.71 (0.55, 0.92): 29% reduction; P=0.0097
0.291
0.241
0.321
0.410
PlaceboGADMF 240 mg BIDDMF 240 mg TID
DEFINE CONFIRM

0.40
0.22 0.20
0.29
0
0.1
0.2
0.3
0.4
0.5
0.6
Placebo (n=363)
BG-12 BID (n=359)
BG-12 TID (n=345)
GA (n=350)
0.36
0.17 0.19
0
0.1
0.2
0.3
0.4
0.5
0.6
Placebo (n=408)
BG-12 BID (n=410)
BG-12 TID (n=416)
44%reduction
vs placeboP<0.001
51%reduction
vs placeboP<0.001
*Annualized relapse rate calculated with negative binomial regression, with prespecified adjustment for baseline EDSS score (≤2.0 vs >2.0), baseline age (<40 vs ≥40 years), region, and number of relapses in the 1 year prior to study entry; data after switch to alternative MS therapy were excluded; CI=confidence interval; EDSS=Expanded Disability Status Scale. Gold R et al. N Engl J Med. 2012;367:1098-1107;Fox R et al. N Engl J Med. 2012;367:1087-1197.
29%reduction
vs placeboP<0.05
Annualized Relapse Rate at 2 Years
172
53%reduction
vs placeboP<0.001
48%reduction
vs placeboP<0.001
An
nu
ali
zed
Re
lap
se
Ra
te*
(95
% C
I)
An
nu
ali
zed
Re
lap
se
Ra
te*
(95
% C
I)
CONFIRM DEFINE

12-Week Confirmed Disability Progression
173
*Estimated proportion of patients with progression and time to progression up to 96 weeks based on the Kaplan-Meier product limit method;†based on Cox proportion hazards model, adjusted for baseline EDSS score (≤2.0 vs >2.0), region, and baseline age (<40 vs ≥40 years).BID=twice daily; TID=3 times daily; BL=baseline; GA=glatiramer acetate; EDSS=Expanded Disability Status Scale.Gold R et al. N Engl J Med. 2012;367:1098-1107; Fox R et al. N Engl J Med. 2012;367:1087-1197.
Pat
ien
ts w
ith
Dis
abil
ity
Pro
gre
ssio
n*
(%)
12 24 36 48 60 72 84 96
Time on Study (weeks)
0
10
20
30BID=38% risk reduction, P=0.005†
TID=34% risk reduction, P=0.013†
18%
16%
27%
BL
PlaceboDMF BIDDMF TID
12 24 36 48 60 72 84 96
Time on Study (weeks)
0
BID=21% risk reduction, P=0.25†
TID=24% risk reduction, P=0.20†
GA=7% risk reduction, P=0.70†
16%
13%
17%
BL
PlaceboDMF BIDDMF TID
13%
GA
10
20
30
CONFIRM DEFINE
Pat
ien
ts w
ith
Dis
abil
ity
Pro
gre
ssio
n*
(%)

MRI Results: Mean Number of New or Newly Enlarging T2-Hyperintense Lesions at 2 Years*
174
*Negative binomial regression analysis, adjusted for region and baseline T2 lesion volume.MRI=magnetic resonance imaging; BID=twice daily; TID=3 times daily; GA=glatiramer acetate.Gold R et al. N Engl J Med. 2012;367:1098-1107; Fox R et al. N Engl J Med. 2012;367:1087-1197.
New
or
New
ly E
nla
rgin
g T
2 L
esio
ns
* (m
ean
)
New
or
New
ly E
nla
rgin
g T
2 L
esio
ns*
(m
ean
)
74%reduction
vs placeboP<0.001
85%reduction
vs placeboP<0.001
71%reduction
vs placeboP<0.001
73%reduction
vs placeboP<0.001
54%reduction
vs placeboP<0.001
CONFIRM DEFINE

MRI Results: Mean Number of Gd+ Lesionsat 2 Years*
175
*Ordinal logistic regression analysis, adjusted for region and baseline number of Gd+ lesions.MRI=magnetic resonance imaging; Gd+=gadolinium-enhancing; BID=twice daily; TID=3 times daily; GA=glatiramer acetate.Gold R et al. N Engl J Med. 2012;367:1098-1107; Fox R et al. N Engl J Med. 2012;367:1087-1197.
Gd
+ L
esio
ns
(mea
n)
Gd
+ L
esio
ns
(mea
n)
73%reduction
vs placeboP=0.001
90%reduction
vs placeboP<0.001
74%reduction
vs placeboP<0.001
65%reduction
vs placeboP=0.001
61%reduction
vs placeboP=0.001
CONFIRM DEFINE

MRI Results: Mean Number of NewT1-Hypointense Lesions at 2 Years*
176
New
T1-
Hyp
oin
ten
se L
esio
ns*
(m
ean
)
New
T1-
Hyp
oin
ten
se L
esio
ns*
(m
ean
)
63%reduction
vs placeboP<0.001
72%reduction
vs placeboP<0.001
57%reduction
vs placeboP<0.001
65%reduction
vs placeboP<0.001
41%reduction
vs placeboP<0.001
*Negative binomial regression analysis, adjusted for region and baseline T1 lesion volume.MRI=magnetic resonance imaging; BID=twice daily; TID=3 times daily; GA=glatiramer acetate.Arnold DL et al. Presented at ECTRIMS, October 19–22, 2011. Amsterdam, The Netherlands. P831; Fox R et al. N Engl J Med. 2012;367:1087-1197.
CONFIRM DEFINE


Endpoints dello studio
Endpoint primario• Numero totale di nuove lesioni Gd+ alla RM a 12, 16, 20 e 24 settimane
Endpoints secondari alla RM• Numero cumulativo di nuove lesioni Gd+ dalla quarta alla ventiquattresima
settimana• Numero di lesioni nuove/ingranditeT2-iperintense a 24 settimane
Obiettivi aggiuntivi• Numero di nuove lesioni T1-ipointense a 24 settimane • Sicurezza e tollerabilità• Recidive, disabilità
Kappos L et al. Lancet. 2008;372:1463-1472.
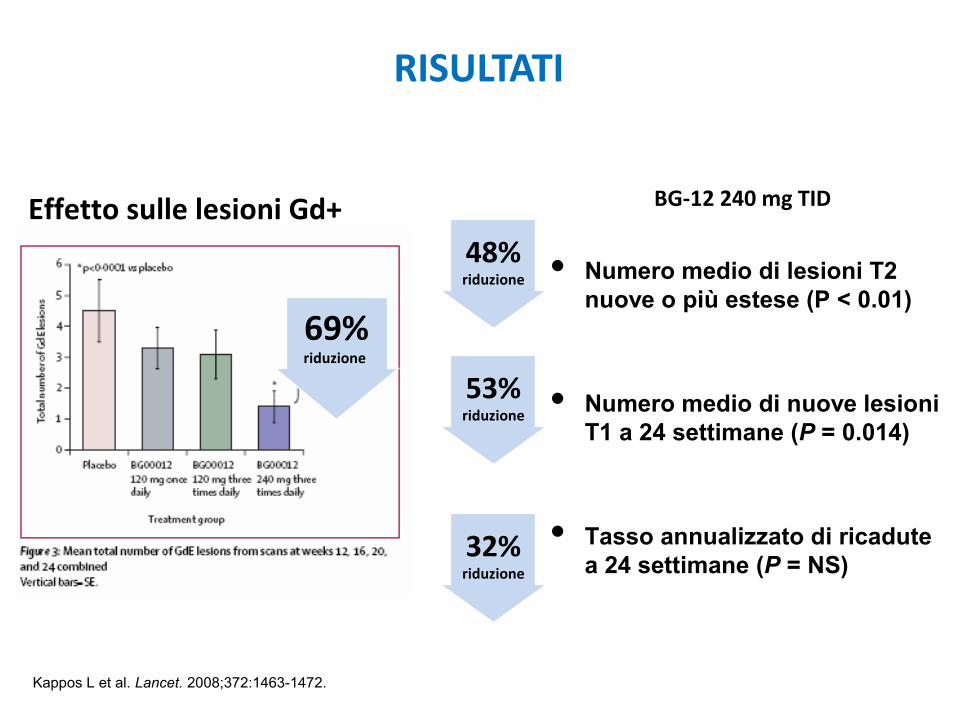
RISULTATI
Numero medio di lesioni T2 nuove o più estese (P < 0.01)
Numero medio di nuove lesioni T1 a 24 settimane (P = 0.014)
Tasso annualizzato di ricadute a 24 settimane (P = NS)
48%riduzione
53%riduzione
32%riduzione
69%riduzione
Effetto sulle lesioni Gd+
Kappos L et al. Lancet. 2008;372:1463-1472.
BG-12 240 mg TID

DEFINE: schema dello studio
0 48 968424 7212 36 60
EDSS/MSFC/VFT
Screening
BG-12 PO 240 mg BID (480 mg/day)
BG-12 PO 240 mg TID (720 mg/day)
Placebo
Randomization1:1:1
Study week
SF-36/EQ-5D
Year 1 Year 2
Hematology and lipid profile
124 8 24 48 96847236 60
Other++
++ Vital signs, blood chemistry, urinalysis and urine cytology, physician exam
1.234 pazienti randomizzati
540 pazienti hanno fatto RM

Criteri di inclusione
• SM RR secondo i criteri di McDonald (1–4)1
• 18 - 55 anni
• EDSS fra 0.0 and 5.0
• > 1 ricaduta nell’anno precedente e lesioni tipiche alla RM o > 1 lesioni Gd + alla RM encefalo effettuata entro 6 settimane prima della randomizzazione
• Consenso informato scritto
1. McDonald WI et al. Ann Neurol. 2001;50:120-127.
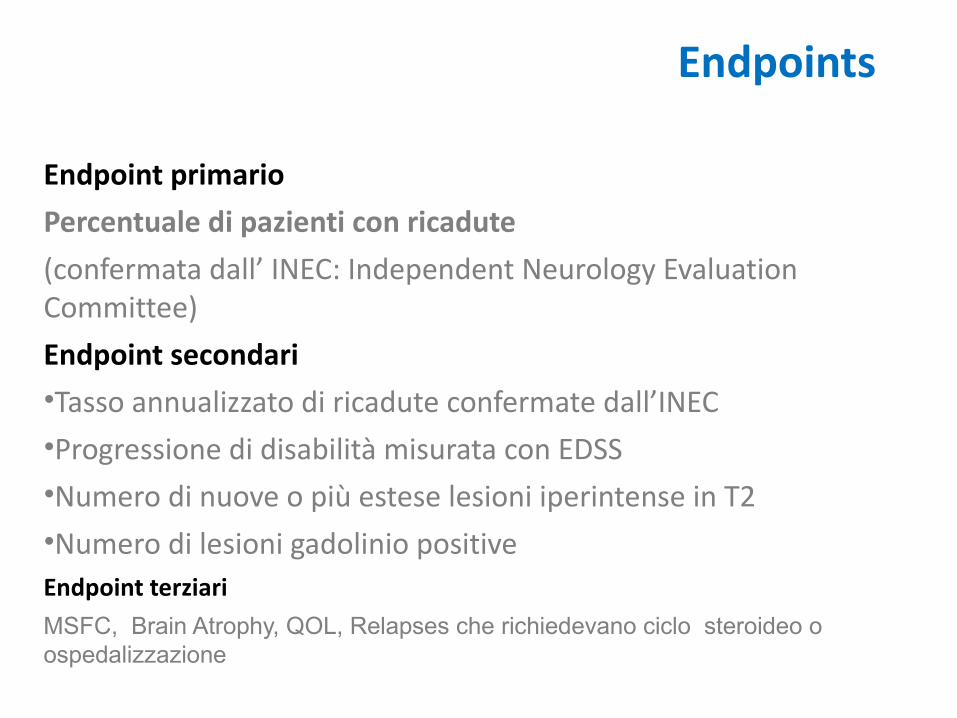
Endpoints
Endpoint primario Percentuale di pazienti con ricadute (confermata dall’ INEC: Independent Neurology Evaluation Committee)Endpoint secondari •Tasso annualizzato di ricadute confermate dall’INEC•Progressione di disabilità misurata con EDSS•Numero di nuove o più estese lesioni iperintense in T2•Numero di lesioni gadolinio positiveEndpoint terziari MSFC, Brain Atrophy, QOL, Relapses che richiedevano ciclo steroideo o ospedalizzazione

Tertiary Endpoints
• Disability – MSFC z score, PASAT, Sloan low-contrast visual acuity
• MRI– Brain atrophy (SIENA), magnetization transfer ratio (lesions and
whole brain), T1 lesion counts and volumes, Gd+ and T2 lesion volume, conversion of Gd+ lesions into T1 lesions
• Patient-reported outcomes – SF-36, EQ-5D
• Relapses requiring IV steroids or hospitalization
MSFC=Multiple Sclerosis Functional Composite; PASAT=Paced Auditory Serial Addition Test; MRI=magnetic resonance imaging;SIENA=Structural Image Evaluation using Normalization of Atrophy; Gd+=gadolinium-enhancing; SF-36=Short Form (36)Health Survey; EQ-5D=EuroQol-5D Health Survey; IV=intravenous.

Endpoint primarioProporzione di pazienti con ricadute
(confermate da INEC)Hazard ratio (95% CI); P value BG-12 BID vs placebo=0.51 (0.40, 0.66); 49% risk reduction P<0.0001BG-12 TID vs placebo=0.50 (0.39, 0.65); 50% risk reduction P<0.0001
Placebo (n=408)BG-12 240 mg BID (n=410)BG-12 240 mg TID (n=416)
Time on Study (weeks)
0.6
0.5
0.4
0.3
0.2
0.1
0
Pro
bab
ilit
y o
f R
elap
se
BL 12 24 36 48 60 72 84 96
INEC=Independent Neurology Evaluation Committee; CI=confidence interval; BID=twice daily; TID=three times daily; BL=baseline.
Placebo=0.461
BID=0.270TID=0.260
Placebo 406 358 321 282 243 224 205 190 115240 mg BID 410 353 324 303 288 287 255 243 154240 mg TID 418 348 322 301 288 270 251 244 166
Number of Patients at Risk
RR 49%

Tasso annualizzato di ricadute(endpoint secondario)
0.364
0.172 0.189
CI=confidence interval; BID=twice daily; TID=three times daily.
53%reduction
48%reduction
P<0.0001

Tasso annualizzato di ricadute per anno*
50%reductionP<0.0001
44%reductionP=0.0002 52%
reductionP<0.0001
49%reductionP=0.0001
*ARR is calculated as the total number of relapses occurred during the study for all subjects, divided by the total number of subject-years followed in the study. P values relative to placebo.BID=twice daily; TID=three times daily; ARR=annualized relapse rate; CI=confidence interval.

Placebo240 mg BID240 mg TID
Number of Patients at Risk408409416
375359360
345333346
319325325
291304324
265290291
242278276
224267266
129167168
0
0.1
0.3
Pro
po
rtio
n o
f S
ub
ject
s w
ith
Co
nfi
rmed
Pro
gre
ssio
n o
f D
isab
ilit
y
BL 12 24 36 48 60 72 84 96
Placebo (n=408)BG-12 240 mg BID (n=410)BG-12 240 mg TID (n=416)
Time on Study (Weeks)
0.2
Note: confirmed progression of disability is defined as 1.0-point increase on the EDSS from a baseline EDSS score ≥1.0 sustained for 12 weeks. Subjects are censored if they withdrew from study or switched to alternative MS medication without a progression. *P value and hazard ratio (active/placebo) based on a Cox proportional hazards model, adjusted for age (<40 vs ≥40 years), baseline EDSS score, and region; †Kaplan–Meier estimate of the proportion of subjects’ confirmed progression within 2 years. EDSS=Expanded Disability Status Scale; ITT=intent-to-treat; CI=confidence interval; TID=three times daily; BID=twice daily; BL=baseline. SOURCE: 109MS301/CSR/F-PROG-12WK.SAS.
Placebo=0.271
240 mg BID=0.164240 mg TID=0.174
Progressione di disabilità (mantenuta per 12 settimane)
end-point secondario
Hazard ratio (95% CI)*BID vs placebo=0.62 (0.44, 0.87); 38% risk reduction P=0.0050TID vs placebo=0.66 (0.48, 0.92); 34% risk reduction P=0.0128
RR 38%
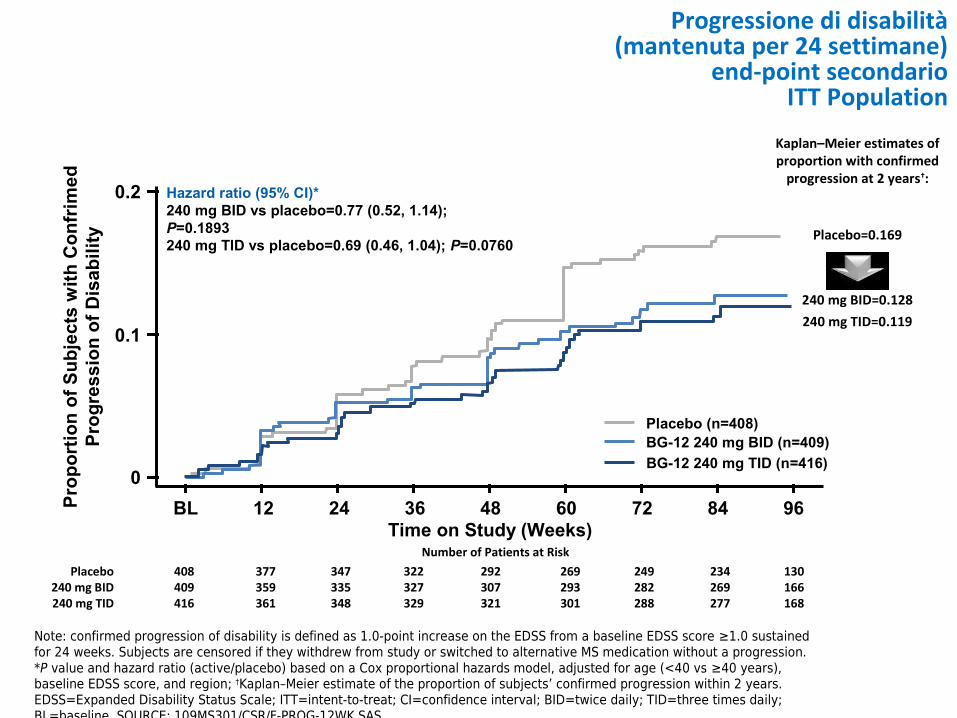
Placebo240 mg BID240 mg TID
Number of Patients at Risk408409416
377359361
347335348
322327329
292307321
269293301
249282288
234269277
130166168
0
0.1
0.2
Pro
po
rtio
n o
f S
ub
ject
s w
ith
Co
nfr
imed
Pro
gre
ssio
n o
f D
isab
ilit
y
BL 12 24 36 48 60 72 84 96
Placebo (n=408)BG-12 240 mg BID (n=409)
BG-12 240 mg TID (n=416)
Time on Study (Weeks)
Hazard ratio (95% CI)*240 mg BID vs placebo=0.77 (0.52, 1.14); P=0.1893240 mg TID vs placebo=0.69 (0.46, 1.04); P=0.0760
240 mg TID=0.119240 mg BID=0.128
Placebo=0.169
Kaplan–Meier estimates of proportion with confirmed
progression at 2 years†:
Note: confirmed progression of disability is defined as 1.0-point increase on the EDSS from a baseline EDSS score ≥1.0 sustained for 24 weeks. Subjects are censored if they withdrew from study or switched to alternative MS medication without a progression. *P value and hazard ratio (active/placebo) based on a Cox proportional hazards model, adjusted for age (<40 vs ≥40 years), baseline EDSS score, and region; †Kaplan–Meier estimate of the proportion of subjects’ confirmed progression within 2 years. EDSS=Expanded Disability Status Scale; ITT=intent-to-treat; CI=confidence interval; BID=twice daily; TID=three times daily; BL=baseline. SOURCE: 109MS301/CSR/F-PROG-12WK.SAS.
Progressione di disabilità (mantenuta per 24 settimane)
end-point secondarioITT Population

DEFINE: RIASSUNTO DELL’EFFICACIA CLINICA
BG-12 BID vs placebo:
– Riduce la proporzione di ricadute del 49% (P<0.0001)
– Riduce il tasso annualizzato di ricadute (ARR) del 53% (P<0.0001)
– Riduce il rischio di progressione di disabilità (mantenuta a 12 settimane) del 38% (P=0.0050)
BID=due volte al giorno.

MRI Results
Me
an
Nu
mb
er
of
Ne
w T
1 L
es
ion
s a
t 9
6 W
ee
ks
Me
an
Nu
mb
er
of
Ne
w o
r N
ew
ly
En
larg
ing
T2
Le
sio
ns
at
96
We
ek
s
Me
an
Nu
mb
er
of
Gd
+
Le
sio
ns
at
96
We
ek
s
Reductions90%* 73%*
Reductions85%* 74%*
Overall 2 YearsOverall 2 Years Overall 2 Years
*P<0.0001 vs placebo; †secondary endpoint; ‡tertiary endpoint.
Gd+ Lesions†
New or Newly EnlargingT2 Lesions† New T1 Lesions‡
Placebo (n=165) BG-12 240 mg BID (n=152) BG-12 240 mg TID (n=152)
Reductions72%* 63%*
Gold R, et al. Presented at ECTRIMS, 2011, Amsterdam, The Netherlands. S34. Oral presentation; Arnold DL et al. Presented at ECTRIMS, 2011, Amsterdam, The Netherlands. P831; Arnold DL et al. Presented at AAN, 2012, New Orleans, LA, USA. S11.003.

Brain atrophy(% Change in Whole Brain Volume)
Med
ian
% c
hang
e in
w
hole
bra
in v
olum
e
based on ANCOVA on ranked data, adjusted for region and normalized brain volume at baseline/Week 24.
5% 30% 17%21%p=0.021 p=0.248p=0.045 p=0.640

Qualità di vita (SF-36):variazioni medie a 2 anni

Treatment Discontinuation
Randomized (N=1237)Dosed (N=1234)
BG-12 240 mg TIDn=416; n (%)
BG-12 240 mg BIDn=410; n (%)
Placebon=408; n (%)
Discontinued 127 (31)
MS relapse 10 (2)
MS progression 7 (2)
Lost to follow-up 11 (3)
Adverse event 56 (13)
Consent withdrawn 18 (4)
Investigator dx 2 (<1)
Subject noncompliant 9 (2)
Death† 1 (<1)
Other 13 (3)
Discontinued 126 (31)
MS relapse 4 (<1)
MS progression 7 (2)
Lost to follow-up 9 (2)
Adverse event 61 (15)
Consent withdrawn 18 (4)
Investigator dx 4 (<1)
Subject noncompliant 3 (<1)
Death* 0 (0)
Other 20 (5)
Discontinued 145 (35)
MS relapse 31 (8)
MS progression 14 (3)
Lost to follow-up 7 (2)
Adverse event 22 (5)
Consent withdrawn 34 (8)
Investigator dx 4 (<1)
Subject noncompliant 3 (<1)
Death 0 (0)
Other 28 (7)
Completed entire 96-week study
289 (69%)
Completed entire 96-week study
284 (69%)
Completed entire 96-week study
265 (65%)
*A patient died approximately 3 weeks after withdrawing from the study due to a cycling accident; †death was due to a motor vehicle accident. BID=twice daily; TID=three times daily; MS=multiple sclerosis; dx=discontinued.

0.4
0.3
0.2
0.1
0 BL 12 24 36 48 60 72 84 96
Prob
abili
ty o
f With
draw
al fr
om S
tudy
BL 12 24 36 48 60 72 84 96
Time on Study Drug (weeks) Time on Study (weeks)
DEFINE: Time to Discontinuation and Withdrawal:ITT Population
Drug Discontinuation Study Withdrawal
Prob
abili
ty o
f Dis
cont
inua
tion
of S
tudy
Dru
g
0.3
0.2
0.1
0
Placebo (n=408)BG-12 240 mg BID (n=410)BG-12 240 mg TID (n=416)
Placebo (n=408)BG-12 240 mg BID (n=410)BG-12 240 mg TID (n=416)
Number of Patients at RiskPlacebo408 387 354 336 313 293 276 272 134240 mg BID410 357 344 331 313 304 297 269 135240 mg TID416 359 344 335 324 310 302 294 150
Number of Patients at RiskPlacebo408 395 379 365 350 340 329 327 242240 mg BID410 382 366 359 346 341 336 328 237240 mg TID416 380 370 356 348 337 334 329 247
ITT=intent-to-treat; BID=twice daily; TID=three times daily; BL=baseline.

Proportion of Patients Relapsed at 2-Years* (Sensitivity Analyses)
*Logistic regression models; †P<0.0001 for all categories unless otherwise stated;‡hazard ratio for the primary analysis; §P=0.0002.
Favors BG-12 Favors Placebo
INEC-confirmed (ITT)(any lack of efficacy or rescue med considered as relapsed)
INEC-confirmed (ITT)(All subjects with an unknown relapse status considered as having relapsed)
INEC-confirmed (Completers)(any lack of efficacy or rescue med considered as relapsed)
0.51 (0.40, 0.66)‡
0.50 (0.39, 0.65)‡
0.42 (0.31, 0.57)
0.41 (0.30, 0.56)
0.59 (0.45, 0.78)§
0.56 (0.43, 0.74)
0.45 (0.32, 0.63)
0.42 (0.30, 0.59)
0.2 0.5 2 5Odds Ratio (95% CI)
Odds Ratio (95% CI)†
INEC-confirmed (ITT)‡
(primary analysis)
BG-12 TIDBG-12 BID

Safety: dati riassuntivi
BG-12 è stato ben tollerato e non sono state osservate significative differenze con il placebo nell’incidenza globale di AEs, SAEs e AEs che abbiano portano ad interruzione del trattamento.
AEs più comuni: •flushing (38-32%)•disturbi GI (diarrea: 15-19%; nausea 13%; vomito 16%; dolore addominale 11-9%)•verificatisi precocemente durante il trattamento (soprattutto nel 1° mese) •intensità da lieve a moderata•raramente hanno portato ad interruzione del trattamento o drop-out
•Le infezioni erano ugualmente distribuite tra I gruppi •Non si sono verificate infezioni opportunistiche nei pz in trattamento con BG-12•Non si sono verificati tumori maligni nei paz in trattamento con BG-12

DEFINE: Common AEs in≥5% of Subjects in Placebo or BG-12 Groups
*Indicates ≥3 percentage points higher in either BG-12 group vs placebo.AE=adverse event; BID=twice daily; TID=three times daily; MS=multiple sclerosis.Selmaj K et al. Presented at ECTRIMS, 2011, Amsterdam, The Netherlands. P994.
Event, n (%)Placebo(n=408)
BG-12 240 mg BID(n=410)
BG-12 240 mg TID(n=416)
Patients with any event 387 (95) 395 (96) 396 (95)
Flushing* 20 (5) 154 (38) 132 (32)
MS relapse 189 (46) 111 (27) 114 (27)
Nasopharyngitis 101 (25) 108 (26) 109 (26)
Headache 80 (20) 81 (20) 80 (19)
Diarrhea* 55 (13) 62 (15) 78 (19)
Fatigue 54 (13) 57 (14) 63 (15)
Upper respiratory infection 53 (13) 63 (15) 51 (12)
Urinary tract infection 53 (13) 55 (13) 54 (13)
Nausea* 38 (9) 53 (13) 54 (13)
Back pain 57 (14) 59 (14) 46 (11)
Upper abdominal pain* 28 (7) 40 (10) 52 (13)
Proteinuria* 34 (8) 38 (9) 50 (12)
Abdominal pain* 22 (5) 46 (11) 37 (9)
Arthralgia 39 (10) 46 (11) 37 (9)

Event, n (%)Placebo(n=408)
BG-12 240 mg BID(n=410)
BG-12 240 mg TID(n=416)
Influenza 39 (10) 34 (8) 48 (12)
Pruritus* 19 (5) 42 (10) 34 (8)
Paresthesia 38 (9) 35 (9) 38 (9)
Vomiting* 24 (6) 40 (10) 30 (7)
Pain in extremity 29 (7) 37 (9) 29 (7)
Depression 33 (8) 29 (7) 33 (8)
Rash* 13 (3) 34 (8) 27 (6)
Hot flush* 8 (2) 31 (8) 29 (7)
ALT increased* 13 (3) 29 (7) 27 (6)
Erythema* 5 (1) 20 (5) 33 (8)
Hematuria 19 (5) 26 (6) 26 (6)
Sinusitis* 20 (5) 17 (4) 34 (8)
Gastroenteritis 21 (5) 28 (7) 21 (5)
Bronchitis 18 (4) 21 (5) 26 (6)
*Indicates ≥3 percentage points higher in either BG-12 group vs placebo.AE=adverse event; BID=twice daily; TID=three times daily; ALT=alanine aminotransferase.Selmaj K et al. Presented at ECTRIMS, 2011, Amsterdam, The Netherlands. P994.
DEFINE: Common AEs in≥5% of Subjects in Placebo or BG-12 Groups

Serious AEs
• Incidence of 21%, 18%, and 16% in the placebo,BG-12 BID, and BG-12 TID treatment groups, respectively– MS relapse was the most common, with greater incidence in the
placebo arm– Gastroenteritis, gastritis, ovarian cyst, headache,
and pneumonia were the only other serious AEs in2 or more patients in a BG-12 group
AE=adverse event; BID=twice daily; TID=three times daily; MS=multiple sclerosisGold R, et al. Presented at ECTRIMS, 2011, Amsterdam, The Netherlands. S34;Selmaj K et al. Presented at ECTRIMS, 2011, Amsterdam, The Netherlands. P994.
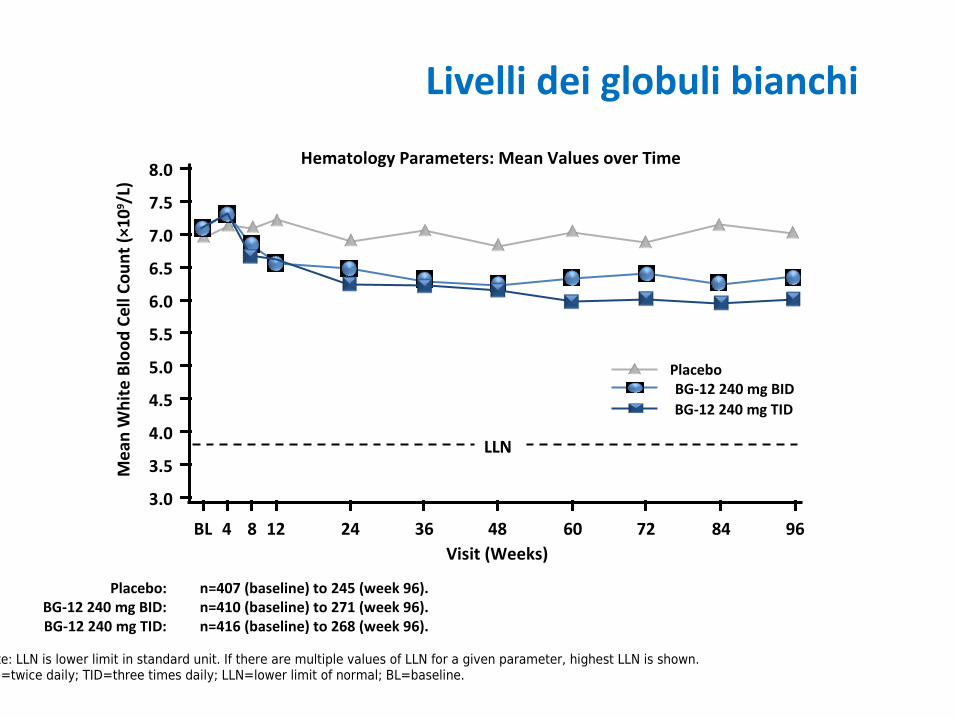
Livelli dei globuli bianchi
3.0
3.5
4.0
4.5
5.0
5.5
6.0
6.5
7.0
7.5
8.0
Mea
n W
hite
Blo
od C
ell C
ount
(×10
9 /L)
BL 4 8 12 24 36 48 60 72 84 96Visit (Weeks)
Placebo:BG-12 240 mg BID:BG-12 240 mg TID:
n=407 (baseline) to 245 (week 96). n=410 (baseline) to 271 (week 96). n=416 (baseline) to 268 (week 96).
LLN
PlaceboBG-12 240 mg BIDBG-12 240 mg TID
Hematology Parameters: Mean Values over Time
Note: LLN is lower limit in standard unit. If there are multiple values of LLN for a given parameter, highest LLN is shown.BID=twice daily; TID=three times daily; LLN=lower limit of normal; BL=baseline.

Livelli dei linfociti
0
0.5
1.0
1.5
2.0
2.5
3.0
Mea
n Ly
mph
ocyt
e (×
109 /
L)
BL 8 12 24 36 48 60 72 84 96Visit (Weeks)
4
LLN
Hematology Parameters: Mean Values over Time
PlaceboBG-12 240 mg BIDBG-12 240 mg TID
Placebo:BG-12 240 mg BID:BG-12 240 mg TID:
n=407 (baseline) to 245 (week 96). n=410 (baseline) to 271 (week 96). n=416 (baseline) to 268 (week 96).
Note: LLN is lower limit in standard unit. If there are multiple values of LLN for a given parameter, highest LLN is shown.BID=twice daily; TID=three times daily; LLN=lower limit of normal; BL=baseline.
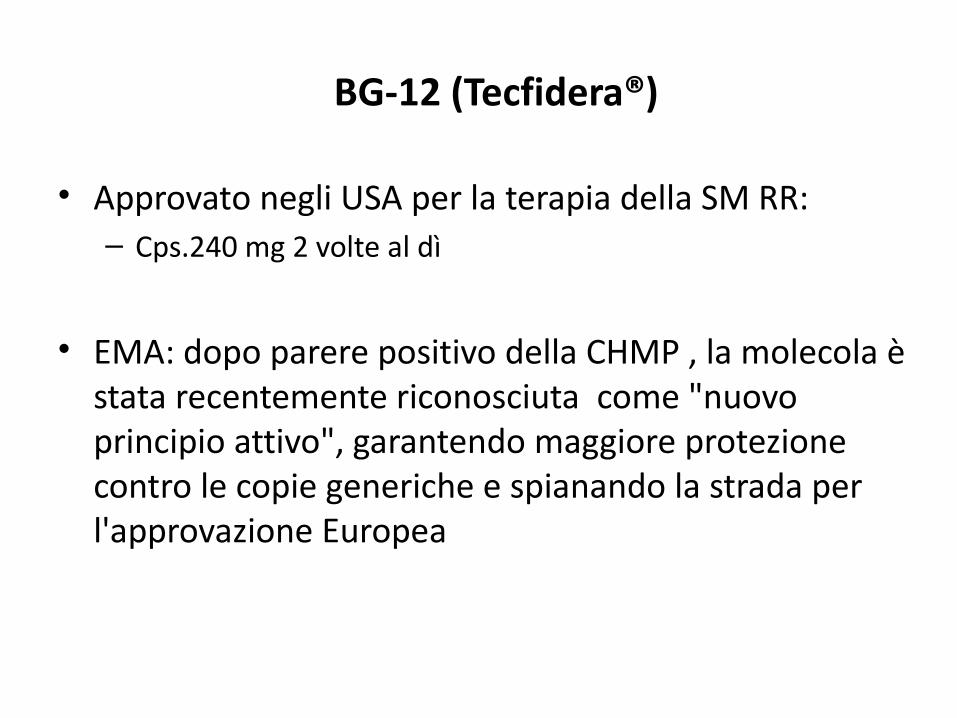
BG-12 (Tecfidera®)
• Approvato negli USA per la terapia della SM RR: – Cps.240 mg 2 volte al dì
• EMA: dopo parere positivo della CHMP , la molecola è stata recentemente riconosciuta come "nuovo principio attivo", garantendo maggiore protezione contro le copie generiche e spianando la strada per l'approvazione Europea
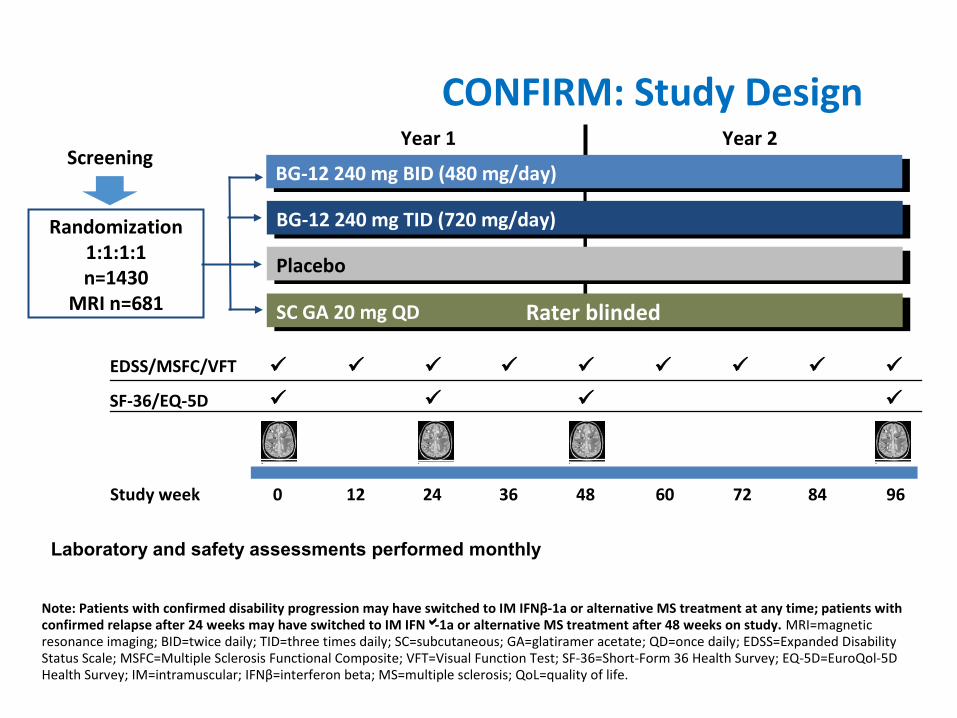
CONFIRM: Study Design
Note: Patients with confirmed disability progression may have switched to IM IFNβ-1a or alternative MS treatment at any time; patients with confirmed relapse after 24 weeks may have switched to IM IFN-1a or alternative MS treatment after 48 weeks on study. MRI=magnetic resonance imaging; BID=twice daily; TID=three times daily; SC=subcutaneous; GA=glatiramer acetate; QD=once daily; EDSS=Expanded Disability Status Scale; MSFC=Multiple Sclerosis Functional Composite; VFT=Visual Function Test; SF-36=Short-Form 36 Health Survey; EQ-5D=EuroQol-5D Health Survey; IM=intramuscular; IFNβ=interferon beta; MS=multiple sclerosis; QoL=quality of life.
0 48 968424 7212 36 60Study week
EDSS/MSFC/VFT
SF-36/EQ-5D
Screening
Randomization1:1:1:1n=1430
MRI n=681
Year 1 Year 2
SC GA 20 mg QDSC GA 20 mg QD
Placebo Placebo
BG-12 240 mg BID (480 mg/day)BG-12 240 mg BID (480 mg/day)
BG-12 240 mg TID (720 mg/day) BG-12 240 mg TID (720 mg/day)
Laboratory and safety assessments performed monthly
Rater blinded

DEFINE vs CONFIRM:BG-12 Phase 3 Study Comparison
DEFINE CONFIRM
CharacteristicPlacebo(n=408)
BG-12240 mg
BID(n=410)
BG-12240 mg
TID(n=416)
Placebo(n=363)
BG-12240 mg
BID(n=359)
BG-12240 mg
TID(n=345)
Primary endpointProportion of subjects relapsed at2 years
ARR at 2 years
Alternative MS medication use criteria
Disease progression at any time or the subject has completed 48 weeks of blinded treatment and experienced at least 1 confirmed relapse any time after 24 weeks
Disease progression at any time or the subject has completed 48 weeksof blinded treatment and experienced 2 confirmed relapses
Inclusion/exclusion criteria
Any prior treatment with GA(exclusion criteria)
Reference comparatorPatients treated with GA (n=350) were included as a comparator arm
BID=twice daily; TID=three times daily; ARR=annualized relapse rate; MS=multiple sclerosis; GA=glatiramer acetate.

CONFIRM: Key Inclusion/Exclusion Criteria
• Inclusion criteria– Aged 18 to 55 years – RRMS1
– Baseline EDSS score between 0.0 and 5.0 – 1 relapse in prior 12 months, or Gd+ lesion(s) in prior 6 weeks
• Exclusion criteria– Prior treatment with GA– Progressive forms of MS– A relapse or corticosteroids within 50 days prior to randomization– Insufficient washout period from prior immunomodulatory therapies
RRMS=relapsing-remitting MS; EDSS=Expanded Disability Status Scale; Gd+=gadolinium-enhancing;GA=glatiramer acetate; MS=multiple sclerosis.1. Polman C et al. Ann Neurol. 2005;58:840-846; Fox R, et al. Presented at AAN 2012, New Orleans, LA, USA. S01.003.

CONFIRM: Key Trial Endpoints
• Primary endpoint – ARR
• Secondary endpoints– Number of new or newly enlarging T2-hyperintense lesions*– Number of new T1-hypointense lesions*– Proportion of patients who relapsed at 2 years – 12-week sustained disability progression, as measured by EDSS
• Tertiary endpoints– Gd+ lesions– Quality-of-life measures– Comparison of benefit/risk for BG-12 vs placebo
*Imaging conducted at selected sites with MRI testing capability further validated by the MRI reading center.ARR=annualized relapse rate; EDSS=Expanded Disability Status Scale; Gd+=gadolinium-enhancing; MRI=magnetic resonance imagingFox R, et al. Presented at AAN 2012, New Orleans, LA, USA. S01.003.

Baseline Patient Demographics (ITT)
Characteristic Placebo (n=363)
BG-12240 mg BID
(n=359)
BG-12240 mg TID
(n=345)GA
(n=350)
Age, years
Mean (SD) 36.9 (9.24) 37.8 (9.35) 37.8 (9.39) 36.7 (9.06)
Range 18–56 18–55 18–55 18–55
Female, n (%) 251 (69) 245 (68) 250 (72) 247 (71)
Weight , kg, mean (SD) 72.64 (16.897) 71.90 (17.892) 72.48 (17.800) 71.38 (19.137)
Race, n (%)
White 305 (84) 304 (85) 292 (85) 290 (83)
Asian* 28 (8) 28 (8) 26 (8) 25 (7)
Black/African American 9 (2) 2 (<1) 5 (1) 11 (3)
Unknown 11 (3) 11 (3) 10 (3) 11 (3)
Other 10 (3) 14 (4) 12 (3) 13 (4)
*Includes Indian patients who self-reported race as Asian. ITT=intent-to-treat; BID=twice daily; TID=three times daily; GA=glatiramer acetate; SD=standard deviation.Fox R, et al. Presented at AAN 2012, New Orleans, LA, USA. S01.003.

Baseline Disease Characteristics (ITT)
Characteristic
Placebo(n=363)
BG-12 BID(n=359)
BG-12 TID(n=345)
GA(n=350)
Time since first MS symptoms Years (SD) 7.6 (5.98) 8.2 (6.89) 7.8 (6.70) 7.1 (5.92)
Median disease duration in years(since diagnosis) 4.0 3.0 3.0 3.0
Median EDSS score 2.5 2.5 2.5 2.5
Any prior treatment for MS, % 40 41 40 40
Prior approved MS DMT (%) 31 28 29 29
IFNβ-1a 80 (22) 66 (18) 70 (20) 76 (22)
IFNβ-1b 43 (12) 42 (12) 39 (11) 33 (9)
Natalizumab 6 (2) 2 (<1) 6 (2) 2 (<1)
GA 1 (<1) 1 (<1) 3 (<1) 1 (<1)

Annualized Relapse Rate(Primary Endpoint)
44%
reductionvs. placebo
P<0.0001
51%
reductionvs. placebo
P<0.0001
*ARR calculated with negative binomial regression, adjusted for baseline EDSS score (≤2.0 vs >2.0), baseline age (<40 vs ≥40 years), region, and number of relapses in the year prior to study entry.
29%
reductionvs. placebo
P=0.0128
AR
R (
95%
CI)
*

Annualized Relapse Rateby Year
n=303 n=292 n=305n=363 n=359 n=345 n=283n=350
0-1 years 1-2 years
Ad
just
ed A
RR
(95
% C
I)
43%reductionP=0.0002
46%reductionP<0.0001
34%
reductionP=0.047
49%reductionP=0.032
20%reductionP=0.246
27%reductionP=0.029

Time to First Relapse(Proportion of Patients Relapsed, INEC Confirmed)
Time on Study (Weeks)
0.6
BL 12 24 36 48 60 72 84 960
0.1
0.2
0.3
0.4
0.5
Prob
abili
ty o
f Rel
apse
HR (95% CI); P value240 mg BID vs placebo=0.66 (0.51, 0.86): 34% reduction; P=0.0020
240 mg TID vs placebo=0.55 (0.42, 0.73): 45% reduction; P<0.0001
GA vs placebo=0.71 (0.55, 0.92): 29% reduction; P=0.0097
240 mg BID=0.291
240 mg TID=0.241
GA=0.321
Placebo=0.410
Placebo240 mg BID240 mg TIDGA
363359345350
311304292308
265274269281
243256249257
220241235237
201228229229
188219220218
177210210206
122127143156
Patients at Risk, n
INEC=Independent Neurology Evaluation Committee; HR=hazard ratio; ; CI=confidence interval; BID=twice daily; TID=three times daily; GA=glatiramer acetate; BL=baseline.Fox R, et al. Presented at AAN 2012, New Orleans, LA, USA. S001.003.

Time to 12-Week Confirmed Disability Progression
(Secondary Endpoint)
0.2
BL 12 24 36 48 60 72 84 96‡
Time on Study (weeks)
0
0.1
Pro
po
rtio
n o
f S
ub
ject
s w
ith
Co
nfi
rmed
Pro
gre
ssio
n o
f D
isab
ilit
yHazard ratio (95% CI): P value
BG-12 BID = 0.79 (0.52, 1.19): 21% reduction p=0.2536
BG-12 TID = 0.76 (0.50, 1.16): 24% reduction p=0.2041
GA = 0.93 (0.63, 1.37): 7% reduction p=0.7036
Patients at Risk240 mg BID240 mg TID
GA
363359345350
339323309326
317302287307
297283277291
273270269279
254263262269
235257249262
228249238249
205*220*222*231*
Placebo =0.169
GA=0.156
BG-12 TID=0.130
BG-12 BID=0.128
*Numbers at risk 5 days prior to Week 96 (earlier window of Week 96 visit).
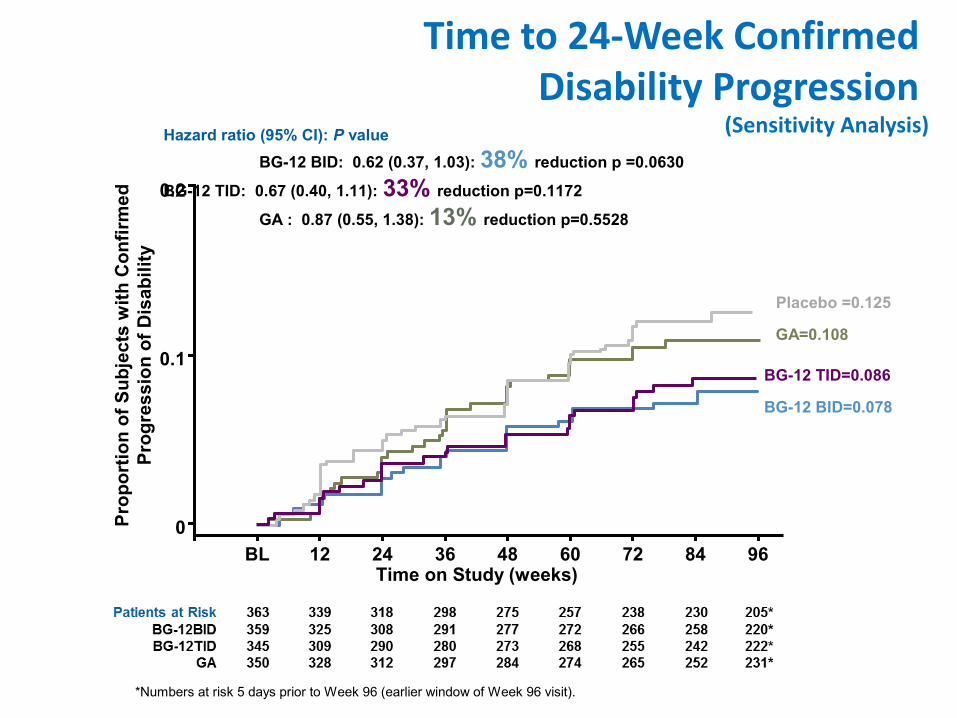
0.2
BL 12 24 36 48 60 72 84 96Time on Study (weeks)
0
0.1
Pro
po
rtio
n o
f S
ub
ject
s w
ith
Co
nfi
rmed
Pro
gre
ssio
n o
f D
isab
ilit
yHazard ratio (95% CI): P value
BG-12 BID: 0.62 (0.37, 1.03): 38% reduction p =0.0630
BG-12 TID: 0.67 (0.40, 1.11): 33% reduction p=0.1172
GA : 0.87 (0.55, 1.38): 13% reduction p=0.5528
Time to 24-Week Confirmed Disability Progression
(Sensitivity Analysis)
Placebo =0.125
GA=0.108
BG-12 TID=0.086
BG-12 BID=0.078
*Numbers at risk 5 days prior to Week 96 (earlier window of Week 96 visit).

SF-36 Physical and Mental Components:(Mean Change from Baseline)
Physical Mental
Mea
n C
han
ge
fro
m B
asel
ine P=0.0217
P=0.0519
P=0.0259 P=0.1671
P=0.6868
P=0.6487
*Higher score is more favorable

Summary of Key Efficacy Endpoints
• Both doses of BG-12 significantly improved clinical disease activity over time by reducing– ARR by 44% BID and 51%TID – Proportion of patients relapsed by 34% BID and 45% TID – Risk of 12-week sustained disability progression by 21% BID and 24% TID
• Consistent, positive treatment effects were seen in a broad patient population• Treatment effects were seen early and maintained over the course of
the study• GA vs placebo at 2 years reduced
– ARR by 29% – Proportion of patients relapsed by 29% – Accumulation of disability progression by 7%
ARR=annualized relapse rate; BID=twice daily; TID=three times daily; GA=glatiramer acetate.
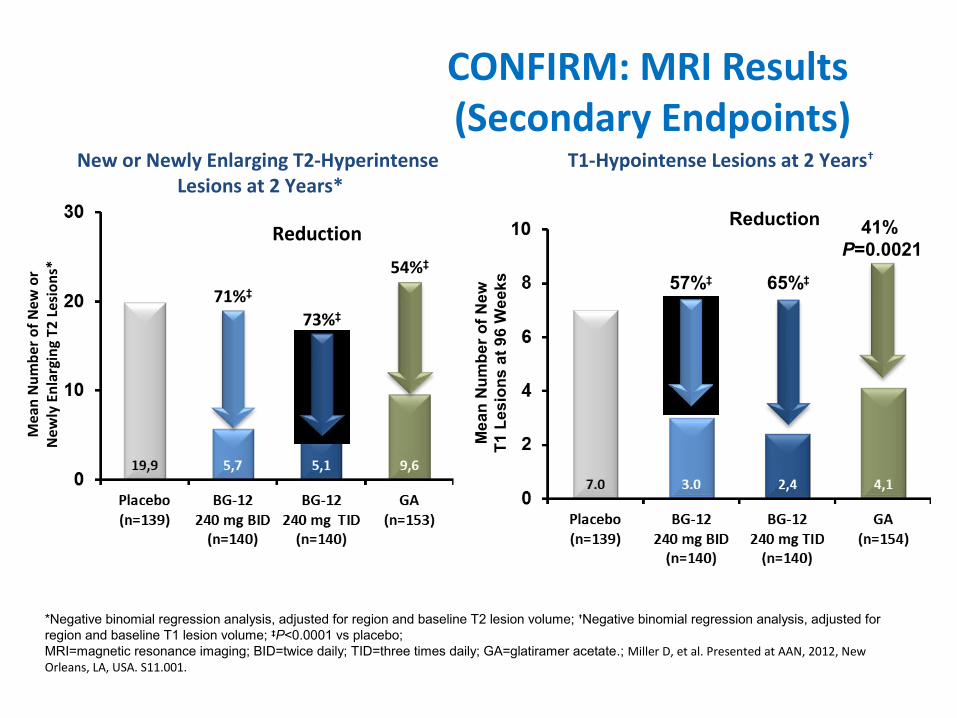
CONFIRM: MRI Results (Secondary Endpoints)
New or Newly Enlarging T2-Hyperintense Lesions at 2 Years*
T1-Hypointense Lesions at 2 Years†
71%‡
73%‡
54%‡
*Negative binomial regression analysis, adjusted for region and baseline T2 lesion volume; †Negative binomial regression analysis, adjusted for region and baseline T1 lesion volume; ‡P<0.0001 vs placebo;MRI=magnetic resonance imaging; BID=twice daily; TID=three times daily; GA=glatiramer acetate.; Miller D, et al. Presented at AAN, 2012, New Orleans, LA, USA. S11.001.
ReductionReduction
Mea
n N
umbe
r of N
ew o
rN
ewly
Enl
argi
ng T
2 Le
sion
s*
Me
an
Nu
mb
er
of
Ne
wT
1 L
es
ion
s a
t 9
6 W
ee
ks 57%‡ 65%‡
41% P=0.0021

Gd+ Lesions at 2 Years(Tertiary Endpoint)
74%P<0.0001 65%
P=0.0001
61%P=0.0003
Mea
n N
um
ber
of
Gd
+ L
esio
ns
p-values are for comparisons vs placebo, based on ordinal logistic regression analysis, adjusted for region and baseline number of Gd+ lesions.Percentages are the reduction in odds of having greater Gd+ lesion activity, compared to placebo.
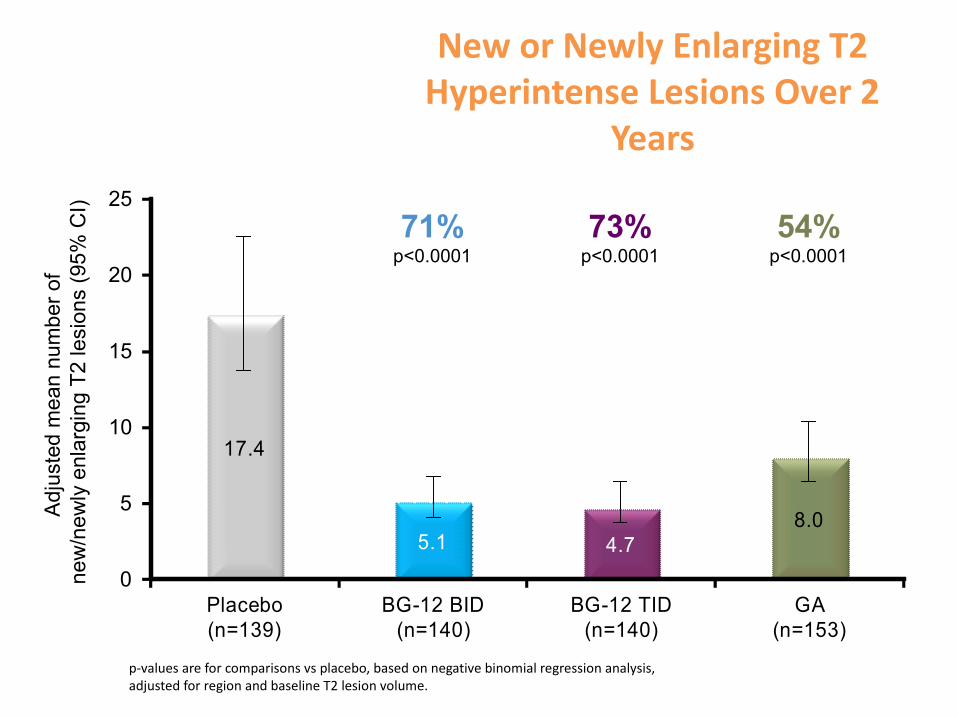
17.4
5.1 4.78.0
Placebo(n=139)
BG-12 BID(n=140)
BG-12 TID(n=140)
GA(n=153)
PE
New or Newly Enlarging T2 Hyperintense Lesions Over 2
Years
Adj
uste
d m
ean
num
ber
of
new
/new
ly e
nlar
ging
T2
lesi
ons
(95%
CI) 25
20
15
10
5
0
p-values are for comparisons vs placebo, based on negative binomial regression analysis, adjusted for region and baseline T2 lesion volume.
71%p<0.0001
73%p<0.0001
54%p<0.0001

New or Newly Enlarging T2 Hyperintense Lesions By Year
1–2 years0–1 years
Placebo (n=139)
BG-12 BID (n=140)
BG-12 TID (n=140)
GA (n=153)
Adj
uste
d m
ean
num
ber
of
new
/new
ly e
nlar
ging
T2
lesi
ons
15
10
5
0
All p values were <0.0001p-values are for comparisons vs placebo, based on negative binomial regression analysis, adjusted for region and baseline T2 lesion volume.
76% 76% 57%67% 70% 52%

7.0
3.0 2.4
4.1
Placebo (n=139) BG-12 BID(n=140)
BG-12 TID(n=140)
GA(n=154)
PE10
8
6
4
2
0
New (Non-enhancing) T1 Hypointense Lesions Over 2
Years
p-values are for comparisons vs placebo, based on negative binomial regression analysis, adjusted for region and baseline T1 lesion volume.
57%p<0.0001
65%p<0.0001
41%p=0.0021
Adj
uste
d m
ean
num
ber
of
new
T1
hypo
inte
nse
lesi
ons
(95%
CI)

New (Non-enhancing) T1 Hypointense Lesions By Year
p-values are for comparisons vs placebo, based on negative binomial regression analysis, adjusted for region and baseline T1 lesion volume.
70%p<0.0001
71%p<0.0001
55%p=0.0002
41%p=0.003
60%p<0.0001
30%p=0.0402
Placebo (n=139)
BG-12 BID (n=140)
BG-12 TID (n=140)
GA (n=154)
1–2 years0–1 years
Adj
uste
d m
ean
num
ber
of
new
T1
hypo
inte
nse
lesi
ons
5
4
3
2
1
0

Gd+ Lesions At 24 Weeks and 1 Year
p-values are for comparisons vs placebo, based on ordinal logistic regression analysis, adjusted for region and baseline number of Gd+ lesions.Percentages are the reduction in odds of having greater Gd+ lesion activity, compared to placebo.
81%p<0.0001
69%p<0.0001
42%p=0.0201
3
1
0
2
Me
an
nu
mbe
r o
f Gd
+ le
sion
s
At Year 1At Week 24
Placebo (n=144)
BG-12 BID (n=147)
BG-12 TID (n=144)
GA (n=161)
87%p<0.0001
77%p<0.0001
63%p<0.0001

Brain Atrophy(% Change in Whole Brain
Volume)
Placebo (n=144)
BG-12 240 mg BID (n=147)
BG-12 240 mg TID (n=143/144*)
GA (n=161)
0
–1.2
Change from baseline to Year 2 Change from Week 24 to Year 2
– 0.2
–0.4
–0.6
–0.8
–1.0
Med
ian
% c
han
ge
in w
ho
le b
rain
vo
lum
e
30%p=0.0645
21%p=0.2636
2%p=0.8802
5%p=0.8306
2%p=0.5621
16%p=0.7063

CONFIRM: in breve• BG-12 conferma una significativa attività nel ridurre le
ricadute cliniche (circa 50%) e l’attività infiammatoria alla RM (nuove lesioni T2: 71%-73%)
• La prevenzione delle nuove lesioni ipointense in T1 (57%-65%) e il trend di riduzione dell’atrofia cerebrale (30%-21%) sono in linea col potenziale effetto neuroprotettivo
• Il profilo di sicurezza è in linea con i dati del DEFINE• Non sono confermati I dati sulla EDSS
• La proporzione di pazienti nel gruppo PL che progrediscono sulla EDSS è inferiore nel CONFIRM (17%) rispetto al DEFINE (27%)

Summary of MRI Results
Both doses of BG-12 reduced:• New or newly enlarging T2 lesions by 71% (BID) and 73% (TID) at 2 years
• New T1 hypointense lesions by 57% (BID) and 65% (TID)
• Gd+ lesions by 74% (BID) and 65% (TID) at 2 years
• Brain atrophy by 30% (BID) and 21% (TID) at 2 years (NS)
• GA also reduced the number of new or newly enlarging T2, and the number of T1 hypointense and Gd+ lesions

Randomized (n=1430)Dosed (n=1417)
BG-12 TIDn=345; n (%)
BG-12 BIDn=359; n (%)
Placebon=363; n (%)
Discontinued 86 (25)
MS relapse6 (2)
MS progression8(2)
Adverse event27 (8)
Lost to follow-up8 (2)
Consent withdrawn 10 (3)
Inv. decision2 (<1)
Subject noncompliance 3 (<1)
Death1 (<1)
Other21 (6)
Discontinued 106 (30)
MS relapse 6 (2)
MS progression 7 (2)
Adverse event 36 (10)
Lost to follow-up 8 (2)
Consent withdrawn 9 (3)
Inv. decision 2 (<1)
Subject noncompliance 4 (1)
Death 0
Other 34 (9)
Discontinued 129 (36)
MS relapse 18 (5)
MS progression 8 (2)
Adverse event 21 (6)
Lost to follow-up 7 (2)
Consent withdrawn 14 (4)
Inv. decision 3(<1)
Subject noncompliance9(2)
Death 0
Other 49 (13)
Completed treatment264 (75)
Completed treatment253 (70)
Completed treatment234 (64)
Discontinued 96 (28)
MS relapse 3 (<1)
MS progression 5 (1)
Adverse event 38 (11)
Lost to follow-up 4 (1)
Consent withdrawn 15 (4)
Inv. decision 1 (<1)
Subject noncompliance 3 (<1)
Death 0
Other 27 (8)
GAn=350; n (%)
Completed treatment249 (72)
Treatment Discontinuation

Time to Discontinuation and Withdrawal
(ITT)
Note: Missing/partial dates of last dose were imputed. *Numbers at risk 5 days prior to week 96 (earlier window of week 96 visit) are 217, 226, 230, and 247 for placebo, BG-12 240 mg BID, TID, and GA group, respectively. †Numbers at risk 5 days prior to week 96 (earlier window of week 96 visit) are 272, 271, 265, and 285 for placebo, BG-12 240 mg BID, TID, and GA group, respectively.
BL 12 24 36 48 60 72 84 96*Time on Study Drug (weeks)
0
0.1
0.2
0.3
0.4
Pro
ba
bil
ity
of
Dis
co
nti
nu
ati
on
of
Stu
dy
Dru
g
Placebo (n=363)BG-12 BID (n=359)BG-12 TID (n=345)GA (n=350)
Number of Patients at Risk
PlaceboBG-12 BIDBG-12 TID
GA
363359345350
347326305324
327305291313
311294281305
290285275292
266275269285
251267262277
243261254268
113111124130
Drug Discontinuation
BL 12 24 36 48 60 72 84 96†
Time on Study Drug (weeks)
0
0.1
0.2
0.3
Pro
ba
bil
ity
of
Wit
hd
raw
al
fro
m S
tud
y
PlaceboBG-12 BIDBG-12 TID
GA
363359345350
357339320337
343322306328
333313298325
321307296314
308302294312
299295285307
290292282299
204200199231
Placebo (n=363)BG-12 BID (n=359)BG-12 TID (n=345)GA (n=350)
Number of Patients at Risk
Study Withdrawal

Safety Summary
• Overall the incidence of AEs, SAEs, discontinuations due to AEs, was similar across the 4 treatment groups
• The most common events with BG-12 were flushing and GI events.
– Incidence was highest during the first month of the study, decreased during the second month, and was low (<1% for individual events) for the remainder of the study
• There was WBC and lymphocyte counts decrease with BG-12 but values remained within normal limits. There were no serious infections reported in patients with lymphocyte counts <0.50 × 10⁹/L.
• No increased risk of serious infections or malignancies was observed with BG-12

CONFIRM: Common AEs in ≥5% of Subjects in Any Group
Event, n (%)Placebo(n=363)
BG-12240 mg BID
(n=359)
BG-12240 mg TID
(n=344)GA
(n=351)
Patients with any event 333 (92) 338 (94) 316 (92) 304 (87)
MS relapse 155 (43) 110 (31) 85 (25) 119 (34)
Flushing* 13 (4) 110 (31) 83 (24) 6 (2)
Nasopharyngitis 58 (16) 62 (17) 63 (18) 51 (15)
Headache 49 (13) 52 (14) 46 (13) 46 (13)
Diarrhea* 28 (8) 45 (13) 50 (15) 14 (4)
Urinary tract infection 42 (12) 52 (14) 41 (12) 46 (13)
Nausea* 29 (8) 40 (11) 51 (15) 15 (4)
Upper respiratory tract infection* 34 (9) 36 (10) 47 (14) 27 (8)
Back pain 33 (9) 35 (10) 36 (10) 32 (9)
Fatigue 33 (9) 37 (10) 33 (10) 30 (9)
Abdominal pain, upper* 17 (5) 36 (10) 33 (10) 4 (1)
Proteinuria 25 (7) 29 (8) 35 (10) 30 (9)
Abdominal pain 15 (4) 27 (8) 26 (8) 4 (1)
Rash 13 (4) 24 (7) 28 (8) 8 (2)
*Shading indicates any group ≥3 percentage points higher than the placebo group.AE=adverse event; BID=twice daily; TID=three times daily; GA=glatiramer acetate; MS=multiple sclerosis.Phillips JT, et al. Presented at AAN, 2012, New Orleans, LA, USA. S41.005.

CONFIRM: Common AEs in ≥5% of Subjects in Any Group (cont.)
*Shading indicates any group ≥3 percentage points higher than the placebo group.AE=adverse event; BID=twice daily; TID=three times daily; GA=glatiramer acetate; ALT=alanine aminotransferasePhillips JT, et al. Presented at AAN, 2012, New Orleans, LA, USA. S41.005.
Event, n (%)Placebo(n=363)
BG-12240 mg BID
(n=359)
BG-12240 mg TID
(n=344)GA
(n=351)
Vomiting* 13 (4) 25 (7) 23 (7) 8 (2)
Arthralgia 26 (7) 20 (6) 27 (8) 17 (5)
Pain in extremity 29 (8) 21 (6) 26 (8) 21 (6)
Influenza 22 (6) 20 (6) 25 (7) 15 (4)
Pruritus* 11 (3) 20 (6) 24 (7) 7 (2)
Paraesthesia 31 (9) 21 (6) 21 (6) 15 (4)
Depression 35 (10) 24 (7) 15 (4) 30 (9)
ALT increased 25 (7) 16 (4) 22 (6) 20 (6)
Erythema* 5 (1) 16 (4) 21 (6) 6 (2)
Hot flush* 8 (2) 18 (5) 19 (6) 4 (1)
Albumin urine present 15 (4) 22 (6) 14 (4) 18 (5)
Bronchitis 14 (4) 14 (4) 22 (6) 16 (5)
Pyrexia 19 (5) 11 (3) 25 (7) 17 (5)
Sinusitis 11 (3) 18 (5) 18 (5) 11 (3)

CONFIRM: Common AEs in ≥5% of Subjects in Any Group (cont.)
*Shading indicates any group ≥3 percentage points higher than the placebo group.AE=adverse event; BID=twice daily; TID=three times daily; GA=glatiramer acetate.Phillips JT, et al. Presented at AAN, 2012, New Orleans, LA, USA. S41.005.
Event, n (%)Placebo(n=363)
BG-12240 mg BID
(n=359)
BG-12240 mg TID
(n=344)GA
(n=351)
Cough 17 (5) 16 (4) 18 (5) 9 (3)
Muscle spasms 14 (4) 13 (4) 21 (6) 8 (2)
Microalbuminuria 13 (4) 14 (4) 19 (6) 15 (4)
Oropharyngeal pain 14 (4) 12 (3) 21 (6) 15 (4)
Hypoaesthesia 21 (6) 11 (3) 19 (6) 16 (5)
Dyspepsia 8 (2) 12 (3) 16 (5) 6 (2)
Insomnia 18 (5) 15 (4) 10 (3) 13 (4)
Protein urine present 10 (3) 18 (5) 7 (2) 15 (4)
Vertigo 22 (6) 9 (3) 13 (4) 15 (4)
Injection-site erythema* 0 0 0 31 (9)
Injection-site pain* 0 0 0 29 (8)

Serious AEs≥2 Subjects in Any Treatment Group
Placebo(n=363)
BG-12 BID(n=359)
BG-12 TID(n=344)
GA(n=351)
Number (%) with SAE 79 (22) 61 (17) 54 (16) 60 (17)
MS relapse 51 (14) 39 (11) 30 (9) 36 (10)
Gastroenteritis 0 2 (<1) 2 (<1) 0
Cellulitis 0 2 (<1) 1 (<1) 0
Urinary tract infection 0 1 (<1) 1 (<1) 0
Pneumonia 1 (<1) 0 0 2 (<1)
Abdominal pain 0 (0) 2 (<1) 0 0
Vomiting 1 (<1) 1 (<1) 1 (<1) 0
Back pain 0 2 (<1) 0 (0) 0
Muscle strain 0 0 (0) 2 (<1) 0
Anaphylactic reaction 0 0 0 2 (<1)
Depression 0 0 1 (<1) 2 (<1)
Convulsion 2 (<1) 0 0 0
Abortion spontaneous 2 (<1) 0 0 0
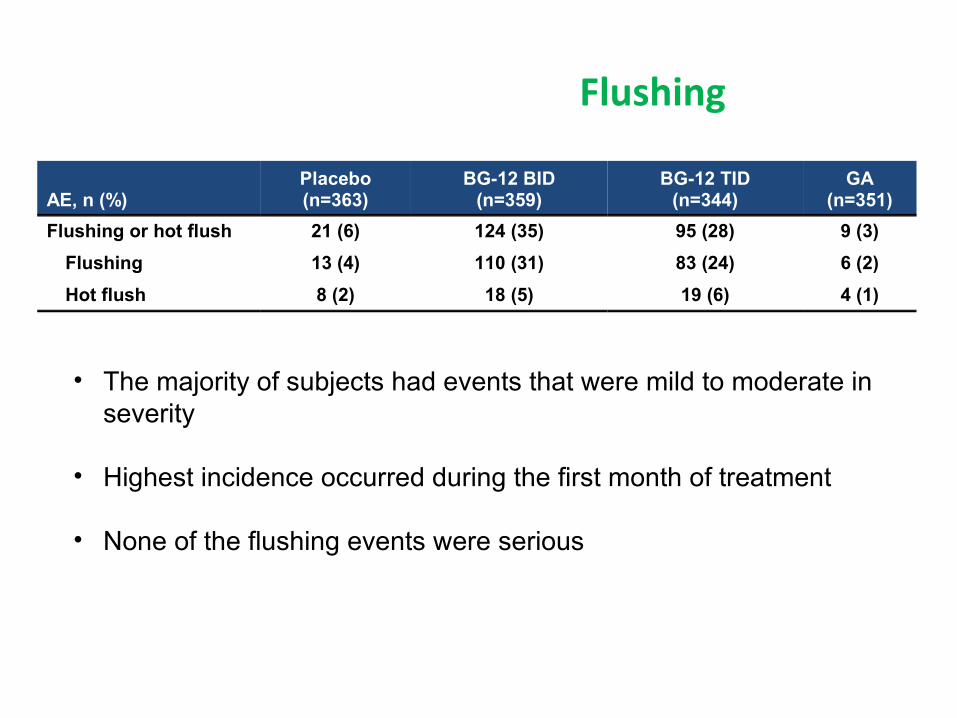
Flushing
AE, n (%)Placebo(n=363)
BG-12 BID(n=359)
BG-12 TID(n=344)
GA(n=351)
Flushing or hot flush 21 (6) 124 (35) 95 (28) 9 (3)
Flushing 13 (4) 110 (31) 83 (24) 6 (2)
Hot flush 8 (2) 18 (5) 19 (6) 4 (1)
• The majority of subjects had events that were mild to moderate in severity
• Highest incidence occurred during the first month of treatment
• None of the flushing events were serious

Incidence of Flushing and Hot Flush
by Month
Month

Gastrointestinal Events by Study Month
Month
Gastrointestinal tolerability events were defined using specific Standardized MedDRA Queries

CONFIRM: WBC Counts
LLN is lower limit of normal in standard units. If there are multiple values of LLN for a given parameter, highest LLN is shown.WBC=white blood cell; SE=standard error; BID=twice daily; TID=three times daily; GA=glatiramer acetate; BL=baseline.Phillips JT, et al. Presented at AAN, 2012, New Orleans, LA, USA. S41.005.
BL 4 8 12 24 36 48 60 72 84 96
Visit (weeks)
0
4
5
6
7
8
Me
an
(±S
E)
Wh
ite
Blo
od
Ce
lls
(×
10
9/L
)
LLN
PlaceboBG-12 240 mg BIDBG-12 240 mg TID
GA

CONFIRM: Lymphocytes
BL 4 8 12 24 36 48 60 72 84 96
Visit (weeks)
0
0.5
1.0
1.5
2.0
2.5
Me
an
(±S
E)
Lym
ph
oc
yte
s (
×1
09 /
L)
LLN
PlaceboBG-12 240 mg BIDBG-12 240 mg TID
GA
LLN is lower limit of normal in standard units. If there are multiple values of LLN for a given parameter, highest LLN is shown.SE=standard error; BID=twice daily; TID=three times daily; GA=glatiramer acetate; BL=baseline.Phillips JT, et al. Presented at AAN, 2012, New Orleans, LA, USA. S41.005.

CONFIRM: Infections
• The overall incidence of infection was similar in the placebo and GA treatment groups and slightly higher in both BG-12 groups– 50% in the placebo and GA groups– 56% in the BG-12 BID and BG-12 TID groups
• The slight differences between the BG-12 and placebo groups were due to differences in the incidences of nasopharyngitis, upper respiratory tract infection, sinusitis, and gastroenteritis.
• The incidence of serious infections was 1.4% in the placebo, 1.1% in the GA, and 1.9% and 2.0%, respectively, in the BG-12 BID and TID groups
• No cases of opportunistic infection in any group were reported
238

CONFIRM: Infections Reported as SAEs
239
Event, n (%)Placebo(n=363)
BG-12240 mg BID
(n=359)
BG-12240 mg TID
(n=344)GA
(n=351)
Patients with any event 5 (1) 7 (2) 7 (2) 4 (1)
Gastroenteritis 0 2 (<1) 2 (<1) 0
Cellulitis 0 2 (<1) 1 (<1) 0
Urinary tract infection 0 1 (<1) 1 (<1) 0
Douglas abscess 0 0 1 (<1) 0
Gastroenteritis, viral 0 0 1 (<1) 0
H1N1 influenza 0 1 (<1) 0 0
Pelvic inflammatory disease 0 0 1 (<1) 0
Pyelonephritis, acute 0 0 1 (<1) 0
Viral infection 0 1 (<1) 0 1 (<1)
Appendicitis 0 0 0 1 (<1)
Pneumonia 1 (<1) 0 0 2 (<1)
Pyothorax 0 0 0 1 (<1)
Borrelia infection, bacterial endocarditis, influenza, sepsis, and tracheitis were each reported by 1 patient, all of whom were in the placebo group.SAE=serious adverse event; BID=twice daily; TID=three times daily; GA=glatiramer acetate.

CONFIRM: Summary of AEs for BG-12
• Overall the incidence of AEs, serious AEs and discontinuations due to AEs was similar across the four treatment groups
• The most common events with BG-12 were flushing and GI events– Incidence was highest during the first month of the study, decreased during the second month,
and was low (<2% for individual events) for the remainder of the study
• No increased risk of serious infections or malignancies was observed with BG-12
• There was a decrease in mean WBC and lymphocyte counts with BG-12, but values remained within normal limits. There were no serious infections reported in patients with lymphocyte counts <0.5×10⁹/L
• No increased risk of hepatic or renal injury was observed with BG-12 versus placebo
AE=adverse event; BID=twice daily; TID=three times daily; SAE=serious adverse event.Phillips JT, et al. Presented at AAN, 2012, New Orleans, LA, USA. S41.005.
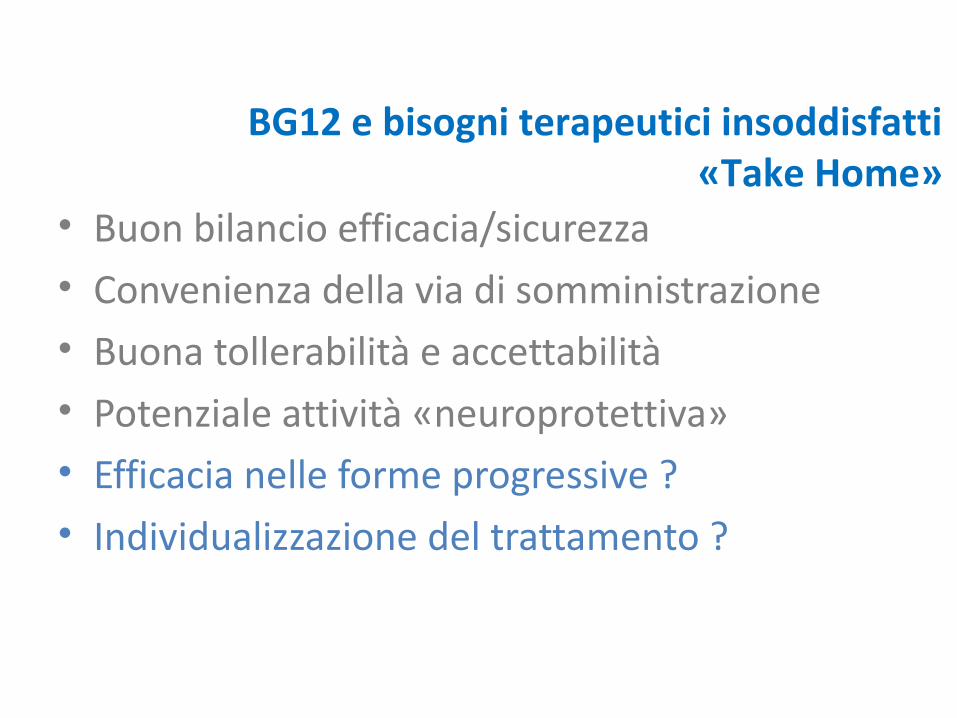
• Buon bilancio efficacia/sicurezza• Convenienza della via di somministrazione• Buona tollerabilità e accettabilità• Potenziale attività «neuroprotettiva» • Efficacia nelle forme progressive ?• Individualizzazione del trattamento ?
BG12 e bisogni terapeutici insoddisfatti«Take Home»


Grazie!

«…There remains a considerable unmet needfor safe treatment options that are more effective than current first-line agents and are appropriate for a large spectrum of patients with MS. Further exploration of the mechanism of action of BG-12 may help to guide future clinical studies.»
Gold, NEJM 2012

SAFETYSAFETYEFFICACYEFFICACY
Risk/benefitRisk/benefitRisk/benefitRisk/benefit

CONSENSUS GROUPS IN US AND EUROPE
1st line therapy
More aggressive approach
2nd line therapy
3rd line therapy
4th line therapy
Mitoxantrone / CyclophosphamideNatalizumab/ Daclizumab
Fingolimod/Campath/Teriflunomide
Combination therapy
BMT
Beta-Interferons / Glatiramer acetateLaquinimod/BG12

Induction therapy
1st line therapy
2nd line therapy
3rd line therapy
4th line therapy
IFN / GA/ BG12 Laquinimod/ Teriflunomide
Combination therapy
BMT
Mitoxantrone/Cyclophosphamide Natalizumab/Fingolimod/
Campath/Rituximab/Daclizumab

Thank you for you attention!Thank you for you attention!

AEs, n (%)a Placebo (n=360)
Teriflunomide 7 mg
(n=368)
Teriflunomide 14 mg
(n=358)
Any class 315 (87.5) 328 (89.1) 325 (90.8)
Nasopharyngitis 98 (27.2) 94 (25.5) 93 (26.0)
Headache 64 (17.8) 81 (22.0) 67 (18.7)
Diarrhea Discontinuations
32 (8.9)0
54 (14.7)1 (0.3)
64 (17.9)1 (0.3)
Fatigue 51 (14.2) 47 (12.8) 52 (14.5)
ALT increased 24 (6.7) 44 (12.0) 51 (14.2)
Nausea Discontinuations
26 (7.2)0
33 (9.0)1 (0.3)
49 (13.7)0
Hair-thinningb 12 (3.3) 38 (10.3) 47 (13.1)
Influenza 36 (10.0) 34 (9.2) 43 (12.0)
Back pain 47 (13.1) 39 (10.6) 41 (11.5)
Urinary tract infection 35 (9.7) 27 (7.3) 37 (10.3)
Pain in extremity 47 (13.1) 26 (7.1) 33 (9.2)
a Adverse events by MedDRA (Medical Dictionary for Regulatory Activities) preferred term ≥10% in any group, ranked by decreasing order in the teriflunomide 14-mg group; bMedDRA preferred term: alopecia. O’Connor PW et al. N Engl J Med 2011;365:1293-303.
Teriflunomide Phase 3 (TEMSO): AEs ≥10%
in Any Group — MedDRA Preferred Term
249
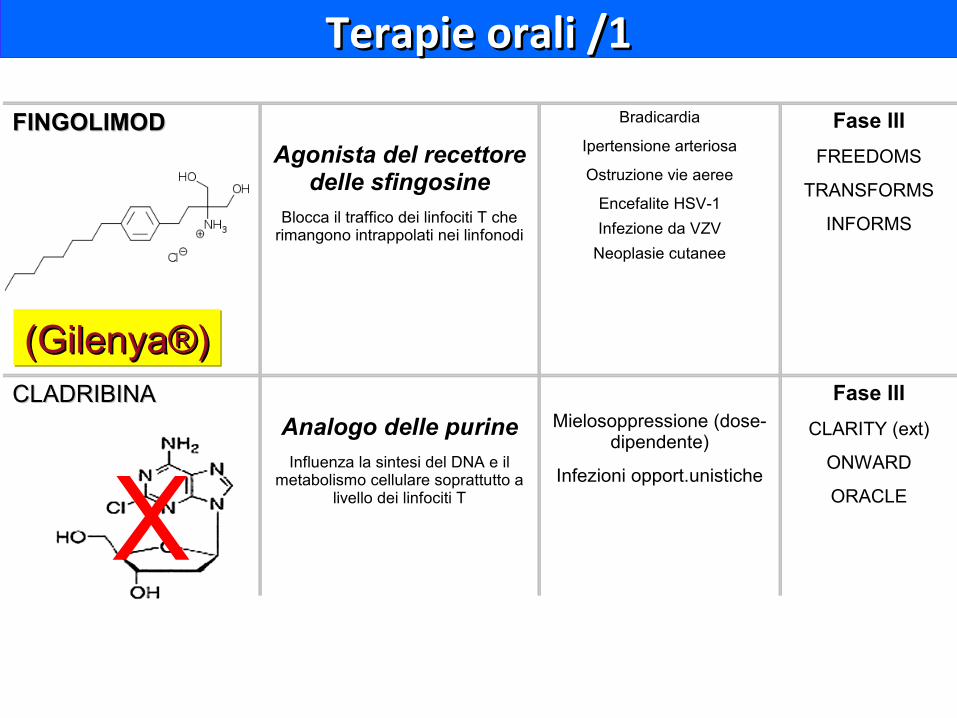
Terapie orali /1Terapie orali /1Terapie orali /1Terapie orali /1
FINGOLIMODFINGOLIMODAgonista del recettore
delle sfingosineBlocca il traffico dei linfociti T che
rimangono intrappolati nei linfonodi
Bradicardia
Ipertensione arteriosa
Ostruzione vie aeree
Encefalite HSV-1
Infezione da VZV
Neoplasie cutanee
Fase III
FREEDOMS
TRANSFORMS
INFORMS
CLADRIBINACLADRIBINAAnalogo delle purineInfluenza la sintesi del DNA e il
metabolismo cellulare soprattutto a livello dei linfociti T
Mielosoppressione (dose-dipendente)
Infezioni opport.unistiche
Fase III
CLARITY (ext)
ONWARD
ORACLEX
(Gilenya®)(Gilenya®)(Gilenya®)(Gilenya®)

Terapie orali /2Terapie orali /2Terapie orali /2Terapie orali /2
TERIFLUNOMIDETERIFLUNOMIDE Inibitore della sintesi delle pirimidine
Metabolita attivo della Leflunomide
Effetto antiproliferativo
Nasofaringiti, artralgie
AlopeciaNausea, diarrea, ↑ ALT
Fase III
TEMSO
Add-on
IFN beta, GA
FUMARATOFUMARATO
(BG12)
Composto intermedio del ciclo di Krebs
Induce shift TH-1•TH-2
Effetto neuroprotettivo
Rash cutanei, prurito
Disturbi gastroenterici
Dolori muscolari
Cefalea
Fase III
CONFIRM
DEFINE
LAQUINOMIDELAQUINOMIDE Derivato della Linomide
Prob. induce shift TH-1•TH-2
Potenz. epatotossico
Dispepsia
Edemi declivi
Fase III
BRAVO
ALLEGRO

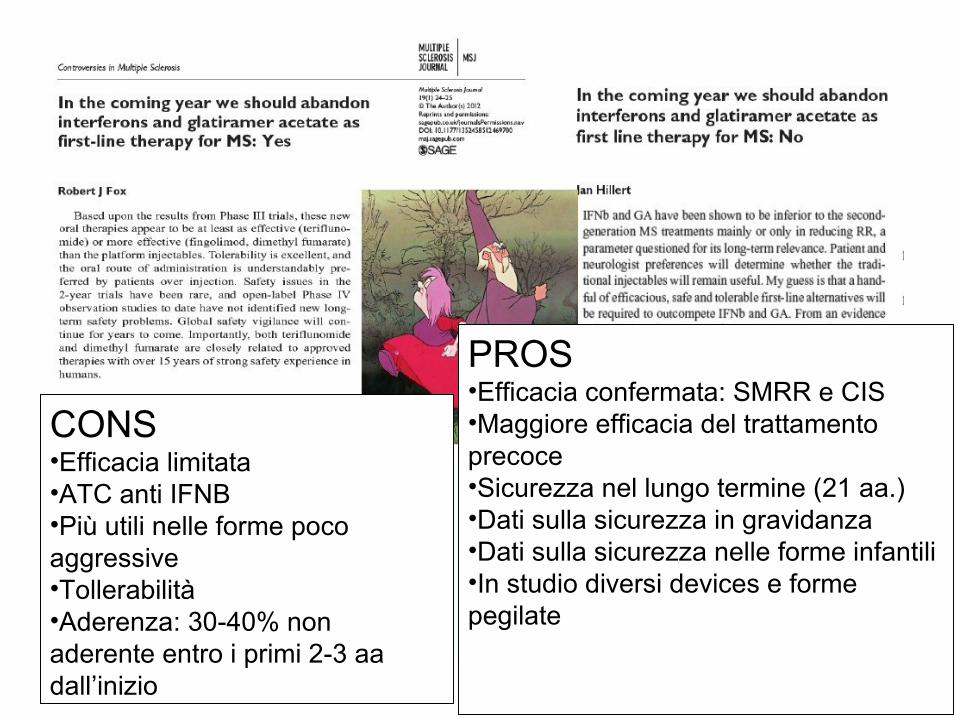
CONS•Efficacia limitata•ATC anti IFNB •Più utili nelle forme poco aggressive•Tollerabilità•Aderenza: 30-40% non aderente entro i primi 2-3 aa dall’inizio
PROS•Efficacia confermata: SMRR e CIS•Maggiore efficacia del trattamento precoce•Sicurezza nel lungo termine (21 aa.)•Dati sulla sicurezza in gravidanza•Dati sulla sicurezza nelle forme infantili•In studio diversi devices e forme pegilate
Scelta terapeutica
• Selezione accurata del paziente
• Scelta individualizzata
• Bilancio rischio/beneficio
• Scelta condivisa

Grazie!Grazie!


