Pharmakokinetische Grundlagen und Pharmakodynamik beim Schwerkranken
Fritz SörgelInstitut für Biomedizinische und
Pharmazeutische ForschungNürnberg-Heroldsberg
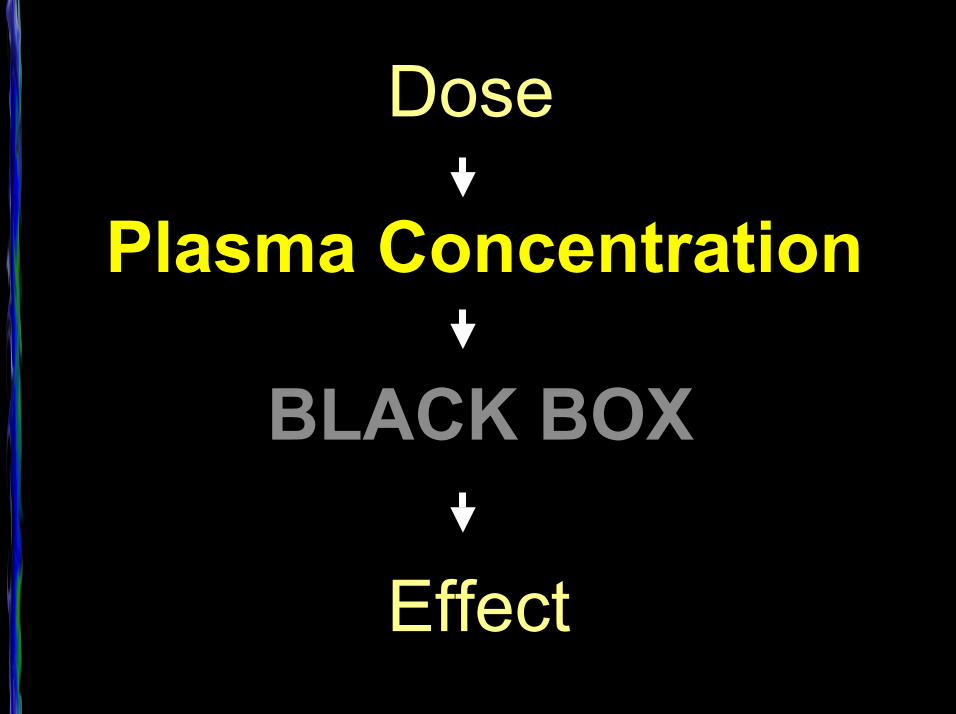
Dose
Effect
Plasma Concentration
BLACK BOX

U
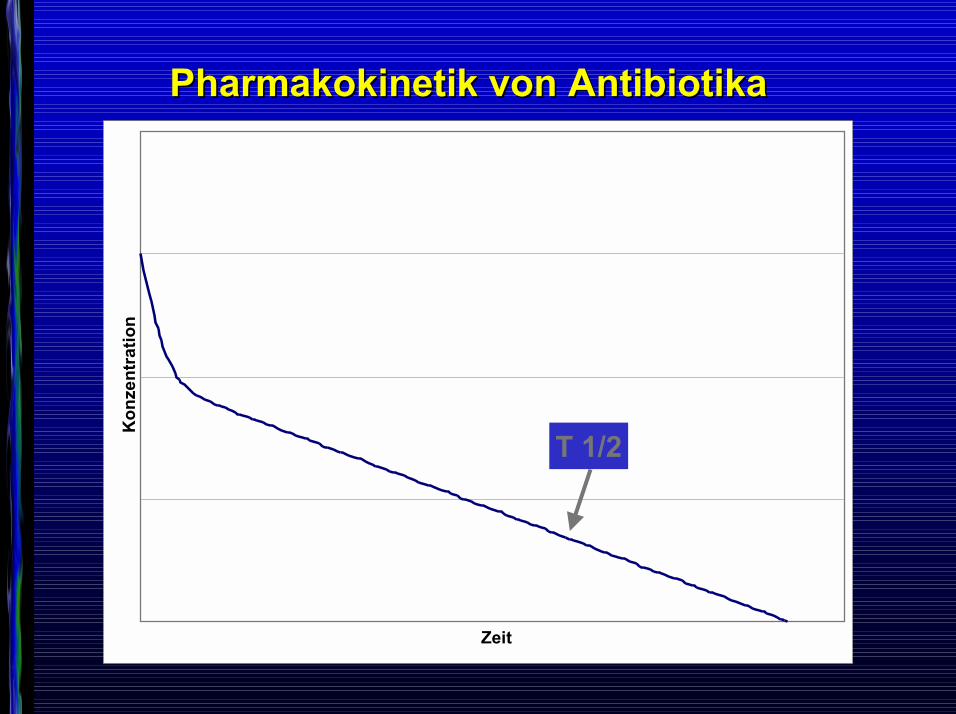
Pharmakokinetik Pharmakokinetik von Antibiotikavon Antibiotika
Zeit
Kon
zent
ratio
n
T 1/2

Pharmakokinetik Pharmakokinetik von Antibiotikavon Antibiotika
Zeit
Kon
zent
ratio
n
T 1/2
AUC

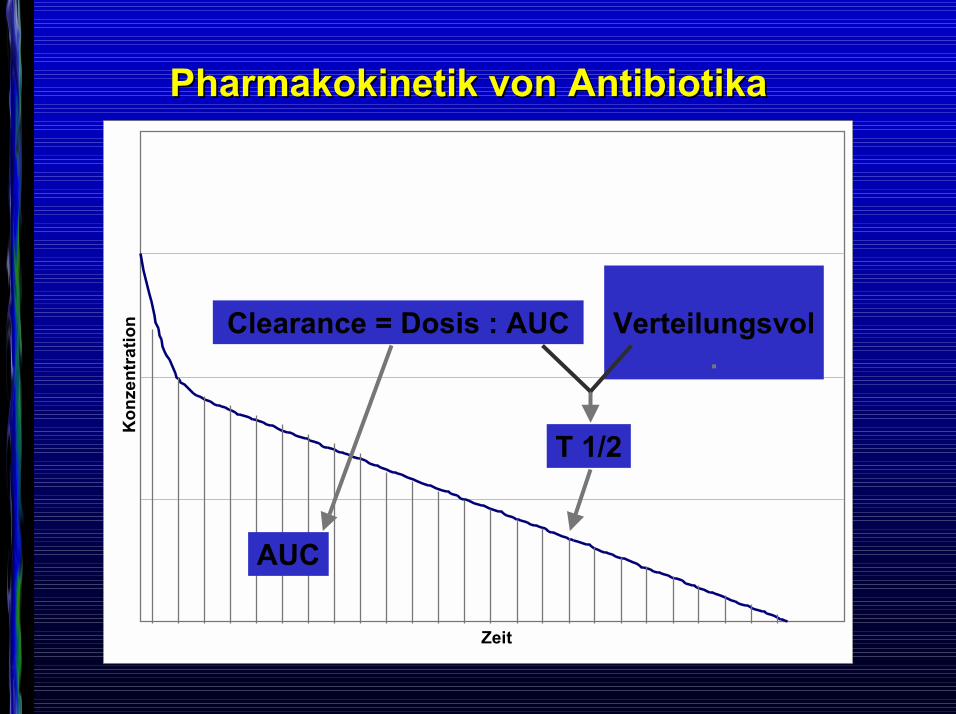
Pharmakokinetik Pharmakokinetik von Antibiotikavon Antibiotika
Zeit
Kon
zent
ratio
n
T 1/2
AUC
Clearance = Dosis : AUC
Pharmakokinetik Pharmakokinetik von Antibiotikavon Antibiotika
Zeit
Kon
zent
ratio
n
T 1/2
AUC
Clearance = Dosis : AUC Verteilungsvol.
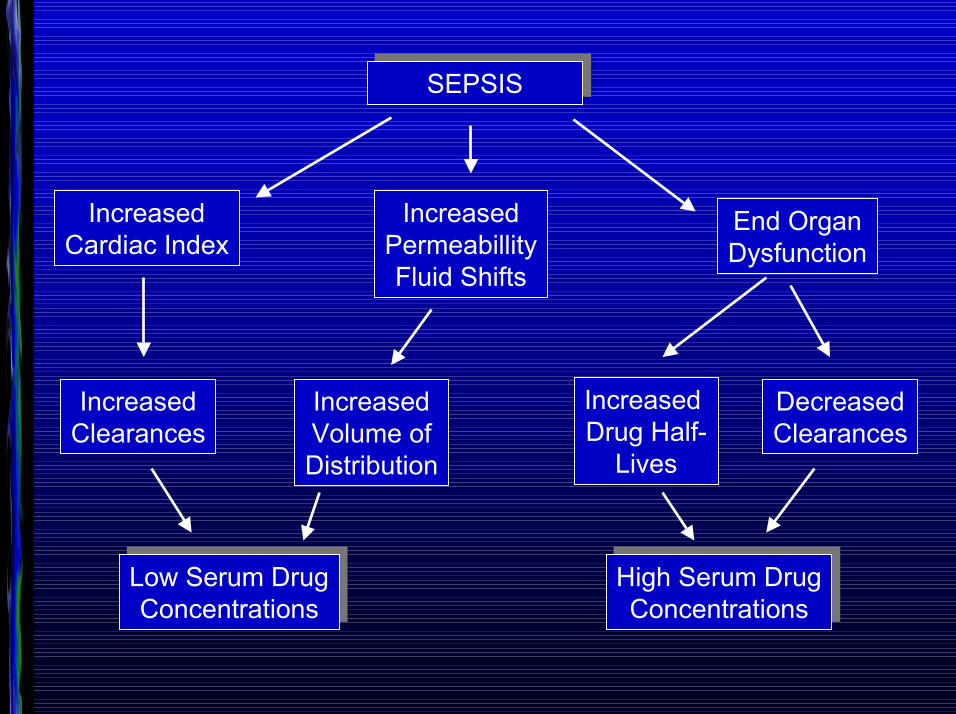
SEPSISSEPSIS
IncreasedCardiac Index
IncreasedClearances
Low Serum DrugConcentrations
Low Serum DrugConcentrations
IncreasedPermeabillityFluid Shifts
IncreasedVolume ofDistribution
End OrganDysfunction
Increased Drug Half-
Lives
DecreasedClearances
High Serum DrugConcentrations
High Serum DrugConcentrations
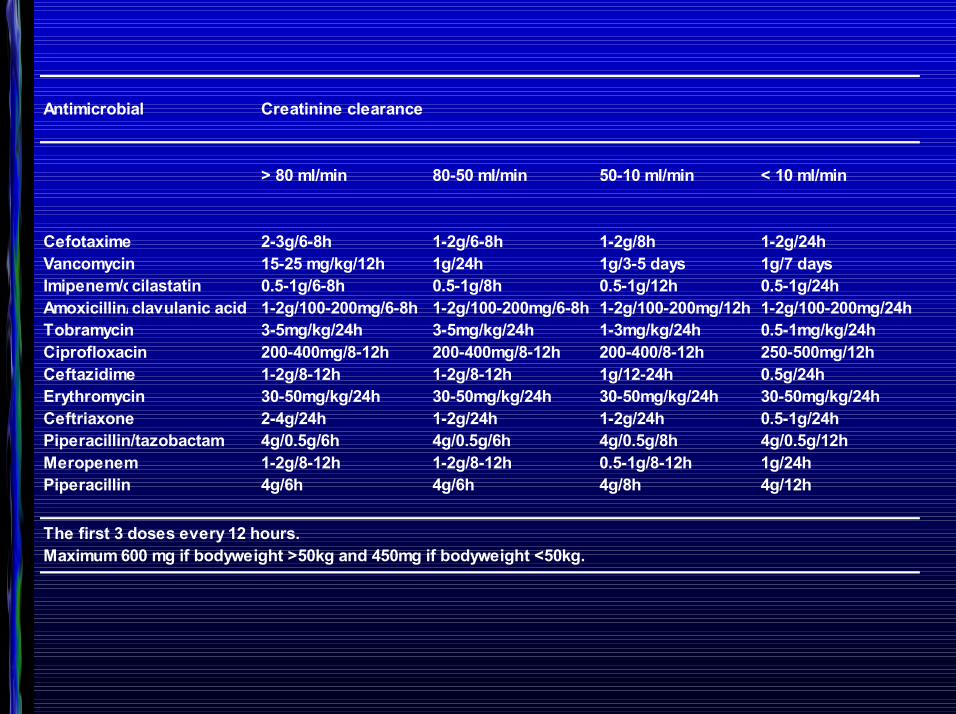
Antimicrobial Creatinine clearance
> 80 ml/min 80-50 ml/min 50-10 ml/min < 10 ml/min
Cefotaxime 2-3g/6-8h 1-2g/6-8h 1-2g/8h 1-2g/24hVancomycin 15-25 mg/kg/12h 1g/24h 1g/3-5 days 1g/7 daysImipenem/ccilastatin 0.5-1g/6-8h 0.5-1g/8h 0.5-1g/12h 0.5-1g/24hAmoxicillin/clavulanic acid 1-2g/100-200mg/6-8h 1-2g/100-200mg/6-8h 1-2g/100-200mg/12h 1-2g/100-200mg/24hTobramycin 3-5mg/kg/24h 3-5mg/kg/24h 1-3mg/kg/24h 0.5-1mg/kg/24hCiprofloxacin 200-400mg/8-12h 200-400mg/8-12h 200-400/8-12h 250-500mg/12hCeftazidime 1-2g/8-12h 1-2g/8-12h 1g/12-24h 0.5g/24hErythromycin 30-50mg/kg/24h 30-50mg/kg/24h 30-50mg/kg/24h 30-50mg/kg/24hCeftriaxone 2-4g/24h 1-2g/24h 1-2g/24h 0.5-1g/24hPiperacillin/tazobactam 4g/0.5g/6h 4g/0.5g/6h 4g/0.5g/8h 4g/0.5g/12hMeropenem 1-2g/8-12h 1-2g/8-12h 0.5-1g/8-12h 1g/24hPiperacillin 4g/6h 4g/6h 4g/8h 4g/12h
The first 3 doses every 12 hours.Maximum 600 mg if bodyweight >50kg and 450mg if bodyweight <50kg.
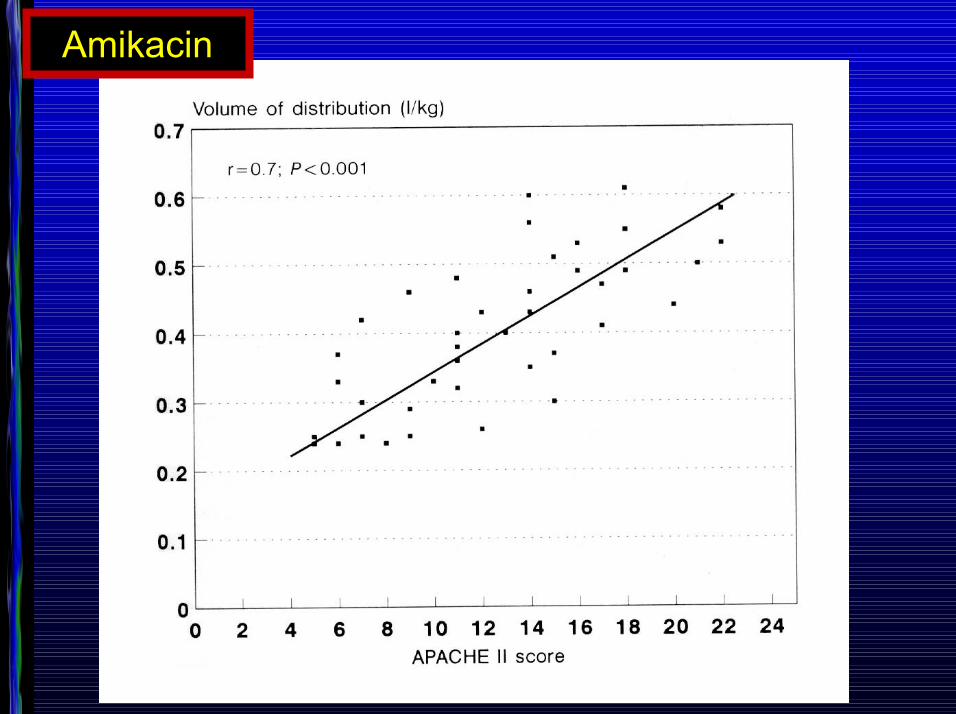
Amikacin
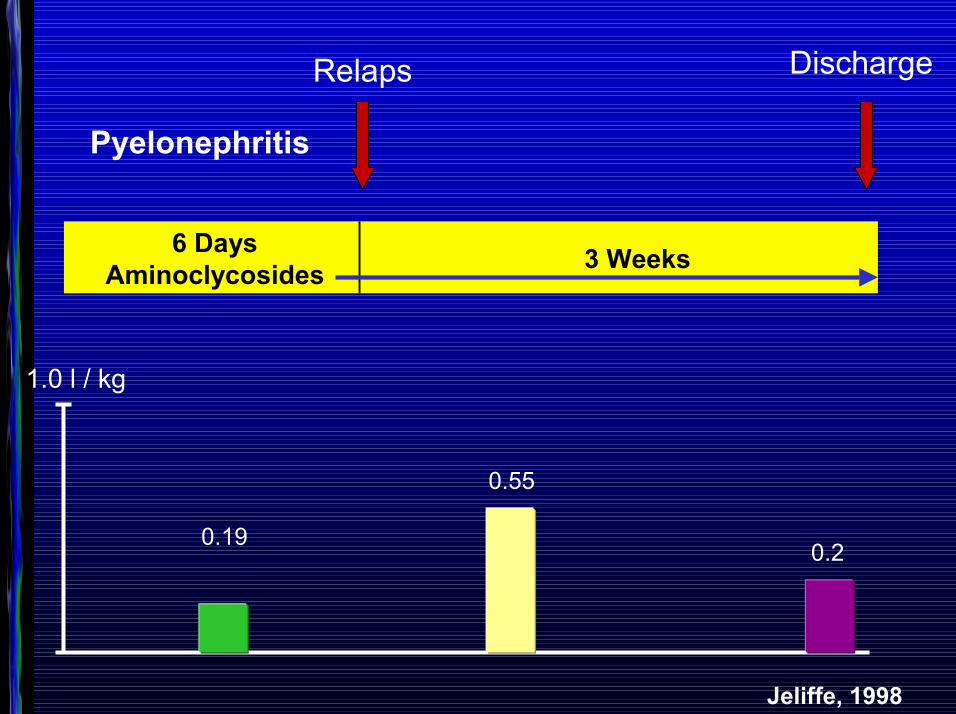
Pyelonephritis
6 DaysAminoclycosides 3 Weeks
Relaps Discharge
1.0 l / kg
0.19
0.55
0.2
Jeliffe, 1998
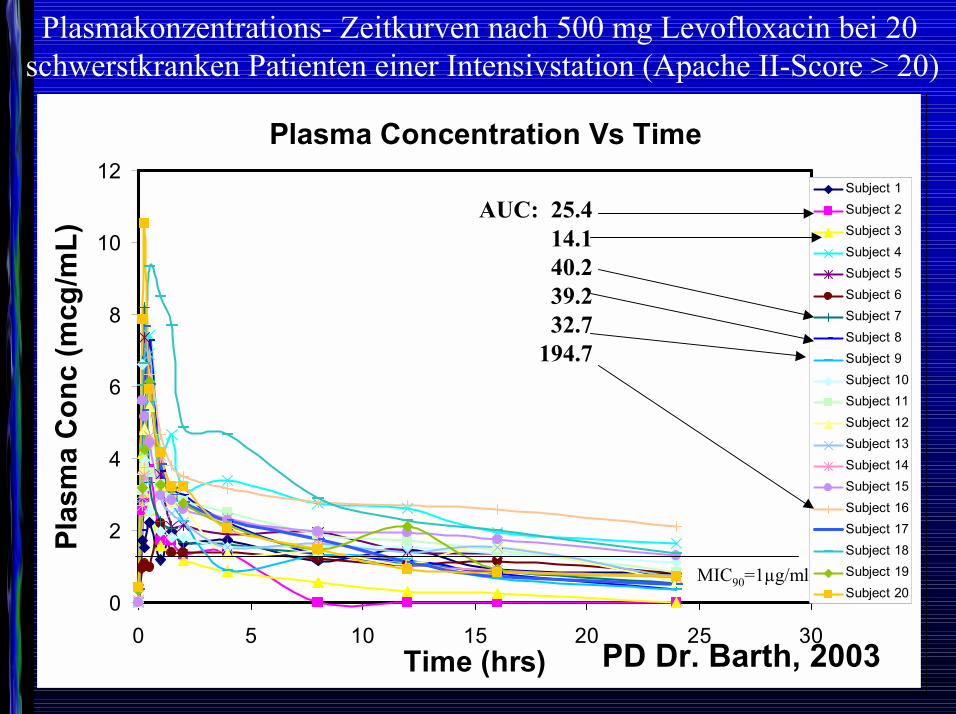
Plasma Concentration Vs Time
0
2
4
6
8
10
12
0 5 10 15 20 25 30Time (hrs)
Plas
ma
Con
c (m
cg/m
L)
Subject 1Subject 2Subject 3Subject 4Subject 5Subject 6Subject 7Subject 8Subject 9Subject 10Subject 11Subject 12Subject 13Subject 14Subject 15Subject 16Subject 17Subject 18Subject 19Subject 20
Plasmakonzentrations- Zeitkurven nach 500 mg Levofloxacin bei 20 schwerstkranken Patienten einer Intensivstation (Apache II-Score > 20)
AUC: 25.414.140.239.232.7
194.7
MIC90=1µg/ml
PD Dr. Barth, 2003
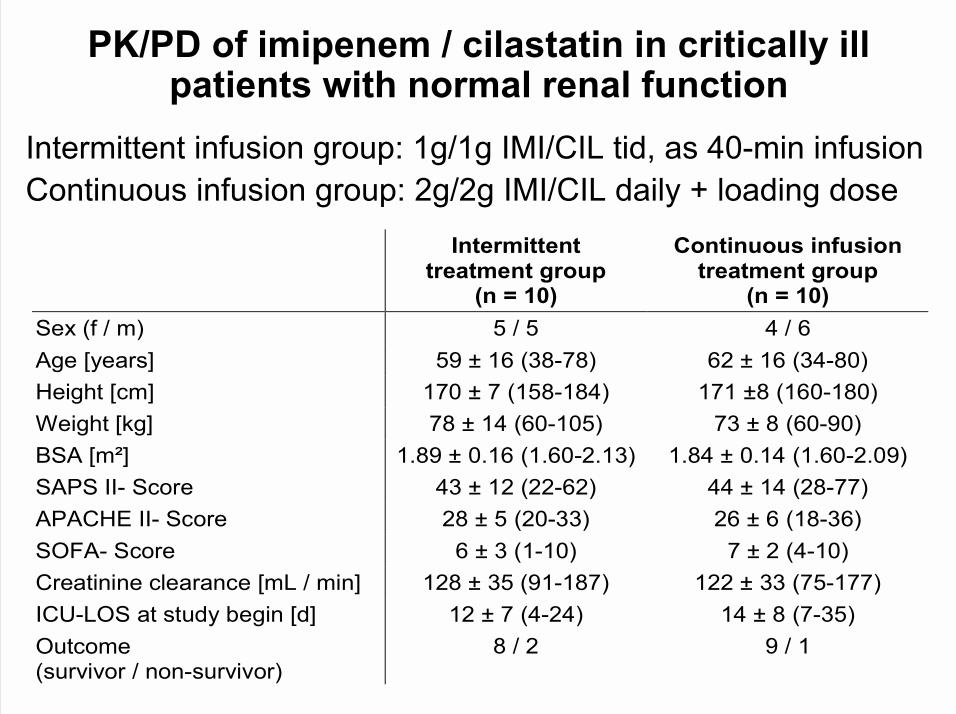
Intermittent treatment group
(n = 10)
Continuous infusion treatment group
(n = 10) Sex (f / m) 5 / 5 4 / 6 Age [years] 59 ± 16 (38-78) 62 ± 16 (34-80) Height [cm] 170 ± 7 (158-184) 171 ±8 (160-180) Weight [kg] 78 ± 14 (60-105) 73 ± 8 (60-90) BSA [m²] 1.89 ± 0.16 (1.60-2.13) 1.84 ± 0.14 (1.60-2.09) SAPS II- Score 43 ± 12 (22-62) 44 ± 14 (28-77) APACHE II- Score 28 ± 5 (20-33) 26 ± 6 (18-36) SOFA- Score 6 ± 3 (1-10) 7 ± 2 (4-10) Creatinine clearance [mL / min] 128 ± 35 (91-187) 122 ± 33 (75-177) ICU-LOS at study begin [d] 12 ± 7 (4-24) 14 ± 8 (7-35) Outcome (survivor / non-survivor)
8 / 2 9 / 1
PK/PD of imipenem / cilastatin in critically ill patients with normal renal function
Intermittent infusion group: 1g/1g IMI/CIL tid, as 40-min infusionContinuous infusion group: 2g/2g IMI/CIL daily + loading dose
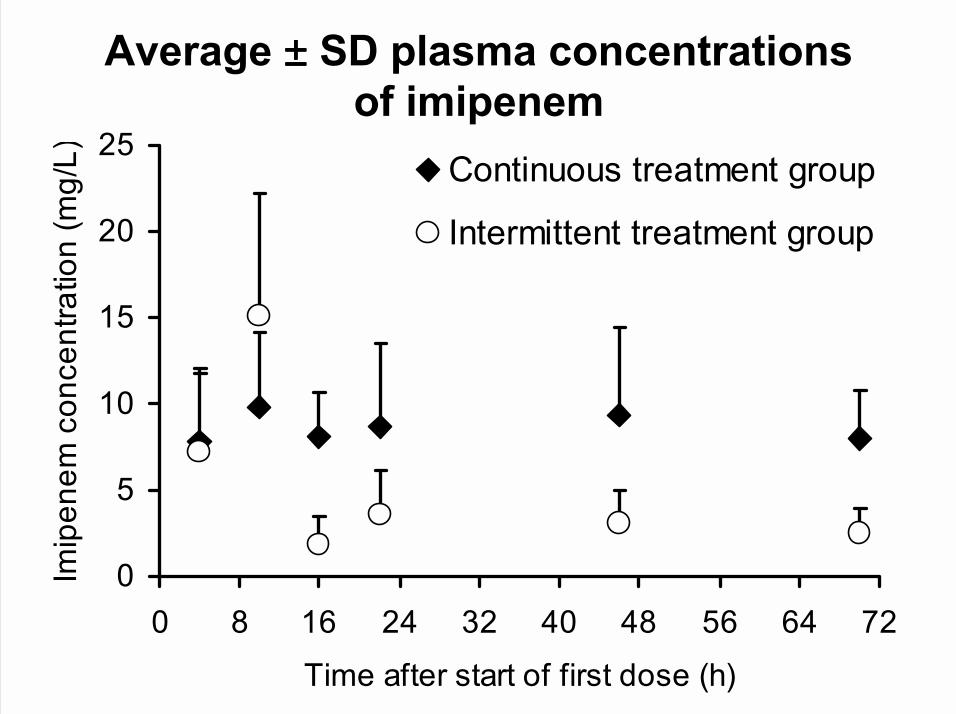
Average ±±±± SD plasma concentrations of imipenem
0
5
10
15
20
25
0 8 16 24 32 40 48 56 64 72
Time after start of first dose (h)
Imip
enem
con
cent
ratio
n (m
g/L) Continuous treatment group
Intermittent treatment group
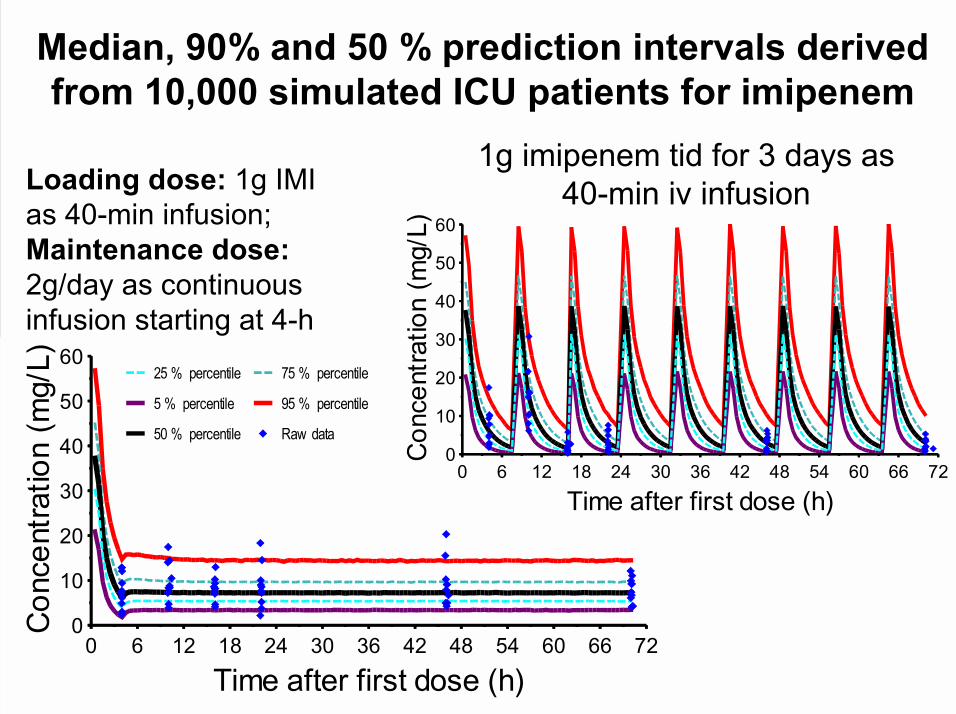
Median, 90% and 50 % prediction intervals derived from 10,000 simulated ICU patients for imipenem
0
10
20
30
40
50
60
0 6 12 18 24 30 36 42 48 54 60 66 72
Time after first dose (h)
25 % percentile
5 % percentile
50 % percentile
75 % percentile
95 % percentile
Raw data0
10
20
30
40
50
60
0 6 12 18 24 30 36 42 48 54 60 66 72
Time after first dose (h)
1g imipenem tid for 3 days as 40-min iv infusionLoading dose: 1g IMI
as 40-min infusion;Maintenance dose: 2g/day as continuous infusion starting at 4-h
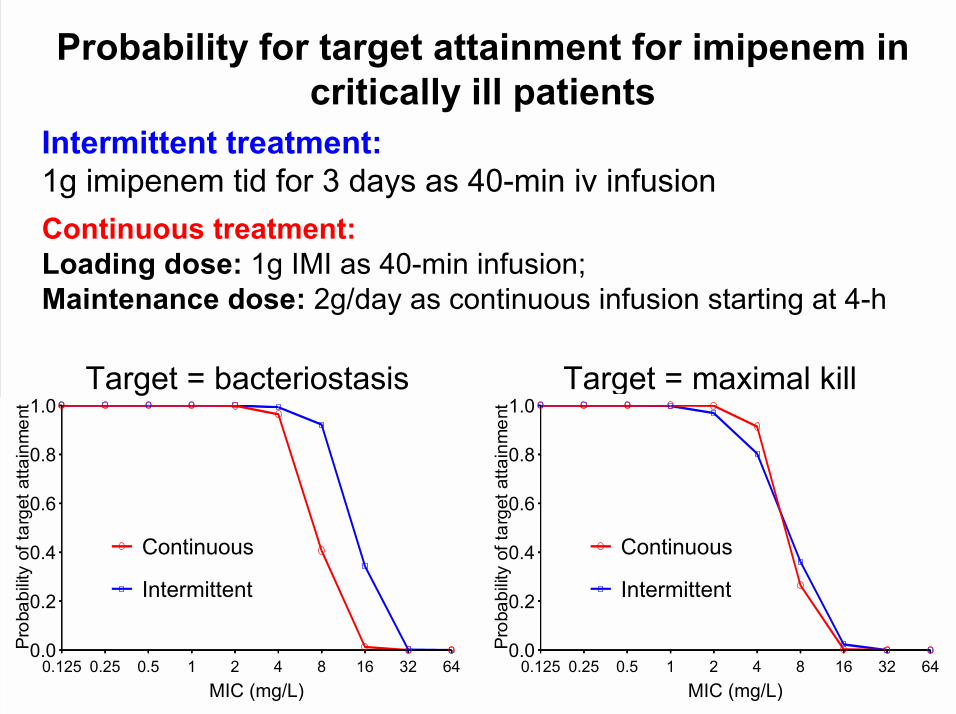
Probability for target attainment for imipenem in critically ill patients
Target = bacteriostasis Target = maximal kill
Intermittent treatment:1g imipenem tid for 3 days as 40-min iv infusionContinuous treatment:Loading dose: 1g IMI as 40-min infusion;Maintenance dose: 2g/day as continuous infusion starting at 4-h
0.0
0.2
0.4
0.6
0.8
1.0
0.125 0.25 0.5 1 2 4 8 16 32 64MIC (mg/L)
Continuous
Intermittent
0.0
0.2
0.4
0.6
0.8
1.0
0.125 0.25 0.5 1 2 4 8 16 32 64MIC (mg/L)
Continuous
Intermittent
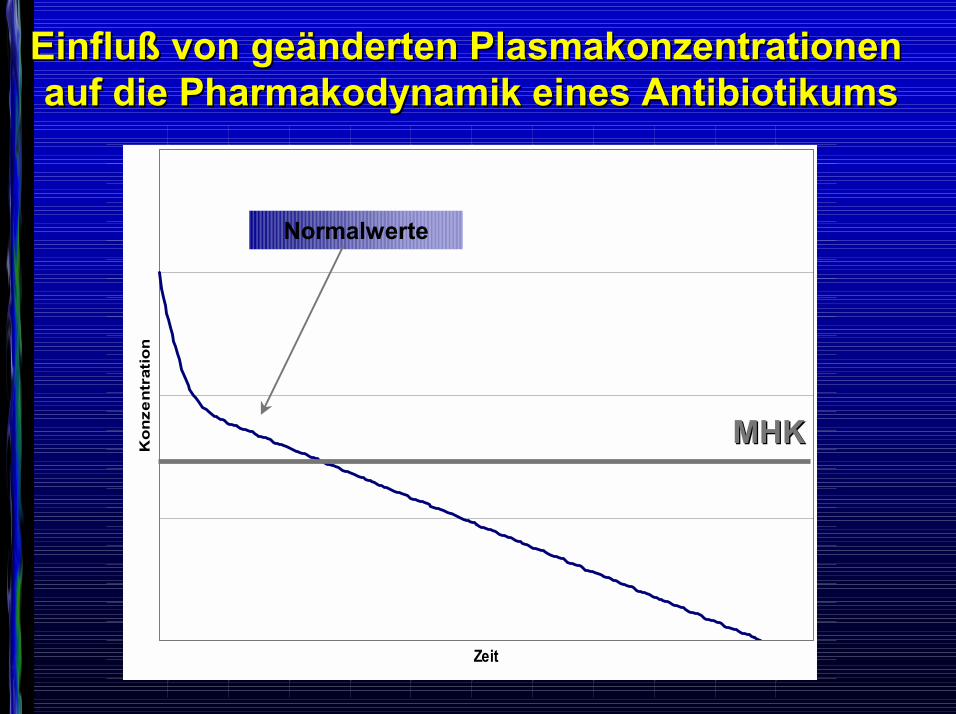
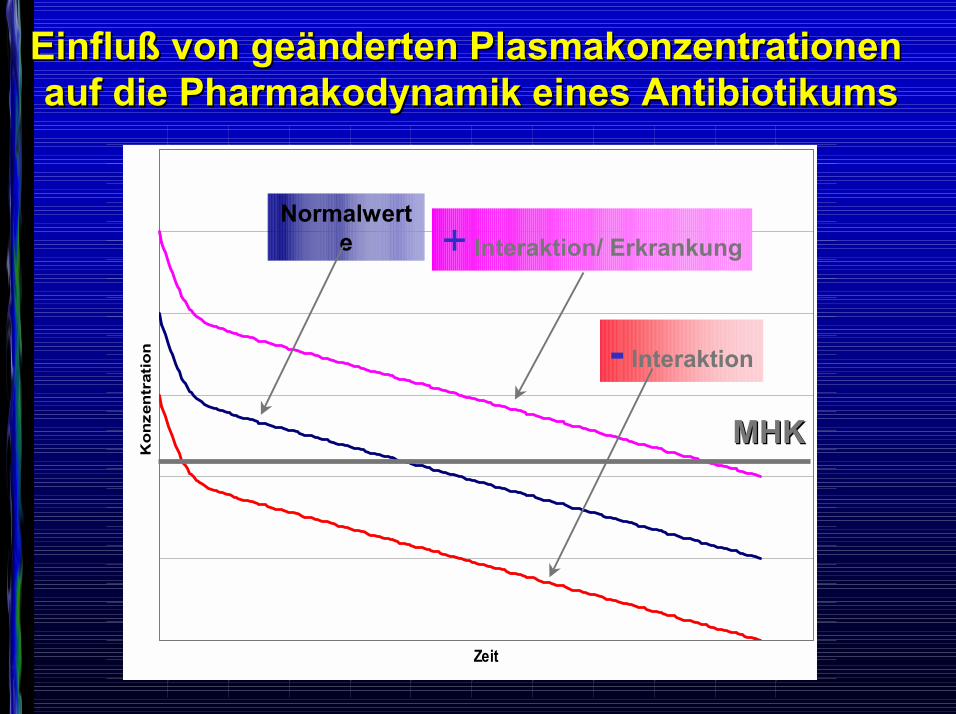
Einfluß von geändertenEinfluß von geänderten PlasmakonzentrationenPlasmakonzentrationenaufauf die Pharmakodynamik die Pharmakodynamik eines Antibiotikumseines Antibiotikums
1*Conc
10,731750,54205,407718,312421,244646,1962820,16161,136602,118419,105058,095109,087578,081763,077171,0734520,07036,067722,065415,063353,061474,059734,058103,056558,055084,053669
Zeit
Ko
nze
ntr
atio
n
MHKMHK
Normalwerte
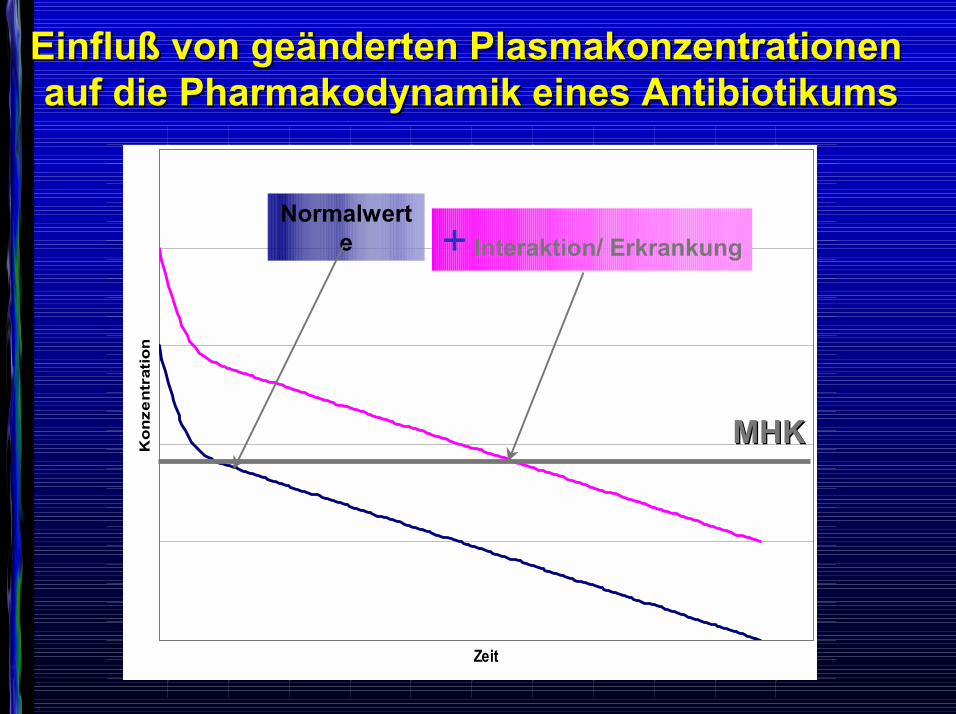
Einfluß von geändertenEinfluß von geänderten PlasmakonzentrationenPlasmakonzentrationenaufauf die Pharmakodynamik die Pharmakodynamik eines Antibiotikumseines Antibiotikums
1*Conc
10,731750,54205,407718,312421,244646,1962820,16161,136602,118419,105058,095109,087578,081763,077171,0734520,07036,067722,065415,063353,061474,059734,058103,056558,055084,053669
Zeit
Ko
nze
ntr
atio
n
MHKMHK
Normalwerte + Interaktion/ Erkrankung
Einfluß von geändertenEinfluß von geänderten PlasmakonzentrationenPlasmakonzentrationenaufauf die Pharmakodynamik die Pharmakodynamik eines Antibiotikumseines Antibiotikums
1*Conc
10.731750.54205.407718.312421.244646.1962820.16161.136602.118419.105058.095109.087578.081763.077171.0734520.07036.067722.065415.063353.061474.059734.058103.056558.055084.053669
Zeit
Ko
nze
ntr
atio
n
MHKMHK
Normalwerte + Interaktion/ Erkrankung
- Interaktion

Individualisierung der AntibiotikatherapieIndividualisierung der AntibiotikatherapieIndividualisierung der AntibiotikatherapieIndividualisierung der AntibiotikatherapieOderOderOderOder
ONE SIZE FITS ALL ?ONE SIZE FITS ALL ?ONE SIZE FITS ALL ?ONE SIZE FITS ALL ?

The Therapeutic OrphanThe Therapeutic Orphan
NEWBORN RENAL FUNCTION
Very low Glomerular Filtration Rate (GFR)Delicate balance between vasoconstrictor and
vasodilatory renal forcesLow mean arterial pressure and high intrarenal
vascular resistanceLimited postnatal renal functional adaptation to
endogenous or exogenous stress
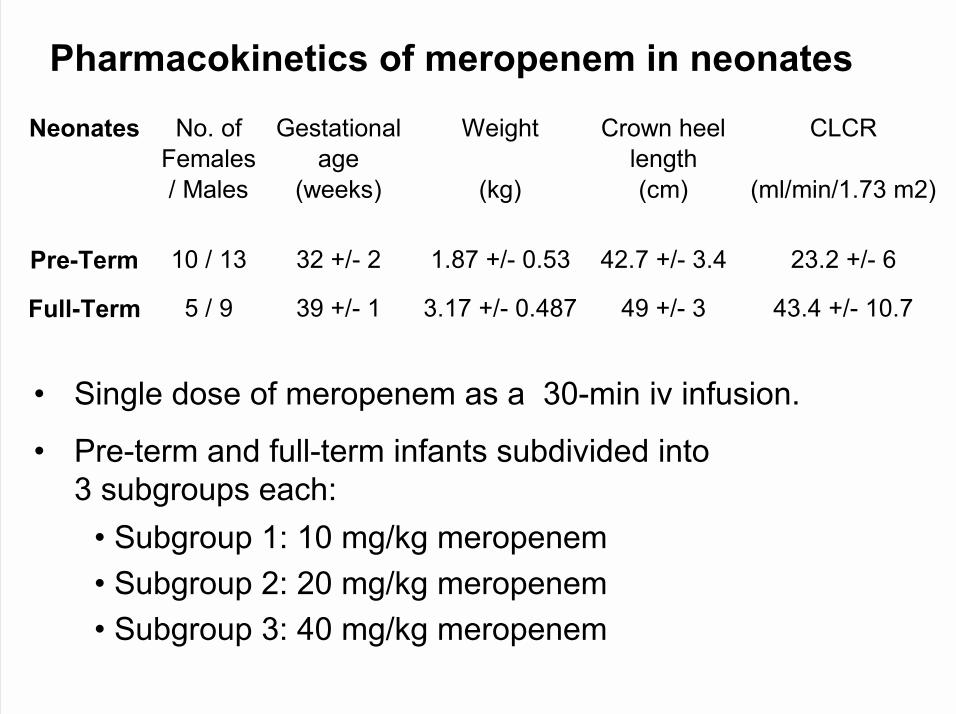
Neonates No. of Gestational Weight Crown heel CLCRFemales age length/ Males (weeks) (kg) (cm) (ml/min/1.73 m2)
Pre-Term 10 / 13 32 +/- 2 1.87 +/- 0.53 42.7 +/- 3.4 23.2 +/- 6
Full-Term 5 / 9 39 +/- 1 3.17 +/- 0.487 49 +/- 3 43.4 +/- 10.7
Pharmacokinetics of meropenem in neonates
� Single dose of meropenem as a 30-min iv infusion.
� Pre-term and full-term infants subdivided into 3 subgroups each:
� Subgroup 1: 10 mg/kg meropenem� Subgroup 2: 20 mg/kg meropenem� Subgroup 3: 40 mg/kg meropenem
0.1
1
10
100
0 2 4 6 8 10 12 14 16 18 20 22 24Time (h)
Con
cent
ratio
n (µ
g/m
L) 10 mg/kg20 mg/kg40 mg/kg
0.1
1
10
100
0 2 4 6 8 10 12 14 16 18 20 22 24Time (h)
Con
cent
ratio
n (µ
g/m
L) 10 mg/kg20 mg/kg40 mg/kg
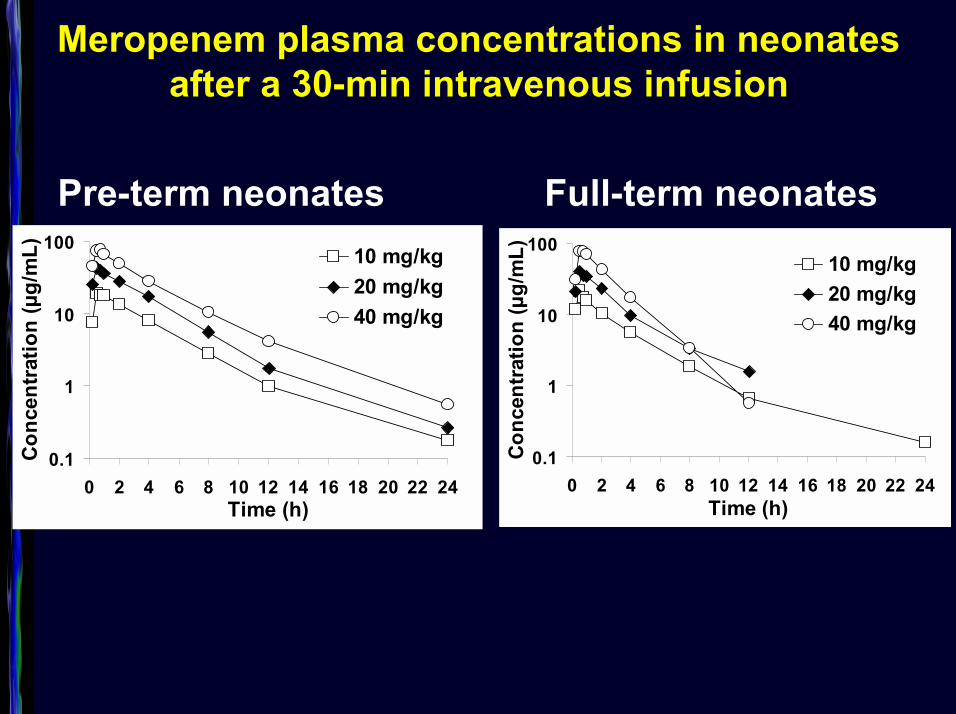
Meropenem plasma concentrations in neonates after a 30-min intravenous infusion
Pre-term neonates Full-term neonates
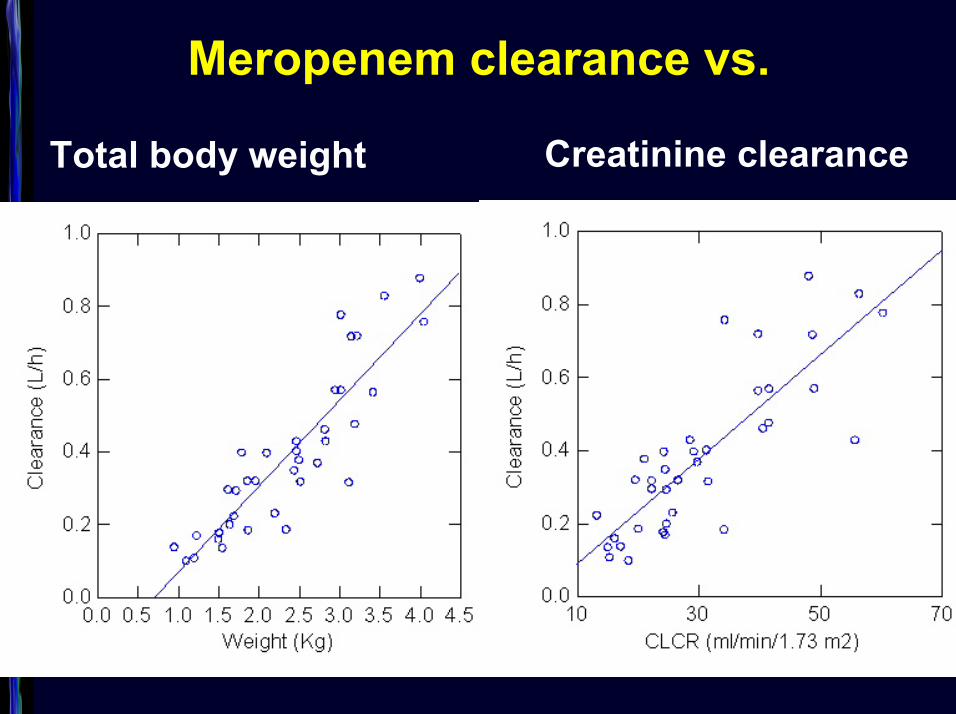
Meropenem clearance vs.
Creatinine clearanceTotal body weight
Prob
abili
ty o
f ta
rget
atta
inm
ent
MIC (mg/L) MIC (mg/L)
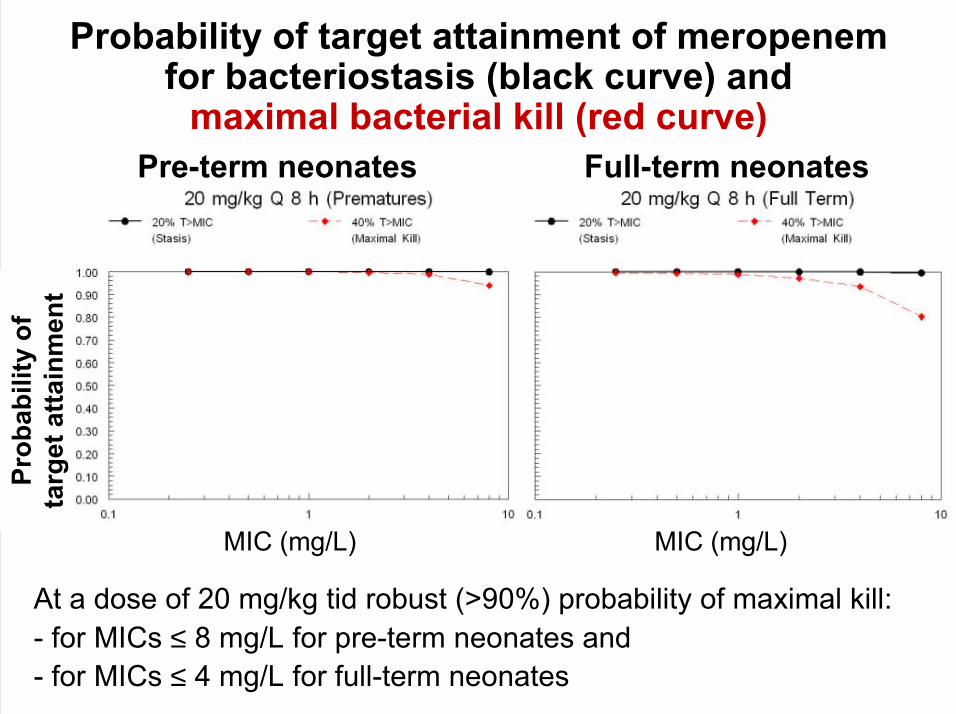
Probability of target attainment of meropenem for bacteriostasis (black curve) and
maximal bacterial kill (red curve)Pre-term neonates Full-term neonates
At a dose of 20 mg/kg tid robust (>90%) probability of maximal kill:- for MICs ≤ 8 mg/L for pre-term neonates and - for MICs ≤ 4 mg/L for full-term neonates
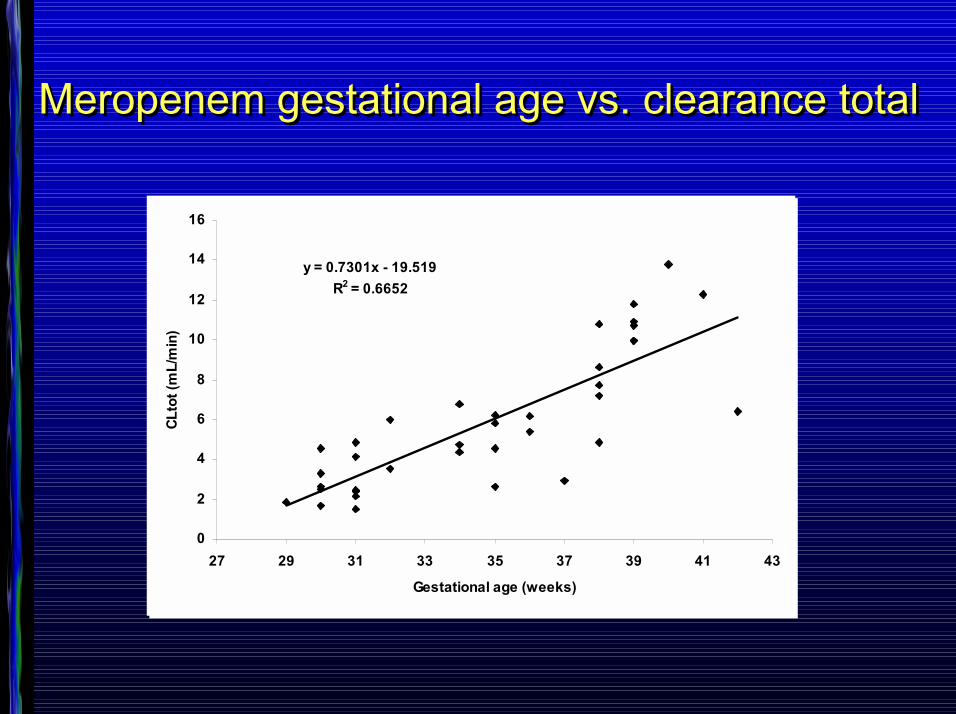
Meropenem gestational age vs. clearance totalMeropenem gestational age vs. clearance total
y = 0.7301x - 19.519R2 = 0.6652
0
2
4
6
8
10
12
14
16
27 29 31 33 35 37 39 41 43
Gestational age (weeks)
CLto
t (m
L/m
in)
y = 0.7301x - 19.519R2 = 0.6652
0
2
4
6
8
10
12
14
16
27 29 31 33 35 37 39 41 43
Gestational age (weeks)
CLto
t (m
L/m
in)
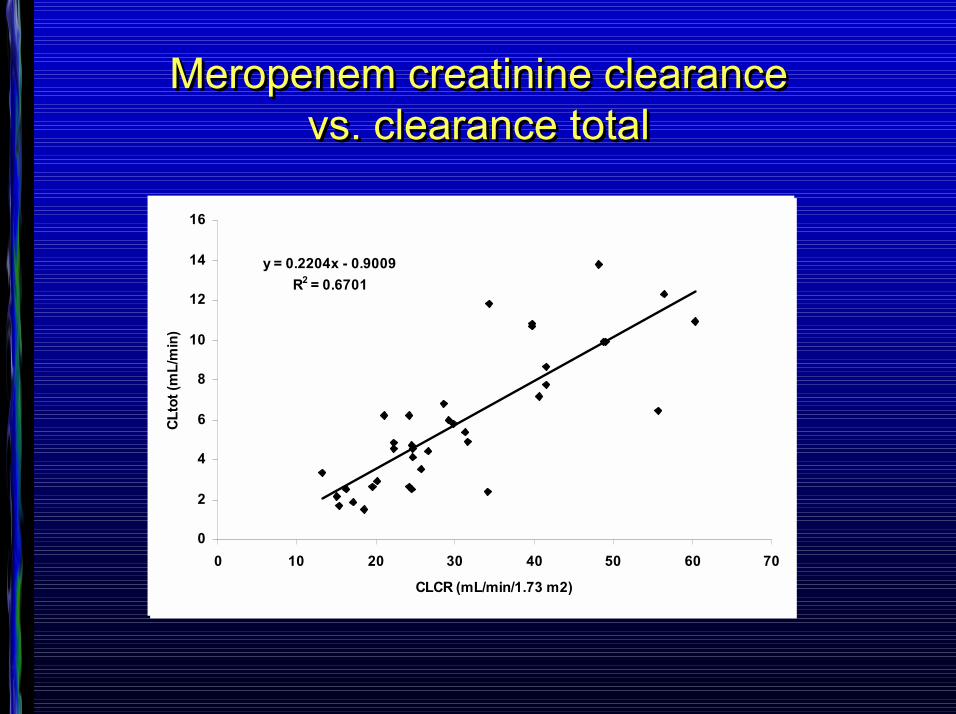
Meropenem creatinine clearance vs. clearance total
Meropenem creatinine clearance vs. clearance total
y = 0.2204x - 0.9009R2 = 0.6701
0
2
4
6
8
10
12
14
16
0 10 20 30 40 50 60 70
CLCR (mL/min/1.73 m2)
CLto
t (m
L/m
in)
y = 0.2204x - 0.9009R2 = 0.6701
0
2
4
6
8
10
12
14
16
0 10 20 30 40 50 60 70
CLCR (mL/min/1.73 m2)
CLto
t (m
L/m
in)

Individualisierung der AntibiotikatherapieIndividualisierung der AntibiotikatherapieIndividualisierung der AntibiotikatherapieIndividualisierung der AntibiotikatherapieOderOderOderOder
ONE SIZE FITS ALL ?ONE SIZE FITS ALL ?ONE SIZE FITS ALL ?ONE SIZE FITS ALL ?
Die Pharmakokinetik von X - Floxacin ist unabhängig vom Geschlecht
Die Pharmakokinetik von X - Floxacin ist geschlechtsunabhängig
Die Pharmakokinetik von X - Floxacin ist unabhängig vom Alter
Die Pharmakokinetik von X - Floxacin ist geschlechtsunabhängig
Die Pharmakokinetik von X - Floxacin ist unabhängig vom Alter
Die Pharmakokinetik von X - Floxacin ist unabhängig vom Gewicht
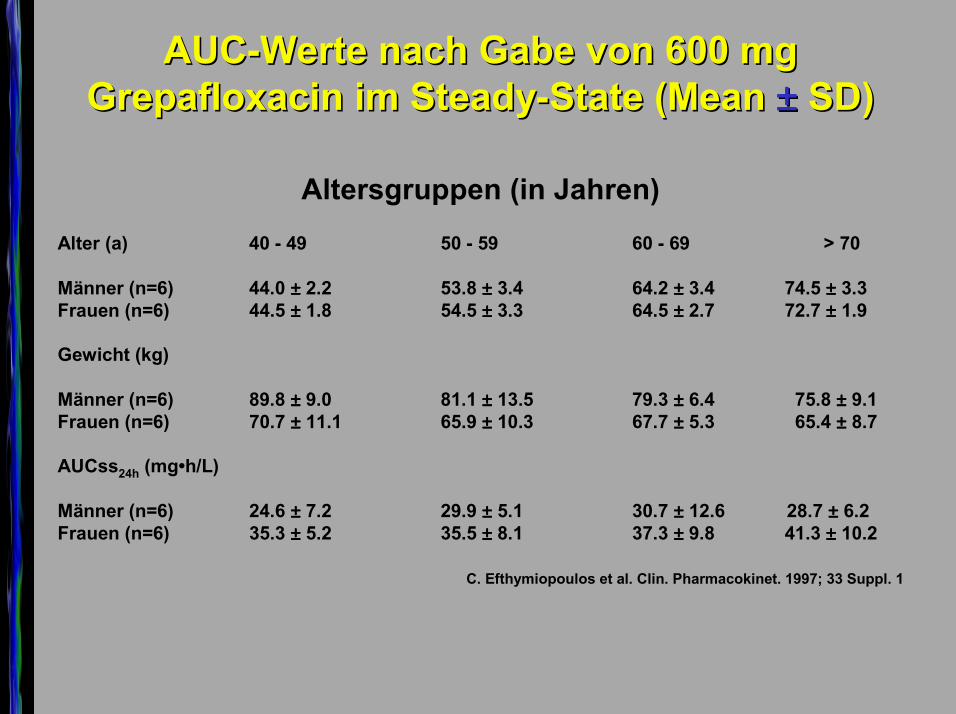
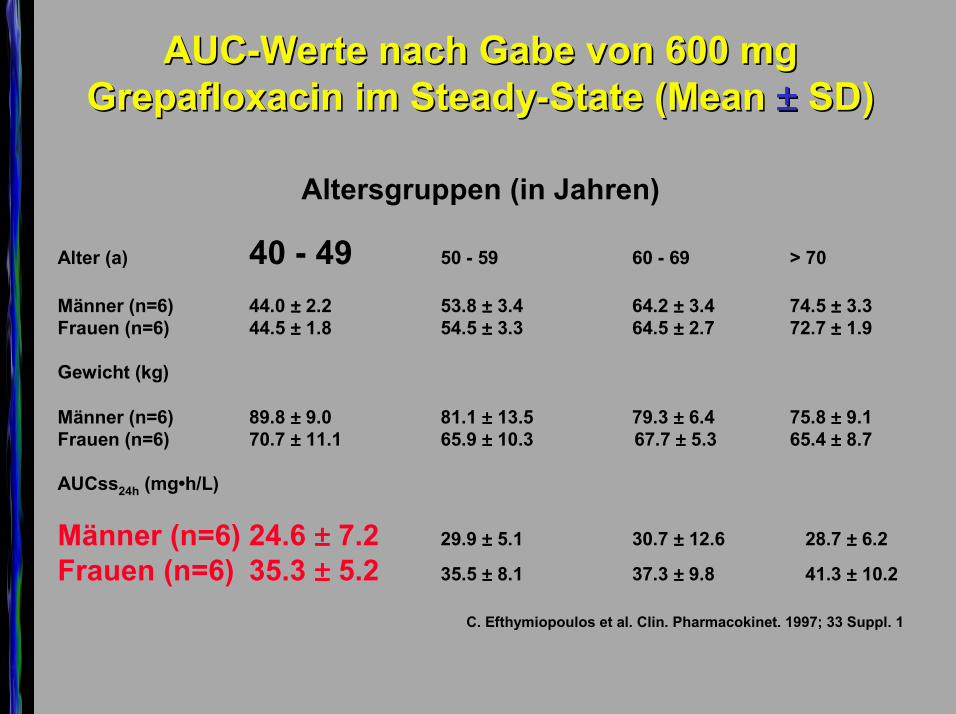
AUCAUC--Werte nach Gabe von Werte nach Gabe von 600 mg 600 mg Grepafloxacin imGrepafloxacin im SteadySteady--State (Mean State (Mean ±±±±±±±± SD)SD)
Altersgruppen (in Jahren)Alter (a) 40 - 49 50 - 59 60 - 69 > 70
Männer (n=6) 44.0 ±±±± 2.2 53.8 ±±±± 3.4 64.2 ±±±± 3.4 74.5 ±±±± 3.3Frauen (n=6) 44.5 ±±±± 1.8 54.5 ±±±± 3.3 64.5 ±±±± 2.7 72.7 ±±±± 1.9
Gewicht (kg)
Männer (n=6) 89.8 ±±±± 9.0 81.1 ±±±± 13.5 79.3 ±±±± 6.4 75.8 ±±±± 9.1Frauen (n=6) 70.7 ±±±± 11.1 65.9 ±±±± 10.3 67.7 ±±±± 5.3 65.4 ±±±± 8.7
AUCss24h (mg�h/L)
Männer (n=6) 24.6 ±±±± 7.2 29.9 ±±±± 5.1 30.7 ±±±± 12.6 28.7 ±±±± 6.2Frauen (n=6) 35.3 ±±±± 5.2 35.5 ±±±± 8.1 37.3 ±±±± 9.8 41.3 ±±±± 10.2
C. Efthymiopoulos et al. Clin. Pharmacokinet. 1997; 33 Suppl. 1
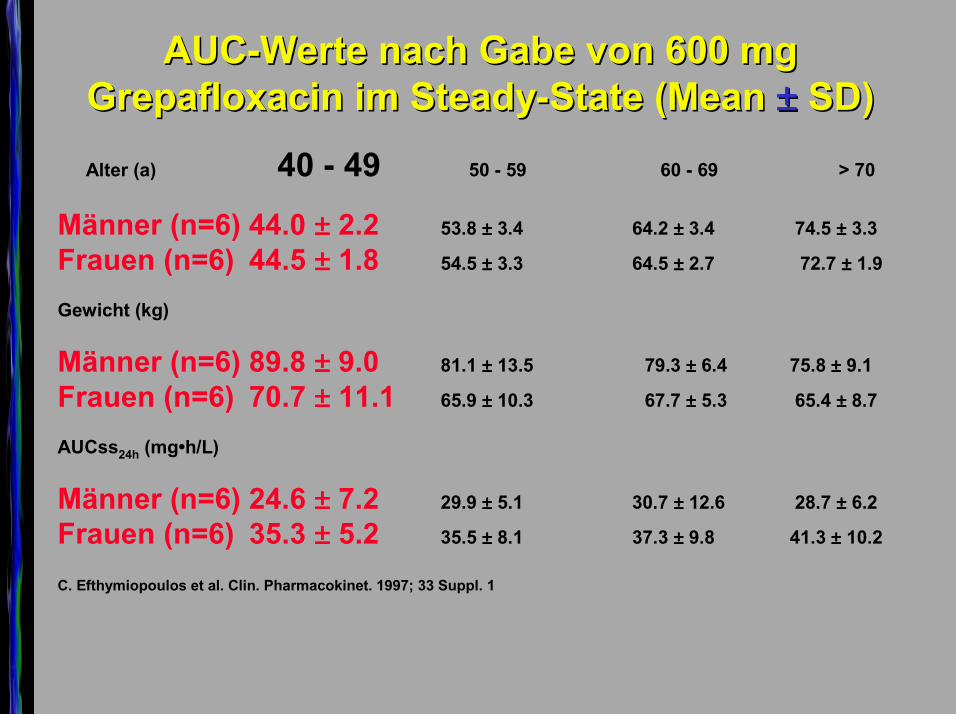
AUCAUC--Werte nach Gabe von Werte nach Gabe von 600 mg 600 mg Grepafloxacin imGrepafloxacin im SteadySteady--State (Mean State (Mean ±±±±±±±± SD)SD)
Altersgruppen (in Jahren)
Alter (a) 40 - 49 50 - 59 60 - 69 > 70
Männer (n=6) 44.0 ±±±± 2.2 53.8 ±±±± 3.4 64.2 ±±±± 3.4 74.5 ±±±± 3.3Frauen (n=6) 44.5 ±±±± 1.8 54.5 ±±±± 3.3 64.5 ±±±± 2.7 72.7 ±±±± 1.9
Gewicht (kg)
Männer (n=6) 89.8 ±±±± 9.0 81.1 ±±±± 13.5 79.3 ±±±± 6.4 75.8 ±±±± 9.1Frauen (n=6) 70.7 ±±±± 11.1 65.9 ±±±± 10.3 67.7 ±±±± 5.3 65.4 ±±±± 8.7
AUCss24h (mg�h/L)
Männer (n=6) 24.6 ±±±± 7.2 29.9 ±±±± 5.1 30.7 ±±±± 12.6 28.7 ±±±± 6.2
Frauen (n=6) 35.3 ±±±± 5.2 35.5 ±±±± 8.1 37.3 ±±±± 9.8 41.3 ±±±± 10.2
C. Efthymiopoulos et al. Clin. Pharmacokinet. 1997; 33 Suppl. 1
AUCAUC--Werte nach Gabe von Werte nach Gabe von 600 mg 600 mg Grepafloxacin imGrepafloxacin im SteadySteady--State (Mean State (Mean ±±±±±±±± SD)SD)Alter (a) 40 - 49 50 - 59 60 - 69 > 70
Männer (n=6) 44.0 ±±±± 2.2 53.8 ±±±± 3.4 64.2 ±±±± 3.4 74.5 ±±±± 3.3
Frauen (n=6) 44.5 ±±±± 1.8 54.5 ±±±± 3.3 64.5 ±±±± 2.7 72.7 ±±±± 1.9
Gewicht (kg)
Männer (n=6) 89.8 ±±±± 9.0 81.1 ±±±± 13.5 79.3 ±±±± 6.4 75.8 ±±±± 9.1
Frauen (n=6) 70.7 ±±±± 11.1 65.9 ±±±± 10.3 67.7 ±±±± 5.3 65.4 ±±±± 8.7
AUCss24h (mg�h/L)
Männer (n=6) 24.6 ±±±± 7.2 29.9 ±±±± 5.1 30.7 ±±±± 12.6 28.7 ±±±± 6.2
Frauen (n=6) 35.3 ±±±± 5.2 35.5 ±±±± 8.1 37.3 ±±±± 9.8 41.3 ±±±± 10.2
C. Efthymiopoulos et al. Clin. Pharmacokinet. 1997; 33 Suppl. 1
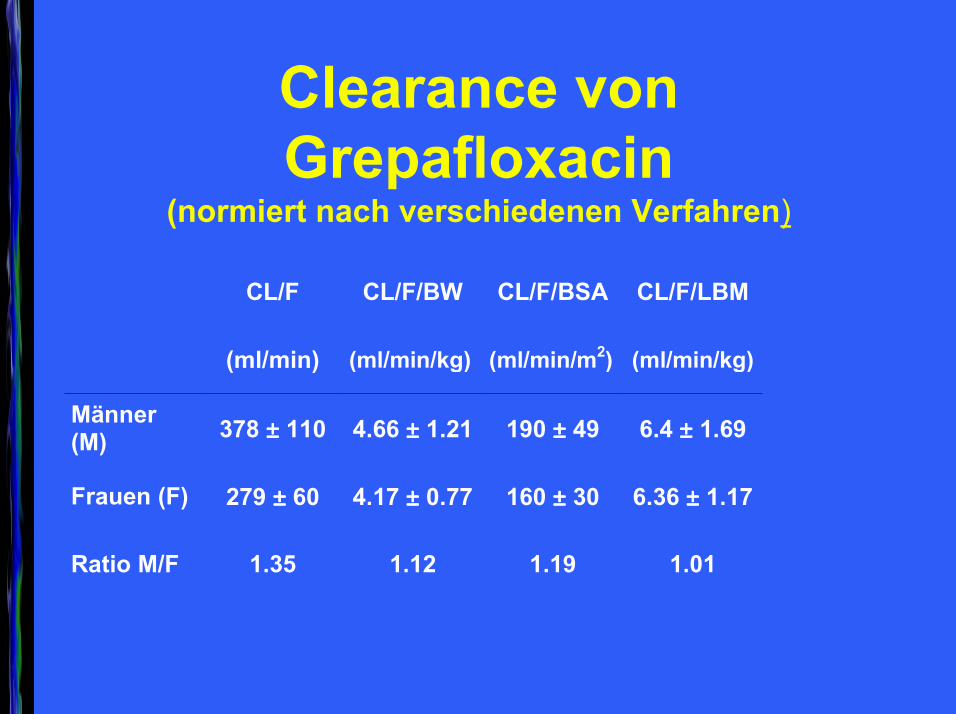
Clearance von Grepafloxacin
(normiert nach verschiedenen Verfahren)
CL/F CL/F/BW CL/F/BSA CL/F/LBM
(ml/min) (ml/min/kg) (ml/min/m2) (ml/min/kg)
Männer(M) 378 ±±±± 110 4.66 ±±±± 1.21 190 ±±±± 49 6.4 ±±±± 1.69
Frauen (F) 279 ±±±± 60 4.17 ±±±± 0.77 160 ±±±± 30 6.36 ±±±± 1.17
Ratio M/F 1.35 1.12 1.19 1.01

Die Pharmakokinetik von X-Floxacin ist im Alter, bei Frauen oder bei niedrigem
Gewicht nicht verändert
PlasmaspiegelDen Kliniker interessieren die
unkorrigierten Konzentrationen
Mechanismus der AusscheidungFür den Pharmakokinetiker interessant,
mL/min/kg
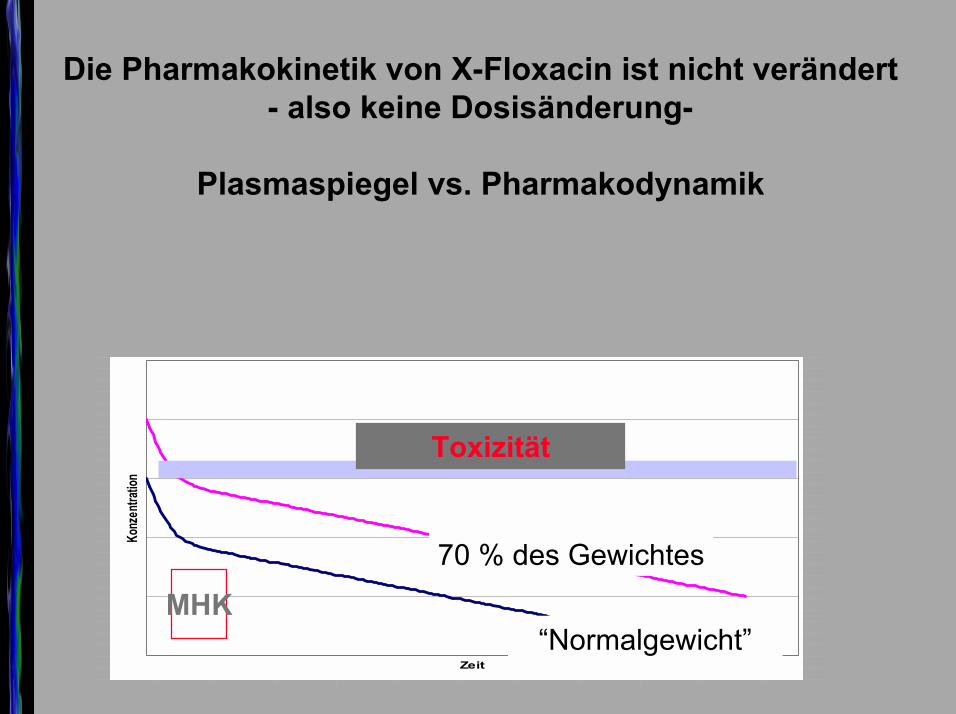
Die Pharmakokinetik von X-Floxacin ist nicht verändert - also keine Dosisänderung-
Plasmaspiegel vs. Pharmakodynamik
1*Conc
10,731750,54205,407718,312421,244646,1962820,16161,136602,118419,105058,095109,087578,081763,077171,0734520,07036,067722,065415,063353,061474,059734,058103,056558,055084,053669
Zeit
Konz
entra
tion
MHK
Toxizität
70 % des Gewichtes
�Normalgewicht�

Sollen beide die gleiche Dosis bekommen ?
�One size fits all�

U
Individualisierung der AntibiotikatherapieIndividualisierung der AntibiotikatherapieIndividualisierung der AntibiotikatherapieIndividualisierung der Antibiotikatherapie

No Effect of Body Weight on PEG-INF alpha 2aClearance in Healthy Subjects
Pooled Data Basic Model
0
50
100
150
200
250
40 50 60 70 80 90 100 110Weight (kg)
CL
(mL/
h)
N = 285, 3 N = 285, 3 ClinClin PharmPharm StudiesStudies
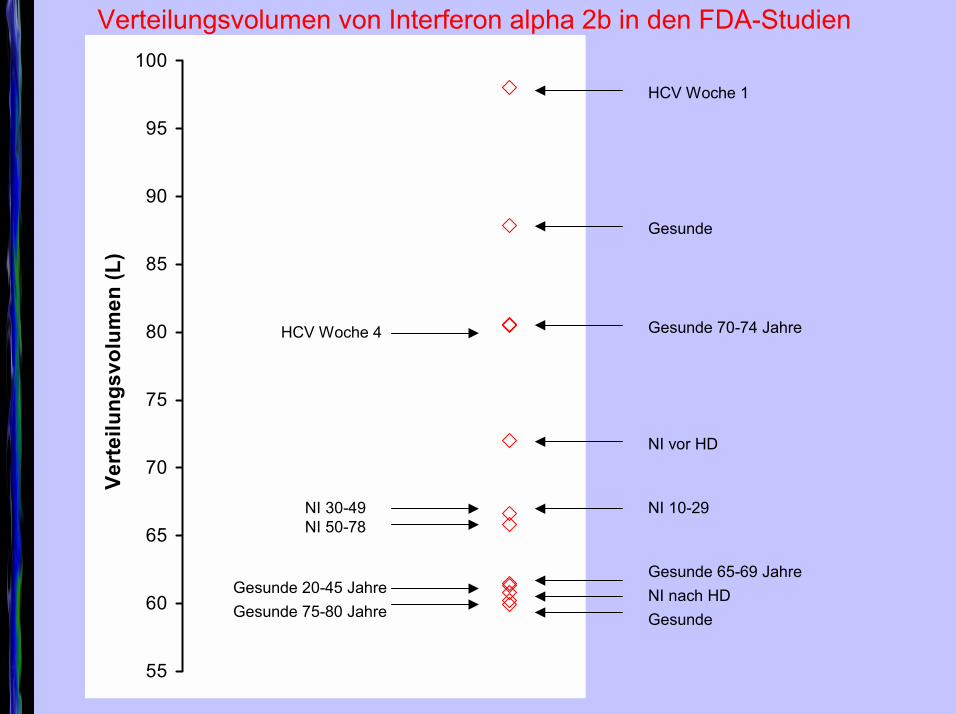
55
60
65
70
75
80
85
90
95
100
Vert
eilu
ngsv
olum
en (L
)HCV Woche 1
Gesunde
Gesunde 70-74 Jahre HCV Woche 4
NI vor HD
NI 10-29NI 50-78NI 30-49
Gesunde 65-69 JahreGesunde 20-45 Jahre NI nach HDGesunde 75-80 Jahre Gesunde
Verteilungsvolumen von Interferon alpha 2b in den FDA-Studien
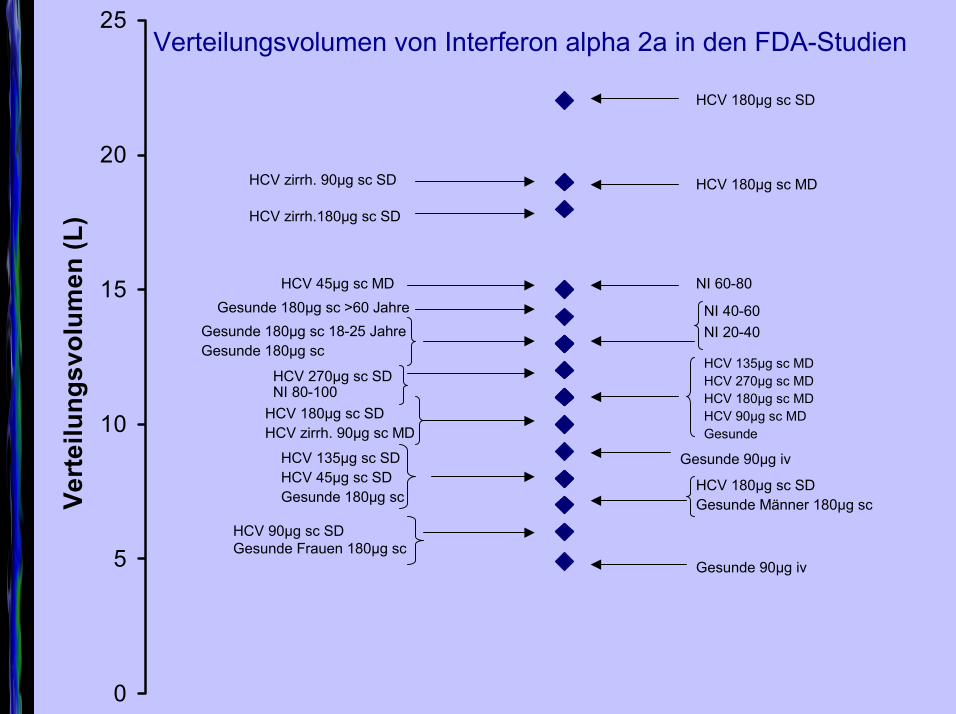
0
5
10
15
20
25
Vert
eilu
ngsv
olum
en (L
)HCV 180µg sc SD
HCV 180µg sc MDHCV zirrh. 90µg sc SD
HCV zirrh.180µg sc SD
NI 60-80
NI 40-60NI 20-40
Gesunde 180µg sc >60 Jahre
HCV 270µg sc SDNI 80-100
HCV 45µg sc MD
Gesunde 180µg sc 18-25 JahreGesunde 180µg sc
HCV 135µg sc MDHCV 270µg sc MDHCV 180µg sc MDHCV 90µg sc MDGesunde
HCV 180µg sc SDHCV zirrh. 90µg sc MD
Gesunde 90µg ivHCV 135µg sc SDHCV 45µg sc SDGesunde 180µg sc
HCV 180µg sc SDGesunde Männer 180µg sc
HCV 90µg sc SD Gesunde Frauen 180µg sc
Gesunde 90µg iv
Verteilungsvolumen von Interferon alpha 2a in den FDA-Studien
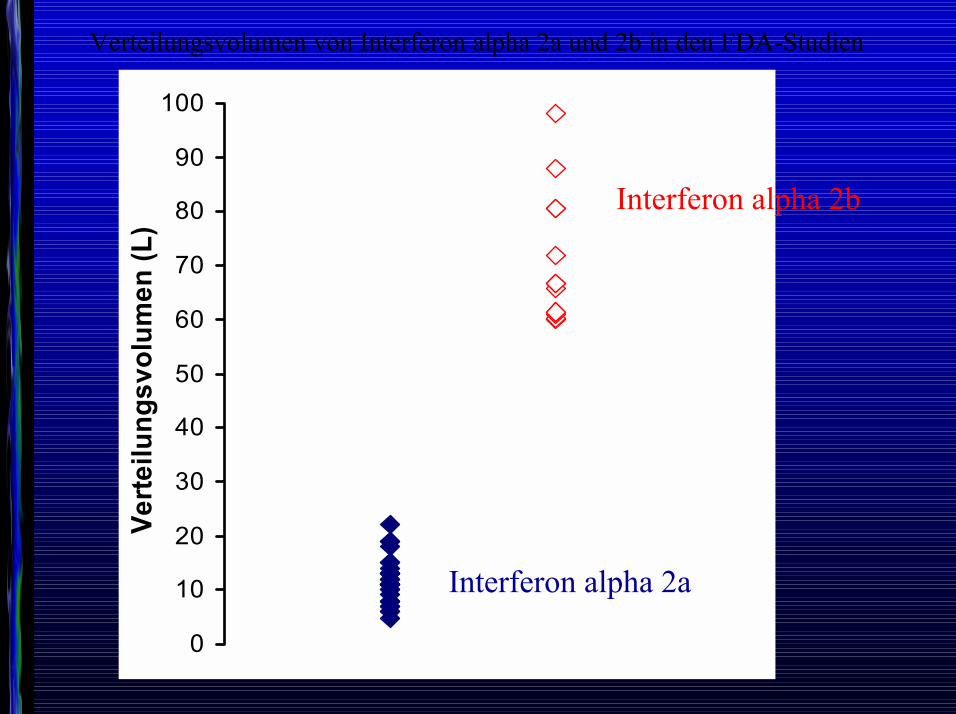
0
10
20
30
40
50
60
70
80
90
100Ve
rteilu
ngsv
olum
en (L
)
Interferon alpha 2b
Interferon alpha 2a
Verteilungsvolumen von Interferon alpha 2a und 2b in den FDA-Studien
Kritik der reinenNorm
Klinische Forschung hilft vor allem StandardpatientenVon Harro Albrecht
Ausgabe 2, 2005
Summerskill W.Evidence-based practice and the individual.
Lancet. 2005 Jan 1;365(9453):13-4.
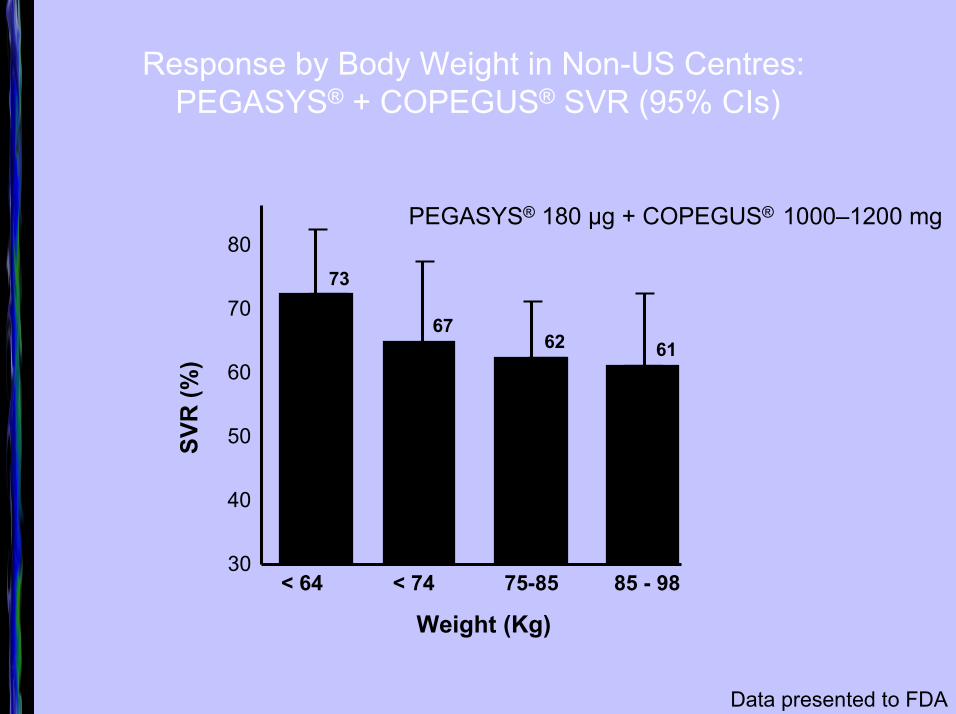
Response by Body Weight in Non-US Centres: PEGASYS® + COPEGUS® SVR (95% CIs)
SVR
(%)
73
6762 61
40
30
50
60
70
80
Weight (Kg)
Data presented to FDA
< 64 < 74 75-85 85 - 98
PEGASYS® 180 µg + COPEGUS® 1000�1200 mg
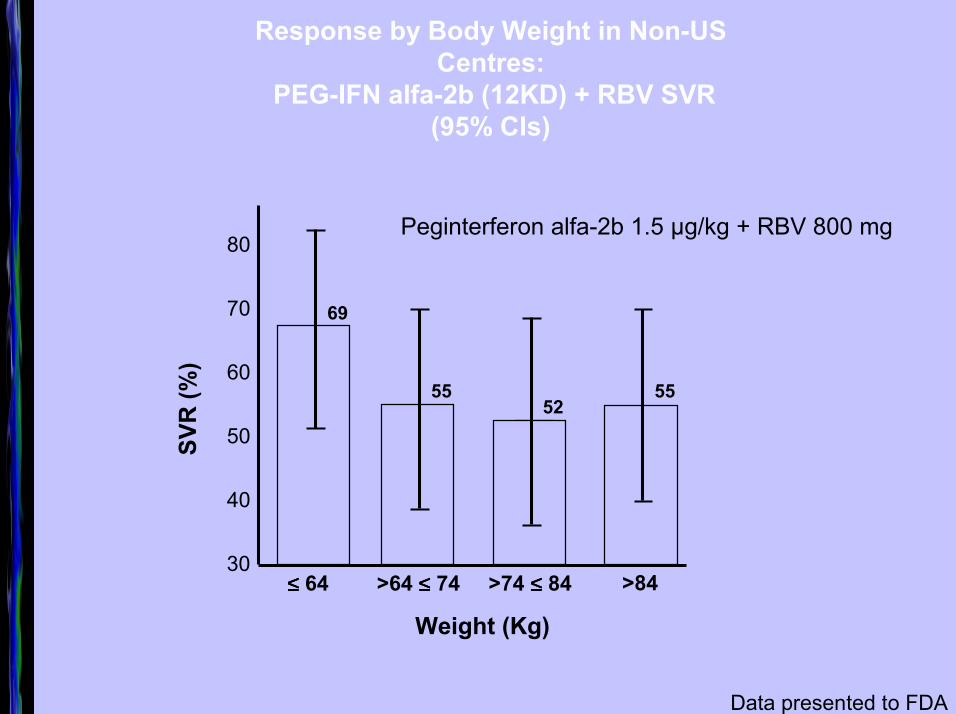
Response by Body Weight in Non-US Centres:
PEG-IFN alfa-2b (12KD) + RBV SVR (95% CIs)
Data presented to FDA
40
30
50
60
70
80
SVR
(%)
Weight (Kg)
55
69
5552
≤≤≤≤ 64 >64 ≤≤≤≤ 74 >74 ≤≤≤≤ 84 >84
Peginterferon alfa-2b 1.5 µg/kg + RBV 800 mg
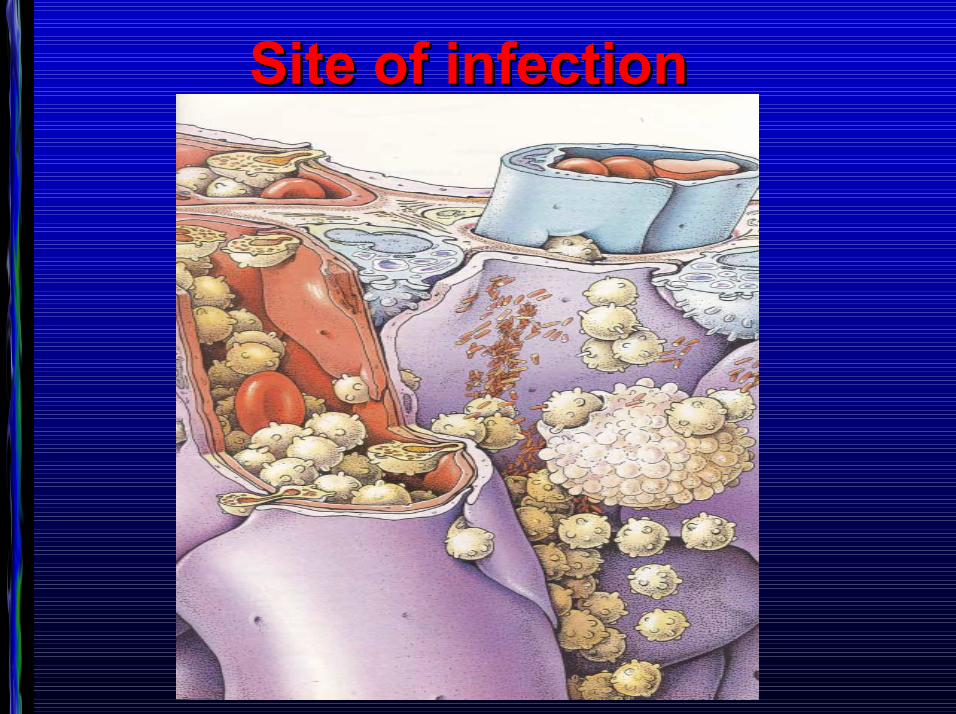
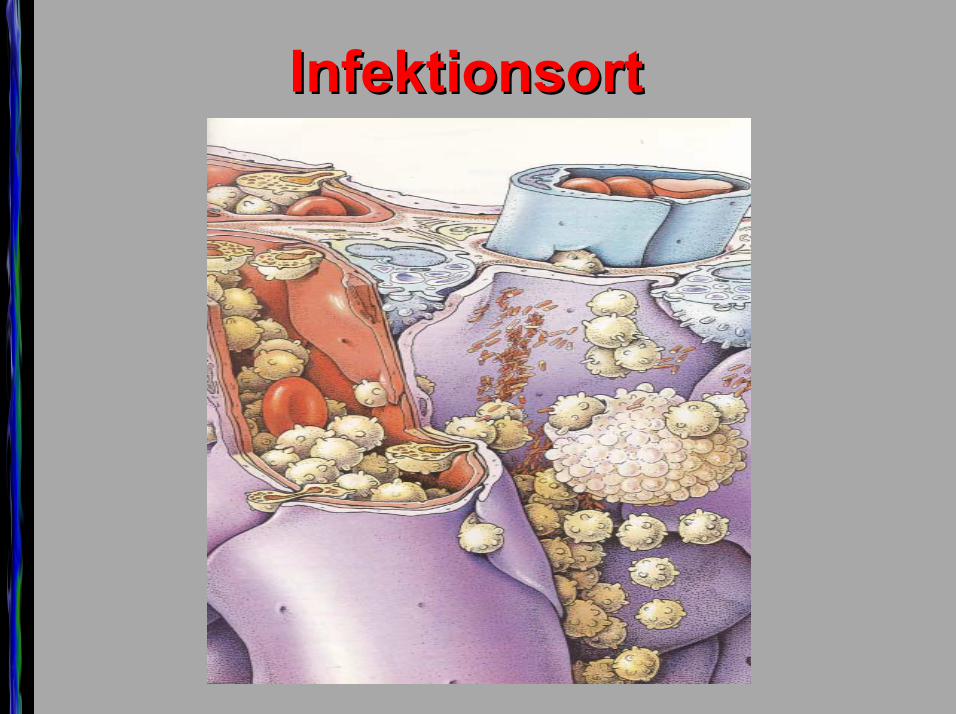
Site of infectionSite of infection
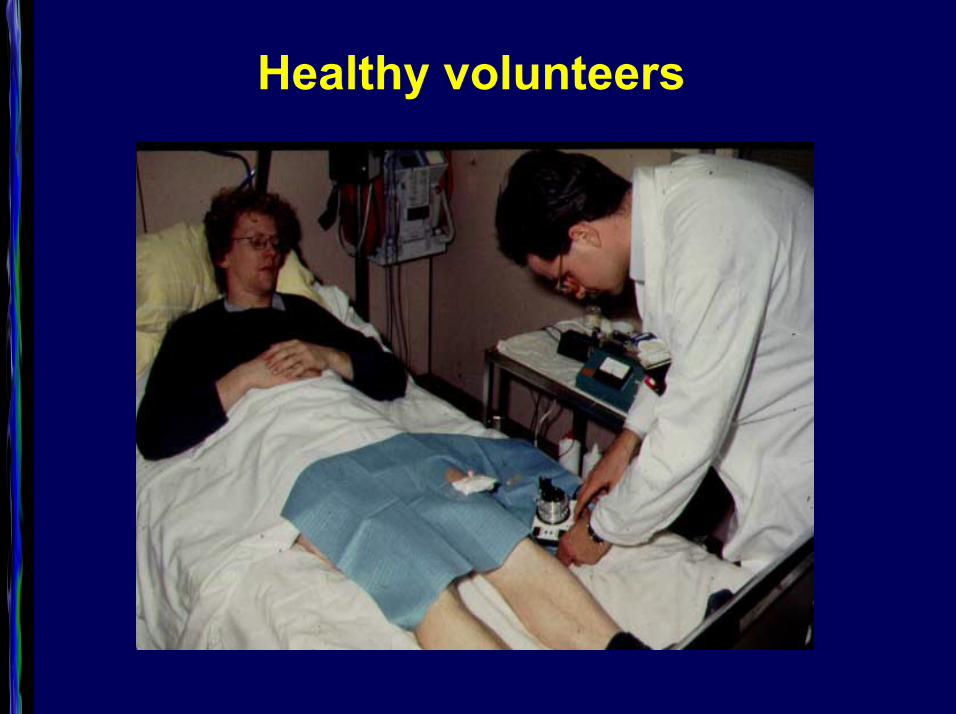
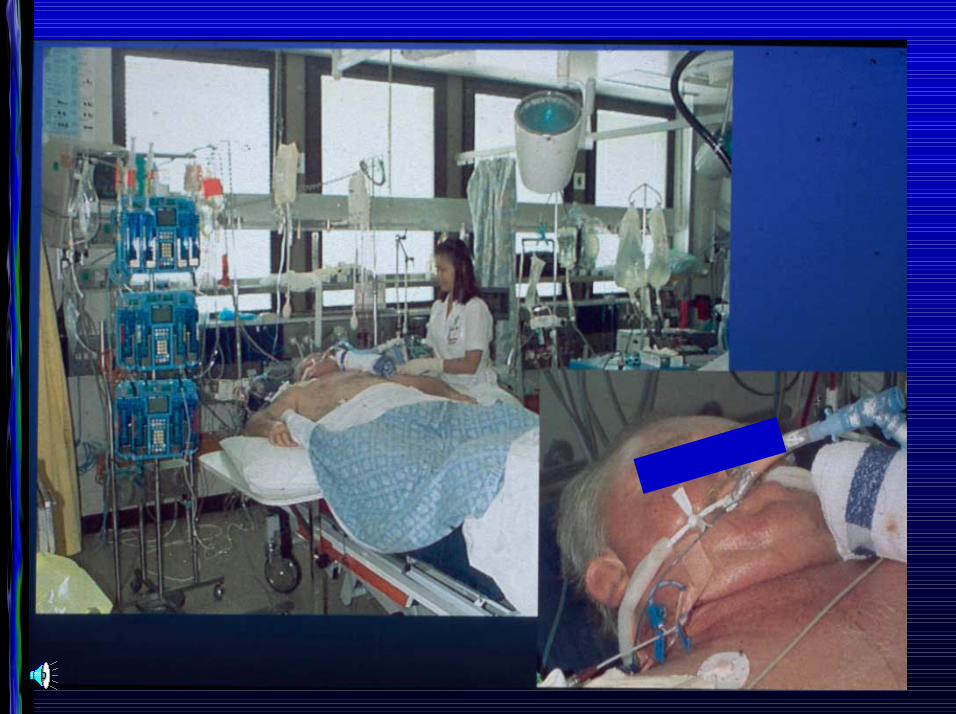
Healthy volunteers
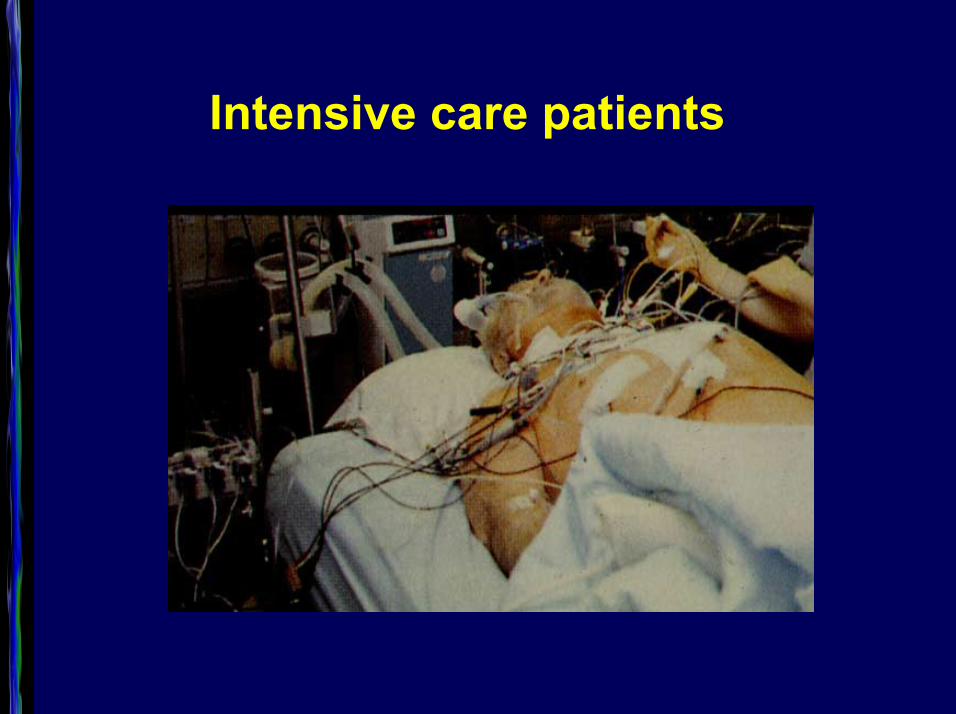
Intensive care patients
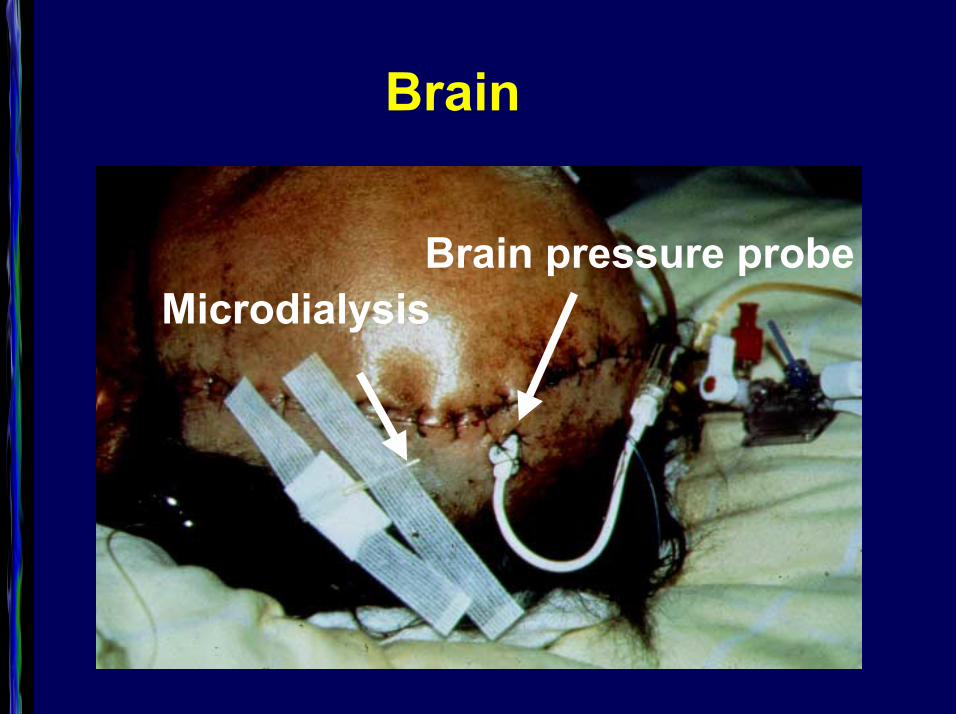
Brain
MicrodialysisBrain pressure probe
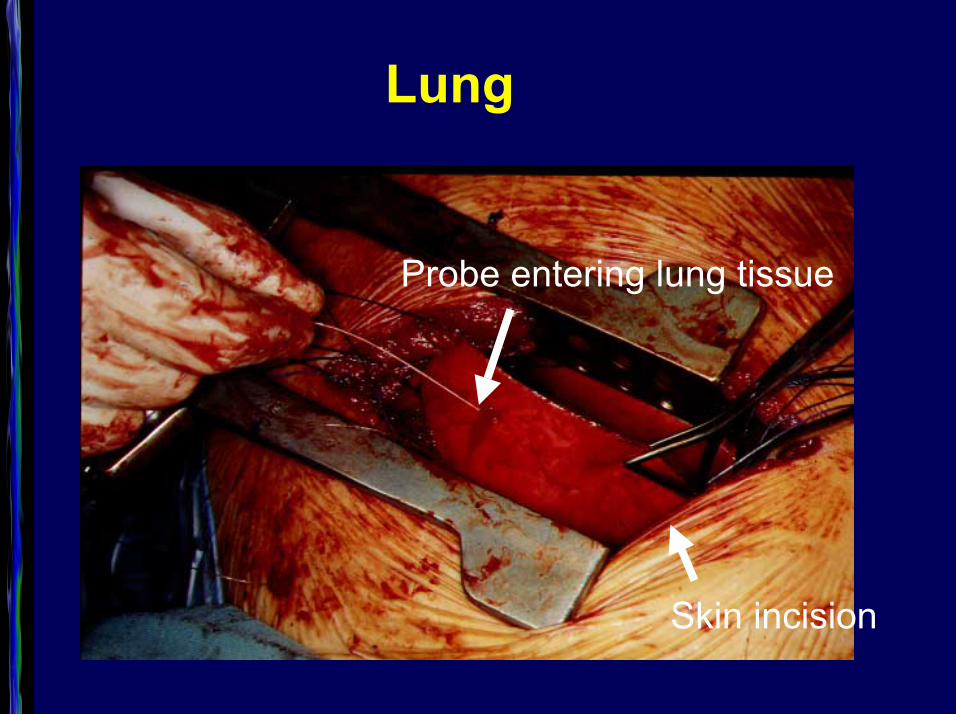
Lung
Skin incision
Probe entering lung tissue
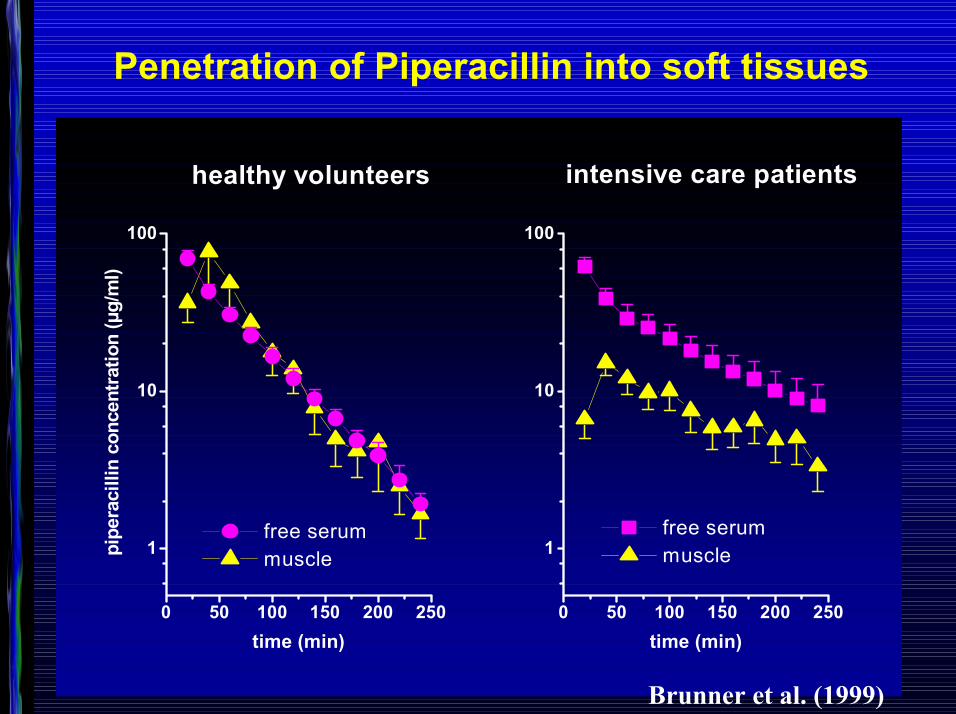
0 50 100 150 200 250
1
10
100
free serum musclepi
pera
cilli
n co
ncen
tratio
n (µ
g/m
l)
time (min)0 50 100 150 200 250
1
10
100
intensive care patientshealthy volunteers
free serum muscle
time (min)
Penetration of Piperacillin into soft tissues
Brunner et al. (1999)

Lung
Skin incision
Probe entering lung tissue
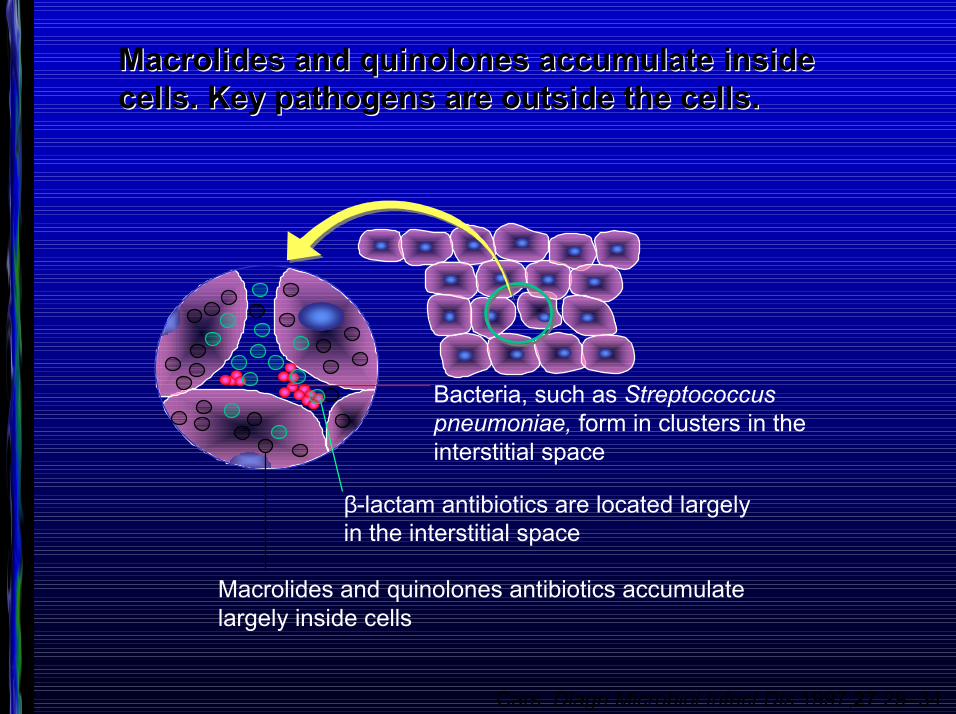
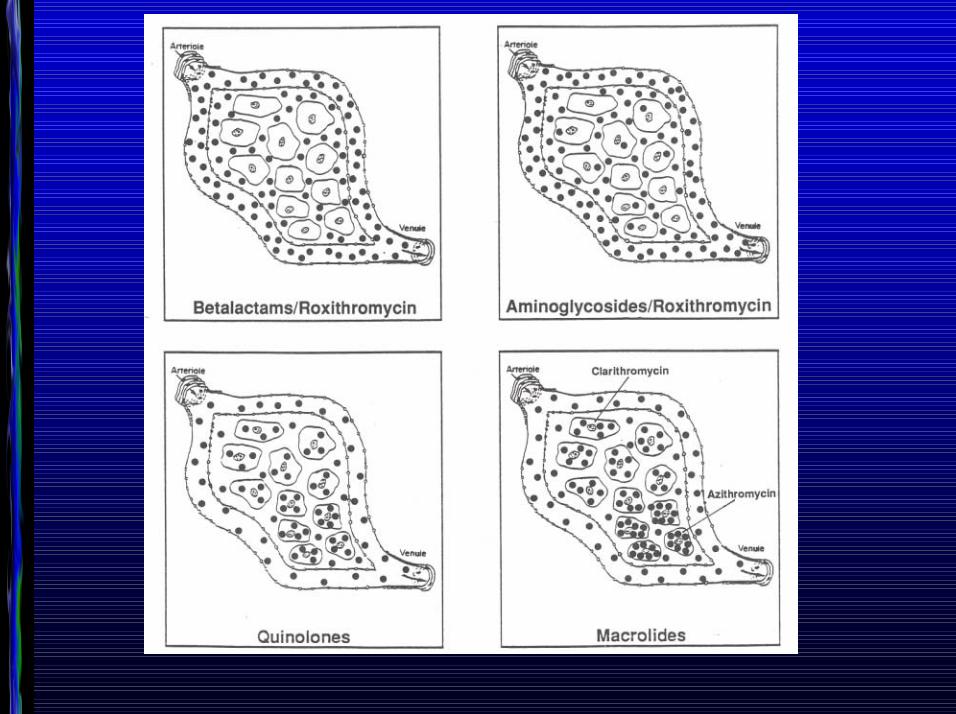
Macrolides and quinolones accumulate inside Macrolides and quinolones accumulate inside cells. Key pathogens are outside the cells.cells. Key pathogens are outside the cells.
Bacteria, such as Streptococcuspneumoniae, form in clusters in the interstitial space
Macrolides and quinolones antibiotics accumulatelargely inside cells
β-lactam antibiotics are located largelyin the interstitial space
Cars. Diagn Microbiol Infect Dis 1997;27:29�34
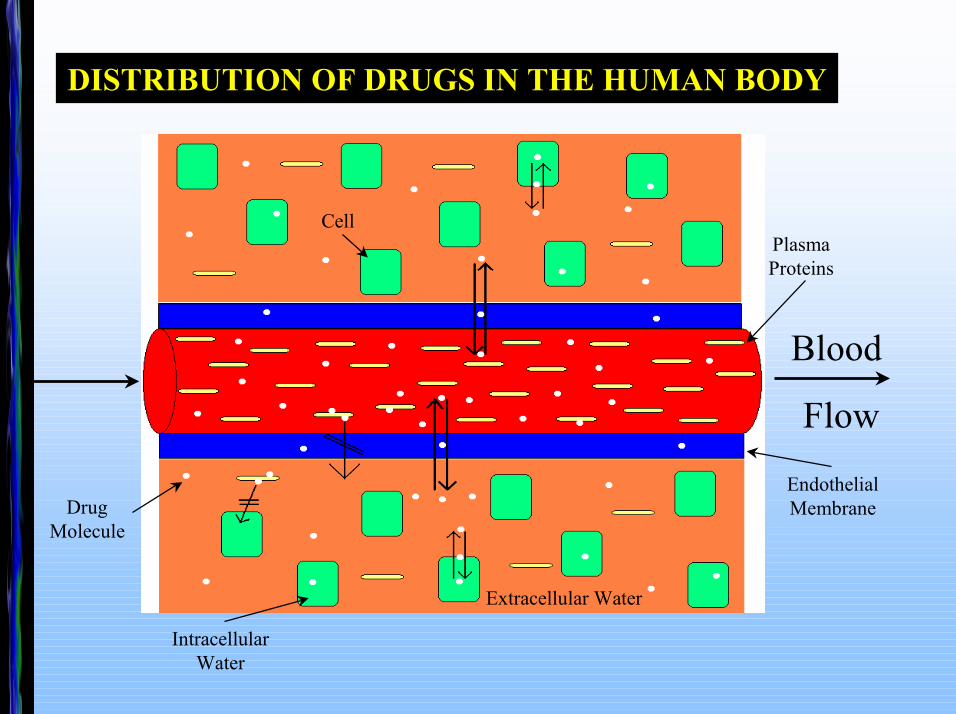
DISTRIBUTION OF DRUGS IN THE HUMAN BODY
Blood
Flow
Extracellular Water
IntracellularWater
Plasma Proteins
EndothelialMembrane
Cell
Drug Molecule
Kon
zent
ratio
n (m
g/l b
zw.
mg/
kg)
Zeit (h)15
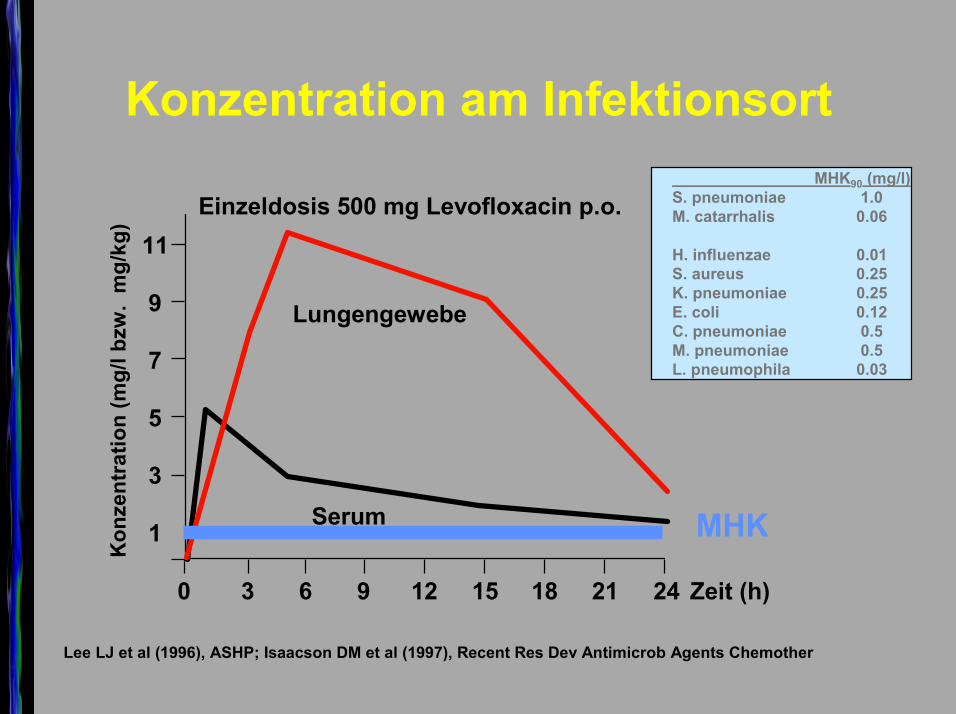
Serum
24930
11
9
7
5
3
1
2118126
Lungengewebe
Einzeldosis 500 mg Levofloxacin p.o.
Konzentration am Infektionsort
Lee LJ et al (1996), ASHP; Isaacson DM et al (1997), Recent Res Dev Antimicrob Agents Chemother
MHK90 (mg/l)S. pneumoniae 1.0M. catarrhalis 0.06
H. influenzae 0.01S. aureus 0.25K. pneumoniae 0.25E. coli 0.12C. pneumoniae 0.5M. pneumoniae 0.5L. pneumophila 0.03
MHK
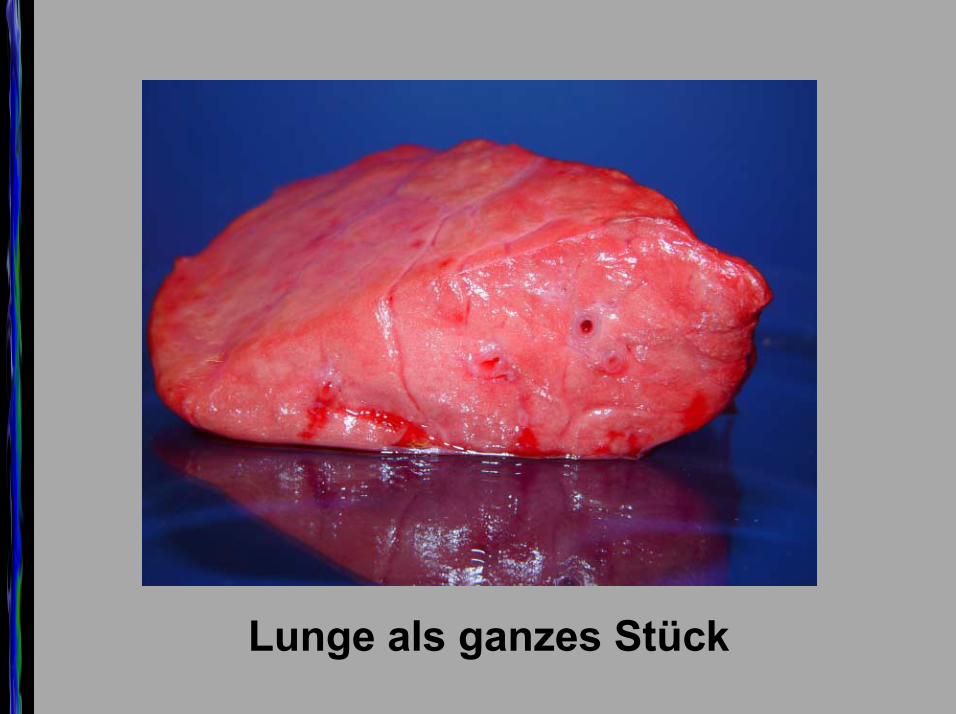
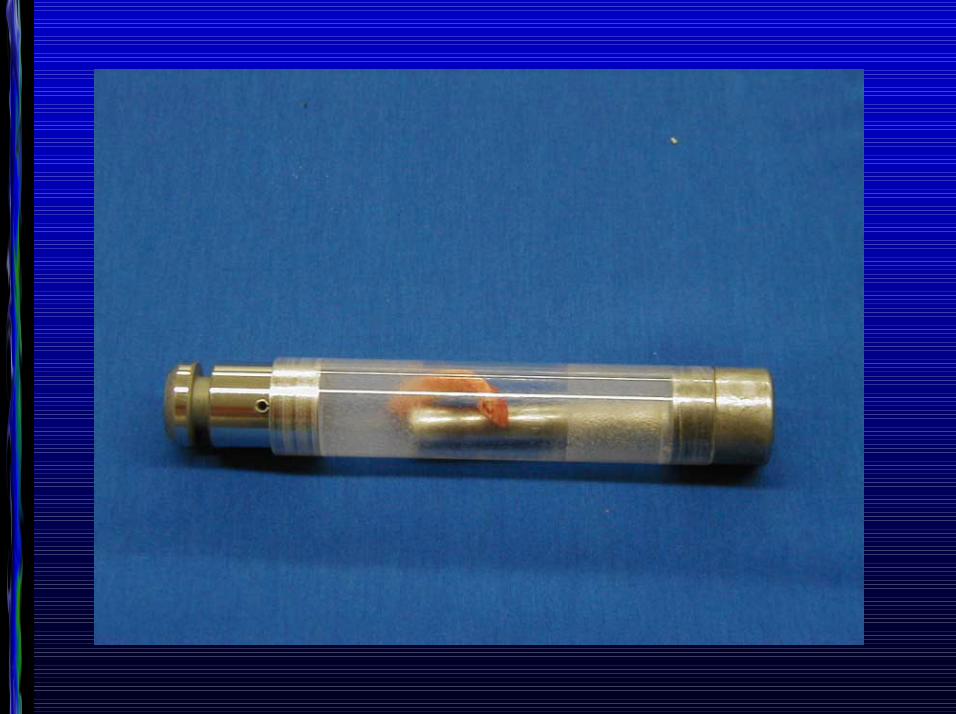
Lunge als ganzes Stück
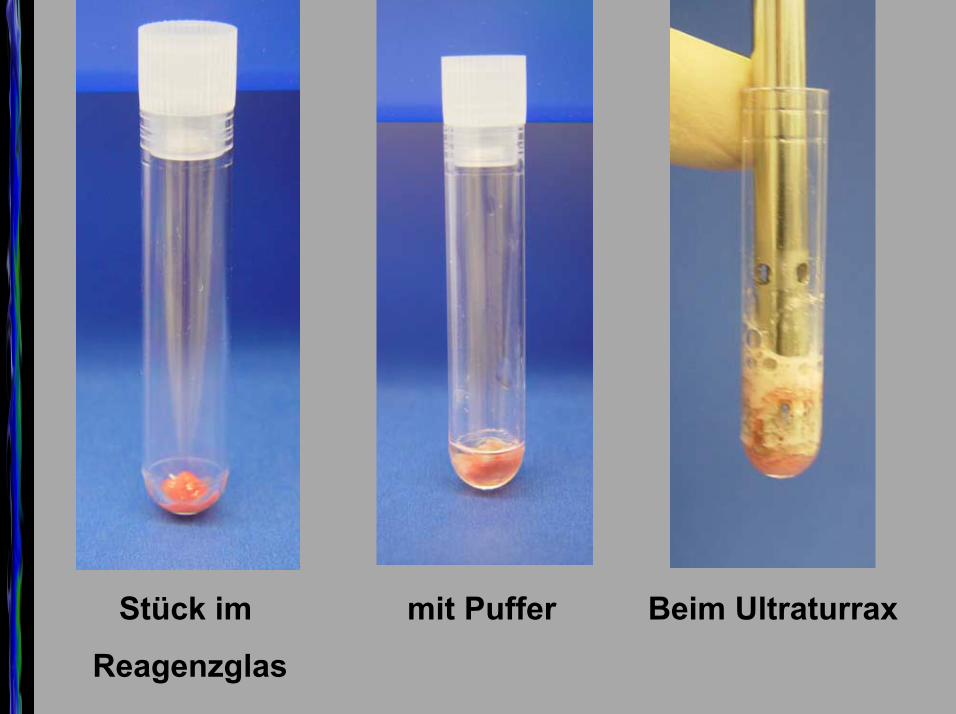
Stück im
Reagenzglas
mit Puffer Beim Ultraturrax
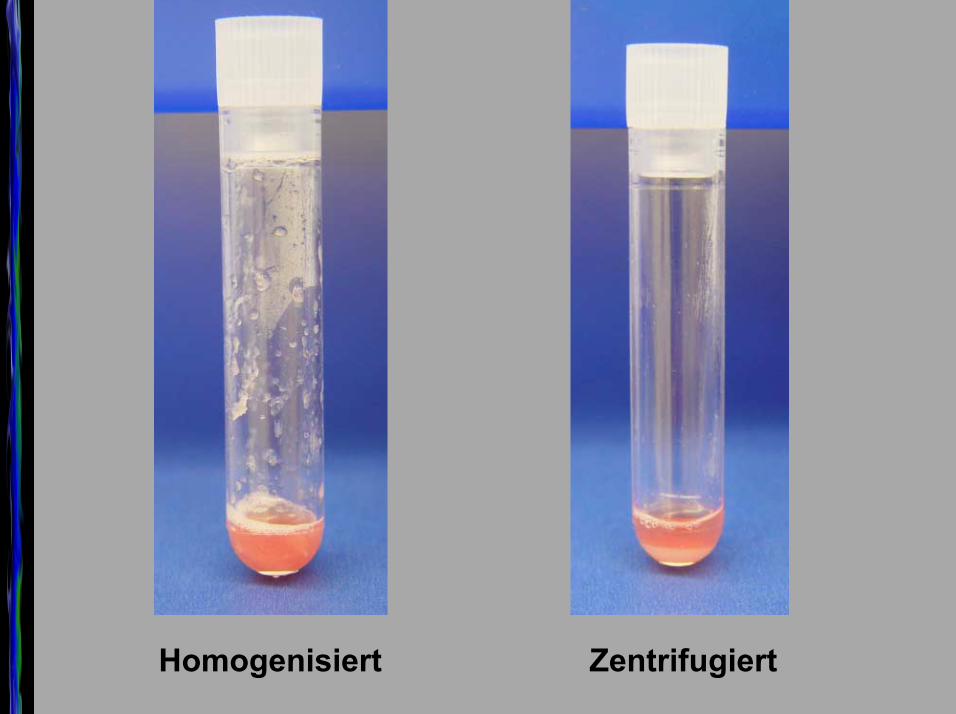
Homogenisiert Zentrifugiert

Kon
zent
ratio
n (m
g/l b
zw.
mg/
kg)
Zeit (h)15
Serum
24930
11
9
7
5
3
1
2118126
Lungengewebe
Einzeldosis 500 mg Levofloxacin p.o.
Konzentration am Infektionsort
Lee LJ et al (1996), ASHP; Isaacson DM et al (1997), Recent Res Dev Antimicrob Agents Chemother
MHK90 (mg/l)S. pneumoniae 1.0M. catarrhalis 0.06
H. influenzae 0.01S. aureus 0.25K. pneumoniae 0.25E. coli 0.12C. pneumoniae 0.5M. pneumoniae 0.5L. pneumophila 0.03
MHK
InfektionsortInfektionsort
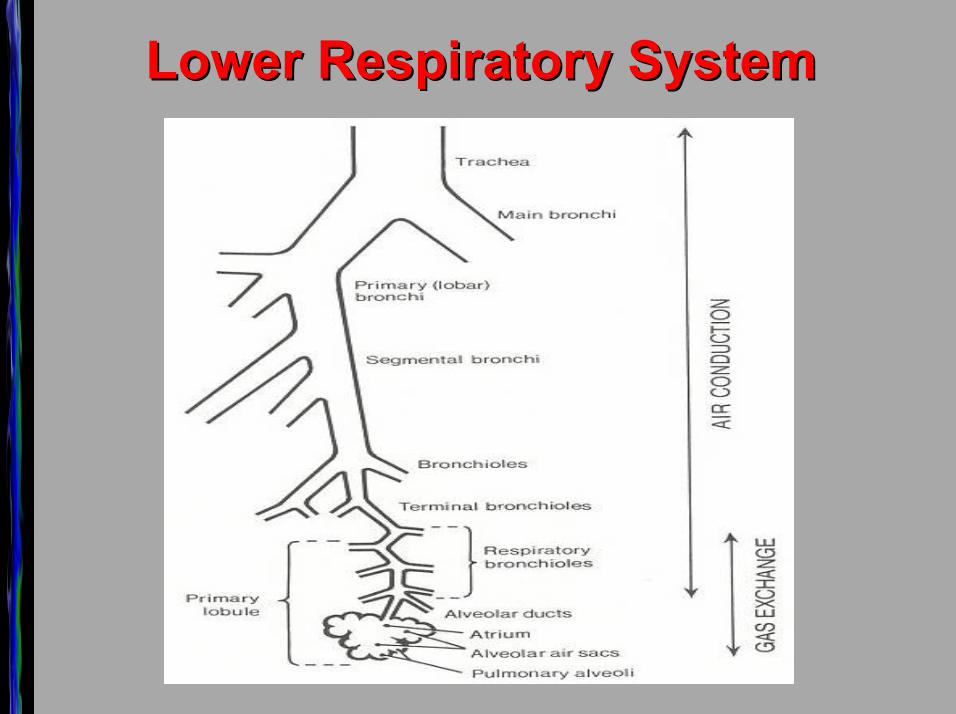
Lower Respiratory SystemLower Respiratory System
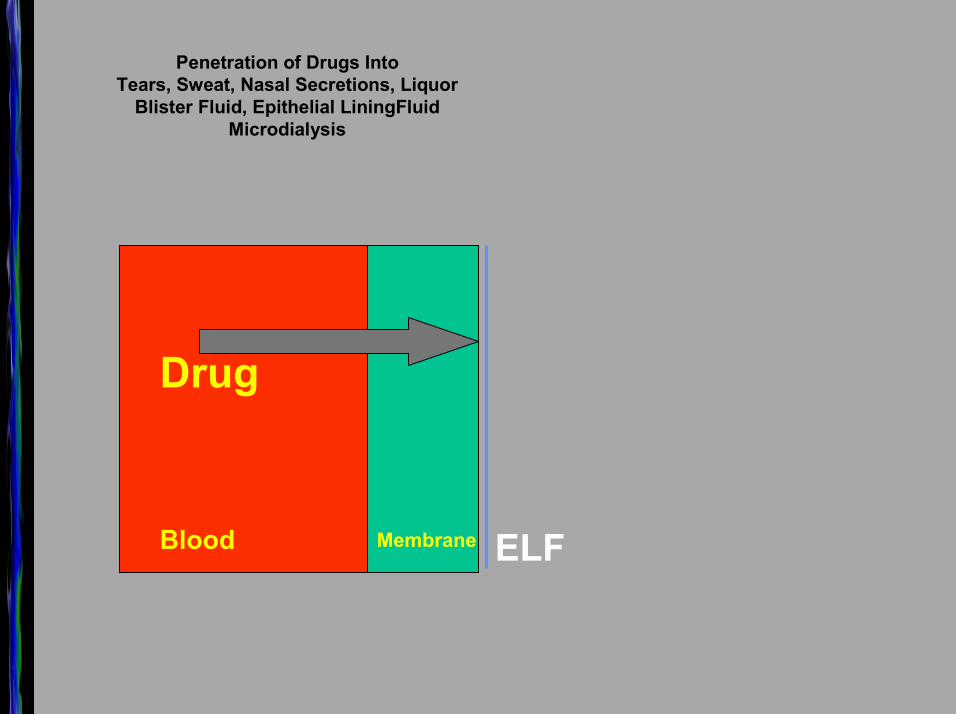
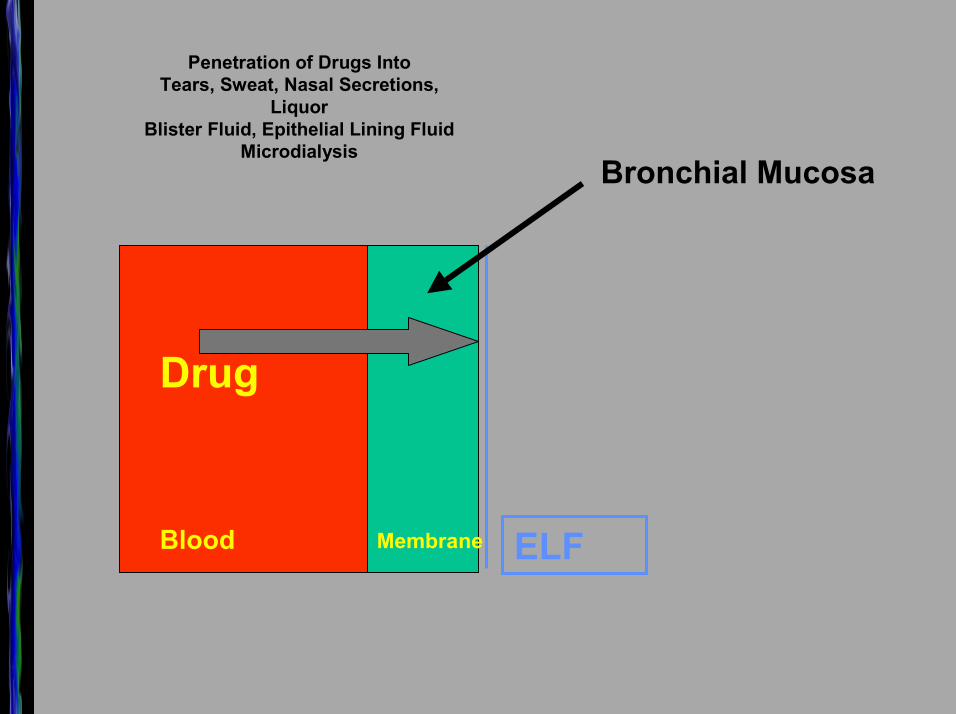
Penetration of Drugs Into Tears, Sweat, Nasal Secretions, Liquor
Blister Fluid, Epithelial LiningFluid Microdialysis
Blood Membrane
Drug
ELF
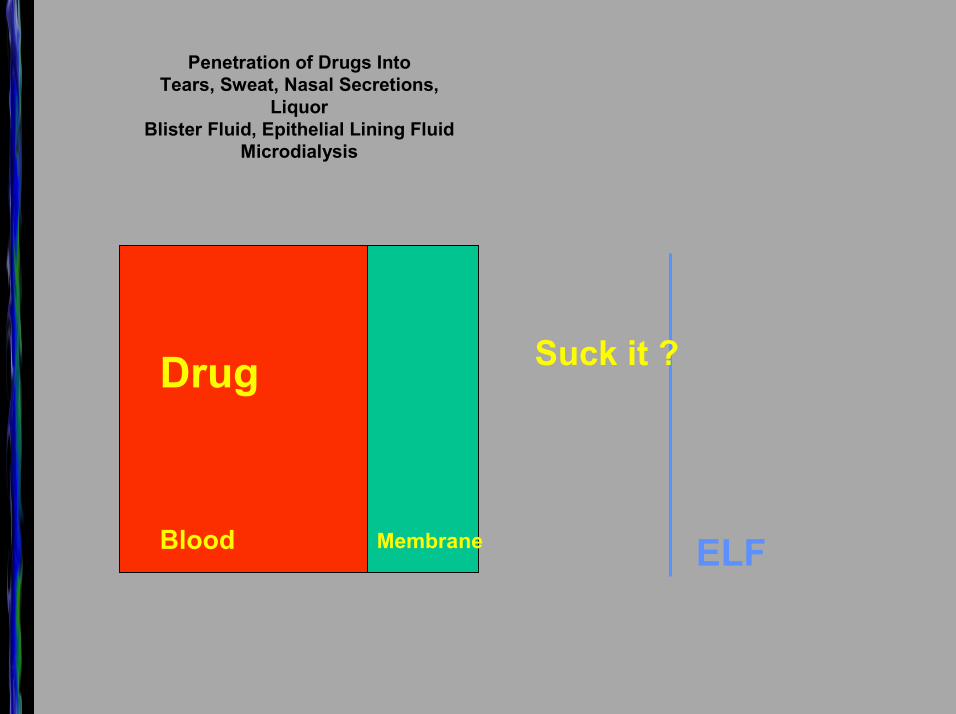
Penetration of Drugs Into Tears, Sweat, Nasal Secretions,
LiquorBlister Fluid, Epithelial Lining Fluid
Microdialysis
Blood Membrane
Drug
ELF
Bronchial Mucosa
Penetration of Drugs Into Tears, Sweat, Nasal Secretions,
LiquorBlister Fluid, Epithelial Lining Fluid
Microdialysis
Blood Membrane
Drug
ELF
Suck it ?
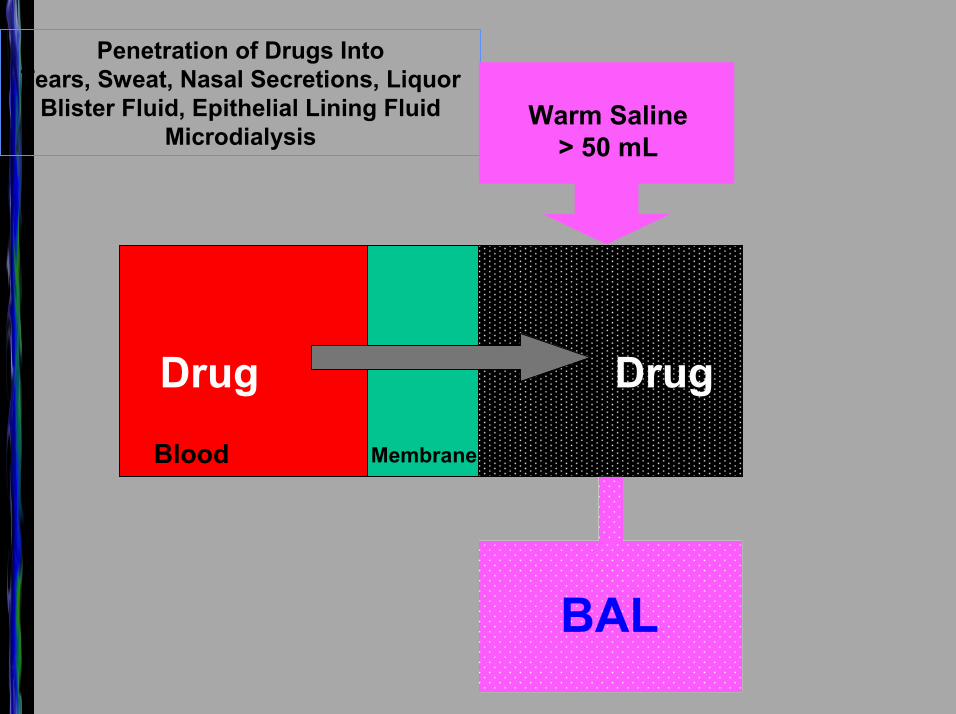
Penetration of Drugs Into Tears, Sweat, Nasal Secretions, Liquor
Blister Fluid, Epithelial Lining FluidMicrodialysis
Blood Membrane
Drug Drug
Warm Saline> 50 mL
BAL
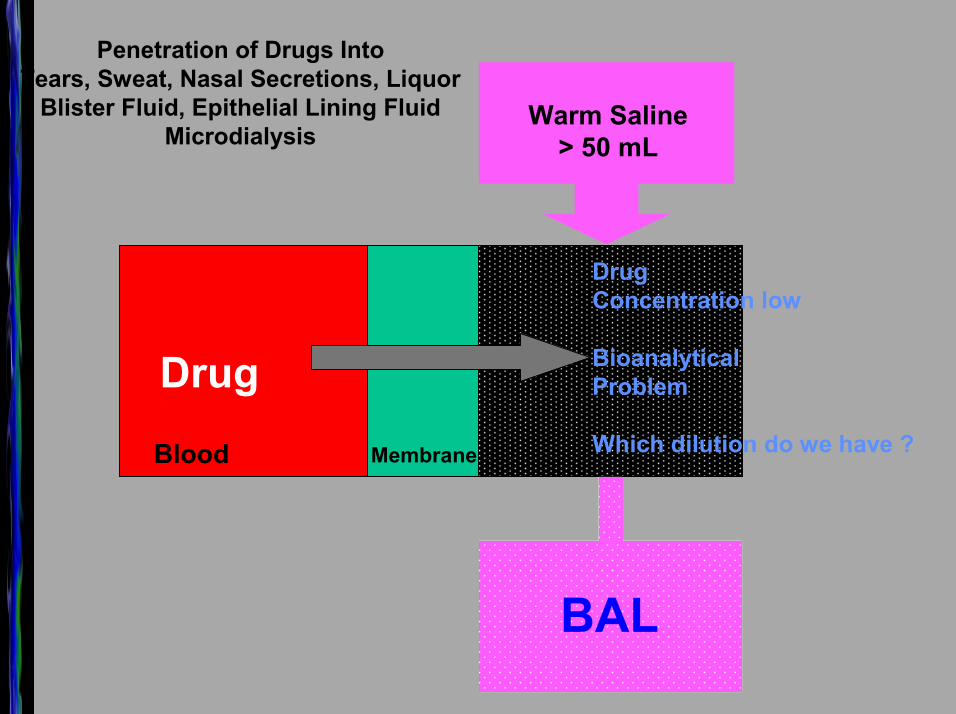
Penetration of Drugs Into Tears, Sweat, Nasal Secretions, Liquor
Blister Fluid, Epithelial Lining FluidMicrodialysis
Blood Membrane
Drug
DrugConcentration low
BioanalyticalProblem
Which dilution do we have ?
Warm Saline> 50 mL
BAL
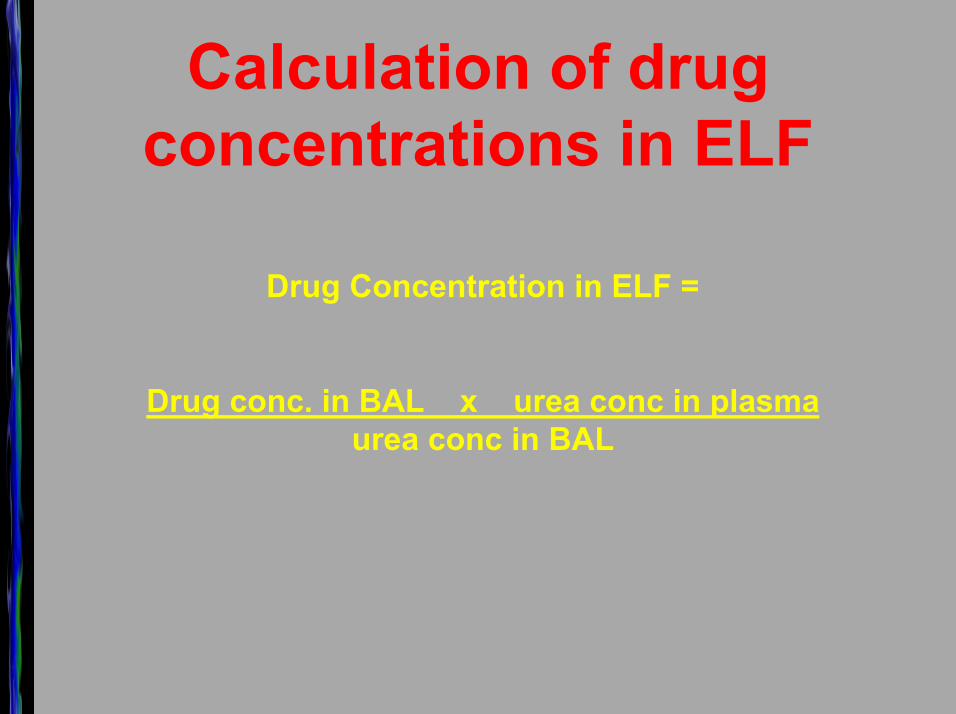
Calculation of drug concentrations in ELF
Drug Concentration in ELF =
Drug conc. in BAL x urea conc in plasmaurea conc in BAL
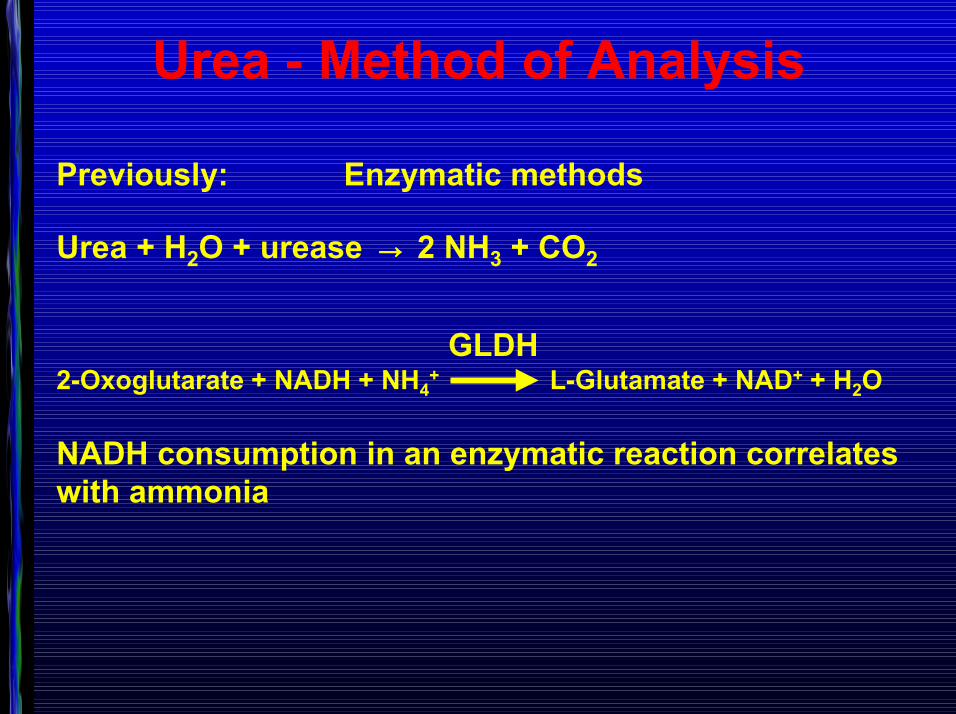
Urea - Method of Analysis
Previously: Enzymatic methods
Urea + H2O + urease →→→→ 2 NH3 + CO2
GLDH2-Oxoglutarate + NADH + NH4
+ L-Glutamate + NAD+ + H2O
NADH consumption in an enzymatic reaction correlates with ammonia
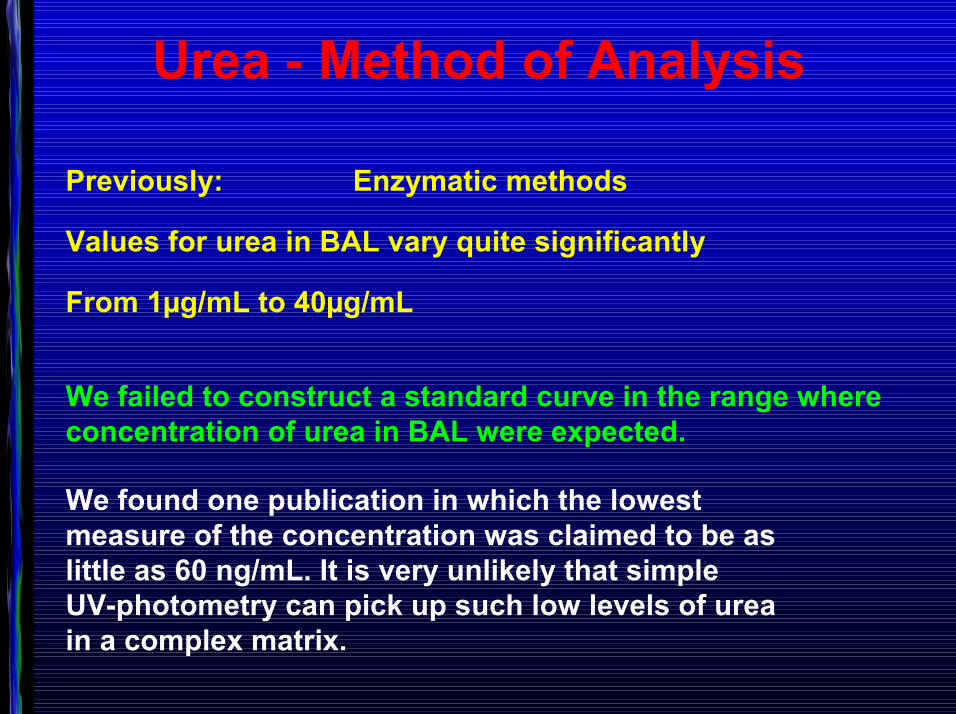
Previously: Enzymatic methods
Values for urea in BAL vary quite significantly
From 1µg/mL to 40µg/mL
We failed to construct a standard curve in the range where concentration of urea in BAL were expected.
We found one publication in which the lowest measure of the concentration was claimed to be as little as 60 ng/mL. It is very unlikely that simple UV-photometry can pick up such low levels of urea in a complex matrix.
Urea - Method of Analysis
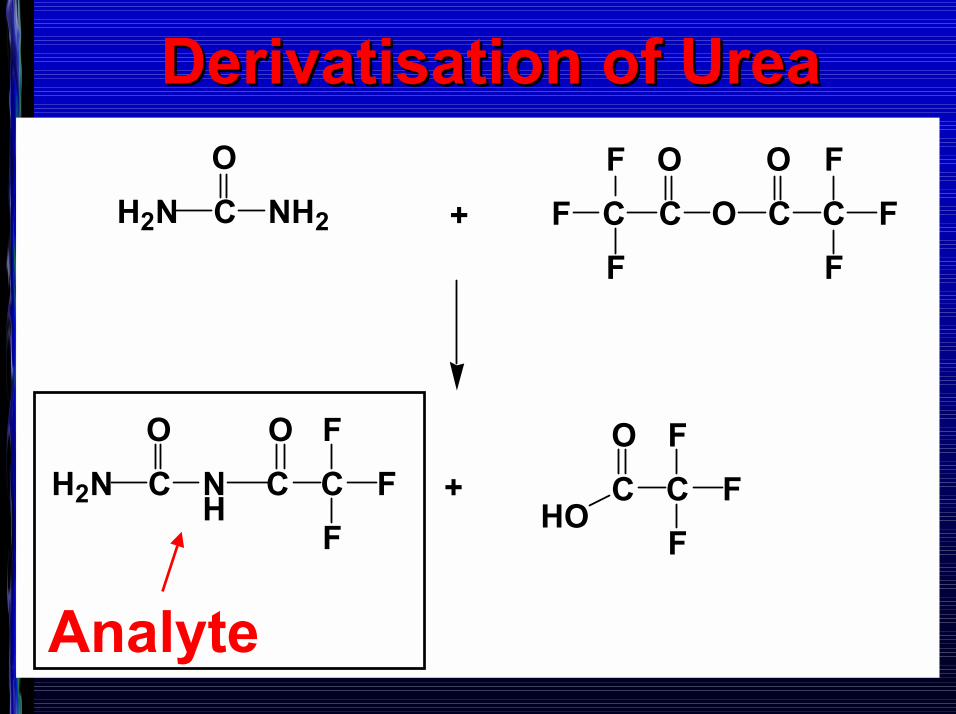
DerivatisationDerivatisation of Ureaof Urea
C NH2
OH2N + C C O C C
FF
F
OOFF
F
C N H
OH2N C C
FF
F
O
C CF
FF
O
HO+
Analyte
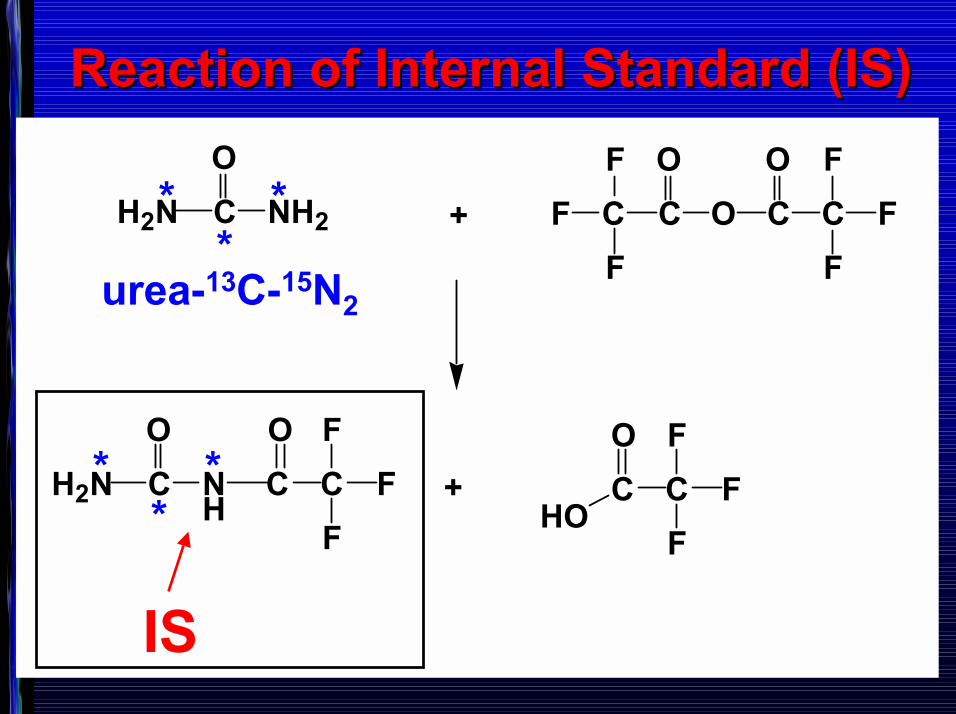
Reaction of Internal Standard (IS)Reaction of Internal Standard (IS)
C NH2
OH2N + C C O C C
FF
F
OOFF
F
C N H
OH2N C C
FF
F
O
C CF
FF
O
HO+
IS
***
***
urea-13C-15N2
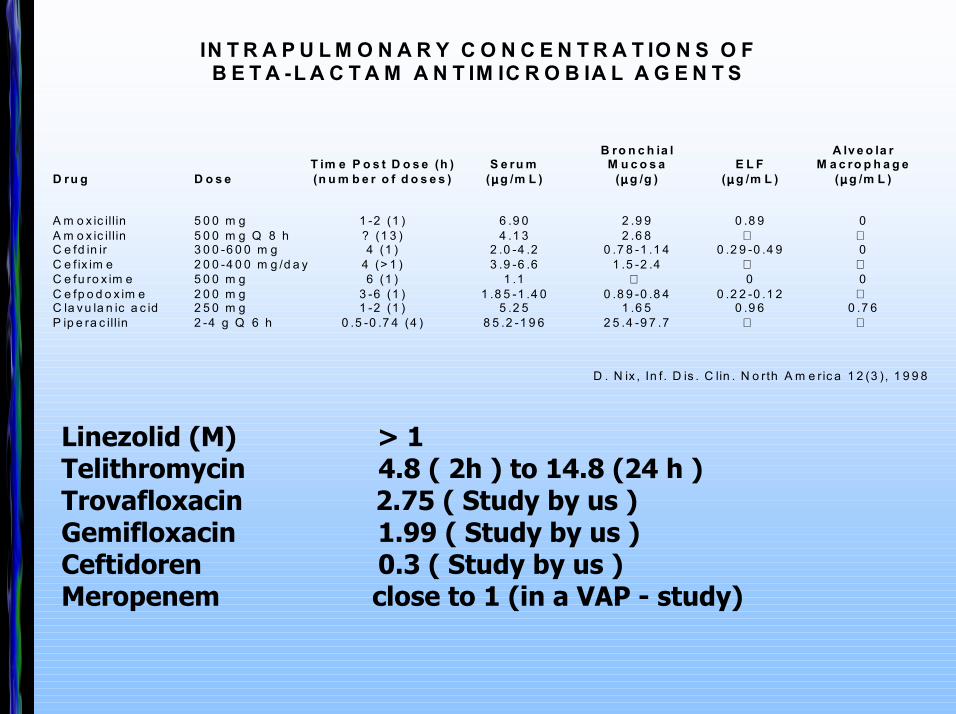
IN T R A P U L M O N A R Y C O N C E N T R A T IO N S O F B E T A -L A C T A M A N T IM IC R O B IA L A G E N T S
B ro n c h ia l A lv e o la r T im e P o s t D o s e (h ) S e ru m M u c o s a E L F M a c ro p h a g e D ru g D o s e (n u m b e r o f d o s e s ) (µµµµ g /m L ) (µµµµ g /g ) (µµµµ g /m L ) (µµµµ g /m L ) A m o x ic illin 5 0 0 m g 1 -2 (1 ) 6 .9 0 2 .9 9 0 .8 9 0 A m o x ic illin 5 0 0 m g Q 8 h ? (1 3 ) 4 .1 3 2 .6 8 C e fd in ir 3 0 0 -6 0 0 m g 4 (1 ) 2 .0 -4 .2 0 .7 8 -1 .1 4 0 .2 9 -0 .4 9 0
C e f ix im e 2 0 0 -4 0 0 m g /d a y 4 (> 1 ) 3 .9 -6 .6 1 .5 -2 .4 C e fu ro x im e 5 0 0 m g 6 (1 ) 1 .1 0 0 C e fp o d o x im e 2 0 0 m g 3 -6 (1 ) 1 .8 5 -1 .4 0 0 .8 9 -0 .8 4 0 .2 2 -0 .1 2 C la v u la n ic a c id 2 5 0 m g 1 -2 (1 ) 5 .2 5 1 .6 5 0 .9 6 0 .7 6 P ip e ra c illin 2 -4 g Q 6 h 0 .5 -0 .7 4 (4 ) 8 5 .2 -1 9 6 2 5 .4 -9 7 .7
D . N ix , In f . D is . C lin . N o rth A m e ric a 1 2 (3 ), 1 9 9 8
Linezolid (M) > 1Telithromycin 4.8 ( 2h ) to 14.8 (24 h ) Trovafloxacin 2.75 ( Study by us )Gemifloxacin 1.99 ( Study by us )Ceftidoren 0.3 ( Study by us )Meropenem close to 1 (in a VAP - study)
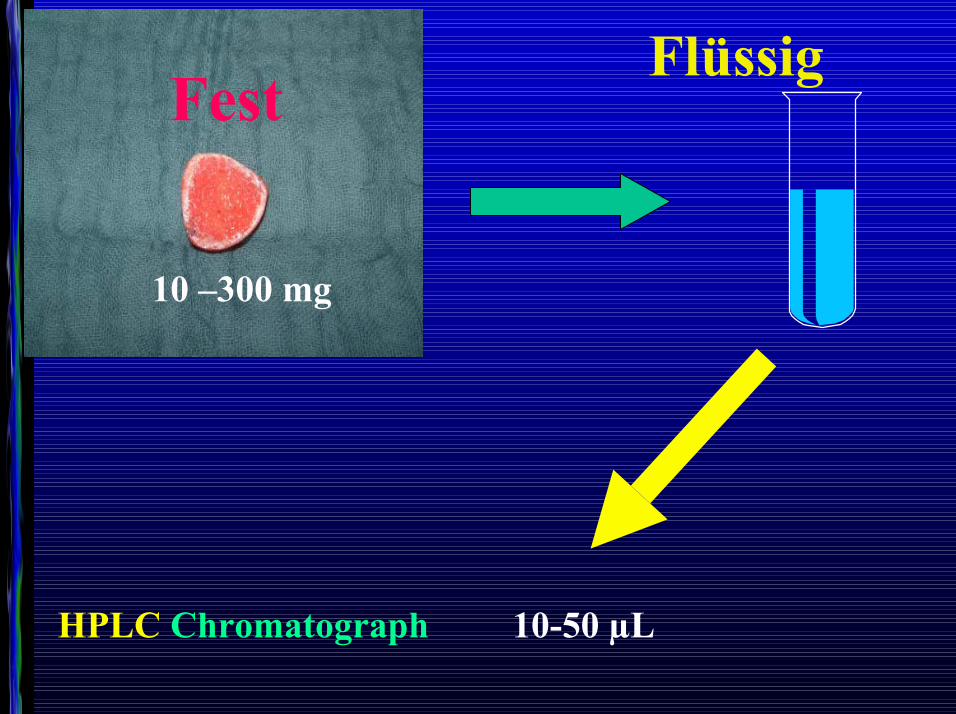
FlüssigFest
HPLC Chromatograph 10-50 µL
10 �300 mg
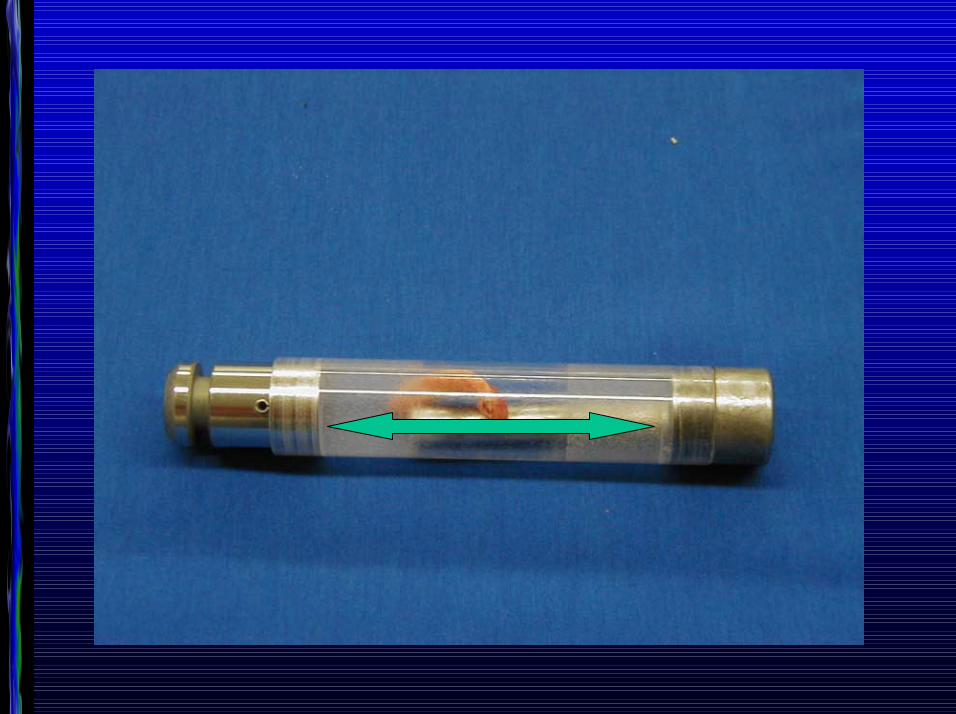
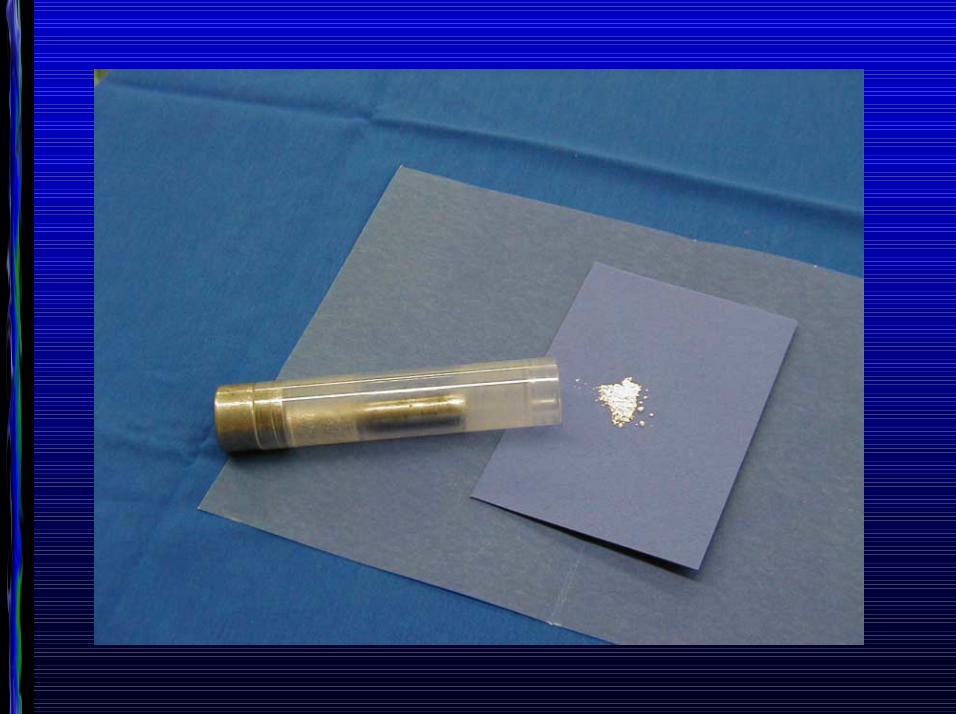
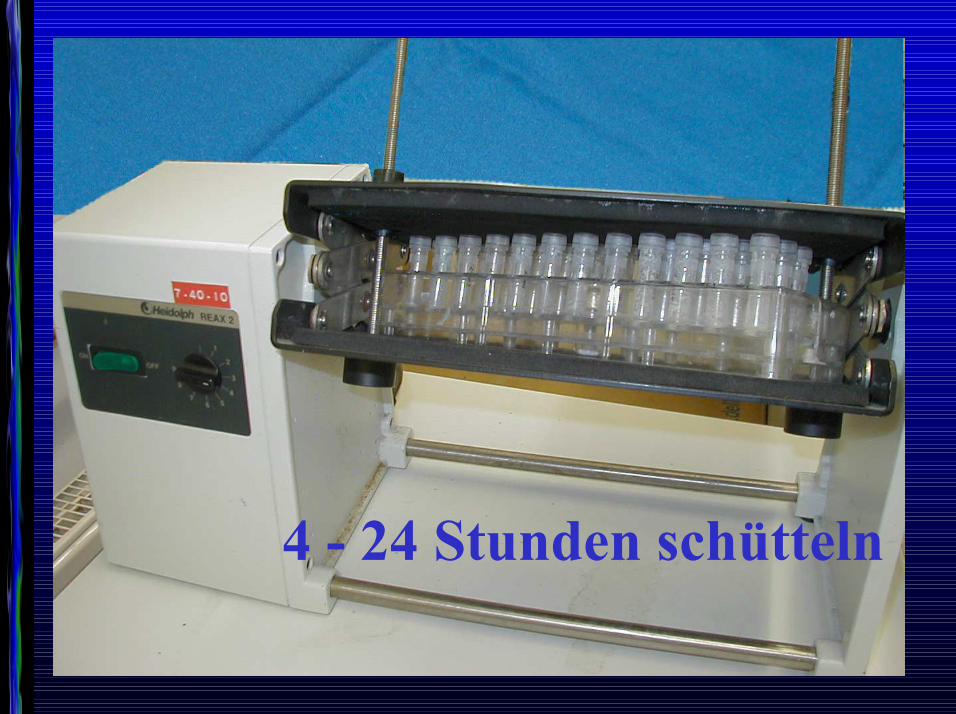
4 - 24 Stunden schütteln
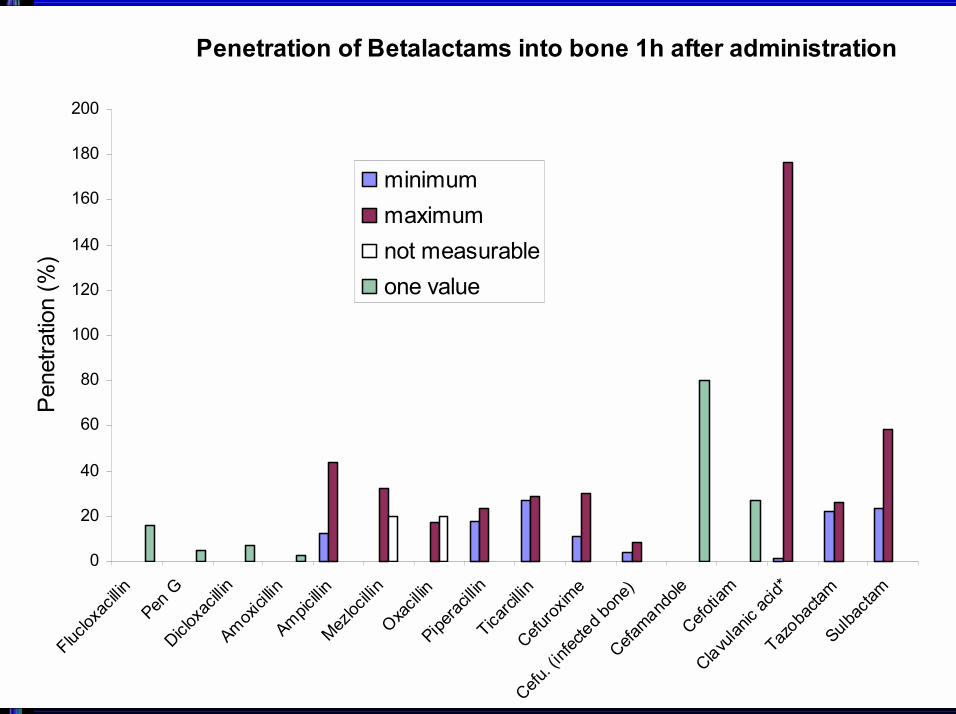
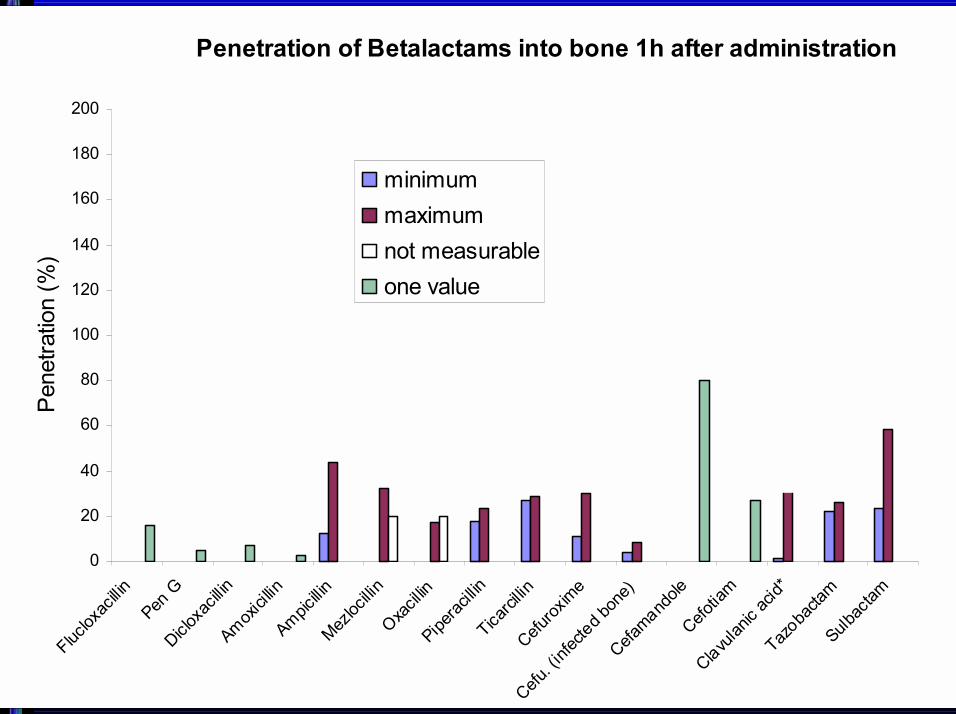
Penetration of Betalactams into bone 1h after administration
0
20
40
60
80
100
120
140
160
180
200
Fluclox
acillin
Pen G
Dicloxa
cillin
Amoxici
llinAmpic
illinMez
locillin
Oxacil
linPipe
racillin
Ticarci
llinCefu
roxim
e
Cefu. (i
nfecte
d bon
e)Cefa
mandole
Cefo
tiam
Clavulan
ic ac
id*Taz
obacta
mSulb
actam
Pen
etra
tion
(%)
minimummaximumnot measurableone value

Umfrage
0
20
40
60
80
100
120
1
[% ]
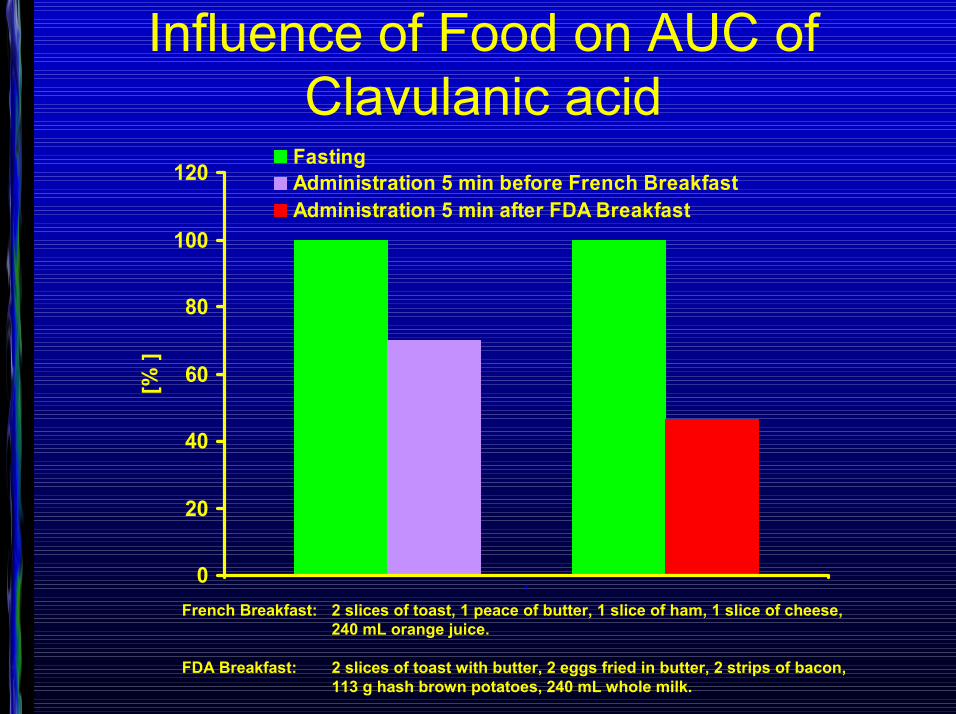
FastingAdministration 5 min before French BreakfastAdministration 5 min after FDA Breakfast
French Breakfast: 2 slices of toast, 1 peace of butter, 1 slice of ham, 1 slice of cheese, 240 mL orange juice.
FDA Breakfast: 2 slices of toast with butter, 2 eggs fried in butter, 2 strips of bacon, 113 g hash brown potatoes, 240 mL whole milk.
Influence of Food on AUC of Clavulanic acid
Individualisierung der AntibiotikatherapieIndividualisierung der AntibiotikatherapieIndividualisierung der AntibiotikatherapieIndividualisierung der AntibiotikatherapieOderOderOderOder
ONE SIZE FITS ALL ?ONE SIZE FITS ALL ?ONE SIZE FITS ALL ?ONE SIZE FITS ALL ?
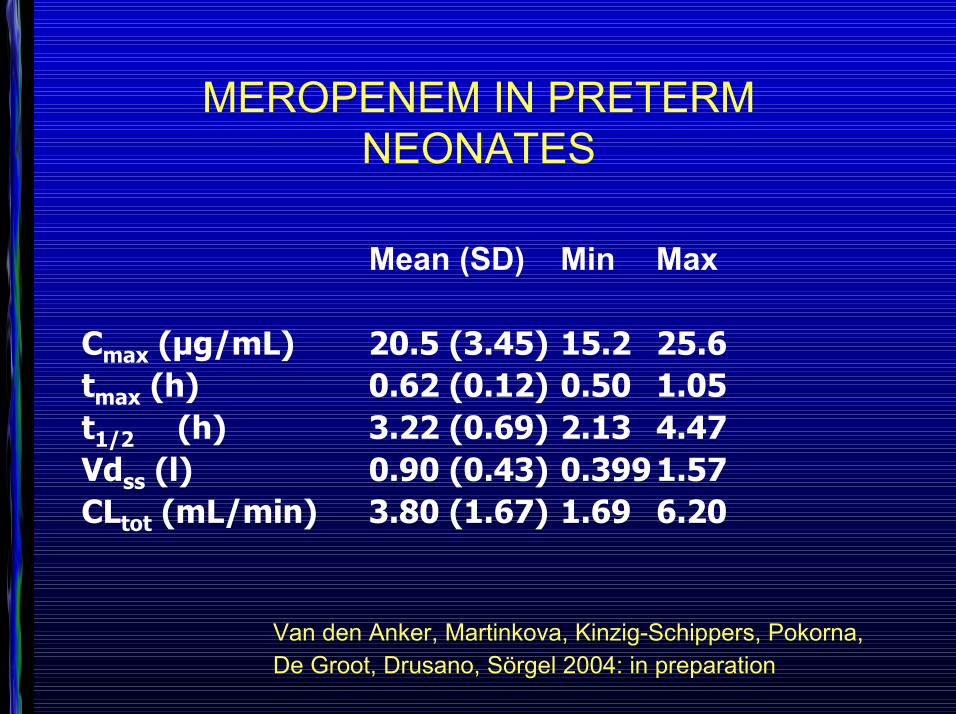
MEROPENEM IN PRETERM NEONATES
Mean (SD) Min Max
Cmax (µg/mL) 20.5 (3.45) 15.2 25.6tmax (h) 0.62 (0.12) 0.50 1.05t1/2 (h) 3.22 (0.69) 2.13 4.47Vdss (l) 0.90 (0.43) 0.3991.57CLtot (mL/min) 3.80 (1.67) 1.69 6.20
Van den Anker, Martinkova, Kinzig-Schippers, Pokorna, De Groot, Drusano, Sörgel 2004: in preparation
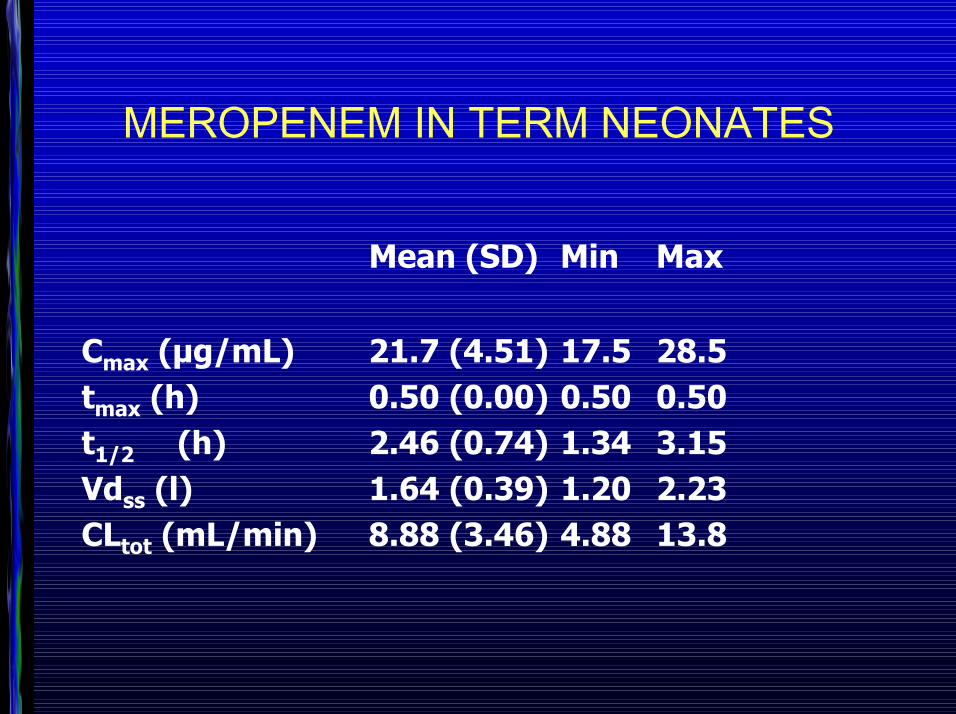
MEROPENEM IN TERM NEONATES
Mean (SD) Min Max
Cmax (µg/mL) 21.7 (4.51) 17.5 28.5tmax (h) 0.50 (0.00) 0.50 0.50t1/2 (h) 2.46 (0.74) 1.34 3.15Vdss (l) 1.64 (0.39) 1.20 2.23CLtot (mL/min) 8.88 (3.46) 4.88 13.8


