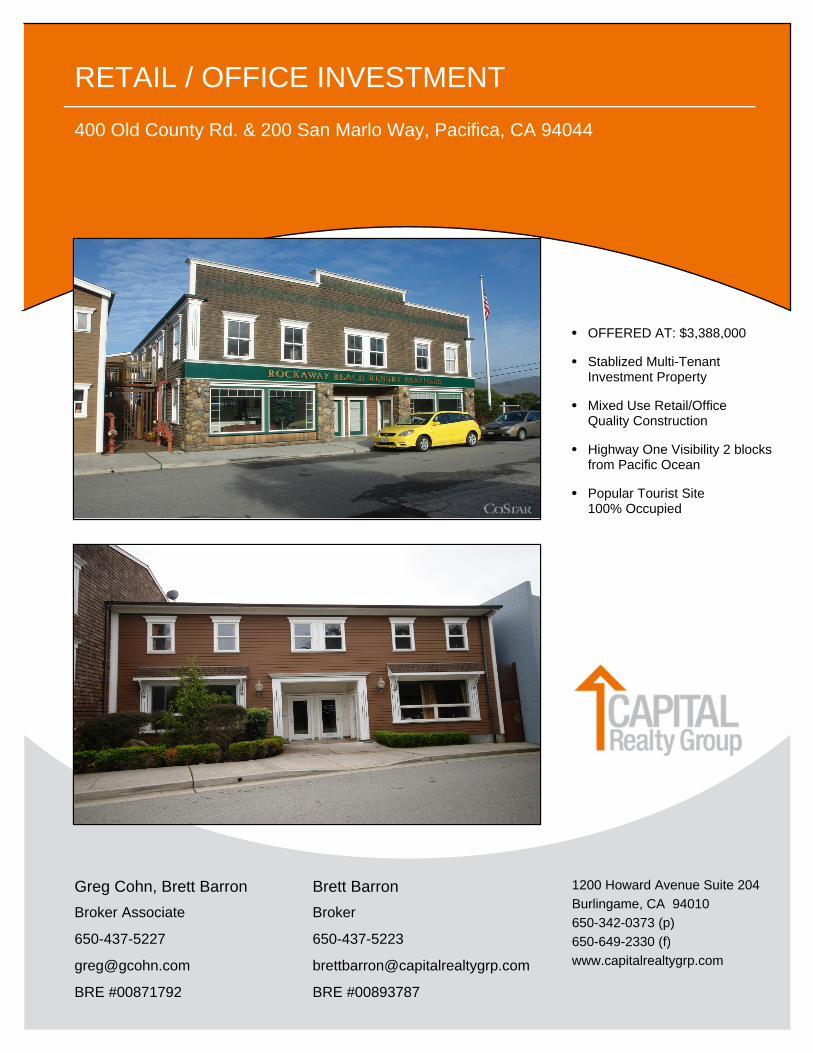
RETAIL / OFFICE INVESTMENT
400 Old County Rd. & 200 San Marlo Way, Pacifica, CA 94044
Greg Cohn, Brett Barron
Broker Associate
650-437-5227
BRE #00871792
Brett Barron
Broker
650-437-5223
BRE #00893787
1200 Howard Avenue Suite 204Burlingame, CA 94010650-342-0373 (p)650-649-2330 (f)www.capitalrealtygrp.com
OFFERED AT: $3,388,000●
Stablized Multi-TenantInvestment Property
●
Mixed Use Retail/OfficeQuality Construction
●
Highway One Visibility 2 blocksfrom Pacific Ocean
●
Popular Tourist Site100% Occupied
●
Property DetailsRETAIL / OFFICE INVESTMENT400 Old County Rd. & 200 San Marlo WayPacifica, CA 94044
Property DescriptionRETAIL / OFFICE INVESTMENT
400 Old County Rd. & 200 San Marlo WayPacifica, CA 94044
Greg Cohn, Brett Barron650-437-5227
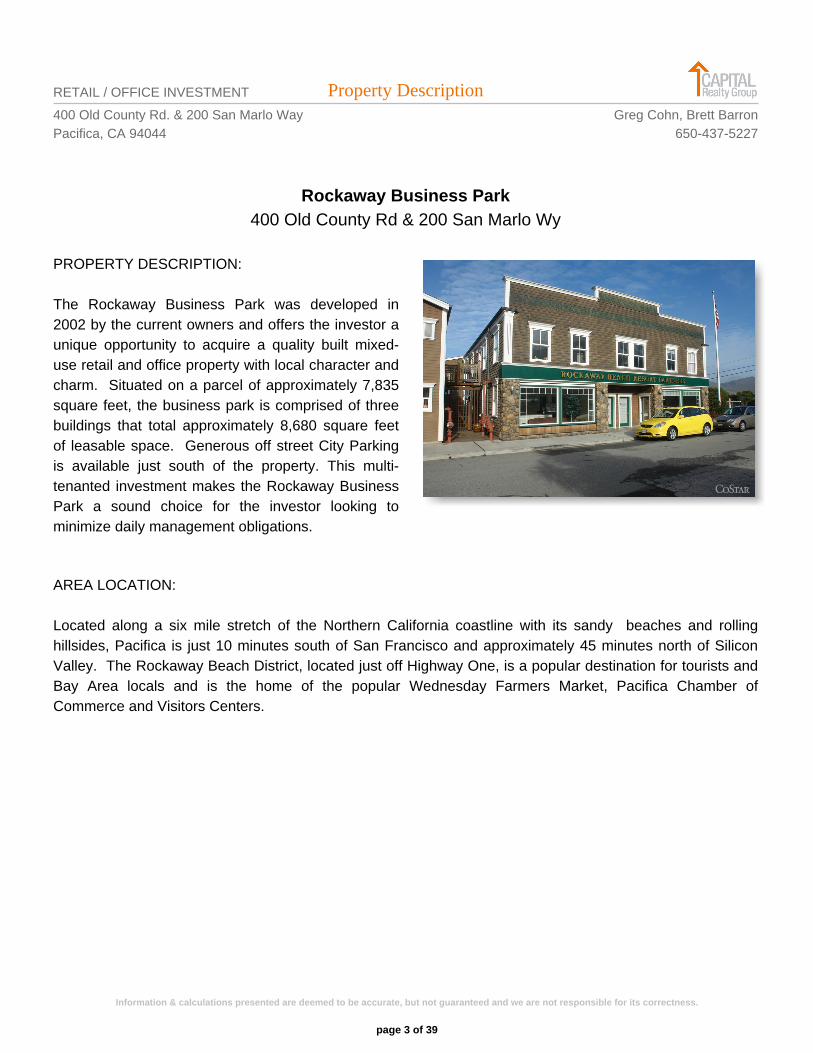
Rockaway Business Park400 Old County Rd & 200 San Marlo Wy
PROPERTY DESCRIPTION:
The Rockaway Business Park was developed in2002 by the current owners and offers the investor aunique opportunity to acquire a quality built mixed-use retail and office property with local character andcharm. Situated on a parcel of approximately 7,835square feet, the business park is comprised of threebuildings that total approximately 8,680 square feetof leasable space. Generous off street City Parkingis available just south of the property. This multi-tenanted investment makes the Rockaway BusinessPark a sound choice for the investor looking tominimize daily management obligations.
AREA LOCATION:
Located along a six mile stretch of the Northern California coastline with its sandy beaches and rollinghillsides, Pacifica is just 10 minutes south of San Francisco and approximately 45 minutes north of SiliconValley. The Rockaway Beach District, located just off Highway One, is a popular destination for tourists andBay Area locals and is the home of the popular Wednesday Farmers Market, Pacifica Chamber ofCommerce and Visitors Centers.
page 3 of 39
Information & calculations presented are deemed to be accurate, but not guaranteed and we are not responsible for its correctness.
ExecutiveSummary
Client:RockawayBusinessParkLLC
PropertyLocation:400OldCountyRoad
Pacifica,CA94044
PropertyType:Office/RetailBuilding(MultiStory)
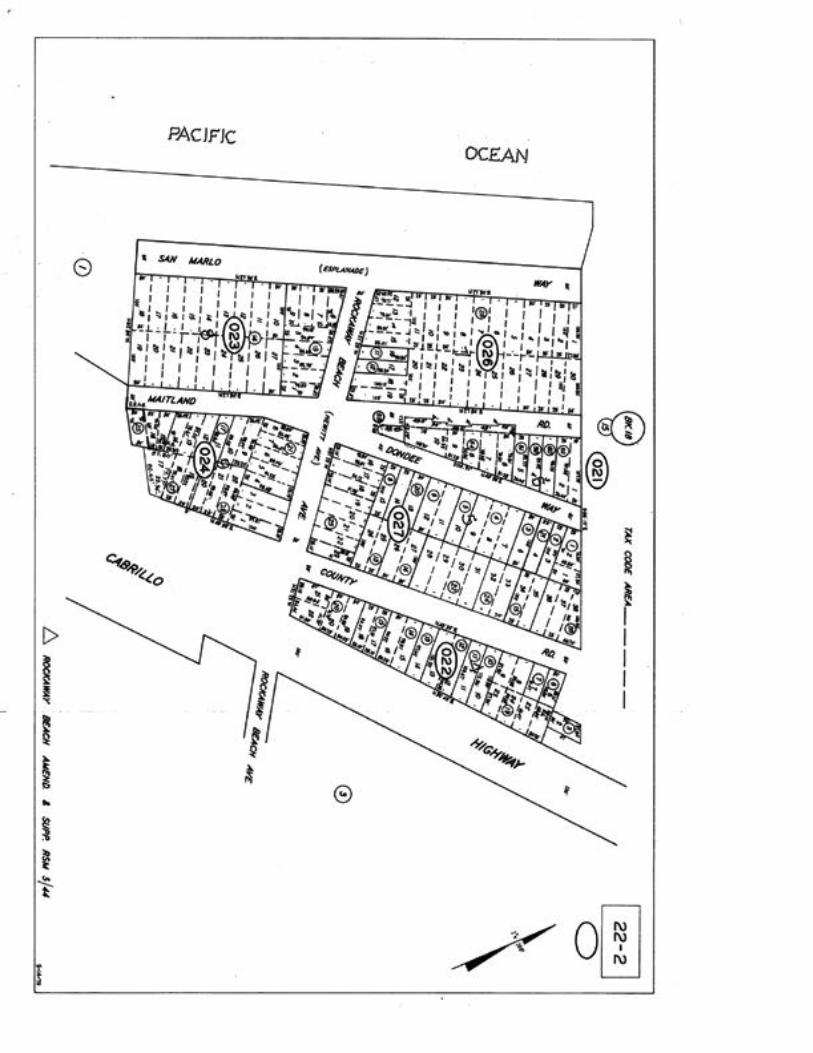
AssessorsParcelNumber:022‐027‐260
Zoning:C1‐CZ(NeighborhoodCommercial‐CoastalZone)
PresentUse:Office/Retail
BuildingSize:Approximately8,680sq.ft.
LandArea:Approximately7,835sq.ft.
InterestAppraised:FeeSimple
AssessedValue:$1,428,518
AssessedImprovedValue:$1,181,472
AssessedLandValue:$247,046
TaxYear:2014‐15
TaxAmount:$19,100.52
AssessedImproved%:82.71%

or warranties as to the accuracy or completeness of information contained in this report.Information compiled from various sources. CoreLogic makes no representations
******************************************************************************************** 3. 6. ** 2. 5. 8. ** 1. 4. 7. ** ======= EXTRA FEATURES ====== ** ** Other Rms: ** Recreatn : AvgStrHgt : ** BsmtUnfSF: Bldg Type : Waterfront : ** BsmtFinSF: Elevator : MH Wid X Len : ** Bsmt SqFt: Security : MH Make : ** Fireplace: GrbgDisposal: Intercom : ** Heat Srce: Microwave : Fire Sprnklrs : ** Heat Type: Range/Oven : Tennis Court : ** AirMethod: Dishwasher : Sewer/Septic : ** Units : Deck : Lot Location : ** BsmntType: Patio : Topography : ** FrmlEntry: Pool : Quality Class : ** Attic : Foundation : Improve Type : ** Den : Flr Cover2 : View : ** Util Room: Flr Cover1 : Unit Type : ** BrkfastRm: Roof Matl : Garage Sq Ft : ** Kitchen : Bldg Matl : Garage Type : ** Lvng Room: Bldg Style : Garage Space : ** FamilyRms: Bldg Cond : Carport : ** DiningRms: Eff Yr Built: Useable Lot SF : ** Bathrooms: Year Built : Lot Dimension : ** Bedrooms : Bldg Sq Ft : Lot SqFt : ** Total Rms: Stories : Lot Acres : ** ======= PROPERTY CHARACTERISTICS ======= ** ** : ** : ** Legal : ** Subplat : ** Land Use : ** Zoning : ** Property Use: ** Census :Tract: Block: ** Map Grid : ** MLS Area : ** ======= PROPERTY DESCRIPTION ======= ** ** % Improved : ** Total : Taxes : ** Other : Tax Rate Area : ** Structure : Exempt Amount : ** Land : Exempt Type : ** ======= ASSESSMENT AND TAX INFORMATION ======= ** ** % Owned : Vesting Type : ** Deed Type : Interest Rate : ** Sale Price : Loan Type : ** Document # : Lender : ** Transferred : Loan Amount : ** ======= SALES AND LOAN INFORMATION ======= ** ** Owner Phone : ** Mail Address : ** Site Address : ** CoOwner : ** Owner : ** Parcel Number : ** ======= OWNERSHIP INFORMATION ======= ********************************************************************************************
= M E T R O S C A N P R O P E R T Y P R O F I L E =San Mateo (CA)
022 027 260Rockaway Business Park LLC
400 Old County Rd Pacifica 94044274 Redwood Shores Pkwy #539 Redwood City Ca 94065
$247,046$1,181,472
016021$19,101.5214-15$1,428,518
83
655
46032.00
18 Com,Office Building,2+ StoriesRockaway BeachLOTS 36, 37, 38 BLK 5 ROCKAWAYBEACH AMEND & SUPP RSM 5/45
.1827,8358,680
2002
Good
6
12.0
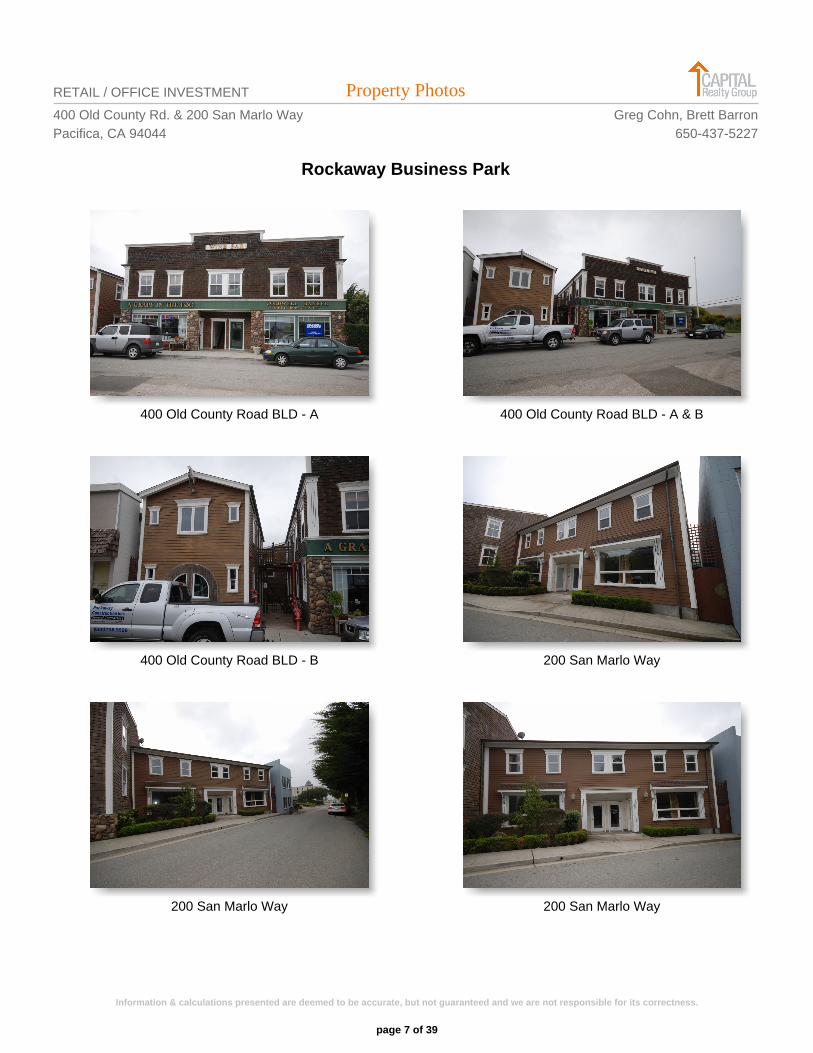
Property PhotosRETAIL / OFFICE INVESTMENT
400 Old County Rd. & 200 San Marlo WayPacifica, CA 94044
Greg Cohn, Brett Barron650-437-5227
Rockaway Business Park
400 Old County Road BLD - A 400 Old County Road BLD - A & B
400 Old County Road BLD - B 200 San Marlo Way
200 San Marlo Way 200 San Marlo Way
page 7 of 39
Information & calculations presented are deemed to be accurate, but not guaranteed and we are not responsible for its correctness.
Maps and AerialsRETAIL / OFFICE INVESTMENT
400 Old County Rd. & 200 San Marlo WayPacifica, CA 94044
Greg Cohn, Brett Barron650-437-5227
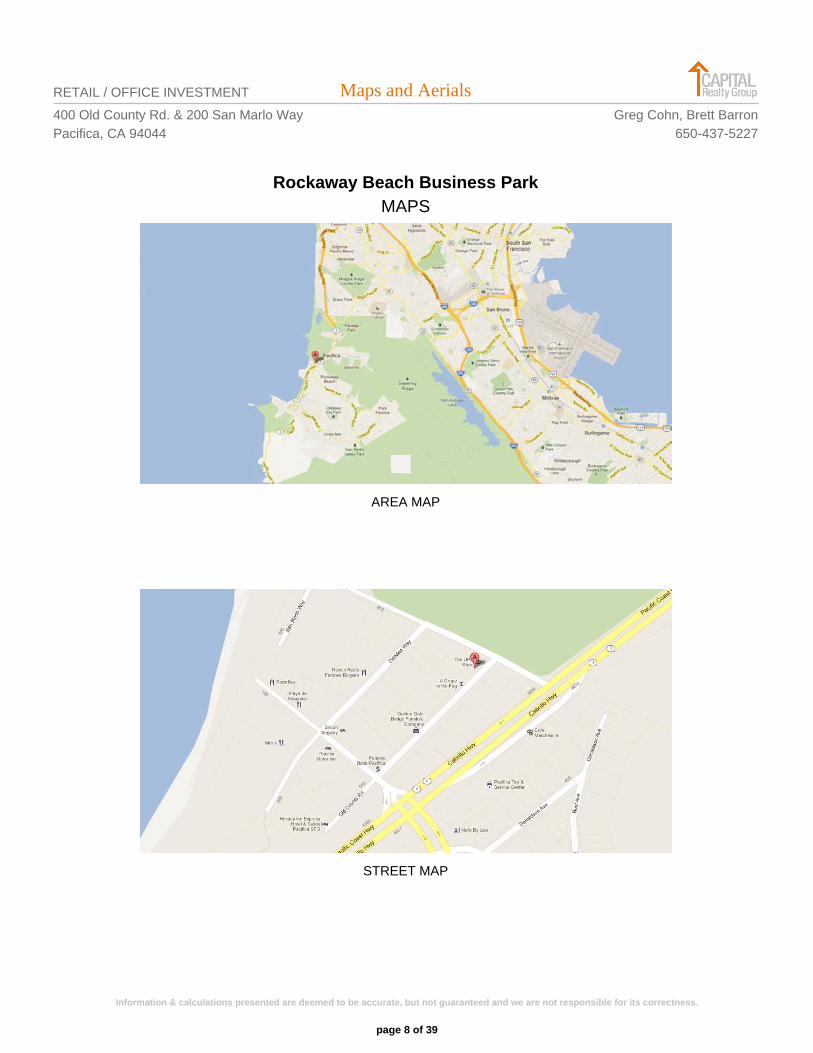
Rockaway Beach Business ParkMAPS
AREA MAP
STREET MAP
page 8 of 39
Information & calculations presented are deemed to be accurate, but not guaranteed and we are not responsible for its correctness.
Maps and AerialsRETAIL / OFFICE INVESTMENT
400 Old County Rd. & 200 San Marlo WayPacifica, CA 94044
Greg Cohn, Brett Barron650-437-5227
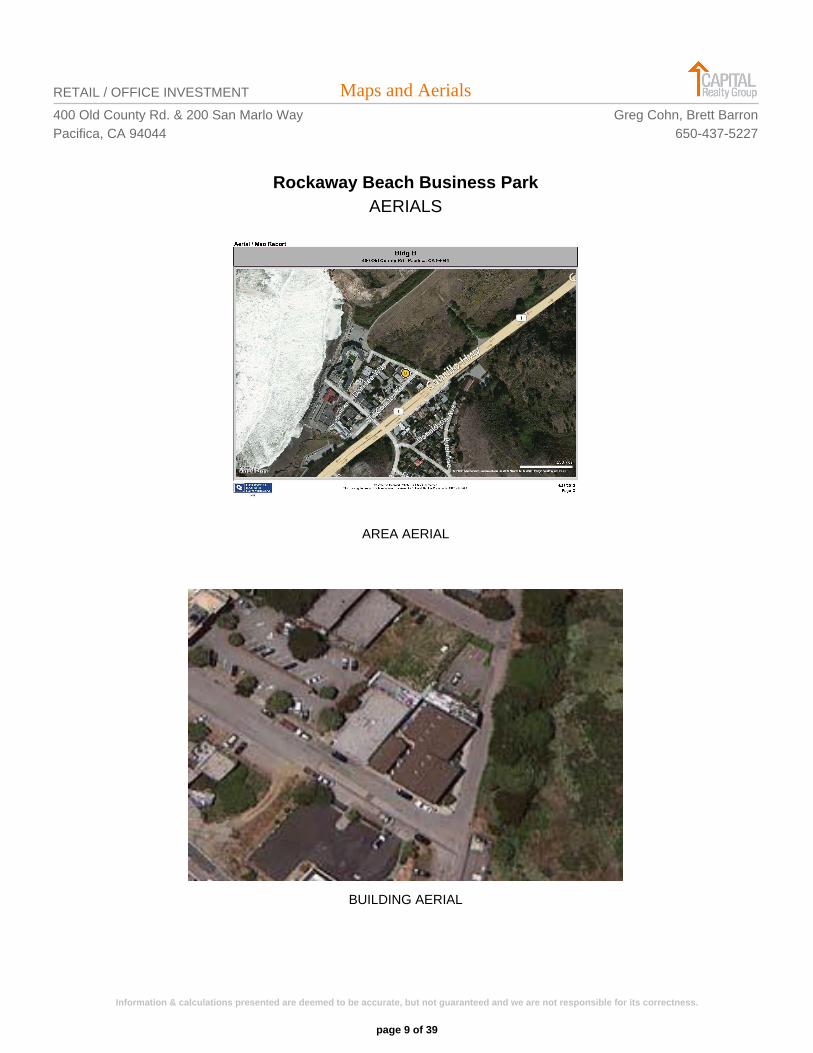
Rockaway Beach Business ParkAERIALS
AREA AERIAL
BUILDING AERIAL
page 9 of 39
Information & calculations presented are deemed to be accurate, but not guaranteed and we are not responsible for its correctness.

Property FinancialsRETAIL / OFFICE INVESTMENT400 Old County Rd. & 200 San Marlo WayPacifica, CA 94044

Executive SummaryRETAIL / OFFICE INVESTMENT
400 Old County Rd. & 200 San Marlo WayPacifica, CA 94044
Greg Cohn, Brett Barron650-437-5227
ACQUISITION COSTS
Purchase Price, Points and Closing Costs $3,414,940
Investment - Cash $1,720,940
First Loan $1,694,000
INVESTMENT INFORMATION
Purchase Price $3,388,000
Price per Tenant $308,000
Price per Sq. Ft. $390.32
INCOME, EXPENSES & CASH FLOW
Gross Scheduled Income $197,067
Total Vacancy and Credits ($5,912)
Operating Expenses ($72,438)
Net Operating Income $118,717
Debt Service ($112,990)
Cash Flow Before Taxes $5,728
Total Interest (Debt Service) ($75,462)
Depreciation and Amortization ($84,166)
Taxable Income (Loss) ($40,911)
Tax Savings (Costs) $15,546
Cash Flow After Taxes $21,274
FINANCIAL INDICATORS
Cash on Cash Return Before Taxes 0.33%
Optimal Internal Rate of Return (yr 5) 2.49%
Debt Coverage Ratio 1.05
Capitalization Rate 3.50%
Gross Income / Square Feet $22.70
Gross Expenses / Square Feet ($8.35)
Operating Expense Ratio 37.89%
page 11 of 39
Information & calculations presented are deemed to be accurate, but not guaranteed and we are not responsible for its correctness.
Pro Forma SummaryRETAIL / OFFICE INVESTMENT
400 Old County Rd. & 200 San Marlo WayPacifica, CA 94044
Greg Cohn, Brett Barron650-437-5227
TENANT ANNUAL SCHEDULED INCOME
Tenant Actual Market
TOTALS $195,131 $235,800
ANNUALIZED INCOMEActual Market
Gross Potential Rent $195,131 $235,800
Less: Vacancy ($5,912) ($7,074)
Effective Gross Income $189,219 $228,726
Less: Expenses ($72,438) ($72,438)
Net Operating Income $116,781 $156,288
Debt Service ($112,990) ($112,990)
Net Cash Flow after Debt Service $3,792 $43,298
Principal Reduction $37,527 $37,527
Total Return $41,319 $80,826
ANNUALIZED EXPENSES
Actual MarketBuilding Insurance $3,393 $3,393
Janitorial $736 $736
Landscaping $1,360 $1,360
Leasing Fees $9,192 $9,192
Misc $100 $100
Licenses & Fees $296 $296
Repairs & Maintenance $5,795 $5,795
Management Fees $8,690 $8,690
Security $942 $942
Supplies $1,932 $1,932
Taxes - Real Estate (1.13%) $33,900 $33,900
Telephone $939 $939
Utility - PGE $1,089 $1,089
Utility - Sewer $2,384 $2,384
Utility - Water $1,691 $1,691
Total Expenses $72,438 $72,438
Expenses Per RSF $8.35 $8.35
*Expenses per 2014 actual, except property taxes at 1.13% value + vacancy factor of 3%.
INVESTMENT SUMMARY
Price: $3,388,000
Year Built: 2002
Tenants: 11
RSF: 8,680
Price/RSF: $390.32
Lot Size: 7,835 sf
Floors: 2
APN: 022-027-260
Cap Rate: 3.45%
Market Cap Rate: 4.61%
FINANCING SUMMARY
Loan Amount: $1,694,000
Down Payment: $1,694,000
Loan Type: Fixed
Interest Rate: 4.5%
Term: 25 years
Monthly Payment: $9,416
DCR: 1.03
page 12 of 39
Information & calculations presented are deemed to be accurate, but not guaranteed and we are not responsible for its correctness.
Tenant Mix ReportRETAIL / OFFICE INVESTMENT
400 Old County Rd. & 200 San Marlo WayPacifica, CA 94044
Greg Cohn, Brett Barron650-437-5227
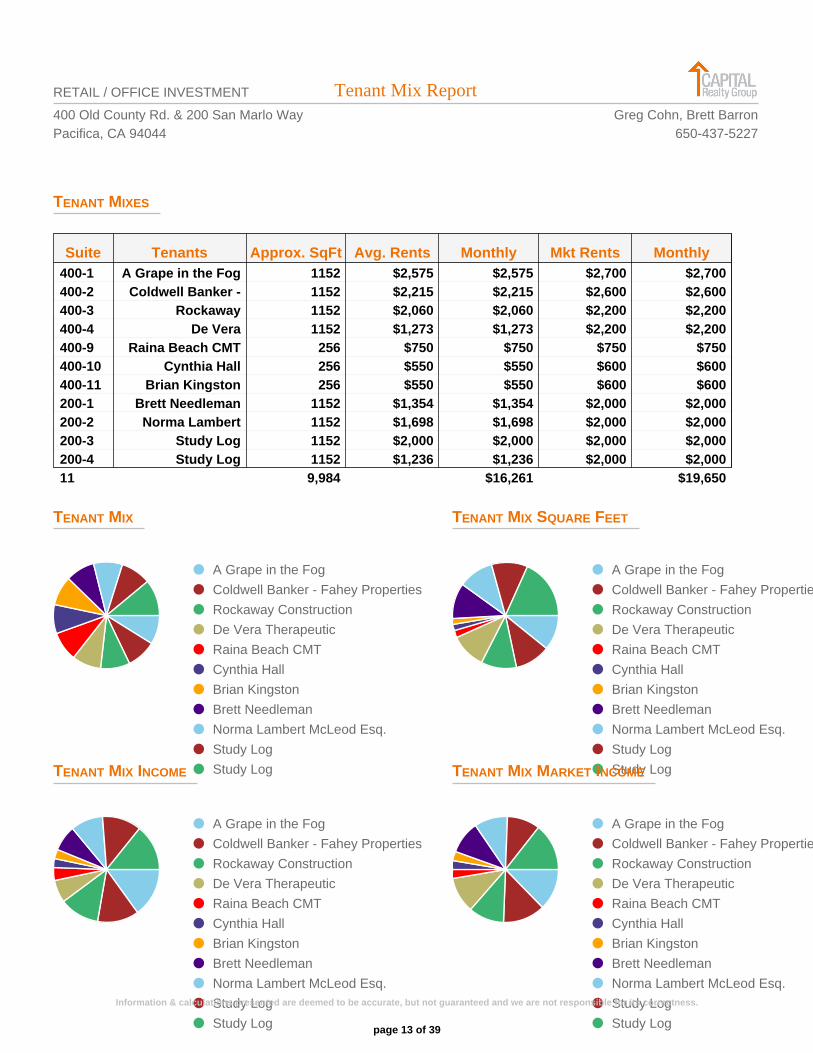
TENANT MIXES
Suite Tenants Approx. SqFt Avg. Rents Monthly Mkt Rents Monthly400-1 A Grape in the Fog 1152 $2,575 $2,575 $2,700 $2,700400-2 Coldwell Banker - 1152 $2,215 $2,215 $2,600 $2,600400-3 Rockaway 1152 $2,060 $2,060 $2,200 $2,200400-4 De Vera 1152 $1,273 $1,273 $2,200 $2,200400-9 Raina Beach CMT 256 $750 $750 $750 $750400-10 Cynthia Hall 256 $550 $550 $600 $600400-11 Brian Kingston 256 $550 $550 $600 $600200-1 Brett Needleman 1152 $1,354 $1,354 $2,000 $2,000200-2 Norma Lambert 1152 $1,698 $1,698 $2,000 $2,000200-3 Study Log 1152 $2,000 $2,000 $2,000 $2,000200-4 Study Log 1152 $1,236 $1,236 $2,000 $2,00011 9,984 $16,261 $19,650
TENANT MIX TENANT MIX SQUARE FEET
● A Grape in the Fog
● Coldwell Banker - Fahey Properties
● Rockaway Construction
● De Vera Therapeutic
● Raina Beach CMT
● Cynthia Hall
● Brian Kingston
● Brett Needleman
● Norma Lambert McLeod Esq.
● Study Log
● Study Log
● A Grape in the Fog
● Coldwell Banker - Fahey Properties
● Rockaway Construction
● De Vera Therapeutic
● Raina Beach CMT
● Cynthia Hall
● Brian Kingston
● Brett Needleman
● Norma Lambert McLeod Esq.
● Study Log
● Study LogTENANT MIX INCOME TENANT MIX MARKET INCOME
● A Grape in the Fog
● Coldwell Banker - Fahey Properties
● Rockaway Construction
● De Vera Therapeutic
● Raina Beach CMT
● Cynthia Hall
● Brian Kingston
● Brett Needleman
● Norma Lambert McLeod Esq.
● Study Log
● Study Log
● A Grape in the Fog
● Coldwell Banker - Fahey Properties
● Rockaway Construction
● De Vera Therapeutic
● Raina Beach CMT
● Cynthia Hall
● Brian Kingston
● Brett Needleman
● Norma Lambert McLeod Esq.
● Study Log
● Study Logpage 13 of 39
Information & calculations presented are deemed to be accurate, but not guaranteed and we are not responsible for its correctness.
Lease Rent RollRETAIL / OFFICE INVESTMENT
400 Old County Rd. & 200 San Marlo WayPacifica, CA 94044
Greg Cohn, Brett Barron650-437-5227
Suite Tenant Start Date Expire Date RSF $/RSF AnnualizedRent
TenantImprovements
Commissions RenewalTerm
RenewalIncrease
Notes
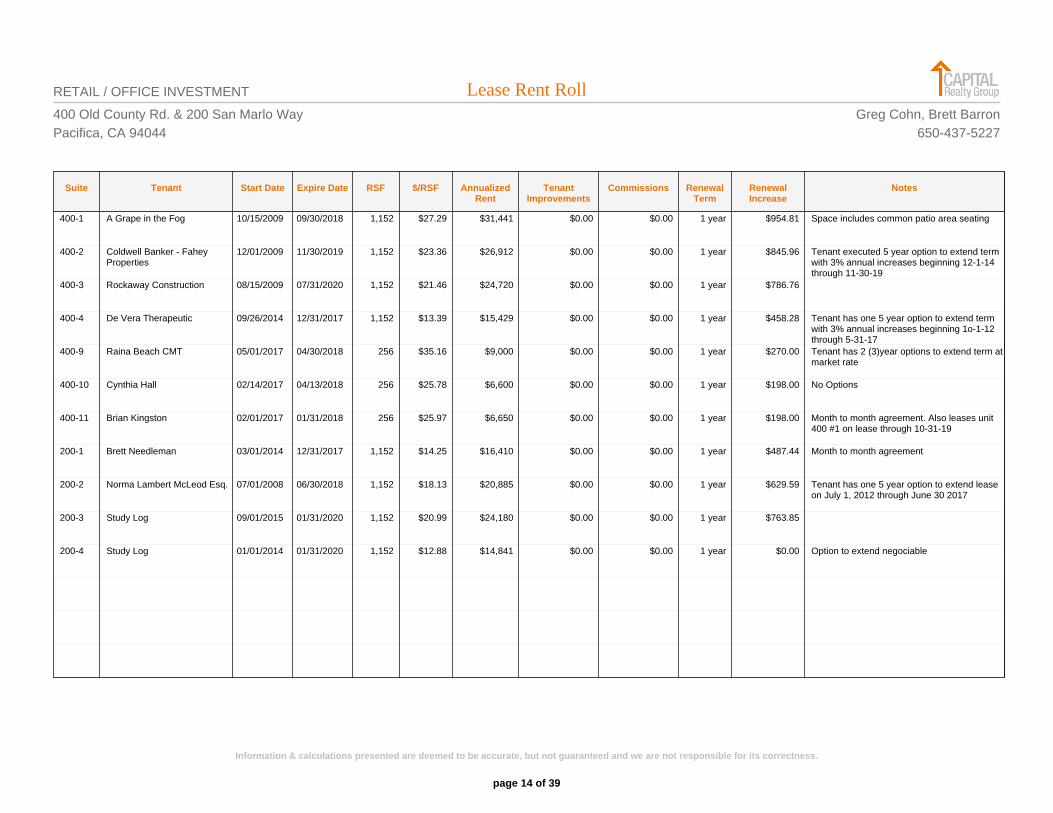
400-1 A Grape in the Fog 10/15/2009 09/30/2018 1,152 $27.29 $31,441 $0.00 $0.00 1 year $954.81 Space includes common patio area seating
400-2 Coldwell Banker - FaheyProperties
12/01/2009 11/30/2019 1,152 $23.36 $26,912 $0.00 $0.00 1 year $845.96 Tenant executed 5 year option to extend termwith 3% annual increases beginning 12-1-14through 11-30-19
400-3 Rockaway Construction 08/15/2009 07/31/2020 1,152 $21.46 $24,720 $0.00 $0.00 1 year $786.76
400-4 De Vera Therapeutic 09/26/2014 12/31/2017 1,152 $13.39 $15,429 $0.00 $0.00 1 year $458.28 Tenant has one 5 year option to extend termwith 3% annual increases beginning 1o-1-12through 5-31-17
400-9 Raina Beach CMT 05/01/2017 04/30/2018 256 $35.16 $9,000 $0.00 $0.00 1 year $270.00 Tenant has 2 (3)year options to extend term atmarket rate
400-10 Cynthia Hall 02/14/2017 04/13/2018 256 $25.78 $6,600 $0.00 $0.00 1 year $198.00 No Options
400-11 Brian Kingston 02/01/2017 01/31/2018 256 $25.97 $6,650 $0.00 $0.00 1 year $198.00 Month to month agreement. Also leases unit400 #1 on lease through 10-31-19
200-1 Brett Needleman 03/01/2014 12/31/2017 1,152 $14.25 $16,410 $0.00 $0.00 1 year $487.44 Month to month agreement
200-2 Norma Lambert McLeod Esq. 07/01/2008 06/30/2018 1,152 $18.13 $20,885 $0.00 $0.00 1 year $629.59 Tenant has one 5 year option to extend leaseon July 1, 2012 through June 30 2017
200-3 Study Log 09/01/2015 01/31/2020 1,152 $20.99 $24,180 $0.00 $0.00 1 year $763.85
200-4 Study Log 01/01/2014 01/31/2020 1,152 $12.88 $14,841 $0.00 $0.00 1 year $0.00 Option to extend negociable
page 14 of 39
Information & calculations presented are deemed to be accurate, but not guaranteed and we are not responsible for its correctness.
Investment AnalysisRETAIL / OFFICE INVESTMENT400 Old County Rd. & 200 San Marlo WayPacifica, CA 94044
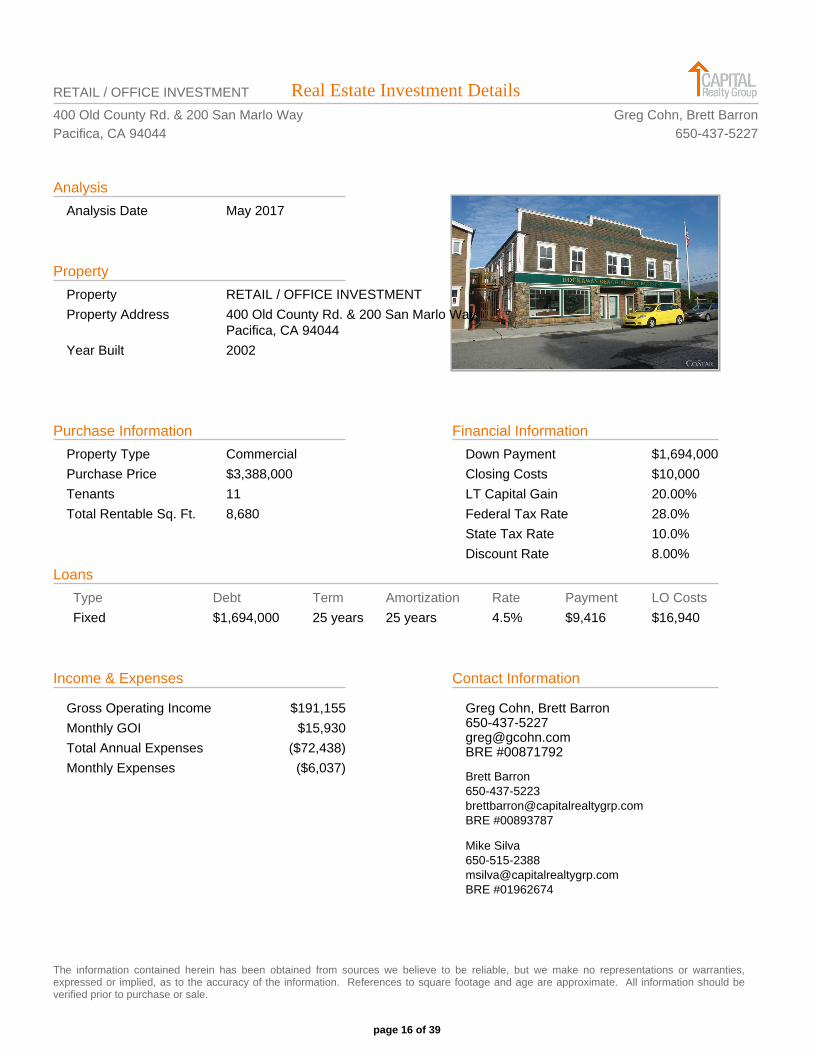
Real Estate Investment DetailsRETAIL / OFFICE INVESTMENT
400 Old County Rd. & 200 San Marlo WayPacifica, CA 94044
Greg Cohn, Brett Barron650-437-5227
Analysis
Analysis Date May 2017
Property
Property RETAIL / OFFICE INVESTMENT
Property Address 400 Old County Rd. & 200 San Marlo WayPacifica, CA 94044
Year Built 2002
Financial Information
Down Payment $1,694,000
Closing Costs $10,000
LT Capital Gain 20.00%
Federal Tax Rate 28.0%
State Tax Rate 10.0%
Discount Rate 8.00%
Purchase Information
Property Type Commercial
Purchase Price $3,388,000
Tenants 11
Total Rentable Sq. Ft. 8,680
Loans
Type Debt Term Amortization Rate Payment LO Costs
Fixed $1,694,000 25 years 25 years 4.5% $9,416 $16,940
Income & Expenses
Gross Operating Income $191,155
Monthly GOI $15,930
Total Annual Expenses ($72,438)
Monthly Expenses ($6,037)
Contact Information
Greg Cohn, Brett [email protected] #00871792
Brett [email protected] #00893787
Mike [email protected] #01962674
The information contained herein has been obtained from sources we believe to be reliable, but we make no representations or warranties,expressed or implied, as to the accuracy of the information. References to square footage and age are approximate. All information should beverified prior to purchase or sale.
page 16 of 39
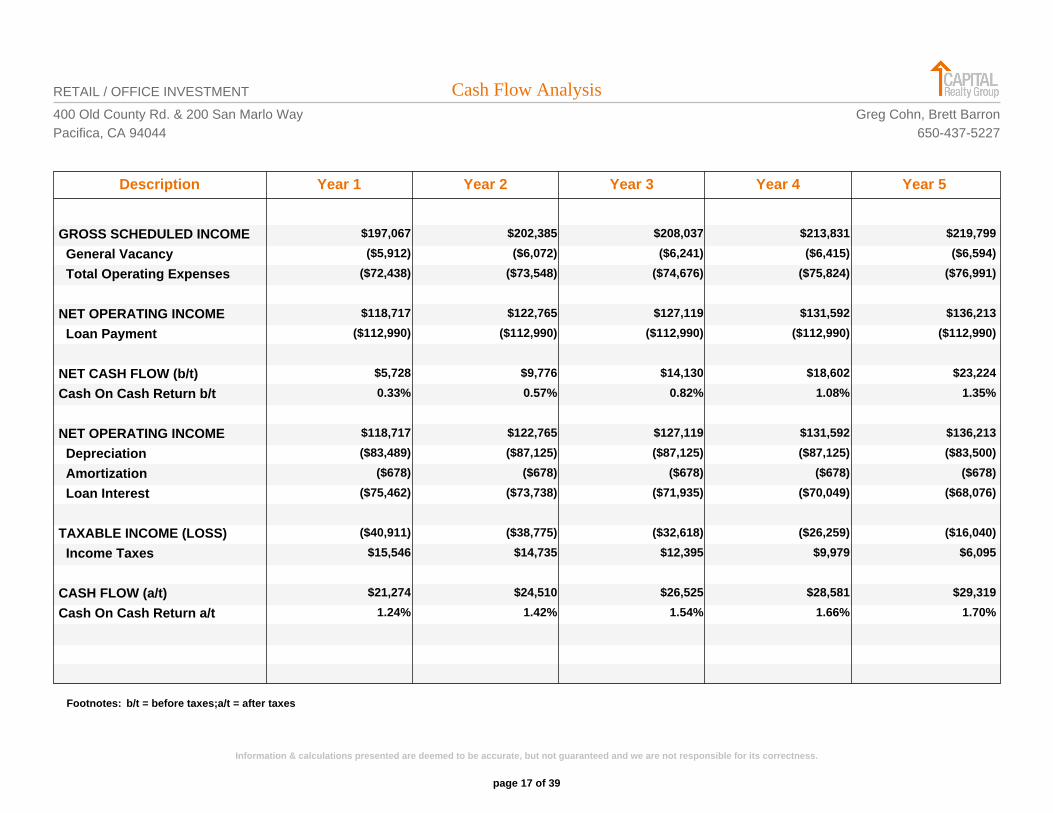
Cash Flow AnalysisRETAIL / OFFICE INVESTMENT
400 Old County Rd. & 200 San Marlo WayPacifica, CA 94044
Greg Cohn, Brett Barron650-437-5227
Description Year 1 Year 2 Year 3 Year 4 Year 5
GROSS SCHEDULED INCOME $197,067 $202,385 $208,037 $213,831 $219,799
General Vacancy ($5,912) ($6,072) ($6,241) ($6,415) ($6,594)
Total Operating Expenses ($72,438) ($73,548) ($74,676) ($75,824) ($76,991)
NET OPERATING INCOME $118,717 $122,765 $127,119 $131,592 $136,213
Loan Payment ($112,990) ($112,990) ($112,990) ($112,990) ($112,990)
NET CASH FLOW (b/t) $5,728 $9,776 $14,130 $18,602 $23,224
Cash On Cash Return b/t 0.33% 0.57% 0.82% 1.08% 1.35%
NET OPERATING INCOME $118,717 $122,765 $127,119 $131,592 $136,213
Depreciation ($83,489) ($87,125) ($87,125) ($87,125) ($83,500)
Amortization ($678) ($678) ($678) ($678) ($678)
Loan Interest ($75,462) ($73,738) ($71,935) ($70,049) ($68,076)
TAXABLE INCOME (LOSS) ($40,911) ($38,775) ($32,618) ($26,259) ($16,040)
Income Taxes $15,546 $14,735 $12,395 $9,979 $6,095
CASH FLOW (a/t) $21,274 $24,510 $26,525 $28,581 $29,319
Cash On Cash Return a/t 1.24% 1.42% 1.54% 1.66% 1.70%
Footnotes: b/t = before taxes;a/t = after taxes
page 17 of 39
Information & calculations presented are deemed to be accurate, but not guaranteed and we are not responsible for its correctness.
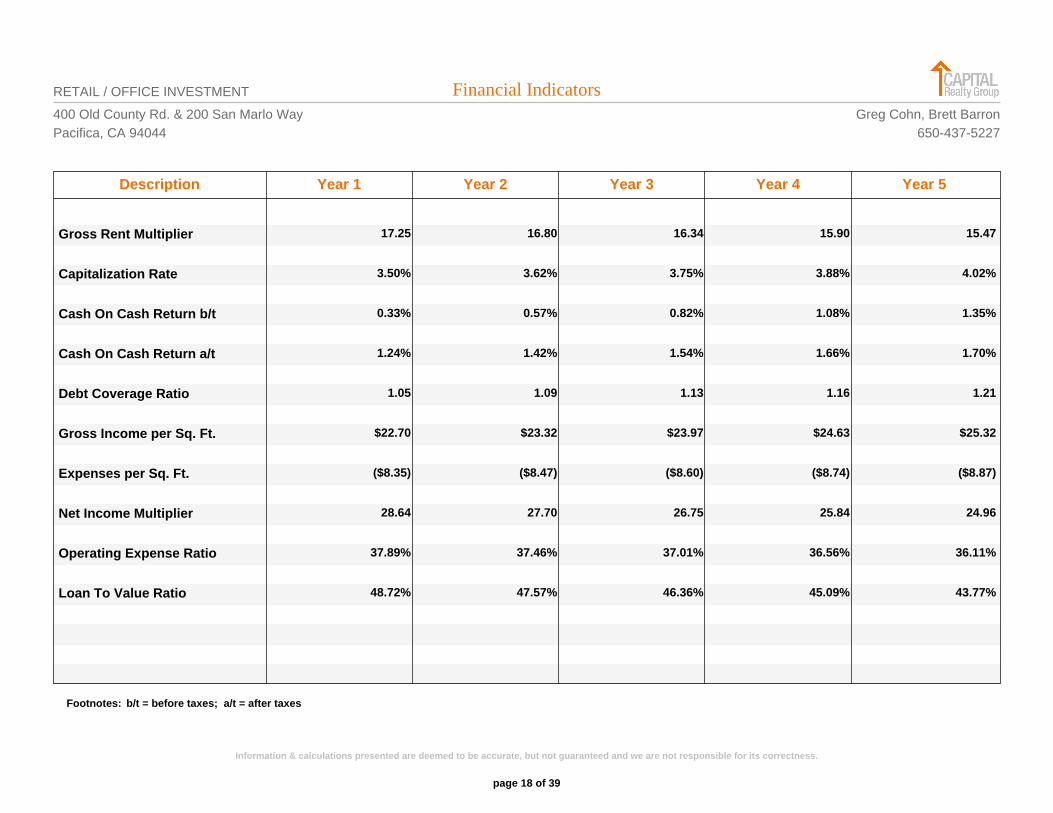
Financial IndicatorsRETAIL / OFFICE INVESTMENT
400 Old County Rd. & 200 San Marlo WayPacifica, CA 94044
Greg Cohn, Brett Barron650-437-5227
Description Year 1 Year 2 Year 3 Year 4 Year 5
Gross Rent Multiplier 17.25 16.80 16.34 15.90 15.47
Capitalization Rate 3.50% 3.62% 3.75% 3.88% 4.02%
Cash On Cash Return b/t 0.33% 0.57% 0.82% 1.08% 1.35%
Cash On Cash Return a/t 1.24% 1.42% 1.54% 1.66% 1.70%
Debt Coverage Ratio 1.05 1.09 1.13 1.16 1.21
Gross Income per Sq. Ft. $22.70 $23.32 $23.97 $24.63 $25.32
Expenses per Sq. Ft. ($8.35) ($8.47) ($8.60) ($8.74) ($8.87)
Net Income Multiplier 28.64 27.70 26.75 25.84 24.96
Operating Expense Ratio 37.89% 37.46% 37.01% 36.56% 36.11%
Loan To Value Ratio 48.72% 47.57% 46.36% 45.09% 43.77%
Footnotes: b/t = before taxes; a/t = after taxes
page 18 of 39
Information & calculations presented are deemed to be accurate, but not guaranteed and we are not responsible for its correctness.
Sales ComparablesRETAIL / OFFICE INVESTMENT400 Old County Rd. & 200 San Marlo WayPacifica, CA 94044
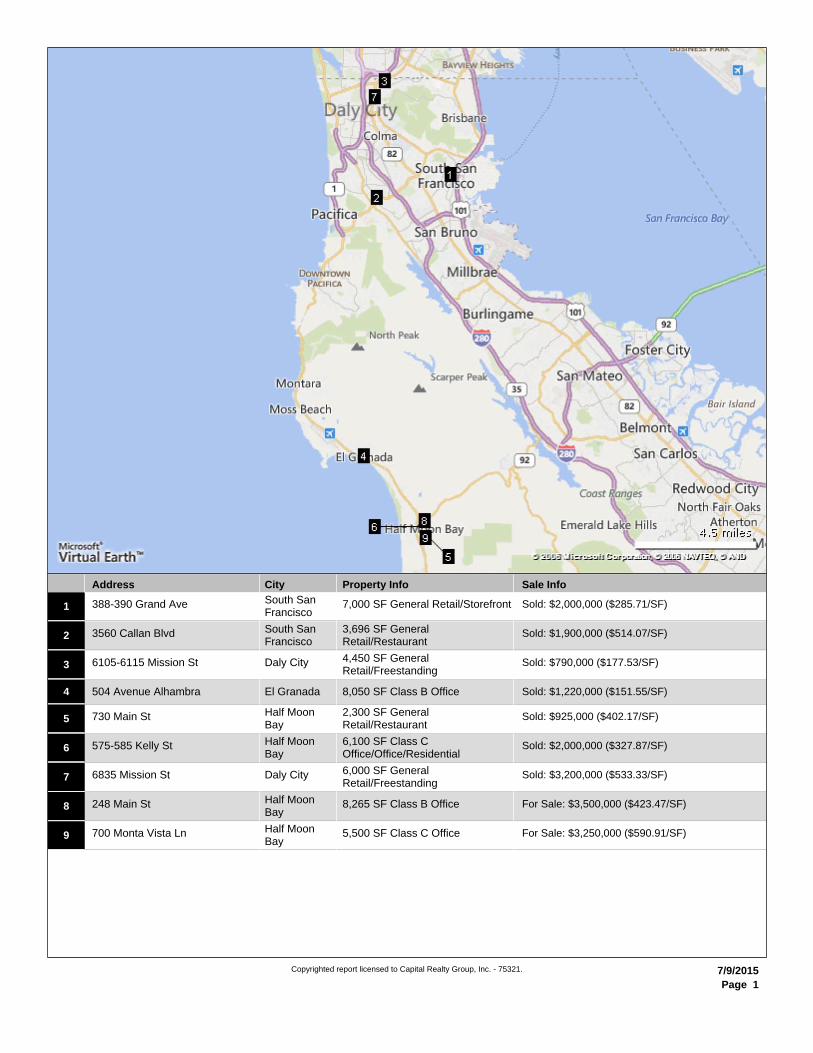
388-390 Grand Ave1 Sold: $2,000,000 ($285.71/SF)South SanFrancisco
7,000 SF General Retail/Storefront
3560 Callan Blvd2 Sold: $1,900,000 ($514.07/SF)South SanFrancisco
3,696 SF GeneralRetail/Restaurant
6105-6115 Mission St3 Sold: $790,000 ($177.53/SF)Daly City 4,450 SF GeneralRetail/Freestanding
504 Avenue Alhambra4 Sold: $1,220,000 ($151.55/SF)El Granada 8,050 SF Class B Office
730 Main St5 Sold: $925,000 ($402.17/SF)Half MoonBay
2,300 SF GeneralRetail/Restaurant
575-585 Kelly St6 Sold: $2,000,000 ($327.87/SF)Half MoonBay
6,100 SF Class COffice/Office/Residential
6835 Mission St7 Sold: $3,200,000 ($533.33/SF)Daly City 6,000 SF GeneralRetail/Freestanding
248 Main St8 For Sale: $3,500,000 ($423.47/SF)Half MoonBay
8,265 SF Class B Office
700 Monta Vista Ln9 For Sale: $3,250,000 ($590.91/SF)Half MoonBay
5,500 SF Class C Office
Address City Property Info Sale Info
Copyrighted report licensed to Capital Realty Group, Inc. - 75321. 7/9/2015
Page 1
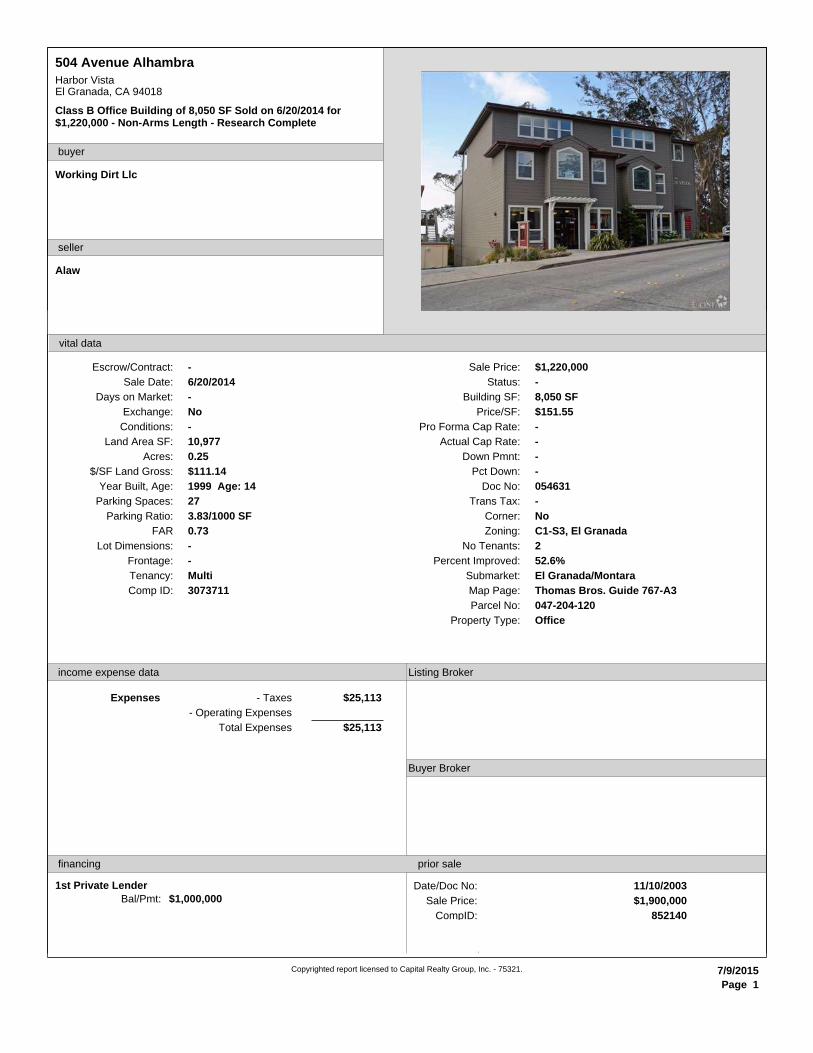
504 Avenue Alhambra
Harbor VistaEl Granada, CA 94018
Class B Office Building of 8,050 SF Sold on 6/20/2014 for$1,220,000 - Non-Arms Length - Research Complete
buyer
Working Dirt Llc
Alaw
seller
vital data
Sale Date: 6/20/2014
Days on Market: -
Exchange: No
Conditions: -
Land Area SF: 10,977
Acres: 0.25
$/SF Land Gross: $111.14
Year Built, Age: 1999 Age: 14
Parking Spaces: 27
Parking Ratio: 3.83/1000 SF
FAR 0.73
Lot Dimensions: -
Frontage: -
Comp ID: 3073711
Sale Price: $1,220,000
Status: -
Building SF: 8,050 SF
Price/SF: $151.55
Pro Forma Cap Rate: -
Actual Cap Rate: -
Down Pmnt: -
Pct Down: -
Doc No: 054631
Trans Tax: -
Corner: No
Zoning: C1-S3, El Granada
No Tenants: 2
Percent Improved: 52.6%
Submarket: El Granada/Montara
Property Type: Office
MultiTenancy:
Parcel No: 047-204-120
Map Page: Thomas Bros. Guide 767-A3
Escrow/Contract: -
income expense data
$25,113
$25,113
Total Expenses
- Operating Expenses
- TaxesExpenses
Listing Broker
Buyer Broker
prior sale
Date/Doc No:
Sale Price:
CompID:
11/10/2003
$1,900,000
852140
financing
1st Private Lender
Bal/Pmt: $1,000,000
Copyrighted report licensed to Capital Realty Group, Inc. - 75321. 7/9/2015
Page 1
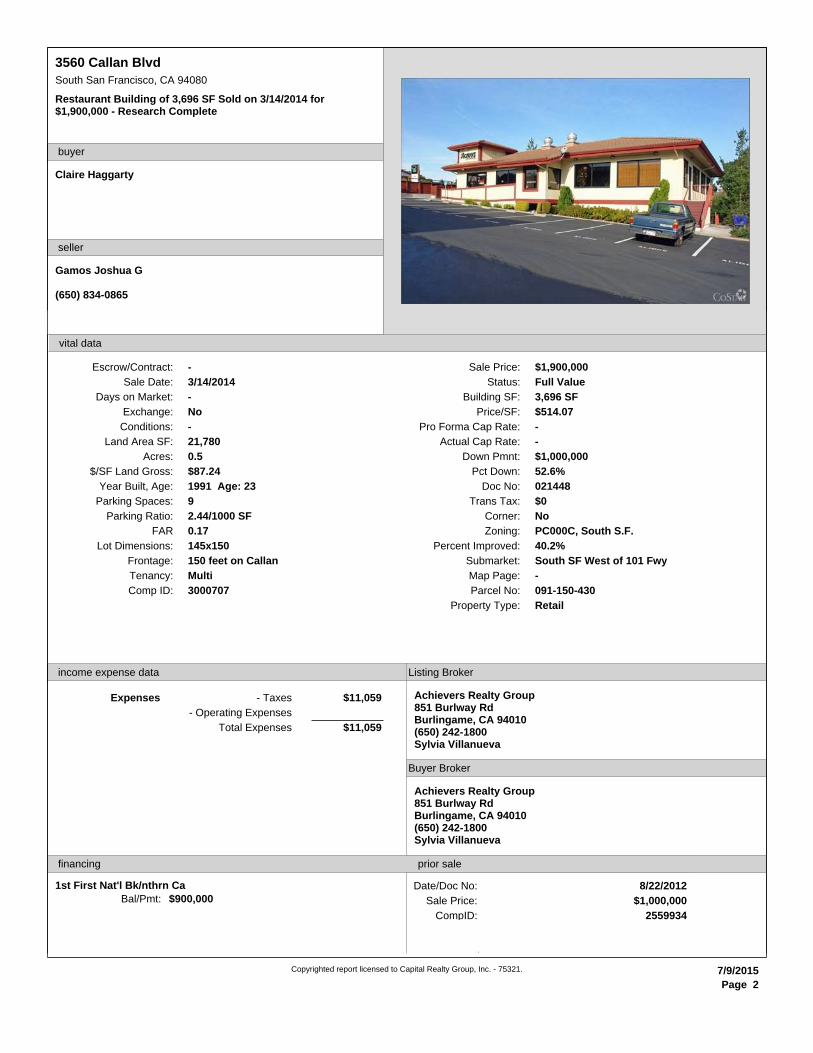
3560 Callan Blvd
South San Francisco, CA 94080
Restaurant Building of 3,696 SF Sold on 3/14/2014 for$1,900,000 - Research Complete
buyer
Claire Haggarty
Gamos Joshua G
(650) 834-0865
seller
vital data
Sale Date: 3/14/2014
Days on Market: -
Exchange: No
Conditions: -
Land Area SF: 21,780
Acres: 0.5
$/SF Land Gross: $87.24
Year Built, Age: 1991 Age: 23
Parking Spaces: 9
Parking Ratio: 2.44/1000 SF
FAR 0.17
Lot Dimensions: 145x150
Frontage: 150 feet on Callan
Comp ID: 3000707
Sale Price: $1,900,000
Status: Full Value
Building SF: 3,696 SF
Price/SF: $514.07
Pro Forma Cap Rate: -
Actual Cap Rate: -
Down Pmnt: $1,000,000
Pct Down: 52.6%
Doc No: 021448
Trans Tax: $0
Corner: No
Zoning: PC000C, South S.F.
Percent Improved: 40.2%
Submarket: South SF West of 101 Fwy
Property Type: Retail
MultiTenancy:
Parcel No: 091-150-430
Map Page: -
Escrow/Contract: -
income expense data
$11,059
$11,059
Total Expenses
- Operating Expenses
- TaxesExpenses
Listing Broker
Achievers Realty Group851 Burlway RdBurlingame, CA 94010(650) 242-1800Sylvia Villanueva
Buyer Broker
Achievers Realty Group851 Burlway RdBurlingame, CA 94010(650) 242-1800Sylvia Villanueva
prior sale
Date/Doc No:
Sale Price:
CompID:
8/22/2012
$1,000,000
2559934
financing
1st First Nat'l Bk/nthrn Ca
Bal/Pmt: $900,000
Copyrighted report licensed to Capital Realty Group, Inc. - 75321. 7/9/2015
Page 2
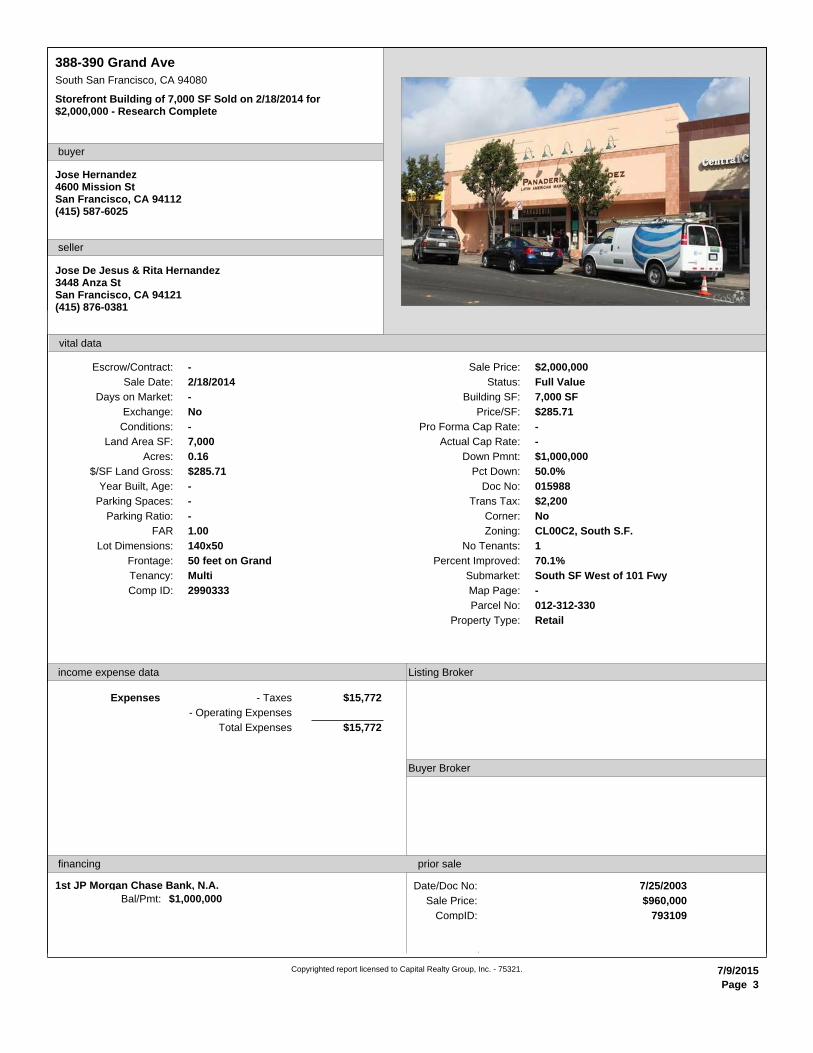
388-390 Grand Ave
South San Francisco, CA 94080
Storefront Building of 7,000 SF Sold on 2/18/2014 for$2,000,000 - Research Complete
buyer
Jose Hernandez4600 Mission StSan Francisco, CA 94112(415) 587-6025
Jose De Jesus & Rita Hernandez3448 Anza StSan Francisco, CA 94121(415) 876-0381
seller
vital data
Sale Date: 2/18/2014
Days on Market: -
Exchange: No
Conditions: -
Land Area SF: 7,000
Acres: 0.16
$/SF Land Gross: $285.71
Year Built, Age: -
Parking Spaces: -
Parking Ratio: -
FAR 1.00
Lot Dimensions: 140x50
Frontage: 50 feet on Grand
Comp ID: 2990333
Sale Price: $2,000,000
Status: Full Value
Building SF: 7,000 SF
Price/SF: $285.71
Pro Forma Cap Rate: -
Actual Cap Rate: -
Down Pmnt: $1,000,000
Pct Down: 50.0%
Doc No: 015988
Trans Tax: $2,200
Corner: No
Zoning: CL00C2, South S.F.
No Tenants: 1
Percent Improved: 70.1%
Submarket: South SF West of 101 Fwy
Property Type: Retail
MultiTenancy:
Parcel No: 012-312-330
Map Page: -
Escrow/Contract: -
income expense data
$15,772
$15,772
Total Expenses
- Operating Expenses
- TaxesExpenses
Listing Broker
Buyer Broker
prior sale
Date/Doc No:
Sale Price:
CompID:
7/25/2003
$960,000
793109
financing
1st JP Morgan Chase Bank, N.A.
Bal/Pmt: $1,000,000
Copyrighted report licensed to Capital Realty Group, Inc. - 75321. 7/9/2015
Page 3
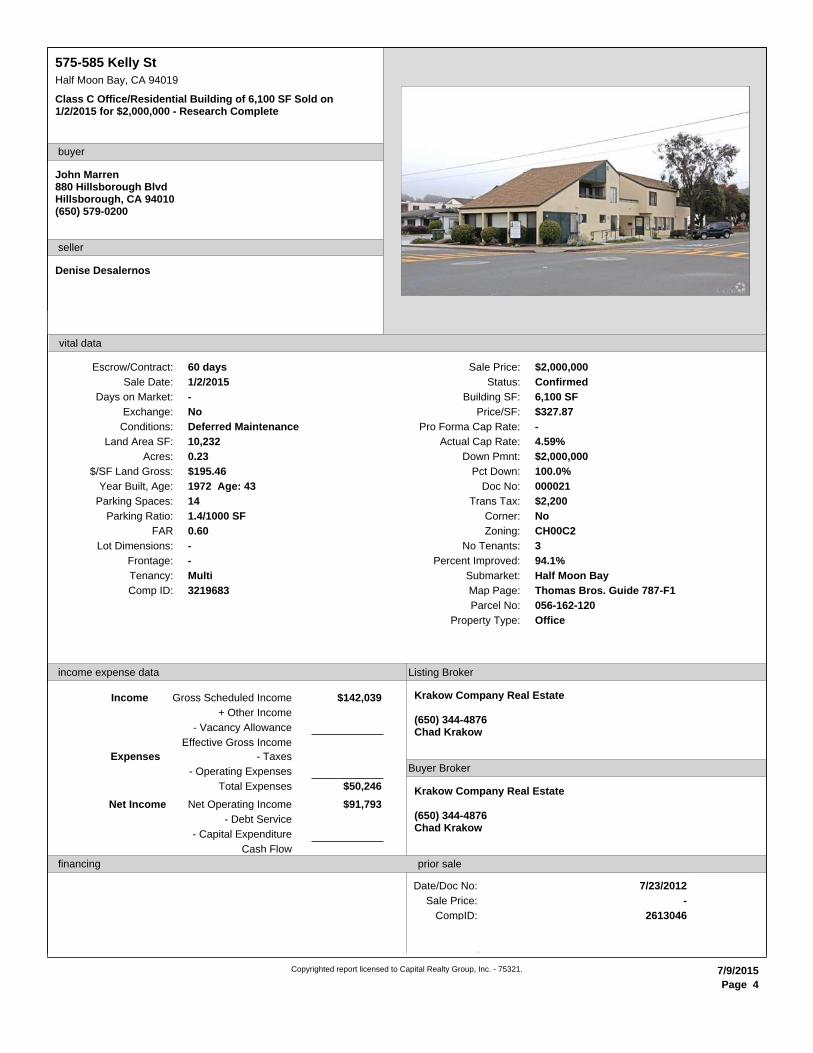
575-585 Kelly St
Half Moon Bay, CA 94019
Class C Office/Residential Building of 6,100 SF Sold on1/2/2015 for $2,000,000 - Research Complete
buyer
John Marren880 Hillsborough BlvdHillsborough, CA 94010(650) 579-0200
Denise Desalernos
seller
vital data
Sale Date: 1/2/2015
Days on Market: -
Exchange: No
Conditions: Deferred Maintenance
Land Area SF: 10,232
Acres: 0.23
$/SF Land Gross: $195.46
Year Built, Age: 1972 Age: 43
Parking Spaces: 14
Parking Ratio: 1.4/1000 SF
FAR 0.60
Lot Dimensions: -
Frontage: -
Comp ID: 3219683
Sale Price: $2,000,000
Status: Confirmed
Building SF: 6,100 SF
Price/SF: $327.87
Pro Forma Cap Rate: -
Actual Cap Rate: 4.59%
Down Pmnt: $2,000,000
Pct Down: 100.0%
Doc No: 000021
Trans Tax: $2,200
Corner: No
Zoning: CH00C2
No Tenants: 3
Percent Improved: 94.1%
Submarket: Half Moon Bay
Property Type: Office
MultiTenancy:
Parcel No: 056-162-120
Map Page: Thomas Bros. Guide 787-F1
Escrow/Contract: 60 days
income expense data
$142,039
Effective Gross Income
- Vacancy Allowance
+ Other Income
Gross Scheduled IncomeIncome
$50,246Total Expenses
- Operating Expenses
- TaxesExpenses
Cash Flow
$91,793
- Capital Expenditure
- Debt Service
Net Operating IncomeNet Income
Listing Broker
Krakow Company Real Estate
(650) 344-4876Chad Krakow
Buyer Broker
Krakow Company Real Estate
(650) 344-4876Chad Krakow
prior sale
Date/Doc No:
Sale Price:
CompID:
7/23/2012
-
2613046
financing
Copyrighted report licensed to Capital Realty Group, Inc. - 75321. 7/9/2015
Page 4
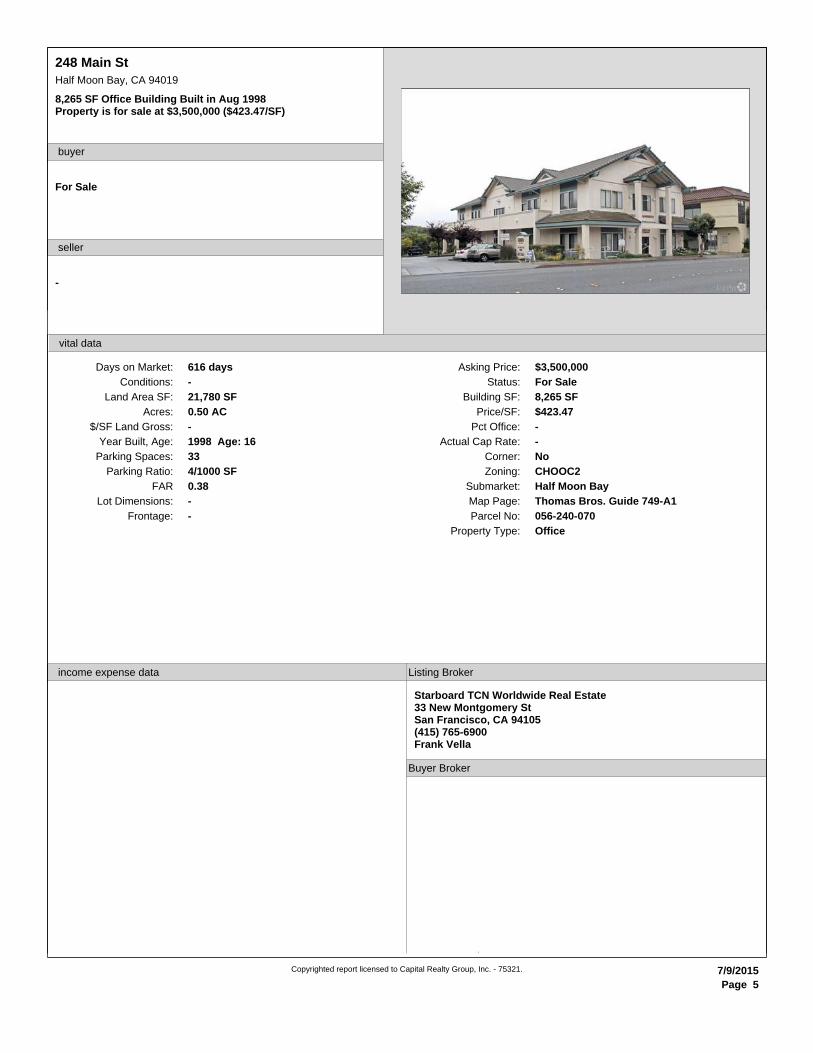
248 Main St
Half Moon Bay, CA 94019
8,265 SF Office Building Built in Aug 1998Property is for sale at $3,500,000 ($423.47/SF)
buyer
For Sale
-
seller
vital data
Days on Market: 616 days
Conditions: -
Land Area SF: 21,780 SF
Acres: 0.50 AC
$/SF Land Gross: -
Year Built, Age: 1998 Age: 16
Parking Spaces: 33
Parking Ratio: 4/1000 SF
FAR 0.38
Lot Dimensions: -
Frontage: -
Asking Price: $3,500,000
Status: For Sale
Building SF: 8,265 SF
Price/SF: $423.47
Pct Office: -
Actual Cap Rate: -
Corner: No
Zoning: CHOOC2
Submarket: Half Moon Bay
Property Type: Office
Map Page: Thomas Bros. Guide 749-A1
056-240-070Parcel No:
income expense data Listing Broker
Starboard TCN Worldwide Real Estate33 New Montgomery StSan Francisco, CA 94105(415) 765-6900Frank Vella
Buyer Broker
Copyrighted report licensed to Capital Realty Group, Inc. - 75321. 7/9/2015
Page 5

730 Main St
Half Moon Bay, CA 94019
Restaurant Building of 2,300 SF Sold on 8/20/2014 for $925,000- Research Complete
buyer
THOMAS J MCGUIRK2180 Sand Hill RdMenlo Park, CA 94025
Port Cheddar Landholdings Llc730 MainHalf Moon Bay, CA 94019
seller
vital data
Sale Date: 8/20/2014
Days on Market: 93 days
Exchange: No
Conditions: -
Land Area SF: 4,360
Acres: 0.1
$/SF Land Gross: $212.14
Year Built, Age: 1901 Age: 113
Parking Spaces: 1
Parking Ratio: 1.34/1000 SF
FAR 0.53
Lot Dimensions: 50x86
Frontage: 49 feet on Main St (with 0 curb cut)
Comp ID: 3100829
Sale Price: $925,000
Status: Confirmed
Building SF: 2,300 SF
Price/SF: $402.17
Pro Forma Cap Rate: -
Actual Cap Rate: -
Down Pmnt: $325,000
Pct Down: 35.1%
Doc No: 075228
Trans Tax: $1,017.50
Corner: No
Zoning: C-2
Percent Improved: 54.6%
Submarket: Half Moon Bay
Property Type: Retail
SingleTenancy:
Parcel No: 056-191-240
Map Page: Thomas Bros. Guide 787-F2
Escrow/Contract: -
income expense data
$9,898
$9,898
Total Expenses
- Operating Expenses
- TaxesExpenses
Listing Broker
Kinghorn Commercial1161 Cherry StSan Carlos, CA 94070(650) 918-4388Randy Kinghorn
Buyer Broker
prior sale
Date/Doc No:
Sale Price:
CompID:
3/15/2002
$625,000
643135
financing
1st First National Bank of Northern California
Bal/Pmt: $600,000
Copyrighted report licensed to Capital Realty Group, Inc. - 75321. 7/9/2015
Page 6
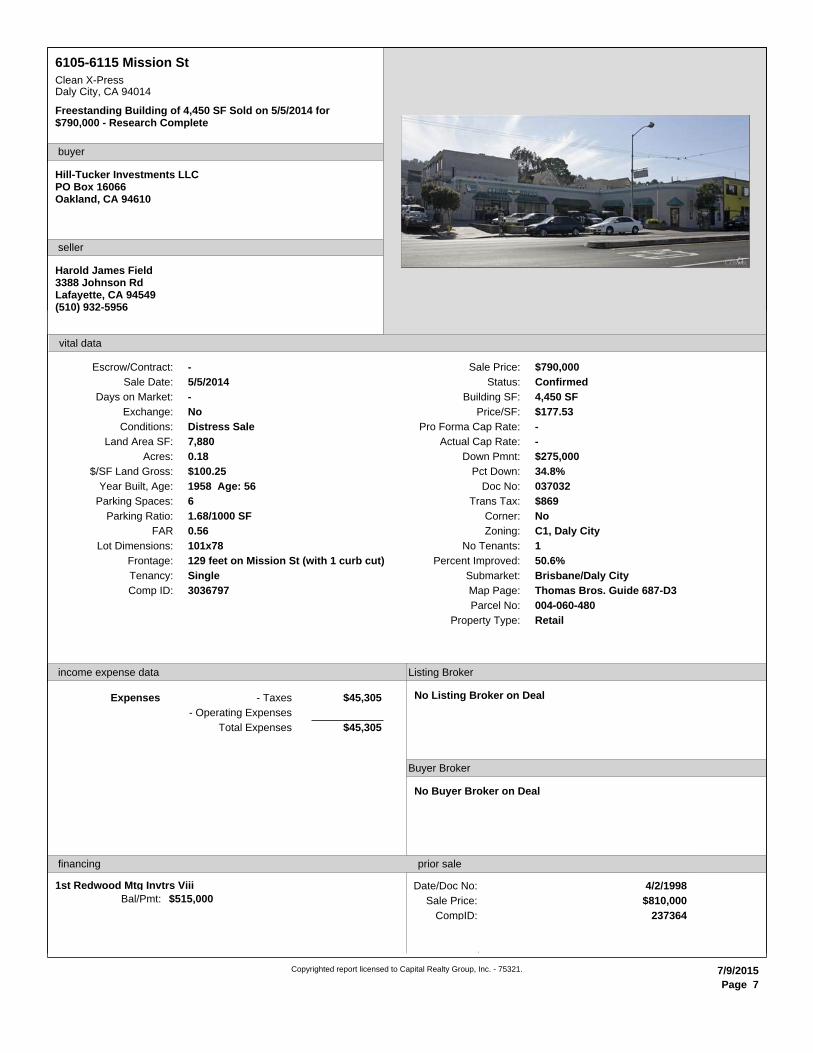
6105-6115 Mission St
Clean X-PressDaly City, CA 94014
Freestanding Building of 4,450 SF Sold on 5/5/2014 for$790,000 - Research Complete
buyer
Hill-Tucker Investments LLCPO Box 16066Oakland, CA 94610
Harold James Field3388 Johnson RdLafayette, CA 94549(510) 932-5956
seller
vital data
Sale Date: 5/5/2014
Days on Market: -
Exchange: No
Conditions: Distress Sale
Land Area SF: 7,880
Acres: 0.18
$/SF Land Gross: $100.25
Year Built, Age: 1958 Age: 56
Parking Spaces: 6
Parking Ratio: 1.68/1000 SF
FAR 0.56
Lot Dimensions: 101x78
Frontage: 129 feet on Mission St (with 1 curb cut)
Comp ID: 3036797
Sale Price: $790,000
Status: Confirmed
Building SF: 4,450 SF
Price/SF: $177.53
Pro Forma Cap Rate: -
Actual Cap Rate: -
Down Pmnt: $275,000
Pct Down: 34.8%
Doc No: 037032
Trans Tax: $869
Corner: No
Zoning: C1, Daly City
No Tenants: 1
Percent Improved: 50.6%
Submarket: Brisbane/Daly City
Property Type: Retail
SingleTenancy:
Parcel No: 004-060-480
Map Page: Thomas Bros. Guide 687-D3
Escrow/Contract: -
income expense data
$45,305
$45,305
Total Expenses
- Operating Expenses
- TaxesExpenses
Listing Broker
No Listing Broker on Deal
Buyer Broker
No Buyer Broker on Deal
prior sale
Date/Doc No:
Sale Price:
CompID:
4/2/1998
$810,000
237364
financing
1st Redwood Mtg Invtrs Viii
Bal/Pmt: $515,000
Copyrighted report licensed to Capital Realty Group, Inc. - 75321. 7/9/2015
Page 7
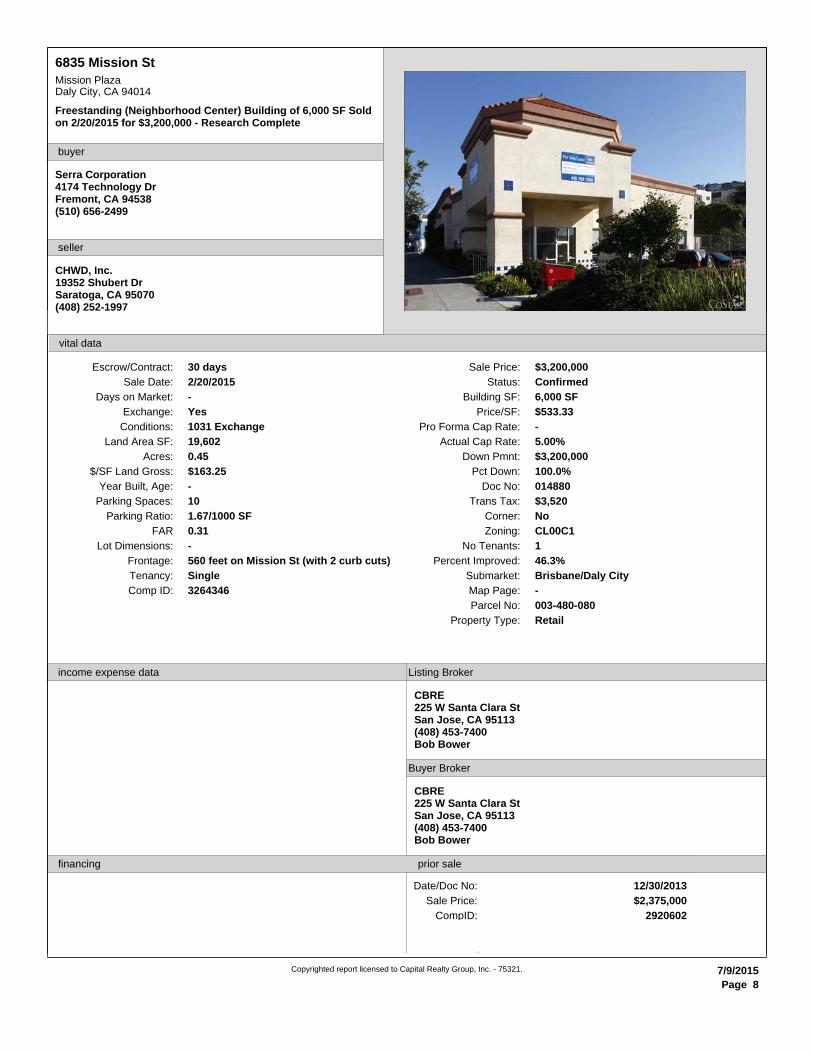
6835 Mission St
Mission PlazaDaly City, CA 94014
Freestanding (Neighborhood Center) Building of 6,000 SF Soldon 2/20/2015 for $3,200,000 - Research Complete
buyer
Serra Corporation4174 Technology DrFremont, CA 94538(510) 656-2499
CHWD, Inc.19352 Shubert DrSaratoga, CA 95070(408) 252-1997
seller
vital data
Sale Date: 2/20/2015
Days on Market: -
Exchange: Yes
Conditions: 1031 Exchange
Land Area SF: 19,602
Acres: 0.45
$/SF Land Gross: $163.25
Year Built, Age: -
Parking Spaces: 10
Parking Ratio: 1.67/1000 SF
FAR 0.31
Lot Dimensions: -
Frontage: 560 feet on Mission St (with 2 curb cuts)
Comp ID: 3264346
Sale Price: $3,200,000
Status: Confirmed
Building SF: 6,000 SF
Price/SF: $533.33
Pro Forma Cap Rate: -
Actual Cap Rate: 5.00%
Down Pmnt: $3,200,000
Pct Down: 100.0%
Doc No: 014880
Trans Tax: $3,520
Corner: No
Zoning: CL00C1
No Tenants: 1
Percent Improved: 46.3%
Submarket: Brisbane/Daly City
Property Type: Retail
SingleTenancy:
Parcel No: 003-480-080
Map Page: -
Escrow/Contract: 30 days
income expense data Listing Broker
CBRE225 W Santa Clara StSan Jose, CA 95113(408) 453-7400Bob Bower
Buyer Broker
CBRE225 W Santa Clara StSan Jose, CA 95113(408) 453-7400Bob Bower
prior sale
Date/Doc No:
Sale Price:
CompID:
12/30/2013
$2,375,000
2920602
financing
Copyrighted report licensed to Capital Realty Group, Inc. - 75321. 7/9/2015
Page 8
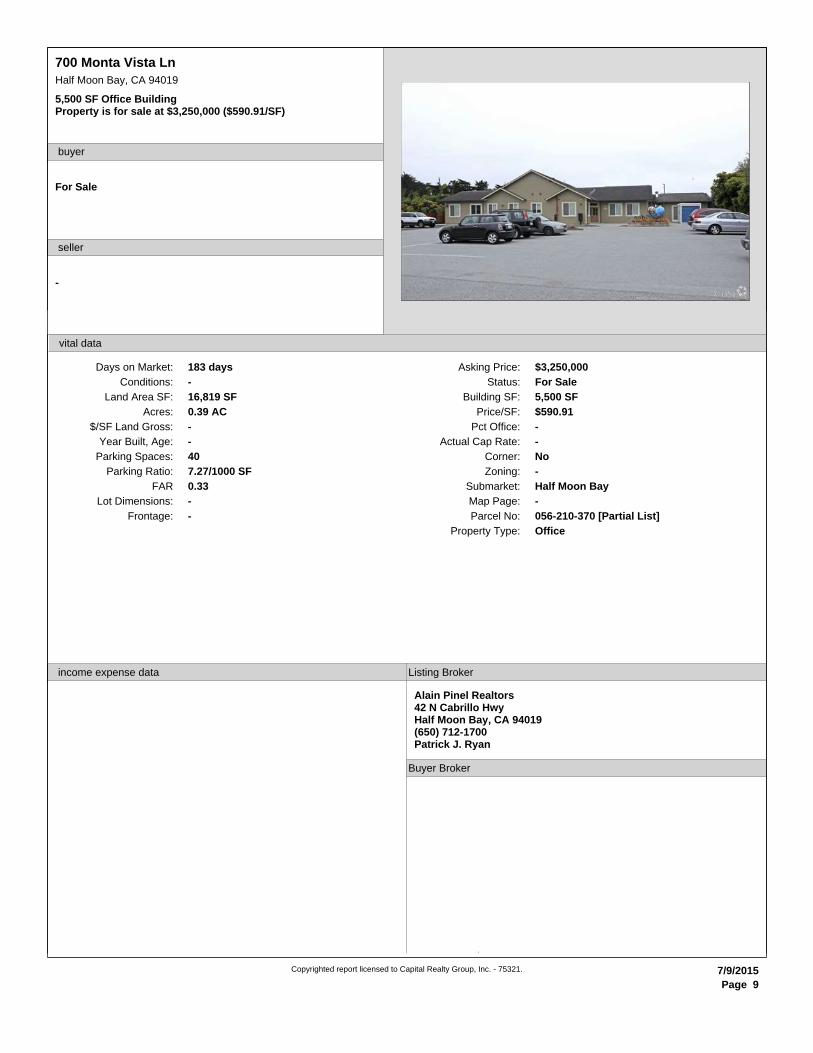
700 Monta Vista Ln
Half Moon Bay, CA 94019
5,500 SF Office BuildingProperty is for sale at $3,250,000 ($590.91/SF)
buyer
For Sale
-
seller
vital data
Days on Market: 183 days
Conditions: -
Land Area SF: 16,819 SF
Acres: 0.39 AC
$/SF Land Gross: -
Year Built, Age: -
Parking Spaces: 40
Parking Ratio: 7.27/1000 SF
FAR 0.33
Lot Dimensions: -
Frontage: -
Asking Price: $3,250,000
Status: For Sale
Building SF: 5,500 SF
Price/SF: $590.91
Pct Office: -
Actual Cap Rate: -
Corner: No
Zoning: -
Submarket: Half Moon Bay
Property Type: Office
Map Page: -
056-210-370 [Partial List]Parcel No:
income expense data Listing Broker
Alain Pinel Realtors42 N Cabrillo HwyHalf Moon Bay, CA 94019(650) 712-1700Patrick J. Ryan
Buyer Broker
Copyrighted report licensed to Capital Realty Group, Inc. - 75321. 7/9/2015
Page 9
2
RBA
Price per SF
Actual Cap Rate
Days on Market
Sale Price to Asking Price Ratio
-
$3,250,000
5,500 SF
$423.47
-
183
$3,375,000
6,882 SF
$490.37
-
400
-
$3,375,000
6,882 SF
$507.19
-
400
-
$3,500,000
8,265 SF
$590.91
-
616
-
2
2
2
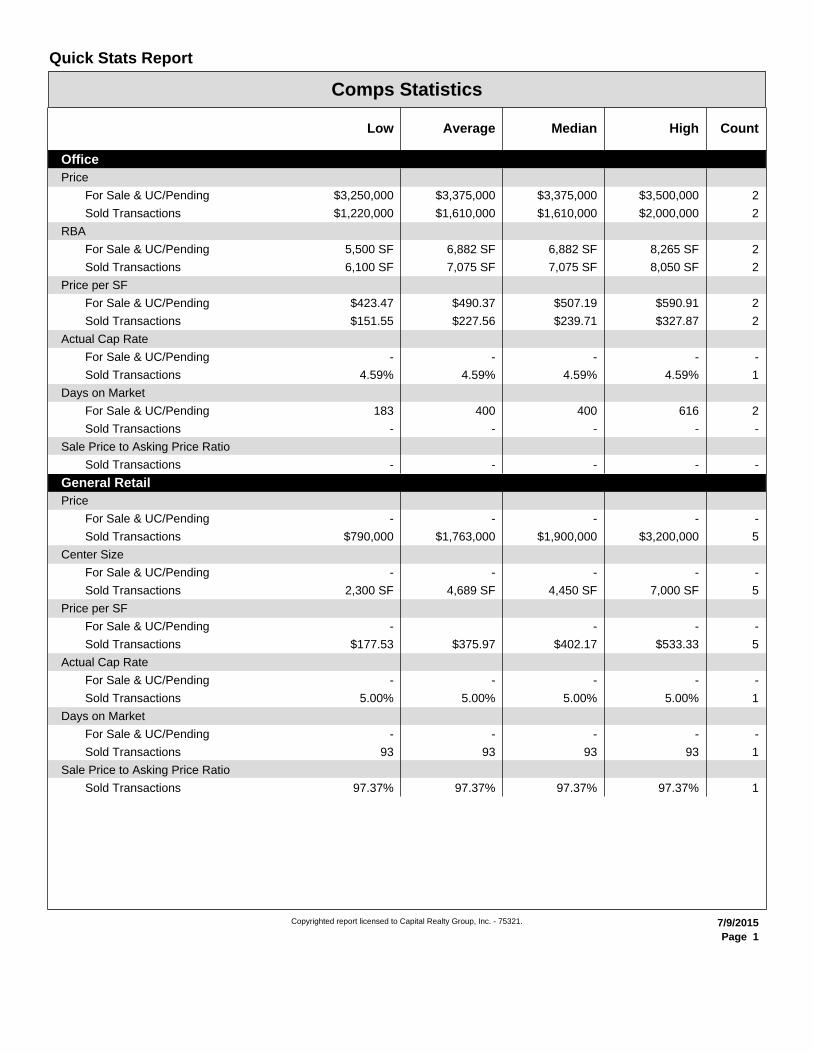
Price
For Sale & UC/Pending
Sold Transactions $1,220,000 $1,610,000 $1,610,000 $2,000,000 2
For Sale & UC/Pending
Sold Transactions 6,100 SF 7,075 SF 7,075 SF 8,050 SF
$151.55 $227.56 2
4.59% 4.59%
$239.71 $327.87
4.59% 4.59%
-
1
For Sale & UC/Pending
Sold Transactions
For Sale & UC/Pending
Sold Transactions
For Sale & UC/Pending
Sold Transactions
Sold Transactions
- - - -
2
-
-
Office
-
Center Size
Price per SF
Actual Cap Rate
Days on Market
Sale Price to Asking Price Ratio
97.37%
-
-
-
-
-
-
-
-
-
97.37%
-
-
-
-
-
97.37%
-
-
-
-
-
97.37%
-
5
-
Price
For Sale & UC/Pending
Sold Transactions $790,000 $1,763,000 $1,900,000 $3,200,000 5
For Sale & UC/Pending
Sold Transactions 2,300 SF 4,689 SF 4,450 SF 7,000 SF
$177.53 $375.97 5
5.00% 5.00%
$402.17 $533.33
5.00% 5.00%
-
1
For Sale & UC/Pending
Sold Transactions
For Sale & UC/Pending
Sold Transactions
For Sale & UC/Pending
Sold Transactions
Sold Transactions
93 93 93 93
-
1
1
General Retail
Comps Statistics
CountHighMedianAverageLow
Quick Stats Report
Copyrighted report licensed to Capital Realty Group, Inc. - 75321. 7/9/2015
Page 1
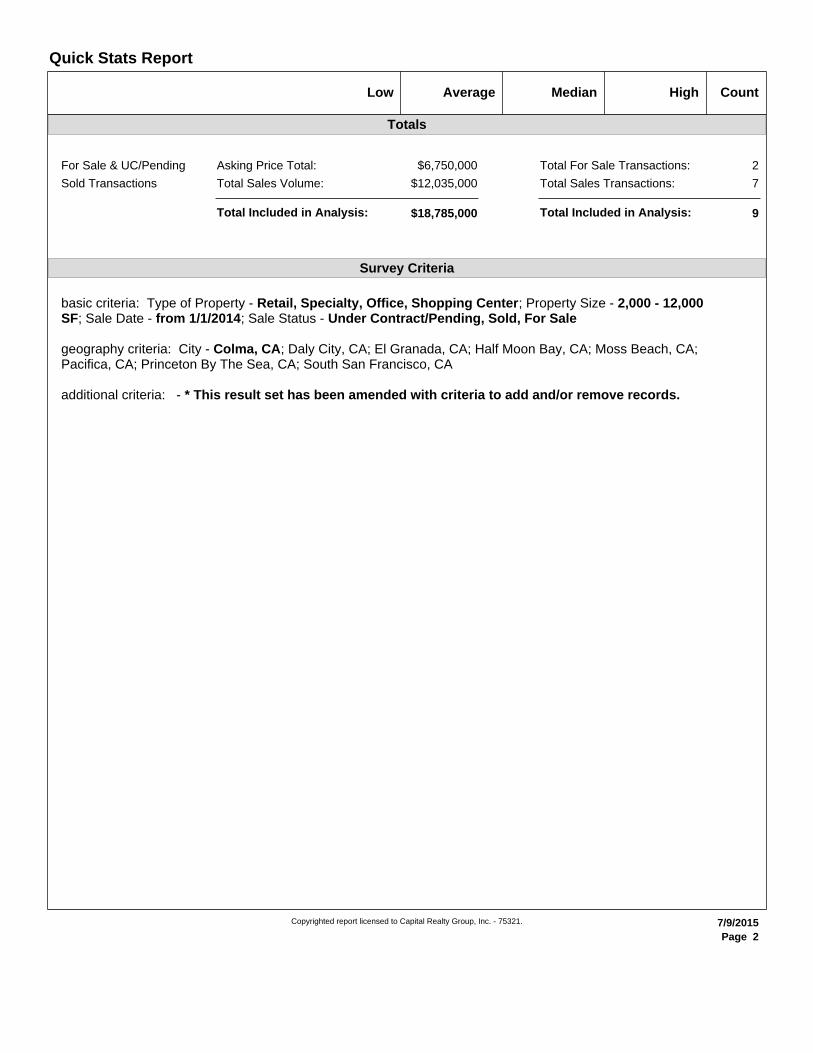
Total Included in Analysis:
Totals
Asking Price Total: Total For Sale Transactions:
Total Sales Volume: Total Sales Transactions:
Total Included in Analysis:
For Sale & UC/Pending
Sold Transactions
$6,750,000
$12,035,000
$18,785,000 9
2
7
Survey Criteria
basic criteria: Type of Property - Retail, Specialty, Office, Shopping Center; Property Size - 2,000 - 12,000SF; Sale Date - from 1/1/2014; Sale Status - Under Contract/Pending, Sold, For Sale
geography criteria: City - Colma, CA; Daly City, CA; El Granada, CA; Half Moon Bay, CA; Moss Beach, CA;Pacifica, CA; Princeton By The Sea, CA; South San Francisco, CA
additional criteria: - * This result set has been amended with criteria to add and/or remove records.
CountHighMedianAverageLow
Quick Stats Report
Copyrighted report licensed to Capital Realty Group, Inc. - 75321. 7/9/2015
Page 2
Dollar Volume # of Transactions
Cap Rate Average Price Per SF
Legend:
Current Survey
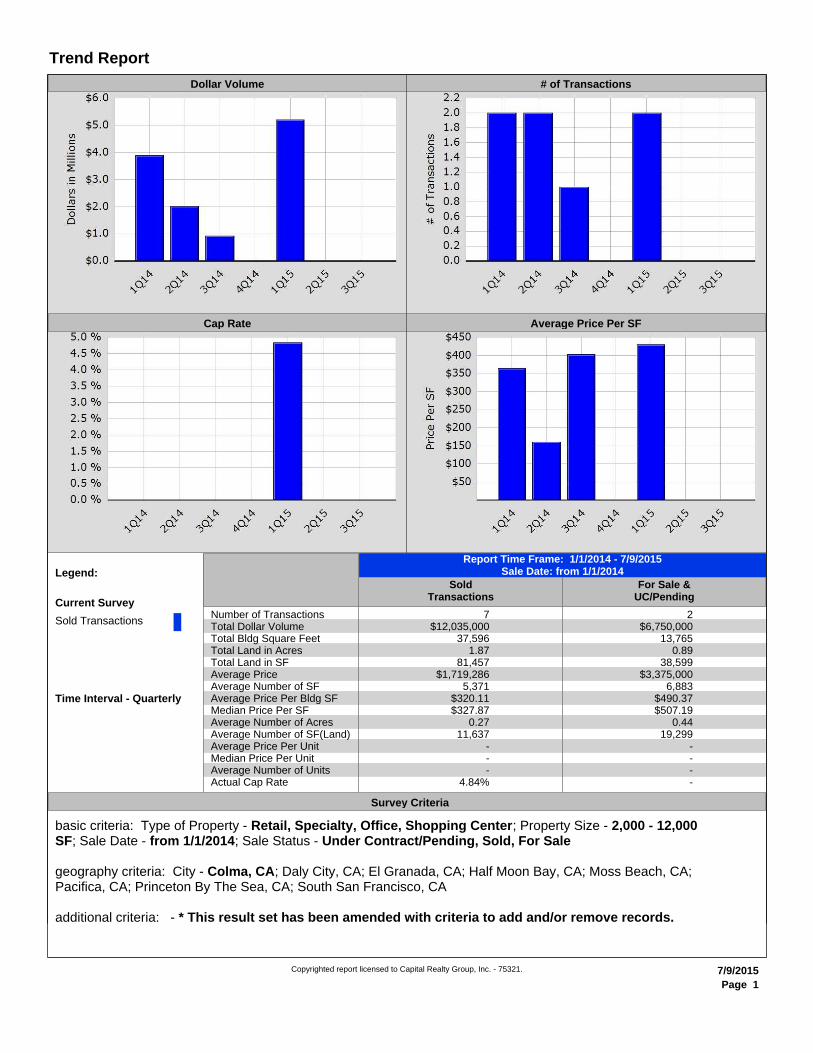
Sold Transactions7
$12,035,0002
$6,750,000Number of TransactionsTotal Dollar Volume
37,5961.87
13,7650.89
Total Bldg Square FeetTotal Land in Acres
81,457$1,719,286
38,599$3,375,000
Total Land in SFAverage Price
5,371$320.11
6,883$490.37
Average Number of SFAverage Price Per Bldg SF
$327.870.27
$507.190.44
Median Price Per SFAverage Number of Acres
11,637-
19,299-
Average Number of SF(Land)Average Price Per Unit
--
--
Median Price Per UnitAverage Number of Units
4.84%Actual Cap Rate
SoldTransactions
For Sale &UC/Pending
-
Time Interval - Quarterly
Report Time Frame: 1/1/2014 - 7/9/2015Sale Date: from 1/1/2014
Survey Criteria
basic criteria: Type of Property - Retail, Specialty, Office, Shopping Center; Property Size - 2,000 - 12,000SF; Sale Date - from 1/1/2014; Sale Status - Under Contract/Pending, Sold, For Sale
geography criteria: City - Colma, CA; Daly City, CA; El Granada, CA; Half Moon Bay, CA; Moss Beach, CA;Pacifica, CA; Princeton By The Sea, CA; South San Francisco, CA
additional criteria: - * This result set has been amended with criteria to add and/or remove records.
Trend Report
Copyrighted report licensed to Capital Realty Group, Inc. - 75321. 7/9/2015
Page 1
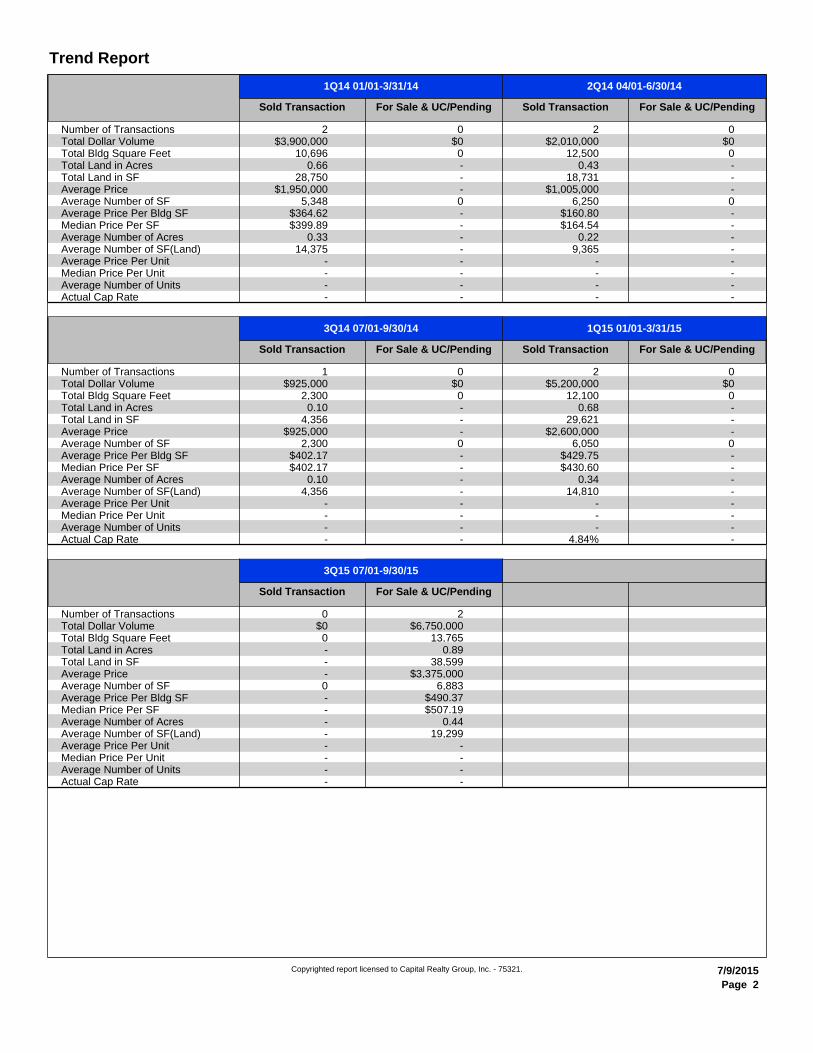
Trend Report
2Q14 04/01-6/30/141Q14 01/01-3/31/14
For Sale & UC/Pending For Sale & UC/Pending
1Q14 01/01-3/31/14 2Q14 04/01-6/30/14
Number of TransactionsTotal Dollar VolumeTotal Bldg Square FeetTotal Land in AcresTotal Land in SFAverage PriceAverage Number of SFAverage Price Per Bldg SFMedian Price Per SFAverage Number of AcresAverage Number of SF(Land)Average Price Per UnitMedian Price Per UnitAverage Number of UnitsActual Cap Rate
Sold TransactionSold Transaction
2$3,900,000
10,6960.66
28,750$1,950,000
5,348$364.62$399.89
0.3314,375
----
0$0
0---0--------
2$2,010,000
12,5000.43
18,731$1,005,000
6,250$160.80$164.54
0.229,365
----
0$0
0---0--------
1Q15 01/01-3/31/153Q14 07/01-9/30/14
For Sale & UC/Pending For Sale & UC/Pending
3Q14 07/01-9/30/14 1Q15 01/01-3/31/15
Number of TransactionsTotal Dollar VolumeTotal Bldg Square FeetTotal Land in AcresTotal Land in SFAverage PriceAverage Number of SFAverage Price Per Bldg SFMedian Price Per SFAverage Number of AcresAverage Number of SF(Land)Average Price Per UnitMedian Price Per UnitAverage Number of UnitsActual Cap Rate
Sold TransactionSold Transaction
1$925,000
2,3000.10
4,356$925,000
2,300$402.17$402.17
0.104,356
----
0$0
0---0--------
2$5,200,000
12,1000.68
29,621$2,600,000
6,050$429.75$430.60
0.3414,810
---
4.84%
0$0
0---0--------
3Q15 07/01-7/9/15
For Sale & UC/Pending
3Q15 07/01-9/30/15
Number of TransactionsTotal Dollar VolumeTotal Bldg Square FeetTotal Land in AcresTotal Land in SFAverage PriceAverage Number of SFAverage Price Per Bldg SFMedian Price Per SFAverage Number of AcresAverage Number of SF(Land)Average Price Per UnitMedian Price Per UnitAverage Number of UnitsActual Cap Rate
Sold Transaction
0$0
0---0--------
2$6,750,000
13,7650.89
38,599$3,375,000
6,883$490.37$507.19
0.4419,299
----
Copyrighted report licensed to Capital Realty Group, Inc. - 75321. 7/9/2015
Page 2
DemographicsRETAIL / OFFICE INVESTMENT400 Old County Rd. & 200 San Marlo WayPacifica, CA 94044
-
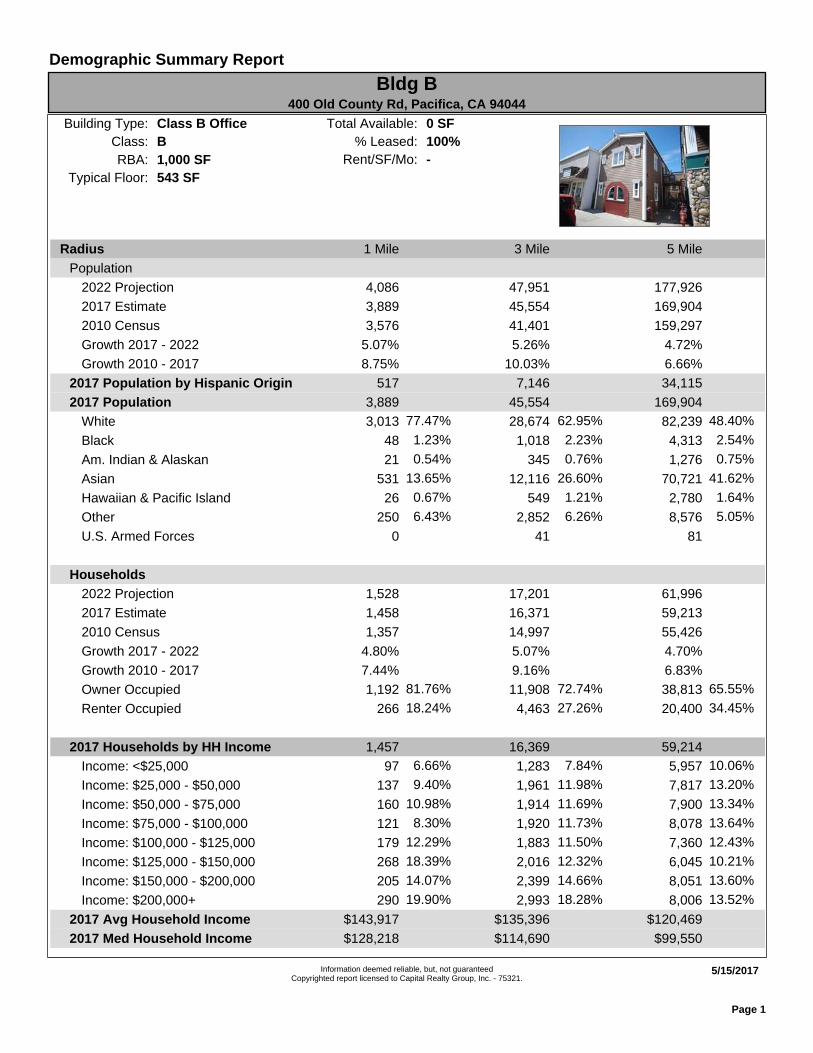
100%
0 SF
543 SF
1,000 SF
Class B Office
Rent/SF/Mo:
% Leased:
Total Available:
Typical Floor:
RBA:
Building Type:
BClass:
Radius 1 Mile 3 Mile 5 Mile
Population
2022 Projection 4,086 47,951 177,926
2017 Estimate 3,889 45,554 169,904
2010 Census 3,576 41,401 159,297
Growth 2017 - 2022 5.07% 5.26% 4.72%
Growth 2010 - 2017 8.75% 10.03% 6.66%
2017 Population by Hispanic Origin 517 7,146 34,115
2017 Population 3,889 45,554 169,904
White 3,013 77.47% 28,674 62.95% 82,239 48.40%
Black 48 1.23% 1,018 2.23% 4,313 2.54%
Am. Indian & Alaskan 21 0.54% 345 0.76% 1,276 0.75%
Asian 531 13.65% 12,116 26.60% 70,721 41.62%
Hawaiian & Pacific Island 26 0.67% 549 1.21% 2,780 1.64%
Other 250 6.43% 2,852 6.26% 8,576 5.05%
U.S. Armed Forces 0 41 81
Households
2022 Projection 1,528 17,201 61,996
2017 Estimate 1,458 16,371 59,213
2010 Census 1,357 14,997 55,426
Growth 2017 - 2022 4.80% 5.07% 4.70%
Growth 2010 - 2017 7.44% 9.16% 6.83%
Owner Occupied 1,192 81.76% 11,908 72.74% 38,813 65.55%
Renter Occupied 266 18.24% 4,463 27.26% 20,400 34.45%
2017 Households by HH Income 1,457 16,369 59,214
Income: <$25,000 97 6.66% 1,283 7.84% 5,957 10.06%
Income: $25,000 - $50,000 137 9.40% 1,961 11.98% 7,817 13.20%
Income: $50,000 - $75,000 160 10.98% 1,914 11.69% 7,900 13.34%
Income: $75,000 - $100,000 121 8.30% 1,920 11.73% 8,078 13.64%
Income: $100,000 - $125,000 179 12.29% 1,883 11.50% 7,360 12.43%
Income: $125,000 - $150,000 268 18.39% 2,016 12.32% 6,045 10.21%
Income: $150,000 - $200,000 205 14.07% 2,399 14.66% 8,051 13.60%
Income: $200,000+ 290 19.90% 2,993 18.28% 8,006 13.52%
2017 Avg Household Income $143,917 $135,396 $120,469
2017 Med Household Income $128,218 $114,690 $99,550
Demographic Summary Report
Bldg B400 Old County Rd, Pacifica, CA 94044
Information deemed reliable, but, not guaranteedCopyrighted report licensed to Capital Realty Group, Inc. - 75321.
5/15/2017
Page 1
-
100%
0 SF
543 SF
1,000 SF
B
Class B Office
Rent/SF/Mo:
% Leased:
Total Available:
Typical Floor:
RBA:
Class:
Building Type:
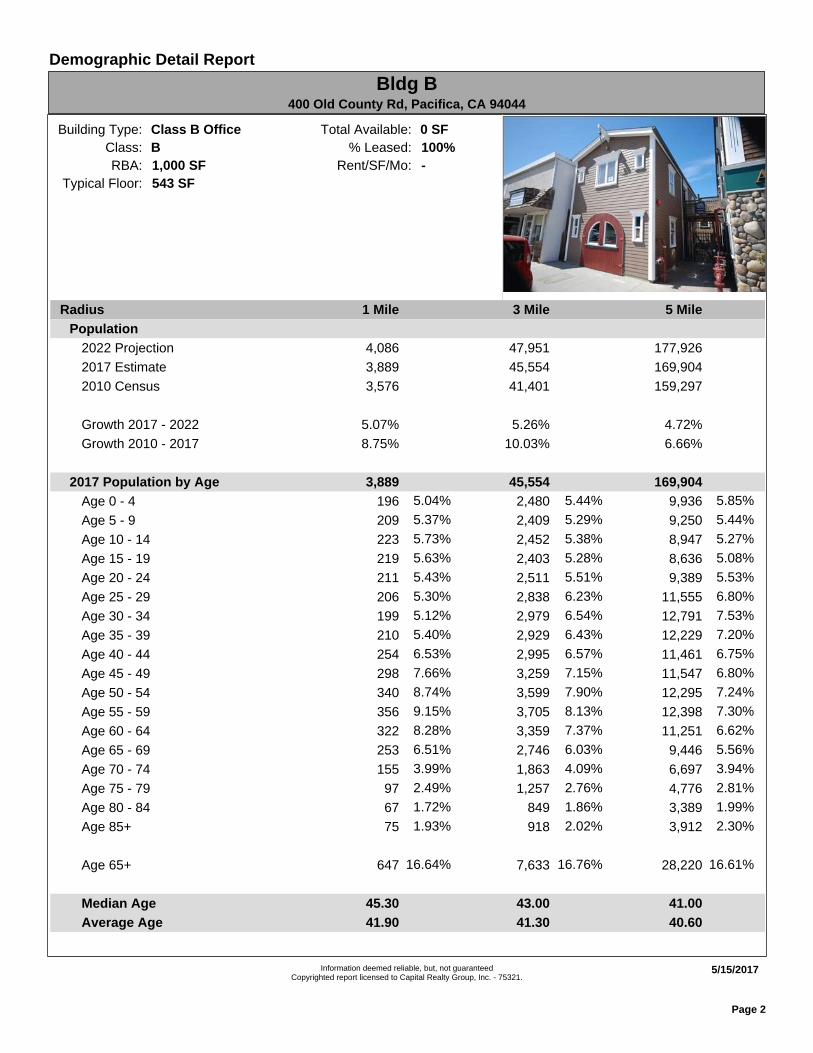
Radius 1 Mile 3 Mile 5 Mile
Population
2022 Projection 4,086 47,951 177,926
2017 Estimate 3,889 45,554 169,904
2010 Census 3,576 41,401 159,297
Growth 2017 - 2022 5.07% 5.26% 4.72%
Growth 2010 - 2017 8.75% 10.03% 6.66%
2017 Population by Age 3,889 45,554 169,904
Age 0 - 4 196 5.04% 2,480 5.44% 9,936 5.85%
Age 5 - 9 209 5.37% 2,409 5.29% 9,250 5.44%
Age 10 - 14 223 5.73% 2,452 5.38% 8,947 5.27%
Age 15 - 19 219 5.63% 2,403 5.28% 8,636 5.08%
Age 20 - 24 211 5.43% 2,511 5.51% 9,389 5.53%
Age 25 - 29 206 5.30% 2,838 6.23% 11,555 6.80%
Age 30 - 34 199 5.12% 2,979 6.54% 12,791 7.53%
Age 35 - 39 210 5.40% 2,929 6.43% 12,229 7.20%
Age 40 - 44 254 6.53% 2,995 6.57% 11,461 6.75%
Age 45 - 49 298 7.66% 3,259 7.15% 11,547 6.80%
Age 50 - 54 340 8.74% 3,599 7.90% 12,295 7.24%
Age 55 - 59 356 9.15% 3,705 8.13% 12,398 7.30%
Age 60 - 64 322 8.28% 3,359 7.37% 11,251 6.62%
Age 65 - 69 253 6.51% 2,746 6.03% 9,446 5.56%
Age 70 - 74 155 3.99% 1,863 4.09% 6,697 3.94%
Age 75 - 79 97 2.49% 1,257 2.76% 4,776 2.81%
Age 80 - 84 67 1.72% 849 1.86% 3,389 1.99%
Age 85+ 75 1.93% 918 2.02% 3,912 2.30%
Age 65+ 647 16.64% 7,633 16.76% 28,220 16.61%
Median Age 45.30 43.00 41.00
Average Age 41.90 41.30 40.60
Demographic Detail Report
Bldg B400 Old County Rd, Pacifica, CA 94044
Information deemed reliable, but, not guaranteedCopyrighted report licensed to Capital Realty Group, Inc. - 75321.
5/15/2017
Page 2
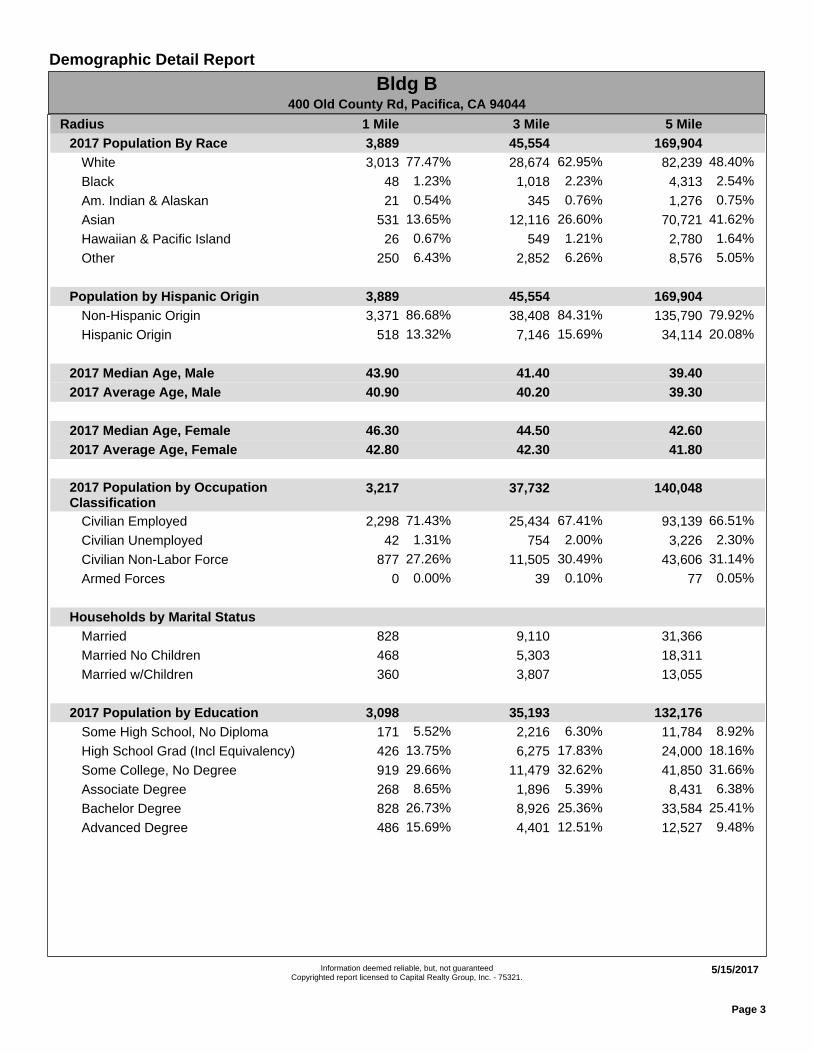
Demographic Detail Report
Bldg B400 Old County Rd, Pacifica, CA 94044
Radius 1 Mile 3 Mile 5 Mile
2017 Population By Race 3,889 45,554 169,904
White 3,013 77.47% 28,674 62.95% 82,239 48.40%
Black 48 1.23% 1,018 2.23% 4,313 2.54%
Am. Indian & Alaskan 21 0.54% 345 0.76% 1,276 0.75%
Asian 531 13.65% 12,116 26.60% 70,721 41.62%
Hawaiian & Pacific Island 26 0.67% 549 1.21% 2,780 1.64%
Other 250 6.43% 2,852 6.26% 8,576 5.05%
Population by Hispanic Origin 3,889 45,554 169,904
Non-Hispanic Origin 3,371 86.68% 38,408 84.31% 135,790 79.92%
Hispanic Origin 518 13.32% 7,146 15.69% 34,114 20.08%
2017 Median Age, Male 43.90 41.40 39.40
2017 Average Age, Male 40.90 40.20 39.30
2017 Median Age, Female 46.30 44.50 42.60
2017 Average Age, Female 42.80 42.30 41.80
2017 Population by OccupationClassification
3,217 37,732 140,048
Civilian Employed 2,298 71.43% 25,434 67.41% 93,139 66.51%
Civilian Unemployed 42 1.31% 754 2.00% 3,226 2.30%
Civilian Non-Labor Force 877 27.26% 11,505 30.49% 43,606 31.14%
Armed Forces 0 0.00% 39 0.10% 77 0.05%
Households by Marital Status
Married 828 9,110 31,366
Married No Children 468 5,303 18,311
Married w/Children 360 3,807 13,055
2017 Population by Education 3,098 35,193 132,176
Some High School, No Diploma 171 5.52% 2,216 6.30% 11,784 8.92%
High School Grad (Incl Equivalency) 426 13.75% 6,275 17.83% 24,000 18.16%
Some College, No Degree 919 29.66% 11,479 32.62% 41,850 31.66%
Associate Degree 268 8.65% 1,896 5.39% 8,431 6.38%
Bachelor Degree 828 26.73% 8,926 25.36% 33,584 25.41%
Advanced Degree 486 15.69% 4,401 12.51% 12,527 9.48%
Information deemed reliable, but, not guaranteedCopyrighted report licensed to Capital Realty Group, Inc. - 75321.
5/15/2017
Page 3
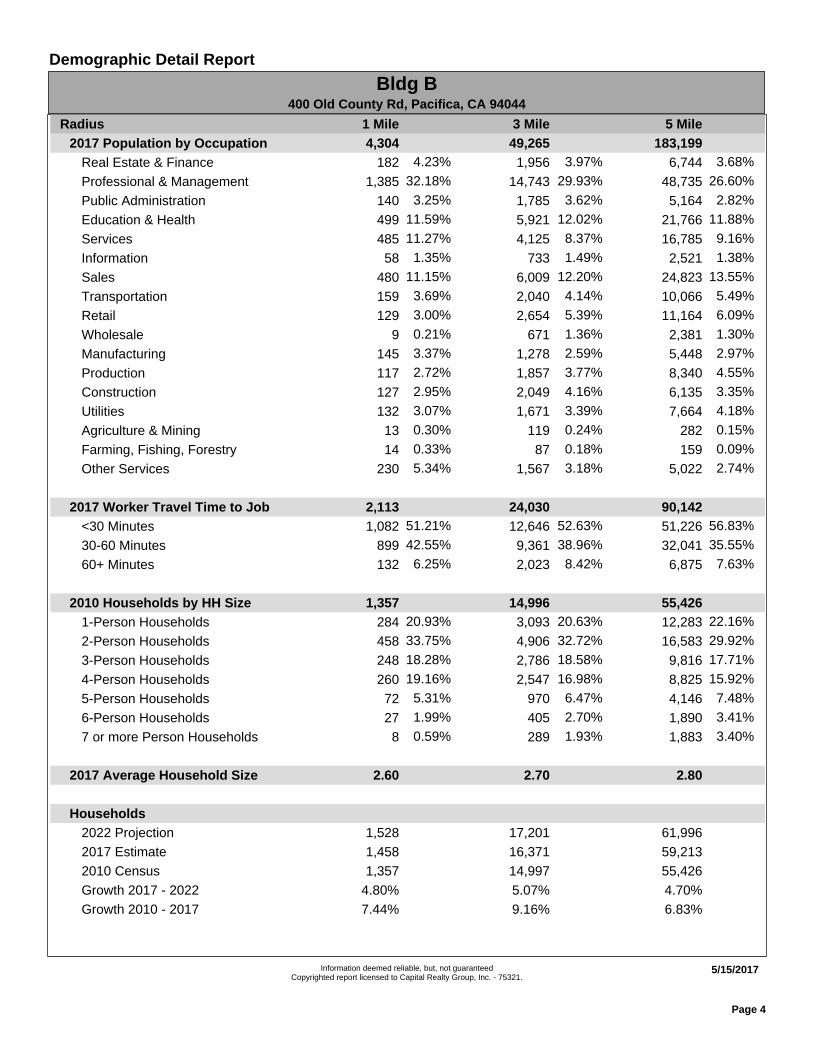
Demographic Detail Report
Bldg B400 Old County Rd, Pacifica, CA 94044
Radius 1 Mile 3 Mile 5 Mile
2017 Population by Occupation 4,304 49,265 183,199
Real Estate & Finance 182 4.23% 1,956 3.97% 6,744 3.68%
Professional & Management 1,385 32.18% 14,743 29.93% 48,735 26.60%
Public Administration 140 3.25% 1,785 3.62% 5,164 2.82%
Education & Health 499 11.59% 5,921 12.02% 21,766 11.88%
Services 485 11.27% 4,125 8.37% 16,785 9.16%
Information 58 1.35% 733 1.49% 2,521 1.38%
Sales 480 11.15% 6,009 12.20% 24,823 13.55%
Transportation 159 3.69% 2,040 4.14% 10,066 5.49%
Retail 129 3.00% 2,654 5.39% 11,164 6.09%
Wholesale 9 0.21% 671 1.36% 2,381 1.30%
Manufacturing 145 3.37% 1,278 2.59% 5,448 2.97%
Production 117 2.72% 1,857 3.77% 8,340 4.55%
Construction 127 2.95% 2,049 4.16% 6,135 3.35%
Utilities 132 3.07% 1,671 3.39% 7,664 4.18%
Agriculture & Mining 13 0.30% 119 0.24% 282 0.15%
Farming, Fishing, Forestry 14 0.33% 87 0.18% 159 0.09%
Other Services 230 5.34% 1,567 3.18% 5,022 2.74%
2017 Worker Travel Time to Job 2,113 24,030 90,142
<30 Minutes 1,082 51.21% 12,646 52.63% 51,226 56.83%
30-60 Minutes 899 42.55% 9,361 38.96% 32,041 35.55%
60+ Minutes 132 6.25% 2,023 8.42% 6,875 7.63%
2010 Households by HH Size 1,357 14,996 55,426
1-Person Households 284 20.93% 3,093 20.63% 12,283 22.16%
2-Person Households 458 33.75% 4,906 32.72% 16,583 29.92%
3-Person Households 248 18.28% 2,786 18.58% 9,816 17.71%
4-Person Households 260 19.16% 2,547 16.98% 8,825 15.92%
5-Person Households 72 5.31% 970 6.47% 4,146 7.48%
6-Person Households 27 1.99% 405 2.70% 1,890 3.41%
7 or more Person Households 8 0.59% 289 1.93% 1,883 3.40%
2017 Average Household Size 2.60 2.70 2.80
Households
2022 Projection 1,528 17,201 61,996
2017 Estimate 1,458 16,371 59,213
2010 Census 1,357 14,997 55,426
Growth 2017 - 2022 4.80% 5.07% 4.70%
Growth 2010 - 2017 7.44% 9.16% 6.83%
Information deemed reliable, but, not guaranteedCopyrighted report licensed to Capital Realty Group, Inc. - 75321.
5/15/2017
Page 4
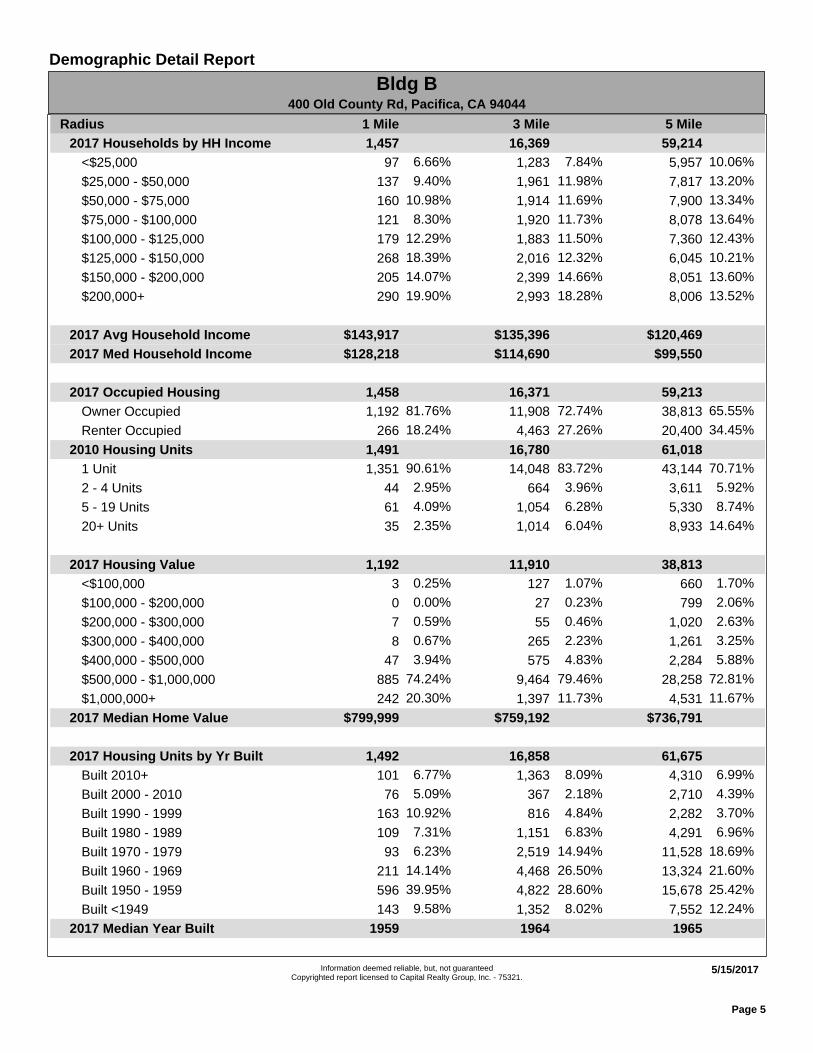
Demographic Detail Report
Bldg B400 Old County Rd, Pacifica, CA 94044
Radius 1 Mile 3 Mile 5 Mile
2017 Households by HH Income 1,457 16,369 59,214
<$25,000 97 6.66% 1,283 7.84% 5,957 10.06%
$25,000 - $50,000 137 9.40% 1,961 11.98% 7,817 13.20%
$50,000 - $75,000 160 10.98% 1,914 11.69% 7,900 13.34%
$75,000 - $100,000 121 8.30% 1,920 11.73% 8,078 13.64%
$100,000 - $125,000 179 12.29% 1,883 11.50% 7,360 12.43%
$125,000 - $150,000 268 18.39% 2,016 12.32% 6,045 10.21%
$150,000 - $200,000 205 14.07% 2,399 14.66% 8,051 13.60%
$200,000+ 290 19.90% 2,993 18.28% 8,006 13.52%
2017 Avg Household Income $143,917 $135,396 $120,469
2017 Med Household Income $128,218 $114,690 $99,550
2017 Occupied Housing 1,458 16,371 59,213
Owner Occupied 1,192 81.76% 11,908 72.74% 38,813 65.55%
Renter Occupied 266 18.24% 4,463 27.26% 20,400 34.45%
2010 Housing Units 1,491 16,780 61,018
1 Unit 1,351 90.61% 14,048 83.72% 43,144 70.71%
2 - 4 Units 44 2.95% 664 3.96% 3,611 5.92%
5 - 19 Units 61 4.09% 1,054 6.28% 5,330 8.74%
20+ Units 35 2.35% 1,014 6.04% 8,933 14.64%
2017 Housing Value 1,192 11,910 38,813
<$100,000 3 0.25% 127 1.07% 660 1.70%
$100,000 - $200,000 0 0.00% 27 0.23% 799 2.06%
$200,000 - $300,000 7 0.59% 55 0.46% 1,020 2.63%
$300,000 - $400,000 8 0.67% 265 2.23% 1,261 3.25%
$400,000 - $500,000 47 3.94% 575 4.83% 2,284 5.88%
$500,000 - $1,000,000 885 74.24% 9,464 79.46% 28,258 72.81%
$1,000,000+ 242 20.30% 1,397 11.73% 4,531 11.67%
2017 Median Home Value $799,999 $759,192 $736,791
2017 Housing Units by Yr Built 1,492 16,858 61,675
Built 2010+ 101 6.77% 1,363 8.09% 4,310 6.99%
Built 2000 - 2010 76 5.09% 367 2.18% 2,710 4.39%
Built 1990 - 1999 163 10.92% 816 4.84% 2,282 3.70%
Built 1980 - 1989 109 7.31% 1,151 6.83% 4,291 6.96%
Built 1970 - 1979 93 6.23% 2,519 14.94% 11,528 18.69%
Built 1960 - 1969 211 14.14% 4,468 26.50% 13,324 21.60%
Built 1950 - 1959 596 39.95% 4,822 28.60% 15,678 25.42%
Built <1949 143 9.58% 1,352 8.02% 7,552 12.24%
2017 Median Year Built 1959 1964 1965
Information deemed reliable, but, not guaranteedCopyrighted report licensed to Capital Realty Group, Inc. - 75321.
5/15/2017
Page 5


