Download - rifrangenzaconLockin

7/25/2019 rifrangenzaconLockin
http://slidepdf.com/reader/full/rifrangenzaconlockin 1/9
This article was downloaded by: [Michigan State University]On: 10 February 2015, At: 11:16Publisher: Taylor & FrancisInforma Ltd Registered in England and Wales Registered Number: 1072954 Registeredoffice: Mortimer House, 37-41 Mortimer Street, London W1T 3JH, UK
Molecular Crystals and Liquid CrystalsPublication details, including instructions for authors and
subscription information:
http://www.tandfonline.com/loi/gmcl18
Combined Tilt and Thickness
Measurements on Nematic Liquid
Crystal SamplesH. A. Van Sprang
a
a Philips Research Laboratories , P.O. Box 80, 000 5600, JA
Eindhoven, The Netherlands
Published online: 24 Sep 2006.
To cite this article: H. A. Van Sprang (1991) Combined Tilt and Thickness Measurements on
Nematic Liquid Crystal Samples, Molecular Crystals and Liquid Crystals, 199:1, 19-26, DOI:
10.1080/00268949108030913
To link to this article: http://dx.doi.org/10.1080/00268949108030913
PLEASE SCROLL DOWN FOR ARTICLE
Taylor & Francis makes every effort to ensure the accuracy of all the information (the “Content”) contained in the publications on our platform. However, Taylor & Francis,our agents, and our licensors make no representations or warranties whatsoever as tothe accuracy, completeness, or suitability for any purpose of the Content. Any opinions
and views expressed in this publication are the opinions and views of the authors,and are not the views of or endorsed by Taylor & Francis. The accuracy of the Contentshould not be relied upon and should be independently verified with primary sourcesof information. Taylor and Francis shall not be liable for any losses, actions, claims,proceedings, demands, costs, expenses, damages, and other liabilities whatsoeveror howsoever caused arising directly or indirectly in connection with, in relation to orarising out of the use of the Content.
This article may be used for research, teaching, and private study purposes. Anysubstantial or systematic reproduction, redistribution, reselling, loan, sub-licensing,
systematic supply, or distribution in any form to anyone is expressly forbidden. Terms& Conditions of access and use can be found at http://www.tandfonline.com/page/terms-and-conditions

7/25/2019 rifrangenzaconLockin
http://slidepdf.com/reader/full/rifrangenzaconlockin 2/9
Mol.
Cryst. Liq. Crys t . ,
1991, Vol.
199, pp. 19-26
Reprints available directly from the publisher
Photocopying permitted by license only
991 Gord on and Breach Science Publishers S.A.
Printed in the United States of America
Combined Tilt and Thickness Measurements
on
Nematic Liquid Crystal Samples
H. A. van SPRANG
Philips Research Laboratories
P.O.
Box
80.000 5600
JA Eindho ven The Netherlands
Received
July 25,
1990
A new technique
is
presented which enables simultaneous measurement of sample thickness and director
tilt of non -twisted nem atic liquid crystal cells up to abo ut 2
pm
thick. It is shown that only n nd n
the ordinary and e xtra ordin ary refractive indices
of
the liquid crystal, are required with no more than
three digit accuracy.
Keywords: Nematic liquid crystals, birefringence
It is common knowledge that on many surfaces non-zero director tilt angles can
be obtained for th e director of a nematic liquid crystal. In the course
of
time a
number of experimental techniques has been developed which ena ble measurement
of this tilt angle. Unfortunately, no such technique can be generally applied to
arbitrary samples, as all of them have their own restrictions. A summary of those
metho ds applicable to no rmal, flat sub stra te covered , test cells is presented in Ta ble
I . Th e only m ethod applicable over the whole range of tilt angles is th e m agnetic
null method.’ For use with “classical” (non superconducting) magnets of about
2
T one requires samples of more than 10 pm thickness. For studying the tilt in
samples of thickness below 10 pm we are left with either a capacitive1 or an
interferometric In both me thod s a strong dependency is observed
of
the
tilt angle obtained on the sample thickness.
We wanted to find a method which allows for accurate determination of tilt
angles without a need to measure (in a preparatory measurement) cell thickness
or capacitance
of
an empty cell because the sample thickness might easily change
during introduction of liquid crystal.
The method we propose is based on the crystal rotation method4p5but it is more
powerful due to the fact that we measure the optical phase shift instead of the
transmission as a function of the rotation angle. In Figure 1 a block diagram is
shown
of
the experimental set up. The liquid crystal sample is manufactured in
such a way that
no
twist, splay or bend are present. It can be rotated around an
axis parallel t o th e substrates. T he director is in a plane perpendicular to the rotation
axis of the sample.
The incident linear polarized light is in general elliptically polarized upon exit
[497]/19
o
w
oadedby[
c
ga
StateU
vesty]at
:6
0
ebua
y
05

7/25/2019 rifrangenzaconLockin
http://slidepdf.com/reader/full/rifrangenzaconlockin 3/9
20/[498]
H . A . V A N SPR A N G
T A B L E
I
Comparison of methods to measure tilt angles
Accessible Required
Range Accuracy
Method
0
7
8
( )
Quantities
d
(km)
References Remarks
Magneto optic null 0-90
method
Capacitive 0-90
Interferometry 15-75
Crystal rotation
0-13
77-90
Conoscopy 0-17
73-90
0.1
- >10 1 Only for non-twisted
0.1
co E l l E L - 1 Requires C,, meas. on
samples
empty cell; suited for
twisted samples
before and after filling
structures
0.5 d ,
n
r q I 2, 3 Requires d to be constant
0 . 2
n
4 1 >10 4 8 < 9 in twisted
0.2 n n >20 6
e -
Ne
PD
\
Computer Phase meter
F I G U R E
1
Block diagram
of
the experimental set-up. He-N e indicates a He -N e laser, B a Beam
expan der, P a fixed polarizer, Q a qua rter waveplate, RA a rotating analyser and
PD
a photodetector.
The rotation of the sample (Motor Drive M.D.) and the applied voltage V are controlled by a Micro
computer.
from th e sa mple . Th e q uarter wave plate transforms it into linear polarized light
with a rotation of the plane
of
polarization equal to
6 .
This value
is
then measured
using a rotating analyser as described before in Reference 7.
T he expression for the ph ase difference in term s of t he angle
of
incidence 4 with
the s ubstra te normal and th e director til t
0
with respect to the s ubstra te is. '
where
n 2 = nzcos%
+
nSsin20
ow
oadedby[
c
ga
StateU
vesty]at
:6
0
ebua
y
05

7/25/2019 rifrangenzaconLockin
http://slidepdf.com/reader/full/rifrangenzaconlockin 4/9
TILT
A N D
THICKNESS MEASUREM ENTS
[4991/21
c
m
.
145
?
3
0
It is this equa tion which is used directly in ou r proce dur e. First, the ph ase difference
6 is measured for a scan of from -30 to 30 . The second step is a fit of these
data to the above equation using
d
and
8
as unknown variables. This leads to an
almost independent determination of d and 8 due to the fact that both variables
occur in a different way in the exp ression for
6.
Obviously d is directly prop ortio nal
to 6 and determines the position
of
the 6-+ curve on an absolute scale while 0
determines the sha pe of th e curve. As can be learnt from th e expression for 6 only
n
and
no
are left as known param eters. W e measured the relevant indices
in
a
slightly modified Pulfrich Refractometer which has an accuracy
of
better than
1.
In Table
I1
we present the refractive indices for ROTN 3010 aro und room
temp erature . This liquid crystal has been used in all samples presented h ere .
Th e fit
of
the experimental data to the theoretical formula is performed on an
IBM mainframe computer using standard
IMSL
Fortran software.
A
typical
ex-
ample
of
the results is shown in Figure
2
for a 1.91 p m hick cell with a Polyimid
orienting layer.
Obviously there is a scattering
of
the experimental data a round the fi t ted results,
expressed as a standa rd deviation
of
0.98. In Figure 3 we show the results for an
TABLE I1
Refractive indices
for
ROTN 3010 at A = 632 nm
-
20.0
20.5
21
.o
21.5
22 .0
22.5
23.0
23.5
24.0
24.5
25.0
1.6391
1.6387
1.6384
1.6380
1.6376
1.6372
1.6369
1.6365
1.6361
1.6357
1.6354
1.4984
1.4983
1.4981
1.4980
1.4979
1.4978
1.4971
1.4976
1.4975
1.4974
1.4973
Angle of incidence
( )
IGURE
2
Phase Retardation versus rotation angle
for
a
1.91
p m
thick
PI
cell
with
8
=
0.27 .
Measured at
22.2 C.
o
w
oadedby[
c
ga
StateU
vesty]at
:6
0
ebua
y
05
7/25/2019 rifrangenzaconLockin
http://slidepdf.com/reader/full/rifrangenzaconlockin 5/9
221[500]
H . A. VAN
S P R A N G
-40 -20 0 20 0
Angle
of
incidence ( )
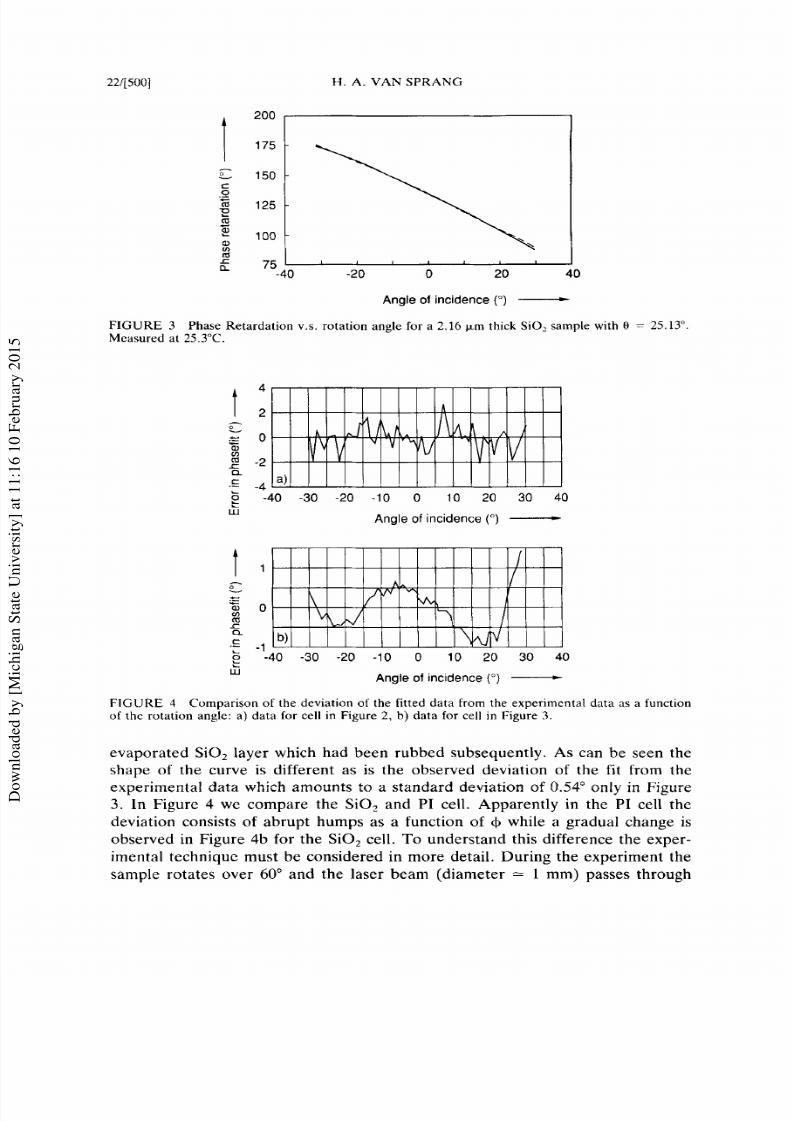
I G U R E
3
Phase Retard ation V. S. otation angle for a 2.16 prn thick SiO, sample with = 25.13 .
Mcasured at
25.3 C.
4
-
2
e
c 0
a
m
c
, -2
40 -30
-20 10 0 10 20 30 40
Angle
of
incidence ( )
j
e
w
40 -30 -20 10 0 10 20
30
40
Angle
of
incidence
( )
I G U R E 4
of thc rotation angle: a ) data
for cell
in Figure 2,
b)
data for cell in Figure 3.
Comparison
of
the deviation of the
fitted
data from the experimental data
as
a function
evap orated SiO z layer which had b een rubbed subsequently.
As
can be seen the
shape of the curve is different as
is
the observed deviation of the fit from the
experimental d ata which a mo unts to a standa rd deviation of
0.54
only in Figure
3 .
In Figure 4 we compare the
SiOz
and
PI
cell. Apparently
in
the PI cell the
deviation consists
of
abrupt humps as a function
of
+ while a gradual change is
observed in Figure 4b for the SiO, cell.
To
understand this difference the exper-
imental technique must be considered in more detail. During the experiment the
sample rotates over
60
and the laser beam (diameter L 1 mm) passes through
ow
oadedby[
c
ga
StateU
vesty]at
:6
0
ebua
y
05

7/25/2019 rifrangenzaconLockin
http://slidepdf.com/reader/full/rifrangenzaconlockin 6/9
TILT AN D THICKNESS MEASUREMENTS [501]/23
slightly different positions at the liquid crystal-orienting layer interface. From the
photographs in Figure 5 it
is
immediately clear that PI is much less homogeneous
at a microscopic scale than is SO,. Thus inhomogeneity is supposed to be the
reason for
the
substantial noise in PI samples. Although individual differences
occur, it is generally true that SO, cells exhibit a more gradually changing noise
F I G U R E 5
Micro photographs showing the structural difference between: a)
PI
oriented and
b)
rubbed SiO, oriented samples. The photographs were taken under dark-field illumination and using
crossed polarizers. (Magnification 100
x .
See Color Plate
I.
o
w
oadedby[
c
ga
StateU
vesty]at
:6
0
ebua
y
05

7/25/2019 rifrangenzaconLockin
http://slidepdf.com/reader/full/rifrangenzaconlockin 7/9
24/[502) H.
A.
V A N SPR A N G
480
470
460
% 450
P
??
440
430
c
._
m
w
l
m
as a function of
d
than PI samples. Figures 6-8 contain furthe r illustrations of the
method.
Although th e me thod is powerful,
it
also has its limitations. W e can sum marize
them as follows:
1.
Fo r cells with
6
(632 nm)
>
360 , or equivalently
d8n
>
1.58
pm , it is necessary
to know the absolute value
of
6 and not th e value modulo (360 ) as determin ed
in the setup of Figure 1. For this reason we use samples supplied with I T 0
electrodes t o which an increasing voltage up to 1OV is applied. The number
of times a 360 phas e jum p is enco untere d is registered by the com puter and
used t o determ ine 6 at + = 0. Fo r samples much thicker than 20 p the phase
jumps might occur within a too small voltage range and hence the 6 value
could be wrong by 360 o r mo re.
2. As discussed before a certain inhomogeneity might lead to a higher noise
level. This d oes no t se em to greatly influence th e accuracy of t he fitted results.
3. Th e accuracy
of
the refractive index data
is
very impor tant to obtain accurate
-
I I I I I
I
C
R1
.-
350
400 I
00
250
I
I
I I
I I I
40
-20 0
20
40
Angle
of
incidence ( )
I GURE
7 Phase retardation
vs
rotation angle
for
a
61.8
pm
SiO z cell with
8
=
22.85 .
Measured
at 25.0 C.
o
w
oadedby[
c
ga
State
U
vesty]at
:6
0
ebuay
05

7/25/2019 rifrangenzaconLockin
http://slidepdf.com/reader/full/rifrangenzaconlockin 8/9
T I L T A N D
THICKNESS
MEASUREMENTS
[503]/25
m
a
.
c
E
s?
%
a
m
.c
1200
1000
800
600
400 I I
I
I
I I
I 1
Angle
of
incidence (”)-
40 -20
0 20 40
F I G U R E
8
Phase Retardation
vs
rotation angle for a
14.59pm
SiOz cell with
0 = 30.47”.
Measured
at 2 .4”C.
T A B L E
Influence
of
the variation
of
n and n
n
the obtained
0
and
d
values
n
110
6 “1
d
l.4
1.6353
1.4973 22.85 6.82
1.635
1.498 22.87 6.87
1.635
1.497 22.85 6.82
1.635
1.496 22.83 6.77
1.636
1.497 22.84 6.77
1.634
1.497 22.85 6.87
1.634
1.498 22.87 6.92
1.636 1.496 22.82 6.72
1.655
1.517 23.14 6.84
T A B L E
IV
Variation
of
n and
no
for a thin sample
n
n0 f
“1 d ( w )
1.6351 1.4972 25.13 2.16
1.635
1.497 25.13 2.16
1.636 1.498 25.15 2.16
1.636 1.496
25.10
2.13
1.634
1.498 25.16 2.19
8
and d values from the fit. In Table I11 we show how
n,
and noinfluence the
results for the data of Figure 7. In general this allows for the conclusion that
for values of n and nowithin 1 from their exact value an accuracy in e
is
still obtained of better than 0.1 deg while the thickness is more accurate
than
0.1
pm. From Tables
IV
and
V
similar results can be extracted for the
data displayed previously in Figures 4 and
6
respectively. Thus in general the
same conclusions hold independent of tilt or thickness.
Concluding we can say that the method is apparently accurate enough for appli-
o
w
oadedby[
c
ga
StateU
vesty]at
:6
0
ebua
y
05

7/25/2019 rifrangenzaconLockin
http://slidepdf.com/reader/full/rifrangenzaconlockin 9/9
26/[5041
H. A . V A N SPR A N G
T A B L E V
Variation of
0
and d with n , and n
1.6380 1.4980 1.33 5.89
1.637
1.499 1.33 5.98
1.639
1.497 1.32 5.81
1.64
1.50 1.33 5.89
cation to ex perim enta l samples without twist having a tilt b etween
0-90
degrees
and a thickness up t o abou t 20 p m .
Inhomogeneity of the orienting layer leads to noise in the experimental data
which does not significantly influence the results of the fit. The method described
abov e yields a reliable way
to
de ter m ine bo th tilt angle and thickness in cells which
are made under normal
T N
processing conditions but without a twisted director
pattern.
References
1
T .
J .
Scheffer and J. Nehring,
J. Appl.
Phys. , 48
5 1977)
and references therein.
2 .
R. Simon and D. M. Nicholas,
J.
Phys. D . , 18 1423 1985).
3. T. Opara ,
J .
W . Baran and J. Zmija, Crysr.
Res. Techn. 23
1073 1988).
4 . B. B . Kosmowski, M. E . Becker and D. A. Mlynski. Displays April 1984, 104.
5. A . Komitow, G . H a w k a nd
H.
D . Koswig, Cryst.
Res. Techn.
19, 253 1984).
6. W. A. Crossland,
J . H.
Morrissy and B. N eedham,
J. Phys. D., 9 2001 1976).
7.
H .
A. van Sprang,
J
Physique
44.
421 1983).
o
w
oadedby[
c
ga
StateU
vesty]at
:6
0
ebua
y
05


