
1
South Australian Resource Recovery Study Tour Summary
May 20th -‐ 22nd 2015
Introduction In May 2015, Envision NZ In association with Zero Waste South Australia (ZWSA) and Keep South Australia Beautiful (KESAB) led a Resource Recovery Study Tour to South Austraslia. 21 participants joined us from all over New Zealand, representing local government, private enterprise and community organisations on a jam-‐packed study tour of resource recovery facilities and initiatives in Adelaide, South Australia.
The comprehensive tour included site visits to a range of facilities that make up the South Australian (SA) resource recovery system including:
• Wingfield Waste Precinct • Statewide Recycling Super Collector • Welland Waste • Buckland Park Compost Processing Plant • Northern Adelaide Management Authority’s (NAWMA) new resource recovery facility • Watershed Sustainability Centre • Visy MRF • E-‐Cycle e-‐waste processing plant

2
• East Waste regional subsidiary • SITA Resource-‐Co.
Alongside the informative tours provided at each of the sites, expert dinner and breakfast speakers provided more detail and overview on South Australia's resource recovery system. Speakers represented: Keep South Australia Beautiful, One World Environmental Solutions, SA Government agency, Zero Waste South Australia, Zero Waste International Alliance, the Environmental Protection Authority and Salisbury Council, Waste Management Association of Australia and an international speaker from Zero Waste International Alliance.
About Zero Waste South Australia, Vaughan Levitske, CEO The state introduced its Container Deposit Legislation 30 years ago. Residents can take back beverage containers to over 130 collection/drop-‐off points for the 10-‐cent refund. In order to reduce the State’s over-‐reliance on landfill, legislation was passed in February 2004 to create the office of Zero Waste SA, a statutory authority of the South Australian Government. Zero Waste SA has provided the leadership, regulations and resources to enable the state to achieve a 74% reduction in waste to landfill. South Australia has a population of 1.5 million people (1.3m metro, 200,000 outback) and 96% of households/hotels etc are engaged in resource recovery in the state. Average annual rainfall in SA is 544mm. About KESAB (Keep South Australia Beautiful) John Phillips, CEO Established in 1966, KESAB environmental solutions is a leading NGO offering a wide range of environmental sustainability education and engagement services to government, private enterprises, schools and the community. KESAB’s focus is on resource recovery, recycling, waste diversion, waste management and training. KESAB also provide accredited waste auditing and services and have also carried out successful surveys conducted state and national litter surveys for the Australian and South Australian Governments for many years. A large part of their focus is on education, in the development and delivery of curriculum based school resources, lessons and teacher development, in-‐school activities, water conservation and catchment management and NRM Education (Natural Resource Management). KESAB pride themselves on taking a unique and entrepreneurial approach to their way of doing business.

3
Summary of Site Visits
Wingfield KESAB Education Centre and Waste Precinct
• Built on a reclaimed landfill site (landfill closed in 2004). Council owned the landfill and it was sold in five blocks
• Excellent setup as has everything around it • NSW prefer reverse vending machines – these can work if manned, can have problems with
vandalism. • Site is surrounded by fragile ecosystems, have to be extra aware of storm water runoff and
leachate • Education Centre runs a lot of tours and programs with teachers and community groups • Still old school mentality that don’t believe recycling actually happens, good to get them to the
site to see for themselves • Charge $110-‐$120 at the gate ($74 waste levy) • 187 nationalities in SA • Also have door knockers that target areas of the community to educate about recycling • Scouts have 10 centres and an annual
turnover of $35m/year. Won the tender for seven years plus three.
Jeffries Organics Transfer Station • Jeffries grew from soil not waste industry, their objective is to sell valuable, quality soil, not
primarily to process waste. Also now process wooden pallets into landscaping medium • Fourth generation, South Australian family owned business, est. 1934. Started carting horse
manure • 46% of household bin waste is organics • Pallet pile, no treated timber, processed, then separated by colour • No single-‐use plastic bags in SA • They have problems with biodegradable bags, they want people to choose compostable bags • Still a lot of work to do educating community – still those that throw in garden pots, pipes, bags
etc. Education is beginning to work –resulting in reduced contamination • Operate on a carrot not stick mentality • They accept the food and green waste here before it processed and taken to their main site
nearby • They have large liquid pits for grease that they use the mulch to soak up and use for capping • Charge $10-‐$15 m3 for mulch product for large clients, wineries etc. • Charge $120-‐$130 m3 for premium potting product • Compost weighs 700kg/m3, mulch weighs around 500kg/m3.
FKESAB Education Centre at Wingfield Resource Recovery Precinct

4
ARR Adelaide Resource Recovery • Construction and Demolition (C and D) waste recycling • 2000 tonnes received each day -‐ recycle 85% of what comes in • Offers affordable recycled building materials to building, construction and engineering firms
throughout South Australia • Processed recycled concrete aggregates are used under houses and roads • Sand and gravels used as aggregates • Magnets used to pull out reinforcing and then sold as scrap metal • 100% privately owned, used to be hand sorted. Machine from Netherlands cost $8m, separates it
by size • People pick down a conveyor belt the large pieces, air vacuum sorts medium items, water vat
used to float paper and blows them across • Plastics baled up, they send a container every 3 days to China • Paper sent to mills to make more paper • Machines are high maintenance -‐ carpet, insulation, toys, polystyrene and video tapes bad for
machines • 450 tonnes through machine/day.

5
TPI Waste Care Transfer Station • The Wingfield facility is operated by Transpacific. They use recycling and resource recovery
techniques, which ensure ferrous and nonferrous metals, timber, cardboard organics and concrete are sustainably recycled.
• They accept general waste, C and D, domestic and hard waste, electronic, green, scrap metal and tyres. They do not accept grease trap, radioactive, quarantine, medical or friable asbestos.
Statewide Recycling Super Collector • Owned by Coca Cola. Established in 1977 by two
beverage manufacturers (Coca Cola and Schweppes)
• A notably very clean operation with very clean baled product which demands higher prices than recycled commodities from other states due to the cleanliness and almost zero contamination as
• Largest super collector in SA and NT in terms of the size of the customer base it represents and the volume of recyclable containers that it processes
• Sorts CDL returned bottles (plastic and cans) • 17,000 cans/ block, PET 13,000/block • Have 20 buyers who tender for blocks each month, from China, Indonesia and Australia • Tonnes sent to China/ Indonesia 2014/15:
PET 3450 Aluminion 2290 LPB 620 HDPE 295 Glass – (recycled in Australia) Steel cans 15
• 700m containers processed from CDL/year.
Photos above: Examples of the clean product that comes out of the SA Container Deposit system and which commands a premium price over materials from other states that don’t have CDL.

6
Welland Waste • Private, family owned business, no grants or assistance and making a go of resource recovery
through innovation and providing a range of services to the public • The site is effectively a mini resource recovery park • Operate a bottle deposit drop off which represents 10% of the sites’ business • Has a copper stripper machine that strips the plastic off electrical wires (7% of business) • Timber retail sales (10% of business) • Operates as a private transfer station, sells scrap metal and hires out skip bins.
Above left: Sorting botles for refunds at Welland waste. Above right: Auckland Councillor George Wood and John Dragicevich, Director Civil Defence and Emergency Management at Auckland Council pose with a happy customer who has just received $27.20 for his boot load of bottles
Dinner Speakers Vaughan Levitske (Chief Executive ZWSA) Geoff Johnston (One World Environmental Solutions Pty Ltd)
Buckland Park Compost Processing Plant • Jeffries main compost processing site, 88ha • Cell A, food material from households, restaurants, Coles supermarkets • Windrows system, two pipes underneath, heated to 65°C, sprinklers run across piles, air is sucked
in under pipes, Cell B, kerbside green material • Coloured wood chips made from processed recycled untreated pallets, Magnets pull nails out of
timber • Machine called ROSS (Recycling Organics Screening System), damaged in a recent fire, will be
rebuilt with improvements. Uses a combination of specialized screening discs, extraction fans, magnets and 192 air jets to remove inorganic items and further refine the recycled organic material. Non compostable items are then separated and also recycled where possible
• Pelicans keep warm on top of the compost piles • Contamination is very low due to education, plastic bags etc • Whole site is not on mains water. Water collected in ponds and tanks, used to water compost
piles and wash trucks • Make made-‐to-‐order horticultural blends, for example with extra lime for a specific crop • There is a two week wait for orders at peak demand • Health risks taken very seriously – PPE well stocked, vaccines, gas masks, uniforms etc.

7
NAWMA (Northern Adelaide Waste Management Authority) transfer station • NAWMA is what is known as a Regional Subsidiary and is owned by three councils • Demonstrates how local government and industry can work together for excellent results • VISY Recyclers operate the plant and are responsible for sourcing markets and selling products • Population served 250,000, 110,000 households, includes 12 rural councils • Process 80,000 tonnes/year • Business is customer service, waste and recycling • They have a drive through Public Waste Transfer Station for people to bring their own waste
products including materials for recycling. All materials go over a slow moving conveyor so that recyclable and reusable materials can be pulled out
• SA Scouts operate a Bottle buy-‐back centre at the site which unlike the other sites has an automated bottle sorting/counting machine
• The “Salvage and Save” retail operation offers quality second hand building and household products to the community
• Good location of site, with industries building up around it and a large residential customer base • By 2026 the landfill 11km away will be full • 1.4tonnes/m3 in a compacted bale for landfill • Do not have a problem with birds, because they do not like the compacted bales. • Education Centre about to be renovated/ moved. • Take older kids to the Uleybury landfill to see it from viewing platform • Younger kids visit and this captures the parents interest as well • 25 trucks, all run on CNG (Compressed Natural Gas), not hybrids • Site has own refueling station, so can set own prices and benefits environment • Profile of waste changes across areas:
o Average household in Australia produces 18.5kg of waste/week o Higher socio economic areas 22kg/week o 16kg/week in elderly populations
• 2013-‐14: o 21 tonnes of material salvaged and sold in Salvage and Save Shop o 362 tonnes of steel collected and sold o 2567 mattresses processed with springs and foam marketed o 76 tonnes of recyclables (cardboard, mattress foam) marketed o 352 tonnes of electronic waste recycled o 24,400 litres of waste oil recycled o 745 tyres were recycled o 9 tonnes of car batteries recycled o 3042 tonnes of garden waste transported to Jeffries for processing into a compost product o 2636 tonnes of residual waste transported to SITA Resource Co for processing into fuel.
8
Above left: Residential and commercial waste is dropped on to a moving floor at the Buckland Park facility enabling reusable and recyclable items to be removed before waste is transferred to landfill
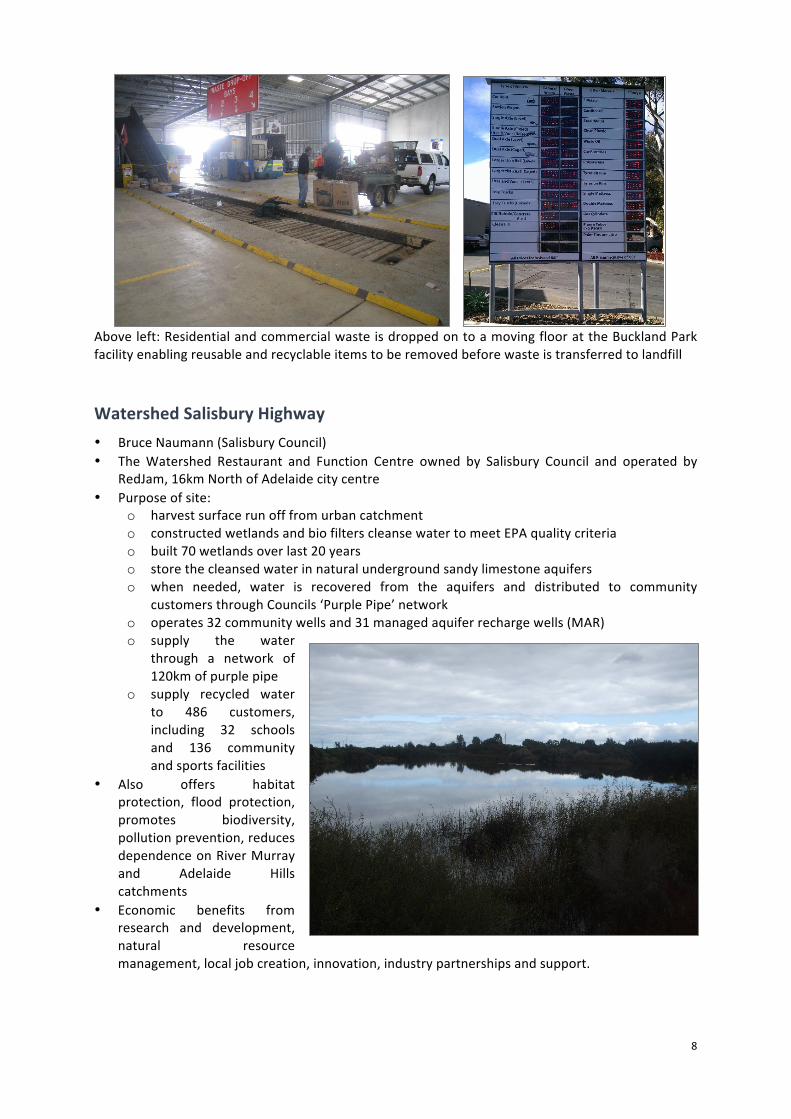
Watershed Salisbury Highway • Bruce Naumann (Salisbury Council) • The Watershed Restaurant and Function Centre owned by Salisbury Council and operated by
RedJam, 16km North of Adelaide city centre • Purpose of site:
o harvest surface run off from urban catchment o constructed wetlands and bio filters cleanse water to meet EPA quality criteria o built 70 wetlands over last 20 years o store the cleansed water in natural underground sandy limestone aquifers o when needed, water is recovered from the aquifers and distributed to community
customers through Councils ‘Purple Pipe’ network o operates 32 community wells and 31 managed aquifer recharge wells (MAR) o supply the water
through a network of 120km of purple pipe
o supply recycled water to 486 customers, including 32 schools and 136 community and sports facilities
• Also offers habitat protection, flood protection, promotes biodiversity, pollution prevention, reduces dependence on River Murray and Adelaide Hills catchments
• Economic benefits from research and development, natural resource management, local job creation, innovation, industry partnerships and support.

9
Visy Material Recovery Facility (MRF) • Without CDL, glass is 30% of comingled composition, 50% paper, 10% plastic/steel/aluminum • With CDL, 15% glass, 65% paper • They need 99.9995% pure glass and would prefer it was separated at kerbside • They can earn $9000/tonne for CDL aluminum • CDL items touched twice during processing – first to be pulled out, second to be drained/ lid off • Operates at 25-‐30 tonnes/hour output • Employs 50 people across two shifts • Contamination rate changes with socio economic regions and day to day
E-‐Cycle • They are responsible e-‐cyclers. They do not send materials overseas • Old TVs had lead in them (4kg), new ones have mercury in them (5-‐50mg) • Federal government initiated a national stewardship scheme for e waste, but drop off volumes
were in excess of expectations, funding has now run out and a number of e-‐waste recyclers have shut down as a result
• Trial was funded for 45% of weight of material sold, targets were too low due to variances between old and new appliances and TVs
• They offer free drop off and have 30 people dismantling at peak times
• Manufacturers pay into fund at Super Collector who pay E-‐Cycle
• Selling scrap metal only off sets costs
• They are still accepting e waste but are telling people where possible to take it to the Super Collector because they are currently operating at a loss.
East Waste – Regional Subsidiary • Six Councils collectively own East Waste as a ‘Regional Subsidiary’ • 48 staff and 1 manager (includes 38 drivers) • 180,000 bins collected/ week • 955 of bins retuned upright with lids closed • Introduced GPS four years ago • Introduced RFID tracking one year ago – mostly used for customer service, for example if bin is
not out on time, stolen, contaminated etc • Benefits of RFID:
o RFID can alert driver if entering a street too early or if it is a street they cannot turnaround in o Reduces the number of mistakes, improves efficiency, allows for a more mature conversation
with community o They can target specific streets that need more education (with KESAB) o Can locate stolen bins o Can show photo evidence if bin not put out on time

10
o Some councils have a 2/3 strikes policy, use letters, email photos etc try to educate customer before it escalates
o Allows real time data and highlights forgetful residents, overfilled bins, unapproved bins, litter around bins. Showed example of two cars parked by bin blocking it
• They would need to move the placement of the bin tracker if they were to charge customer per tip (looking at doing that)
• Be prepared when introducing the RFIS system to community, all about positive education • Booking system for inorganics takes care of health and safety and scavenging • 20% of residents use it • Illegal dumping has not increased • First inorganic pick up free, second $20-‐$30 dependent on Council • Trucks are not kept longer than seven years, after that they are not worth the maintenance and
they need to look well maintained – improves council’s reputation, low emissions etc.
SITA Resource-‐Co • Produces alternative fuels from construction and demolition waste • Established 21 years ago • They receive construction and demolition waste. It is a mix of timber, metals, plastics, cardboard
and paper. It may also include small amounts of concrete, brick and rubble They remove concrete and asphalt waste and process separately
• The material is sorted, and then ferrous and non-‐ferrous metal, inert fractions (bricks, concrete etc) and non-‐recyclables are removed from the combustible portion of this material stream. The combustible material is then processed for manufacturing of Processed Engineered Fuel (PEF)
• The Wingfield site has the capability to convert up to 350,000 tonnes of raw material per annum into 100,000 to 150,000 tonnes of PEF. Over 90% of the material they receive is recycled
• PEF has a significant calorific value and can be used as a coal and gas replacement in high combustion facilities
• The sue of PEF can benefit end users in two ways: o The energy replacement value from the utilizing PEF instead of traditional fossil fuels o The carbon and renewable energy benefits: through reduced fossil fuel use, the
reduction in landfill emissions and the Renewable Energy Certificate obtained • Only one in SA, operating over seven sites • Sells recycled aggregate through pre mixed concrete • $35m investment to build facility, just had a $3-‐8m upgrade • Supply Adelaide Brighton Cement (ABC) only 5km away, about 70,000 tonnes going up to
120,000 tonnes once refurbishment at ABC finished. They send five loads a day to ABC. • 5% goes to landfill • They sell the scrap metal (about 9000 tonnes per year)

11
• Concrete and bricks go to ResourceCo who pay for it • 500-‐600 tonnes/ day received, but can process double that.
Thursday Evening Dinner Speakers Andrea Woods (EPA) Team leader of CDL Unit Mark Rawson (President of Waste Management Association of Australia) John Phillips (KESAB) Rick Antony (ZWIA)
Friday Morning Breakfast speakers Tony Circelli (SA EPA Chief Executive) Warren Snow, Envision, Tour wrap up
Comments on key features of South Australia’s Resource Recovery System
The tour highlighted many aspects of the South Australian Resource Recovery System some of which are commented on below:
Leadership and Vision
Participants on this tour heard government, industry and community leaders outline how the South Australia resource recovery system operates. In listening to these leaders it was clear that the strong leadership and vision provided by Government has created an environment, which has fostered collaboration and innovation in the industry and buy-‐in from the general public.
Network Effect
A smart mix of incentives and disincentives in South Australia has fostered the development of network of businesses operating resource recovery facilities right throughout Adelaide and neighbouring cities. The effect of this network ensures that no matter what waste you have to dispose of, there is always a resource recovery option within a reasonable distance that’s cheaper than sending it to landfill. Even the transfer stations provide a range of reuse and recycling facilities and are proactive at encouraging the public to do the right thing. This wide distribution of multi-‐material resource recovery options creates a network-‐effect which results in over 70% of all South Australia’s waste being recovered and reused or recycled.

12
Container Deposit Scheme
South Australia has had a container deposit scheme for over 40 years. We visited two sites (Welland Waste, a privately owned recycling centre and one operated by the SA Scouts), where we saw first-‐hand the public redeeming bottles, cans and Tetra-‐Pak containers and receiving payment in return. Success of the South Australian deposit scheme has also inspired Northern Territories to develop their own scheme in recent years with New South Wales and Queensland also looking at jumping on board.
Reduced Litter
A number of tour participants noted the low amounts of litter that could be seen on the streets as we drove around. South Australia has the lowest litter rates in Australia and this has been attributed to the impact of the State’s bottle deposit scheme.
Regional Subsidiaries
Regional Subsidiaries (Local Government commercial enterprises) are a unique South Australian operation whereby two or more Local Authorities set up a Joint Venture company to compete in the market offering a range of waste and resource recovery services. The group visited East Waste a wholly owned subsidiary of Eastern Waste Management Authority, owned by six South Australian councils. The company provides services on a competitive basis to its six owner councils and also to client councils.
Thank you
Envision would like to thank Zero Waste South Australia, Keep South Australia Beautiful, The South Australian Environmental Protection Authority and One World Environmental Solutions for all of the help with planning and making the tour such a success.
We also thank the various site operators who welcomed us on to their sites and provided excellent commentary.
And of course we thank all of the tour participants for being such a great group for keeping up with the very tight and full programme and for being such a great group to travel with!!
envision I new zealand ltd. P.O. Box 31-478 Milford, Auckland 0749 New Zealand Ph: +64 9 303 4746 Cell: +64 21 611 923 www.envision-‐nz.com

13
Notes provided by the EPA: The Environment Protection Authority (EPA) is the regulatory agency administering the Container Deposit Legislation (CDL) in South Australia. The scheme operates under Div 2 – Beverage Container provisions within the Environment Protection Act, 1993 (the Act). The CDL team consists of a Team Leader and 2 Compliance Officers. Our role includes:
• assessing applications and beverage container labels • maintaining approvals database • answering enquiries from industry, the community and other jurisdictions • promotion of CDL • retail and depot inspections to detect non-‐compliance
CHALLENGES Interstate Containers S69C -‐ It is an offence for any person to present containers for the purpose of claiming a refund where those containers were not purchased in South Australia Maximum penalty of $30,000. Parallel Importing S69B – It is an offence for beverage suppliers to sell a beverage without a Waste Management Arrangement in place for the provision of the refund and the recycling of the container. Retailers that “parallel import” try to source cheaper beverages from suppliers outside SA, usually delivered to an interstate address and then transported to SA for sale.
As at May 2015 total number of Beverage Container approvals 17,500
Number of Beverage Container approval holders (beverage suppliers) 640
Number of approved Collection Depots in SA 126
COMPLIANCE STATISTICS 2013/14 YTD
Beverage Container Labels approved 3484
CDL Retail Inspections 382
Failed Retail Inspections (premises at which non-‐compliant containers were detected)
87
Total non-‐compliant containers detected at inspections -‐ Representing total number of beverages removed from sale (estimate)
577 74,500
Cautions/Formal Written Warnings issued 77
Expiations Issued ($360 fine) 7
CDL Depot Inspections 43

14
CONTAINER TYPES – TOTAL RETURNS 2013/14 Glass Aluminium PET HDPE LPB Total
No. of containers returned
166,488,431 260,737,595 109,941,908 9,333,807 36,635,181 583,136,922
Tonnes 36,510.59 3,760.14 3,799 196 749 45,014.73 Return Rates
2013/14
Glass Aluminium PET HDPE LPB Combined
86.3% 84.3% 70.5% 56.4% 61.9% 79.5% SUMMARY 2013/14 Return rate 80% 583 million containers returned for refund 45,000 tonnes kept out of landfill and litter stream $58 million in refunds returned to South Australians
EPA FEES On 1 July 2011, the EPA introduced fees for: -‐ Beverage container applications for approvals -‐ Collection depot approvals/variations -‐ Annual fees for collection depots -‐ Super collector approvals -‐ Annual fees for super collectors
69.5 70.6 69.9
75.8
80.1 80.4 81.4 80.8 79.5
62 64 66 68 70 72 74 76 78 80 82 84
2005/06 2006/07 2007/08 2008/09 2009/10 2010/11 2011/12 2012/13 2013/14
Percen
tage
Year
Beverage Container Return Rates SA Refund increase from 5 cents to 10 cents September 2008

15


![[C2] DZIKUS Andre_ADB South-South PPP Draft Final](https://cdn.vdocuments.pub/doc/165x107/577ce4771a28abf1038e6af7/c2-dzikus-andreadb-south-south-ppp-draft-final.jpg)


