Download - Tsn cagny 2017 presentation slides
Strong Today, Leading for TomorrowConsumer Analyst Group of New York (CAGNY)
February 21, 2017
Tyson Foods
Forward Looking Statements
Certain information contained in the press release may constitute forward-looking statements, such as statements relating to expected performance,
and including, but not limited to, statements appearing in the “Outlook” section and statements relating to GAAP EPS guidance and adjusted EPS
guidance. These forward-looking statements are subject to a number of factors and uncertainties which could cause our actual results and
experiences to differ materially from the anticipated results and expectations expressed in such forward-looking statements. We wish to caution
readers not to place undue reliance on any forward-looking statements, which speak only as of the date made. Among the factors that may cause
actual results and experiences to differ from anticipated results and expectations expressed in such forward-looking statements are the following: (i)
the effect of, or changes in, general economic conditions; (ii) fluctuations in the cost and availability of inputs and raw materials, such as live cattle,
live swine, feed grains (including corn and soybean meal) and energy; (iii) market conditions for finished products, including competition from other
global and domestic food processors, supply and pricing of competing products and alternative proteins and demand for alternative proteins; (iv)
successful rationalization of existing facilities and operating efficiencies of the facilities; (v) risks associated with our commodity purchasing activities;
(vi) access to foreign markets together with foreign economic conditions, including currency fluctuations, import/export restrictions and foreign
politics; (vii) outbreak of a livestock disease (such as avian influenza (AI) or bovine spongiform encephalopathy (BSE)), which could have an adverse
effect on livestock we own, the availability of livestock we purchase, consumer perception of certain protein products or our ability to access certain
domestic and foreign markets; (viii) changes in availability and relative costs of labor and contract growers and our ability to maintain good
relationships with employees, labor unions, contract growers and independent producers providing us livestock; (ix) issues related to food safety,
including costs resulting from product recalls, regulatory compliance and any related claims or litigation; (x) changes in consumer preference and
diets and our ability to identify and react to consumer trends; (xi) significant marketing plan changes by large customers or loss of one or more large
customers; (xii) adverse results from litigation; (xiii) impacts on our operations caused by factors and forces beyond our control, such as natural
disasters, fire, bioterrorism, pandemics or extreme weather; (xiv) risks associated with leverage, including cost increases due to rising interest rates
or changes in debt ratings or outlook; (xv) compliance with and changes to regulations and laws (both domestic and foreign), including changes in
accounting standards, tax laws, environmental laws, agricultural laws and occupational, health and safety laws; (xvi) our abi lity to make effective
acquisitions or joint ventures and successfully integrate newly acquired businesses into existing operations; (xvii) cyber incidents, security breaches
or other disruptions of our information technology systems; (xviii) effectiveness of advertising and marketing programs; and (xix) those factors listed
under Item 1A. “Risk Factors” included in our Annual Report filed on Form 10-K for the period ended October 1, 2016.


STRONG TODAY,
LEADING FOR TOMORROW
AGENDA
1
2
3
BUILDING A MODERN
GROWTH PORTFOLIO
LEADING THE WAY IN
FOOD SUSTAINABILITY

STRONG TODAY
LEADING FOR
TOMORROW

STRONG TODAY
Consistent EPS Growth
FY12 FY13 FY14 FY15 FY16 FY17 proj.
$3.15*
$2.26*
$2.94*
$4.39*
$4.90 – 5.05**
$1.97*
*Represents a non-GAAP financial measure. Adjusted EPS is explained and reconciled in the Appendix at “EPS Reconciliations.”
**Projected EPS guidance as of 2/06/17
FY16 Adjusted EPS* Growth
Up 39% vs. FY 2015
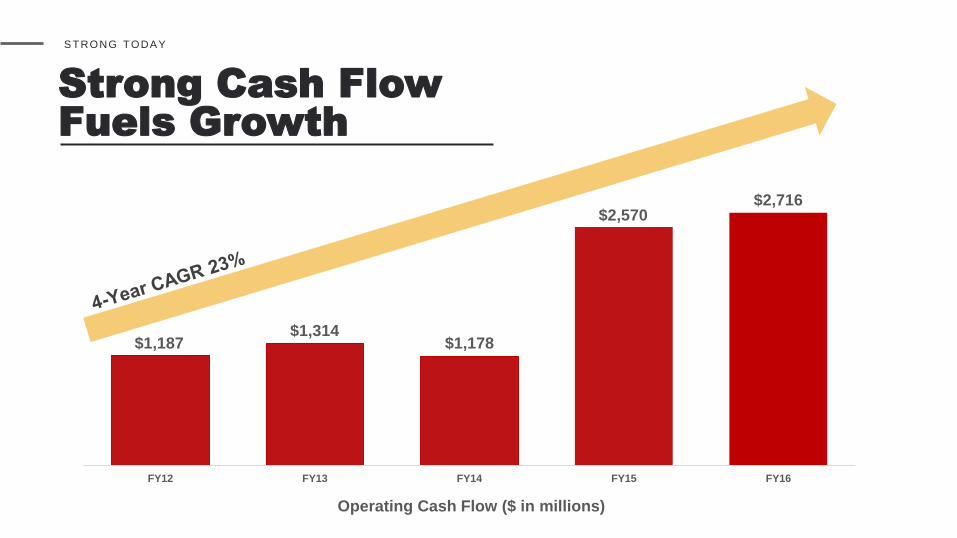
STRONG TODAY
Strong Cash Flow
Fuels Growth
Operating Cash Flow ($ in millions)
FY12 FY13 FY14 FY15 FY16
$1,187$1,314
$2,716$2,570
$1,178
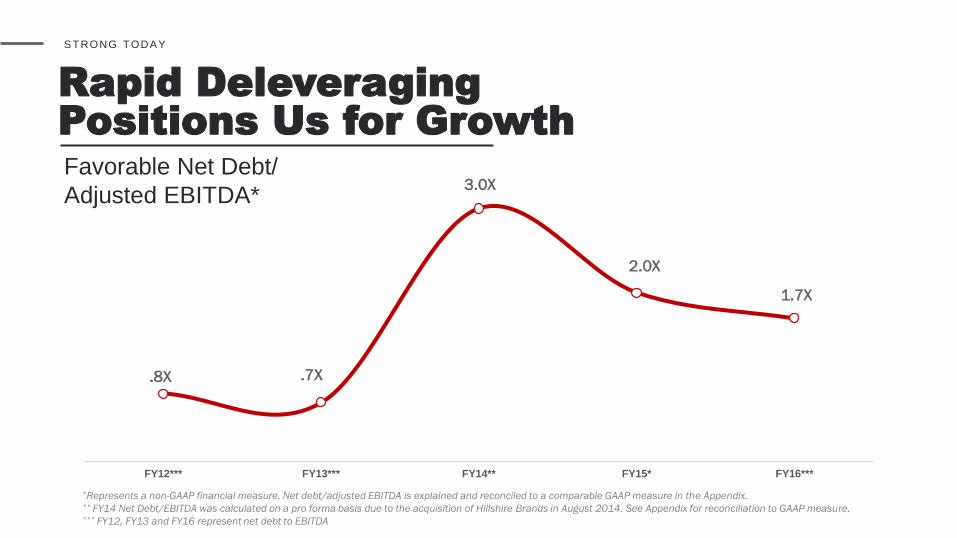
Rapid Deleveraging
Positions Us for Growth
STRONG TODAY
FY12*** FY13*** FY14** FY15* FY16***
.8X .7X
3.0X
2.0X
1.7X
*Represents a non-GAAP financial measure. Net debt/adjusted EBITDA is explained and reconciled to a comparable GAAP measure in the Appendix.** FY14 Net Debt/EBITDA was calculated on a pro forma basis due to the acquisition of Hillshire Brands in August 2014. See Appendix for reconciliation to GAAP measure.*** FY12, FY13 and FY16 represent net debt to EBITDA
Favorable Net Debt/
Adjusted EBITDA*

169%
88%
68% 68% 64%56%
49% 48% 46% 44% 44% 38%23%
11%
-10%-18%
*SOURCE: Bloomberg - This information should not be deemed to be “soliciting material” subject to regulation
14a or 14c or to the liabilities of Section 18 of the Securities Exchange Act of 1934
STRONG TODAY
Unmatched Shareholder
ReturnTo ta l Shareho l d e r Re tu rn (TSR* ) Las t 3 yea rs
HRL PPC CAG MKC SAFM MDLZ PEP GIS K CPB SJM ADM HSY
DF BG

STRONG TODAY
Uniquely
Positioned
to Lead
OPPORTUNITYChanging Consumers
and Markets Create
Opportunity
CAPABILITY
Differentiated Capability
Aligned to Growing
Demand Creates
Advantage
FIREPOWERBusiness Model and
Performance Create
Firepower for Growth
TSN
STRONG TODAY, LEADING FOR TOMORROW
FORTUNE
No. 1 Most
Admired
Company
Food Production Industry

STRONG TODAY, LEADING FOR TOMORROW
Ready
to Shape
the Future

STRONG TODAY, LEADING FOR TOMORROW
Returns
Through
Purpose

VIDEO
PLAYING
Placeholder
STRONG TODAY, LEADING FOR TOMORROW

STRONG TODAY, LEADING FOR TOMORROW
Sustainably feed the world with the fastest growing portfolio of protein packed brands
Strategic
Intent

STRONG TODAY, LEADING FOR TOMORROW
Growing our portfolio of
protein packed brands
Delivering sustainable
food at scale
Driving profitable growth with and for our customers
through differentiated capabilities
Creating fuel for reinvestment through a disciplined
financial fitness model
Twin Engines of Growth
Critic
al
En
ab
le
rs
Sustainably
feed the
world with
the fastest
growing
portfolio
of protein
packed
brands

A New Approach to Efficiency Will Fund
Investments for Sustainable Growth
STRONG TODAY, LEADING FOR TOMORROW
REDUCE waste across the entire
company through Continuous
Improvement
ALLOCATE financial and human
capital to growth
TRANSFORM our business
through technology
STRONG TODAY, LEADING FOR TOMORROW
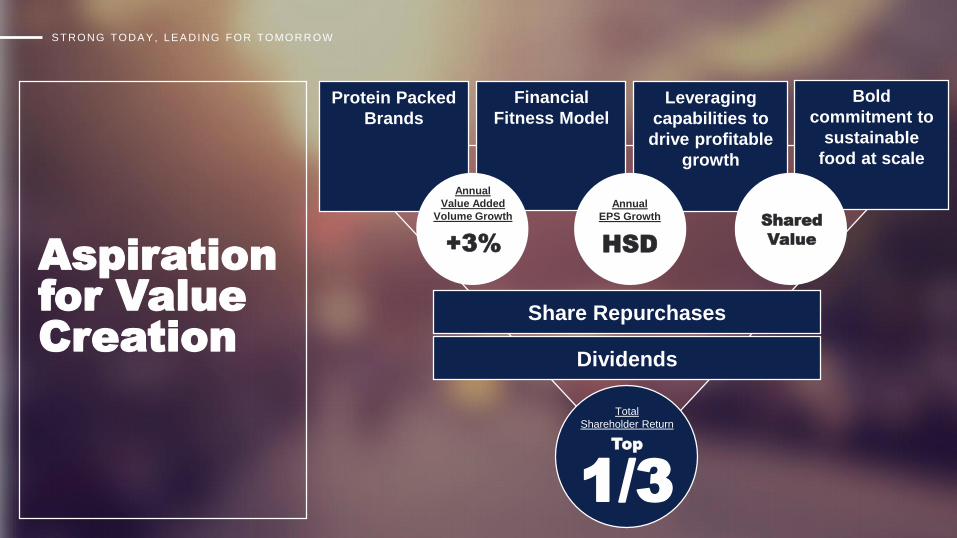
Aspiration
for Value
Creation
Share Repurchases
Dividends
Leveraging
capabilities to
drive profitable
growth
Financial
Fitness Model
Protein Packed
Brands
Total
Shareholder Return
Top
1/3
Bold
commitment to
sustainable
food at scale
Annual
Value Added
Volume Growth
+3% HSD
Annual
EPS GrowthShared
Value
STRONG TODAY, LEADING FOR TOMORROW
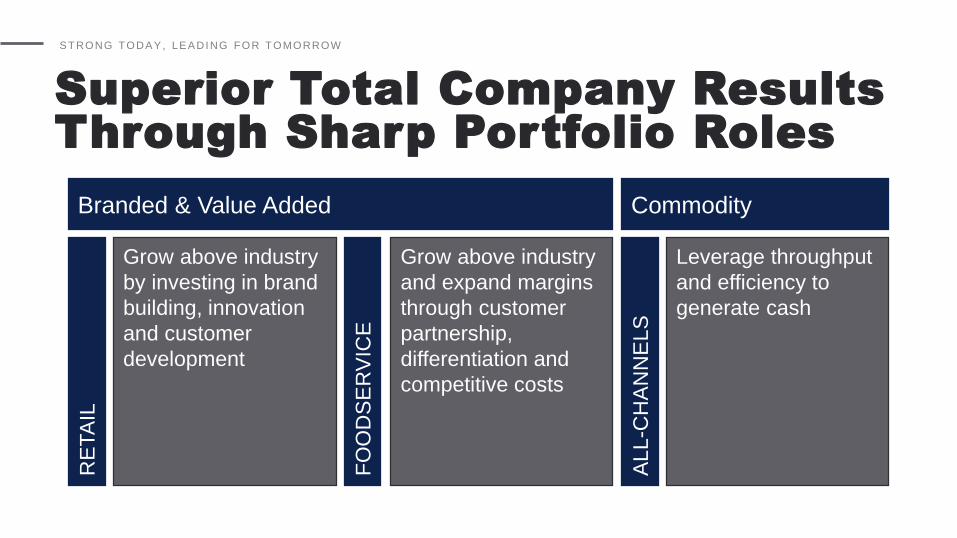
Superior Total Company Results
Through Sharp Portfolio Roles
Branded & Value Added Commodity
Grow above industry
by investing in brand
building, innovation
and customer
development
Grow above industry
and expand margins
through customer
partnership,
differentiation and
competitive costs
RE
TA
IL
FO
OD
SE
RV
ICE
ALL
-CH
AN
NE
LS
Leverage throughput
and efficiency to
generate cash

STRONG TODAY, LEADING FOR TOMORROW
Proven Leadership Team Aligned
to Deliver Against Our Strategy
Designed to Elevate Focus on
CONSUMERS
CUSTOMERS
SUSTAINABILITY
TECHNOLOGY
STRONG TODAY, LEADING FOR TOMORROW
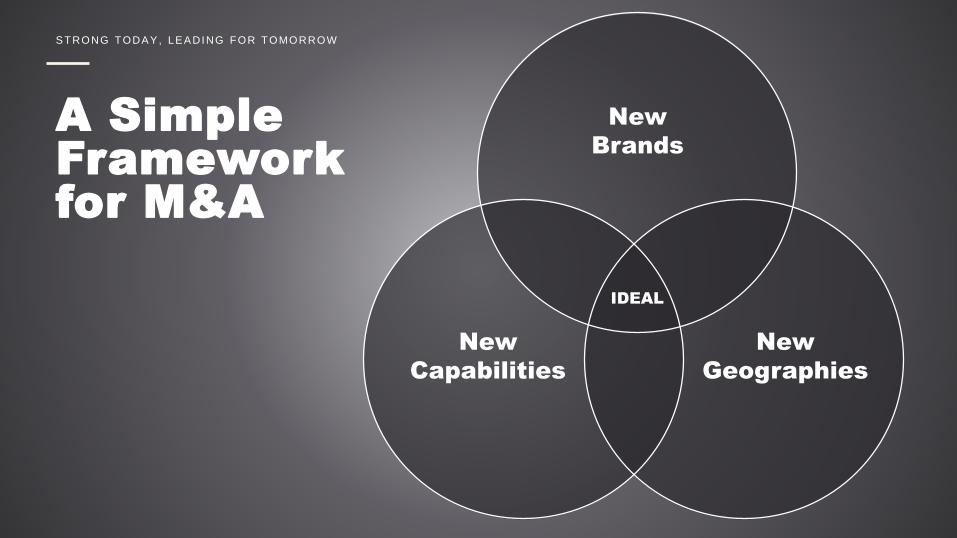
A Simple
Framework
for M&A
New
Geographies
New
Capabilities
New
Brands
IDEAL
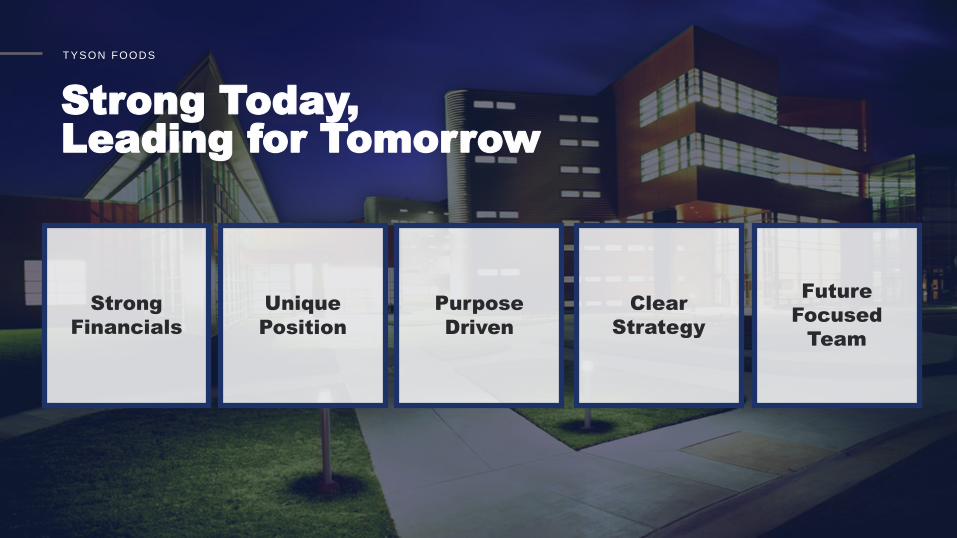
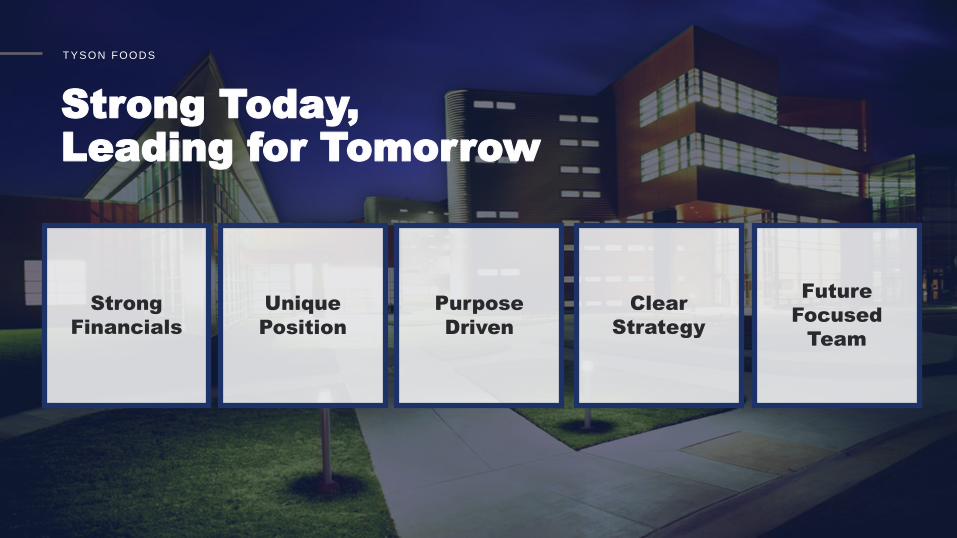
TYSON FOODS
Strong Today,
Leading for Tomorrow
Clear
Strategy
Strong
Financials
Future
Focused
Team
Unique
Position
Purpose
Driven

BUILDING A
MODERN GROWTH
PORTFOLIO
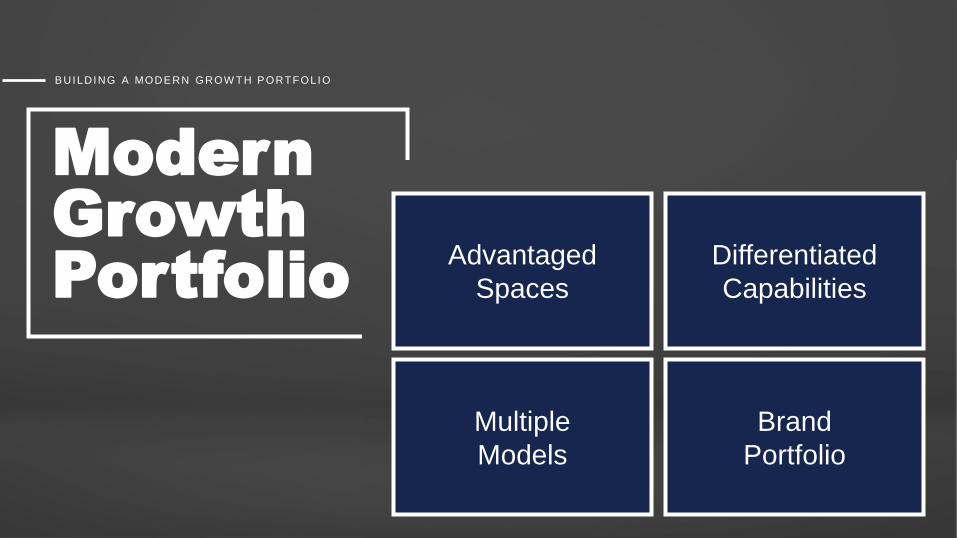
BUILDING A MODERN GROW TH PORTFOLIO
Modern
Growth
PortfolioAdvantaged
Spaces
Differentiated
Capabilities
Multiple
Models
Brand
Portfolio
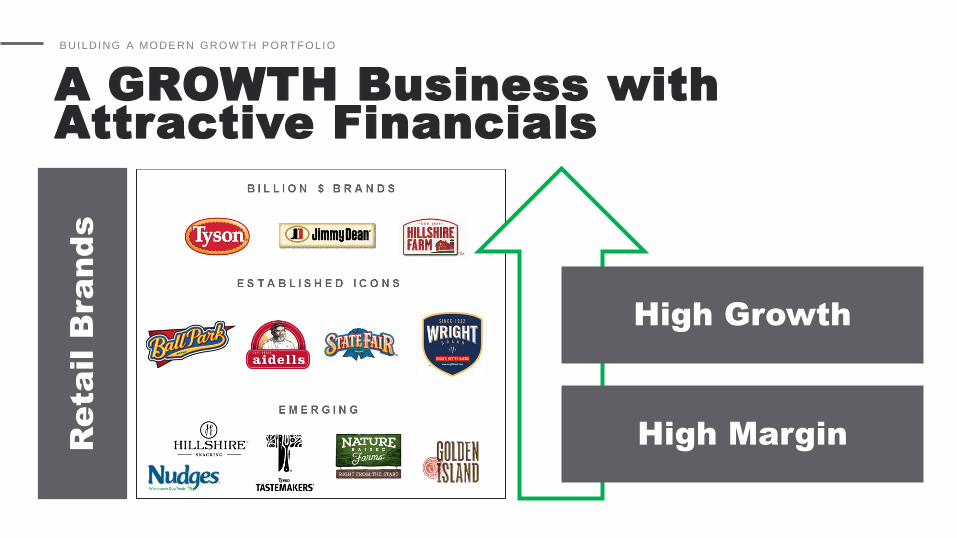
A GROWTH Business with
Attractive Financials
BUILDING A MODERN GROW TH PORTFOLIO
High Growth
High MarginRe
tail B
ra
nd
s
BUILDING A MODERN GROW TH PORTFOLIO
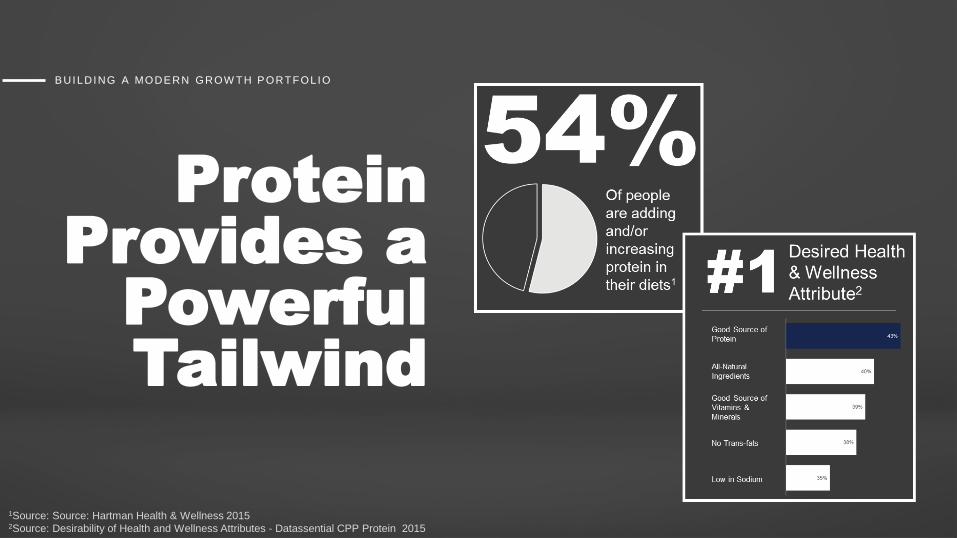
1Source: Source: Hartman Health & Wellness 20152Source: Desirability of Health and Wellness Attributes - Datassential CPP Protein 2015
Protein
Provides a
Powerful
Tailwind
BUILDING A MODERN GROW TH PORTFOLIO
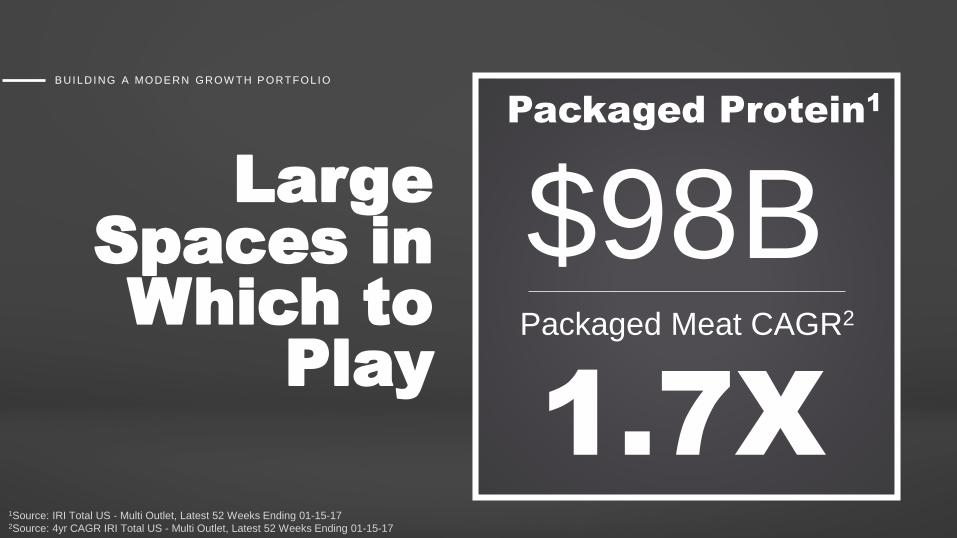
1Source: IRI Total US - Multi Outlet, Latest 52 Weeks Ending 01-15-172Source: 4yr CAGR IRI Total US - Multi Outlet, Latest 52 Weeks Ending 01-15-17
Large
Spaces in
Which to
Play
$98BPackaged Protein
1
Packaged Meat CAGR2
1.7X

BUILDING A MODERN GROW TH PORTFOLIO
1Source: Nielsen Perishables Universe; 52 Weeks Ending 12/31/16 = $31B, Estimate 67%
coverage of total retail market
$46B
RETAIL
Fresh
Meat1Large
Spaces in
Which to
Play
Branded
Value
Added
Unbranded

BUILDING A MODERN GROW TH PORTFOLIO
Large
Spaces in
Which to
Play
CONSUMER
FRESH
GOODS

BUILDING A MODERN GROW TH PORTFOLIO
DIFFERENTIATED
CAPABILITIES

BUILDING A MODERN GROW TH PORTFOLIO
Opportunity in Current Spaces
98%
86%79% 75%
62% 63% 63%52%
37%
21%
78%
30%
7%
30% 26% 28%
5%
34%23%
10%
Total Core 9 Lunchmeat Bacon Hot DogsBreakfastSausage
SmokedSausage
SmokedSausage
Frozen PreparedChicken
Frozen ProteinBreakfast
Frozen CornDogs
Category HH Penetration Brand HH Penetration
SOURCE: IRI a) National Consumer Panel for 52 weeks ending 1/22/17 b)Total US Multi-Outlet for 52 weeks ending 1/15/17 *Within branded stack pack bacon **Within super-premium smoked sausage segment
#2Branded $
Share
Position#1* #1 #1 #1 #1** #1 #1 #1
BUILDING A MODERN GROW TH PORTFOLIO
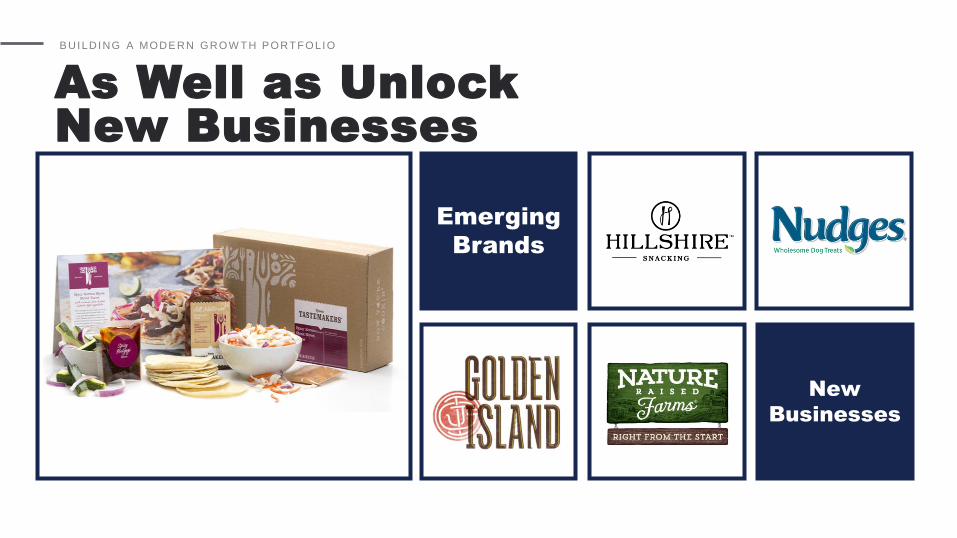
As Well as Unlock
New Businesses
Emerging
Brands
New
Businesses

BUILDING A MODERN GROW TH PORTFOLIO
A Repeatable Model
Creates a Fresh Story
in Frozen

VIDEO
PLAYING

BUILDING A MODERN GROW TH PORTFOLIO
This Approach Delivers
Proven ResultsVolume sales % change among top 10 branded food companies > $5B
6.6% 6.3%
0.5%
-1.0%
-2.4% -2.7% -3.1% -3.4% -3.4%
-7.0%
-9.6% -9.9%
Core 9 Total
Food &
Bev.
Total
Source: IRI Total U.S. Multi-Outlet (x Costco) Volume Sales 13 weeks ending 1/15/2017
Product = Total Edible + Pet Food, Tyson = Tyson + Nature Raised Farms

BUILDING A MODERN GROW TH PORTFOLIO
Through Healthy Growth
Volume sales % change among top 10 branded food companies > $5B
6.6% 6.3%
0.5%
-1.0%
-2.4% -2.7% -3.1% -3.4% -3.4%
-7.0%
-9.6% -9.9%
Core 9 Total
Food &
Bev.
Total
HHs Buying: +1PT
Amount Each HH Buys: +6%
Source: IRI Total U.S. Multi-Outlet (x Costco) Volume Sales 13 weeks ending 1/15/2017
Product = Total Edible + Pet Food, Tyson = Tyson + Nature Raised Farms
Consumer Panel: IRI Consumer Panel 52 weeks ending 1/22/2017

That is Recognized Within and Beyond
Our Industry
BUILDING A MODERN GROW TH PORTFOLIO
#1 Large
Food &
Beverage
Growth
PerformerBased upon composite growth index

• BUILDING A MODERN GROWTH PORTFOLIO
Growth Demands
Multi-Dimensional Innovation
FUNCTIONALFLEXIBLEFRESH

FRESH
The
Perimeter
of the
Store is
OUR
Center
SOURCE: Hartman, America’s Supermarkets in Transition, 2016
SOURCE: Videomining Custom Research, 2015
B U I L D I N G A M O D E R N G R O W T H P O R T F O L I O
SOURCE: Canadean, 2015
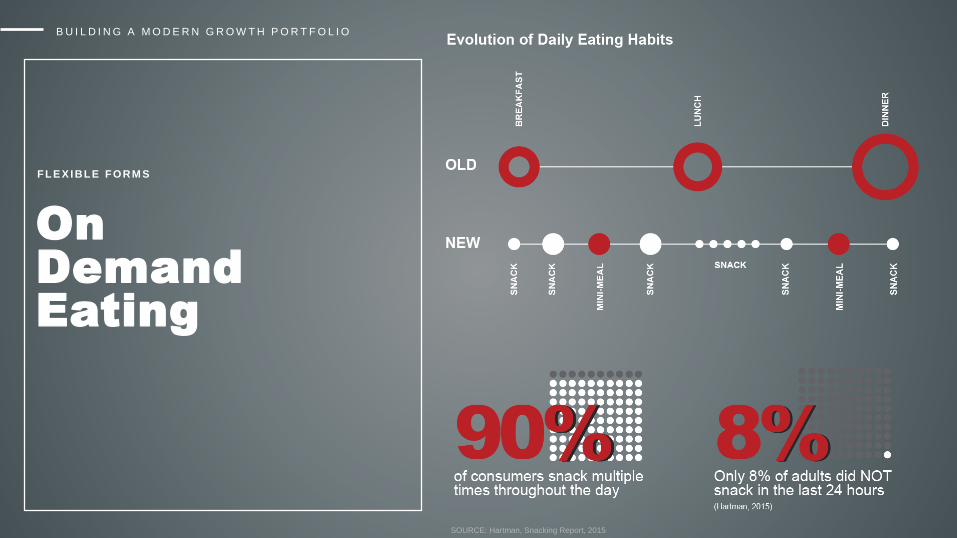
FLEXIBLE FORM S
On
Demand
Eating
SOURCE: Hartman, Snacking Report, 2015
B U I L D I N G A M O D E R N G R O W T H P O R T F O L I O
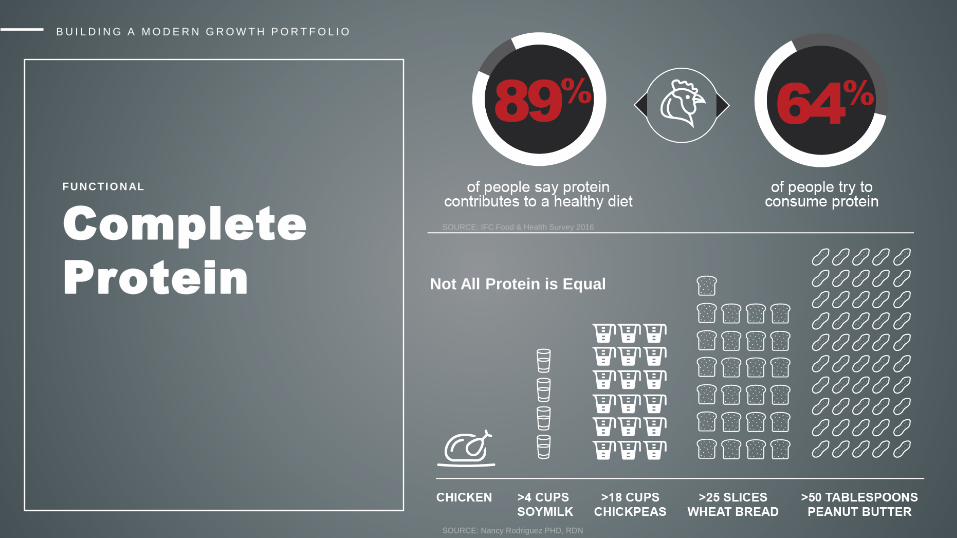
FUNCTION AL
Complete
Protein Not All Protein is Equal
SOURCE: IFC Food & Health Survey 2016
SOURCE: Nancy Rodriguez PHD, RDN
B U I L D I N G A M O D E R N G R O W T H P O R T F O L I O

This Approach is Behind the
Success of Recent Launches
BUILDING A MODERN GROW TH PORTFOLIO

BUILDING A MODERN GROW TH PORTFOLIO
Innovation Performance
FY14 FY16
12%
14%
Tyson Foods Retail New Product Vitality FY14-FY16 Innovation Net Revenue Growth
+21%
SOURCE: Internal financials
BUILDING A MODERN GROW TH PORTFOLIO
ConsumerFreshGoods
Fresh Take on Breakfast
Keeping Core 9 Fresh
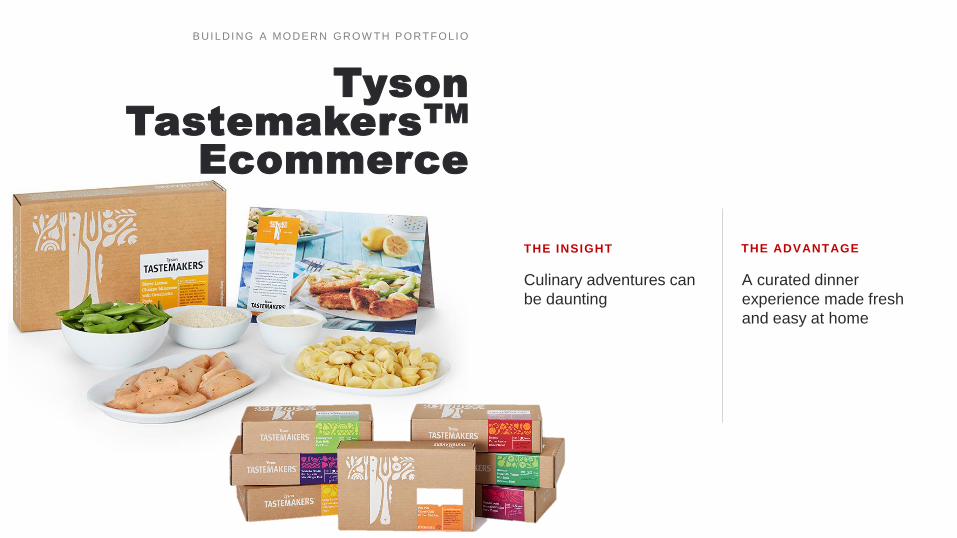
THE INSIGHT THE ADVANTAGE
Culinary adventures can
be daunting
A curated dinner
experience made fresh
and easy at home
BUILDING A MODERN GROW TH PORTFOLIO
Tyson
TastemakersTM
Ecommerce

BUILDING A MODERN GROWTH PORTFOLIO
Tyson TastemakersTM
at Retail
BUILDING A MODERN GROW TH PORTFOLIO
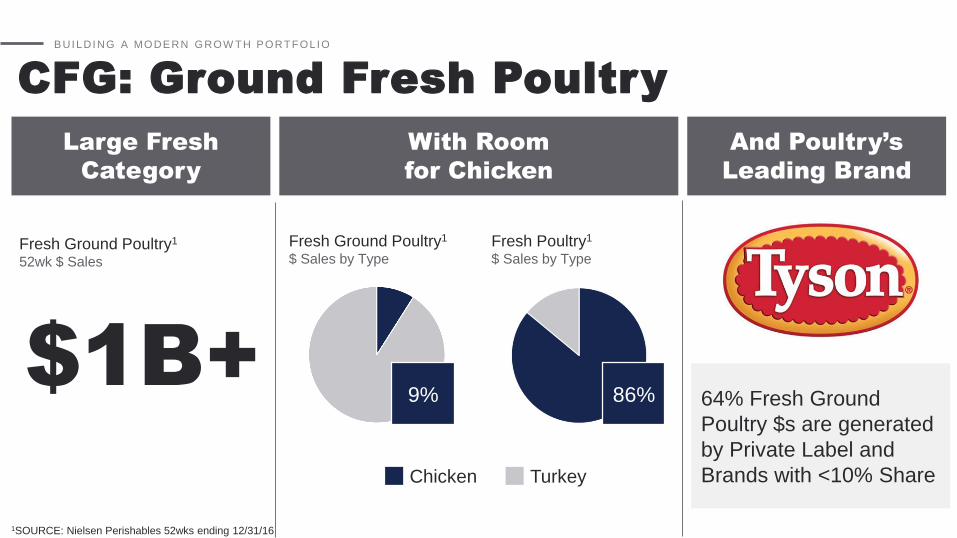
CFG: Ground Fresh Poultry
Fresh Poultry1
$ Sales by Type
Fresh Ground Poultry1
$ Sales by Type
Chicken Turkey
1SOURCE: Nielsen Perishables 52wks ending 12/31/16
$1B+
Fresh Ground Poultry1
52wk $ Sales
Large Fresh
Category
With Room
for Chicken
And Poultry’s
Leading Brand
64% Fresh Ground
Poultry $s are generated
by Private Label and
Brands with <10% Share
9% 86%
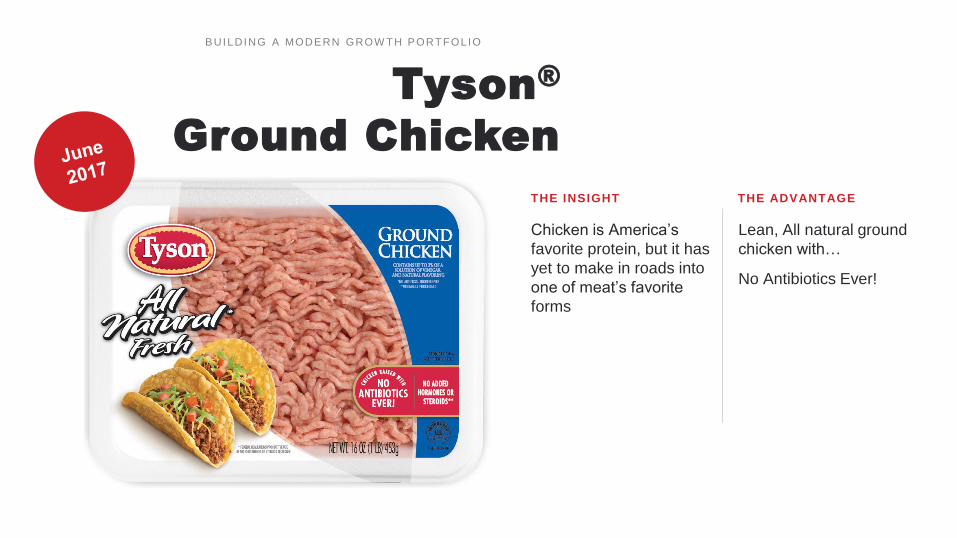
THE INSIGHT THE ADVANTAGE
Chicken is America’s
favorite protein, but it has
yet to make in roads into
one of meat’s favorite
forms
Lean, All natural ground
chicken with…
No Antibiotics Ever!
BUILDING A MODERN GROW TH PORTFOLIO
Tyson®
Ground Chicken
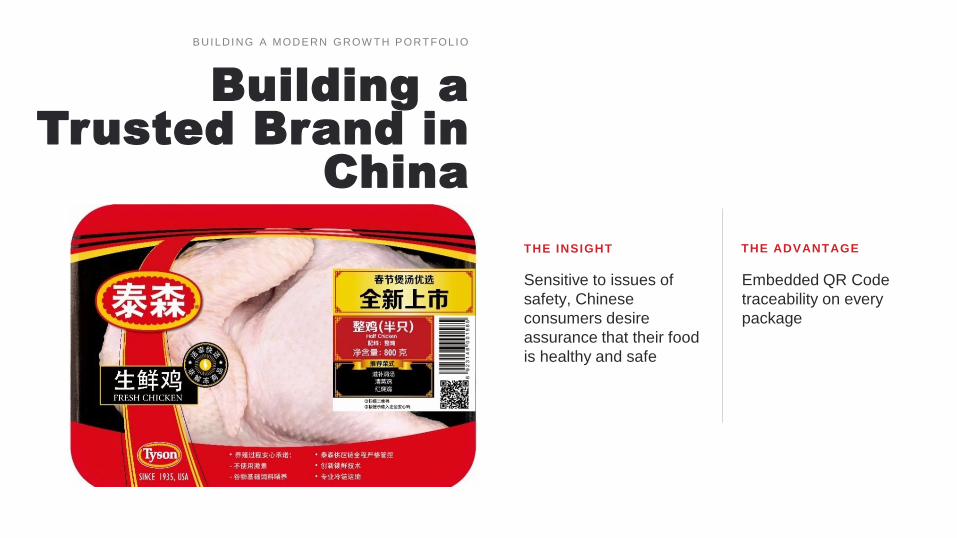
THE INSIGHT THE ADVANTAGE
Sensitive to issues of
safety, Chinese
consumers desire
assurance that their food
is healthy and safe
Embedded QR Code
traceability on every
package
BUILDING A MODERN GROW TH PORTFOLIO
Building a
Trusted Brand in
China
BUILDING A MODERN GROW TH PORTFOLIO
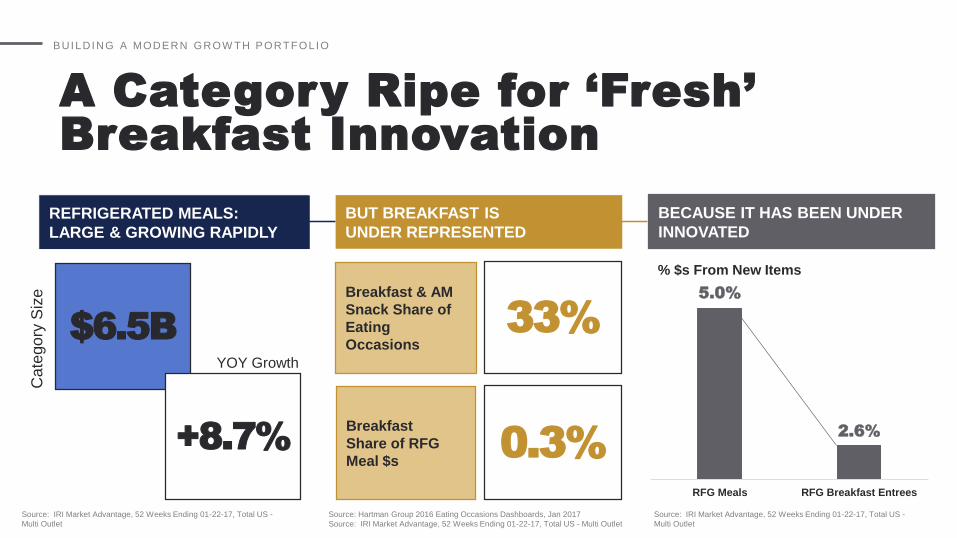
A Category Ripe for ‘Fresh’
Breakfast Innovation
$6.5B
+8.7%
Cate
go
ry S
ize
YOY Growth
Source: IRI Market Advantage, 52 Weeks Ending 01-22-17, Total US -
Multi Outlet
5.0%
2.6%
RFG Meals RFG Breakfast Entrees
BECAUSE IT HAS BEEN UNDER
INNOVATED
% $s From New Items
Source: IRI Market Advantage, 52 Weeks Ending 01-22-17, Total US -
Multi Outlet
REFRIGERATED MEALS:
LARGE & GROWING RAPIDLY
Source: Hartman Group 2016 Eating Occasions Dashboards, Jan 2017
Source: IRI Market Advantage, 52 Weeks Ending 01-22-17, Total US - Multi Outlet
BUT BREAKFAST IS
UNDER REPRESENTED
Breakfast & AM
Snack Share of
Eating
Occasions
33%
Breakfast
Share of RFG
Meal $s0.3%
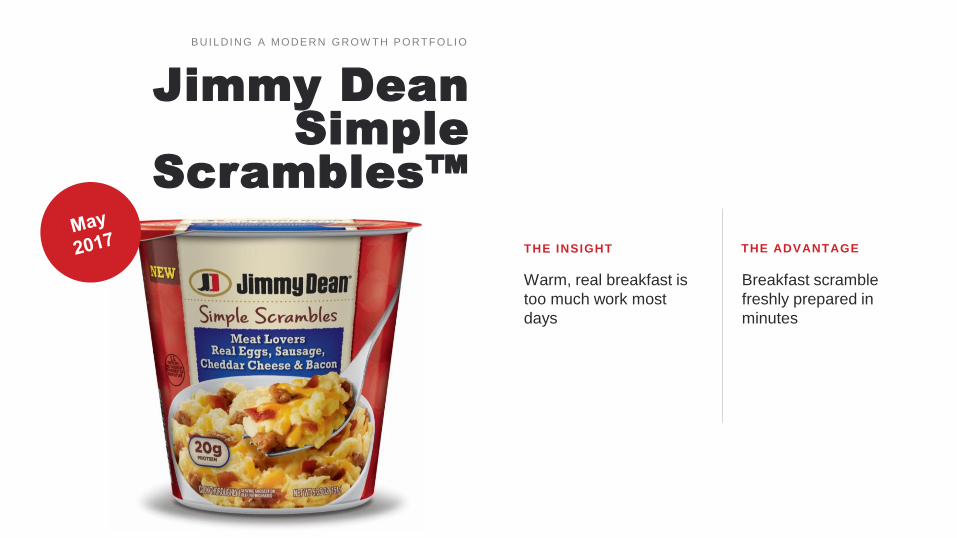
THE INSIGHT THE ADVANTAGE
Warm, real breakfast is
too much work most
days
Breakfast scramble
freshly prepared in
minutes
BUILDING A MODERN GROW TH PORTFOLIO
Jimmy Dean
Simple
Scrambles™
THE INSIGHT THE ADVANTAGE
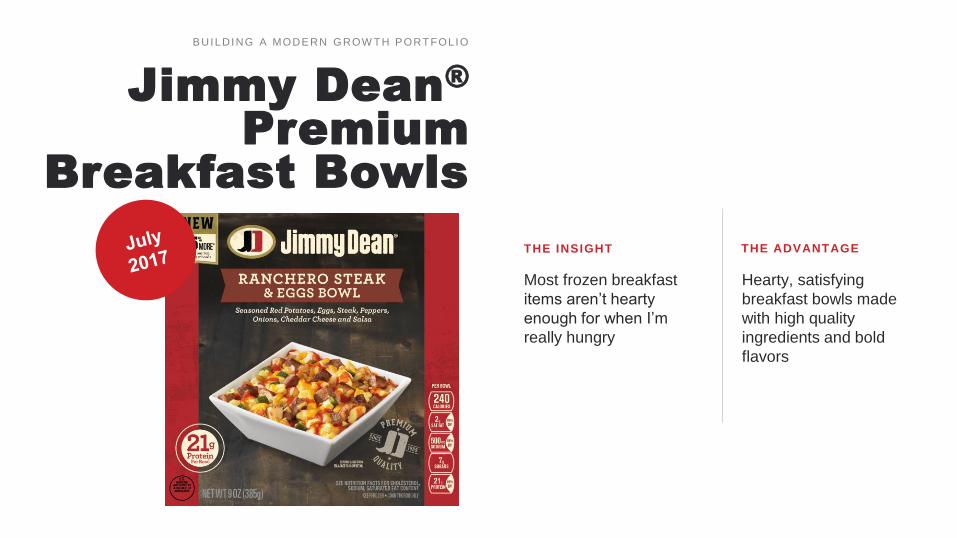
Most frozen breakfast
items aren’t hearty
enough for when I’m
really hungry
Hearty, satisfying
breakfast bowls made
with high quality
ingredients and bold
flavors
BUILDING A MODERN GROW TH PORTFOLIO
Jimmy Dean®
Premium
Breakfast Bowls
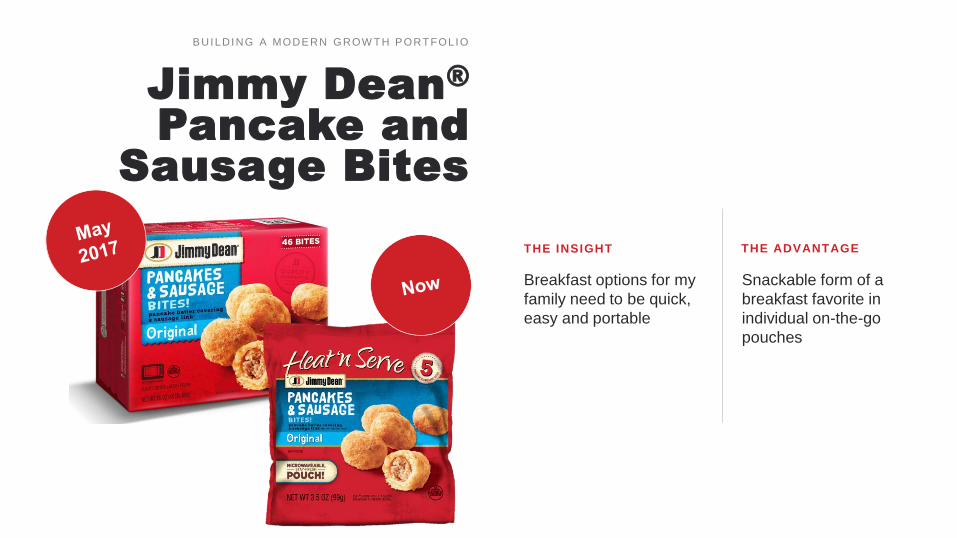
THE INSIGHT THE ADVANTAGE
Breakfast options for my
family need to be quick,
easy and portable
Snackable form of a
breakfast favorite in
individual on-the-go
pouches
BUILDING A MODERN GROW TH PORTFOLIO
Jimmy Dean®
Pancake and
Sausage Bites
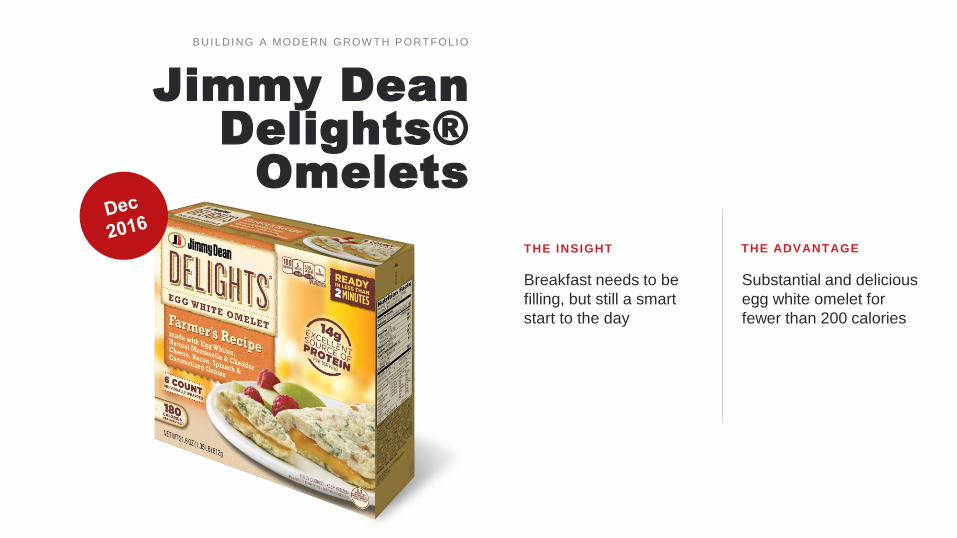
THE INSIGHT THE ADVANTAGE
Breakfast needs to be
filling, but still a smart
start to the day
Substantial and delicious
egg white omelet for
fewer than 200 calories
BUILDING A MODERN GROW TH PORTFOLIO
Jimmy Dean
Delights®
Omelets
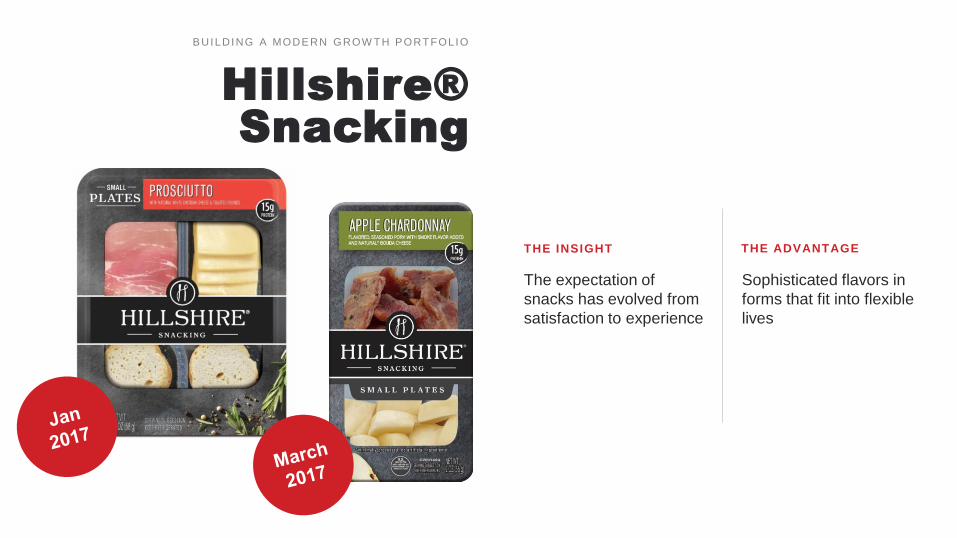
THE INSIGHT THE ADVANTAGE
The expectation of
snacks has evolved from
satisfaction to experience
Sophisticated flavors in
forms that fit into flexible
lives
BUILDING A MODERN GROW TH PORTFOLIO
Hillshire®
Snacking

THE INSIGHT THE ADVANTAGE
The best flavor takes a
long time to develop –
time I don’t have during
the week
Slow smoked meat in
minutes, not hours
BUILDING A MODERN GROW TH PORTFOLIO
Hillshire Farm®
Slow Smoked
Meats

THE INSIGHT THE ADVANTAGE
I want a cleaner label,
higher quality hot dog I
can feel good about
serving
Only premium hot dog
made with 100% USDA
prime beef, no added
nitrates
BUILDING A MODERN GROW TH PORTFOLIO
BallPark®
Prime Franks

BUILDING A MODERN GROW TH PORTFOLIO
The Tyson brand &
No Antibiotics Ever!
Meeting the growing
consumer demand for
no antibiotics across
our portfolio.

BUILDING A MODERN GROW TH PORTFOLIO
Bringing Our
Brands to Life:
Telling Fresh,
Modern Stories
BUILDING A MODERN GROW TH PORTFOLIO
Evolution of the Tyson
Consumer Brand

VIDEO
PLAYING


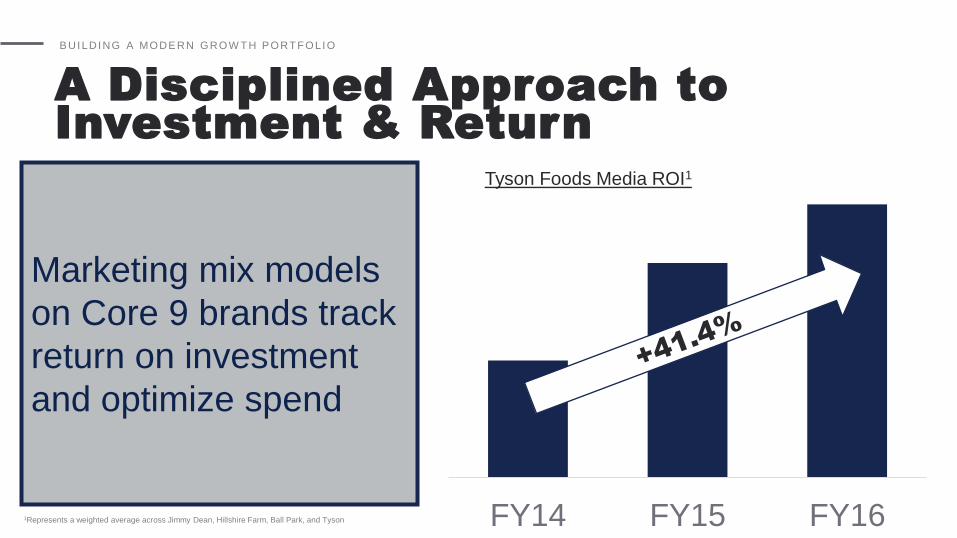
A Disciplined Approach to
Investment & Return
BUILDING A MODERN GROW TH PORTFOLIO
FY14 FY15 FY16
Tyson Foods Media ROI1
Marketing mix models
on Core 9 brands track
return on investment
and optimize spend
1Represents a weighted average across Jimmy Dean, Hillshire Farm, Ball Park, and Tyson

BUILDING A MODERN GROW TH PORTFOLIO
Modern
Growth
PortfolioAdvantaged
Spaces
Differentiated
Capabilities
Multiple
Models
Brand
Portfolio

LEADING THE
WAY IN FOOD
SUSTAINABILITY

LEADING THE W AY IN FOOD SUSTAINABIL ITY
The Case for Sustainability
& Shared Value
It’s the right thing to do &
companies that do the right thing win!
SOCIAL ENVIRONMENTAL BUSINESS
LEADING THE W AY IN FOOD SUSTAINABIL ITY
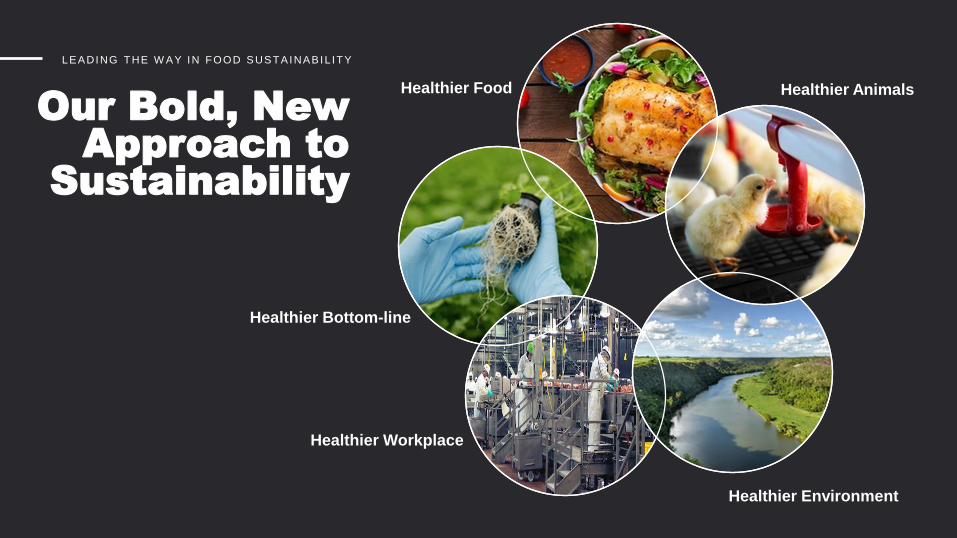
Our Bold, New
Approach to
Sustainability
Healthier Food Healthier Animals
Healthier Environment
Healthier Workplace
Healthier Bottom-line

LEADING THE W AY IN FOOD SUSTAINABIL ITY
From Issues to
System-level
Sustainability
Solutions
Tyson Foods aims to create
competitive advantage by
advancing all dimensions
of sustainability
LEADING THE W AY IN FOOD SUSTAINABIL ITY
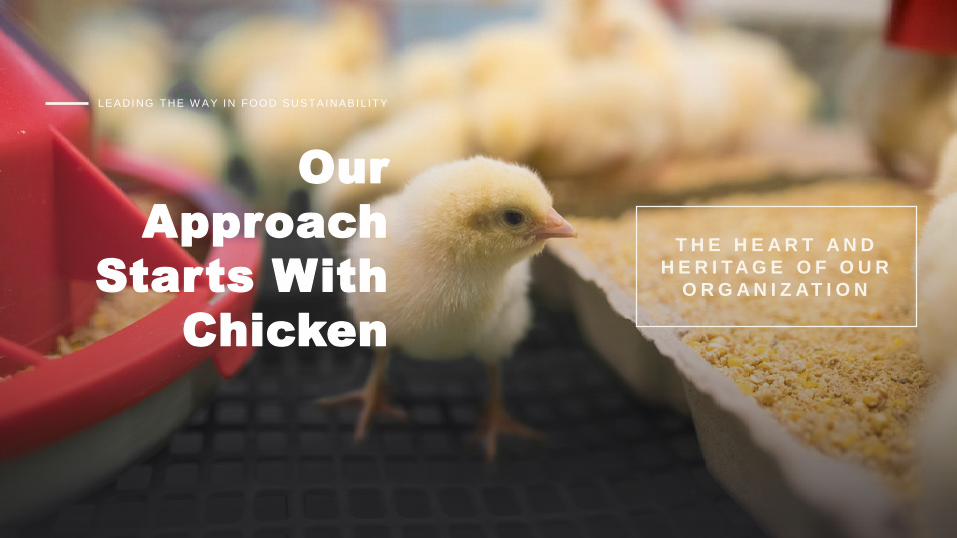
T H E H E A R T A N D
H E R I TA G E O F O U R
O R G A N I Z AT I O N
Our
Approach
Starts With
Chicken
LEADING THE W AY IN FOOD SUSTAINABIL ITY
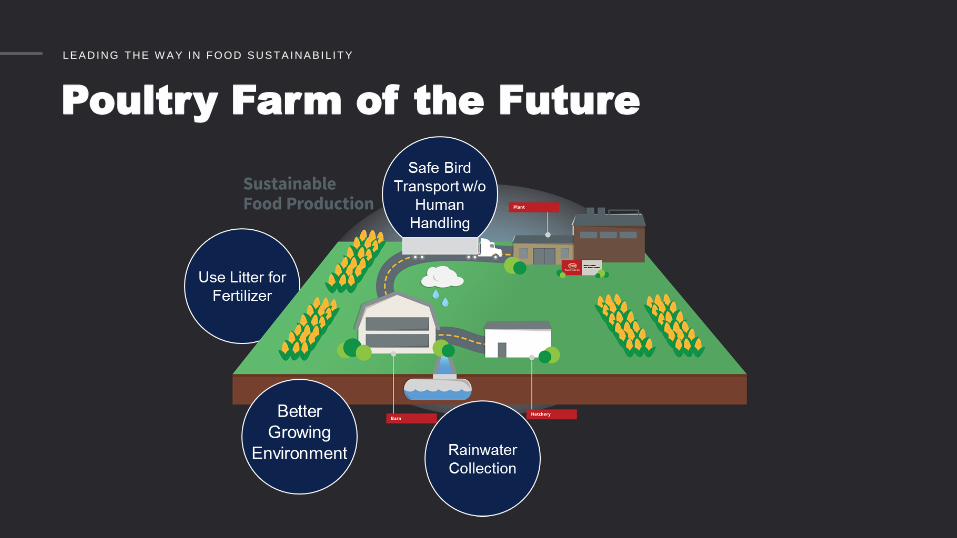
Poultry Farm of the Future

LEADING THE W AY IN FOOD SUSTAINABIL ITY
Poultry Farm of the Future
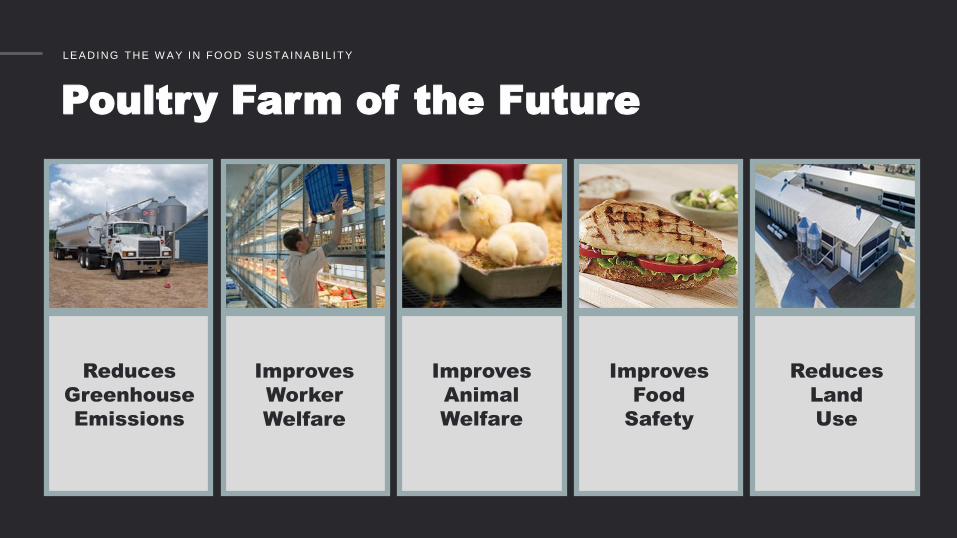
LEADING THE W AY IN FOOD SUSTAINABIL ITY
Poultry Farm of the Future
Improves
Food
Safety
Improves
Animal
Welfare
Reduces
Greenhouse
Emissions
Reduces
Land
Use
Improves
Worker
Welfare
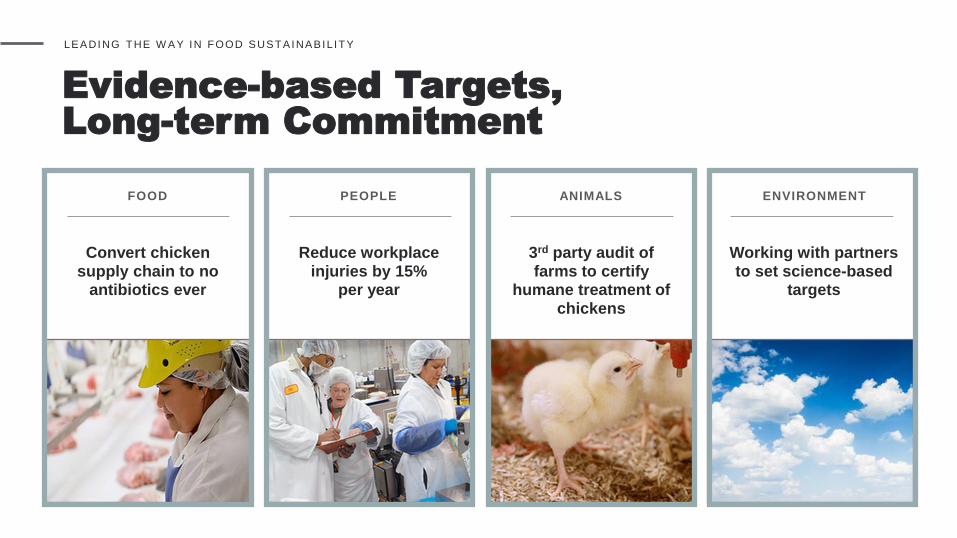
Evidence-based Targets,
Long-term Commitment
LEADING THE W AY IN FOOD SUSTAINABIL ITY
FOOD PEOPLE ANIMALS ENVIRONMENT
Convert chicken supply chain to no
antibiotics ever
Reduce workplace injuries by 15%
per year
3rd party audit of farms to certify
humane treatment of chickens
Working with partners to set science-based
targets

LEADING THE W AY IN FOOD SUSTAINABIL ITY
Over Time Sustainability
Investments Will Fund Themselves
Resources
Waste
Cost
Innovation
Volume
Profits
Sustainability
Investments
LEADING THE W AY IN FOOD SUSTAINABIL ITY
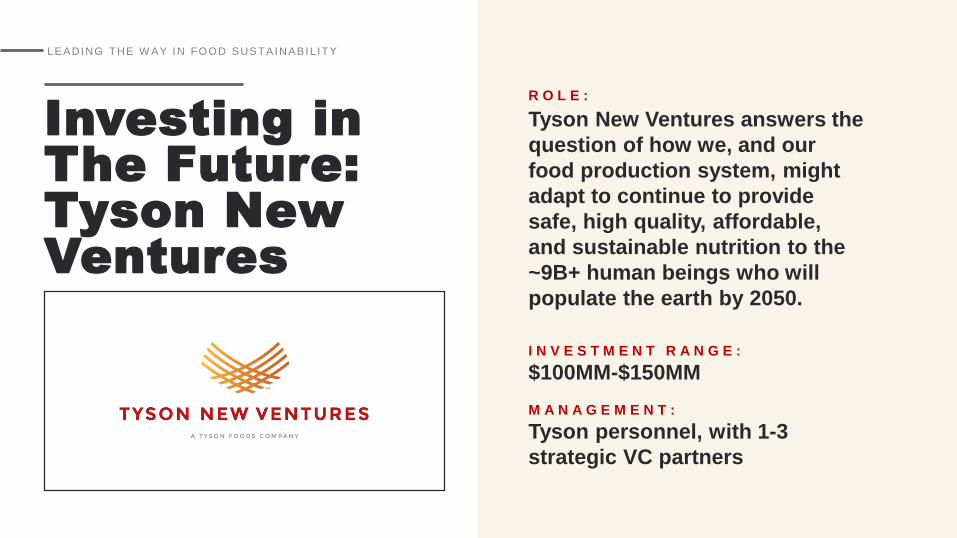
Investing in
The Future:
Tyson New
Ventures
R O L E :
Tyson New Ventures answers the
question of how we, and our
food production system, might
adapt to continue to provide
safe, high quality, affordable,
and sustainable nutrition to the
~9B+ human beings who will
populate the earth by 2050.
I N V E S T M E N T R A N G E :
$100MM-$150MM
M A N A G E M E N T :
Tyson personnel, with 1-3
strategic VC partners
LEADING THE W AY IN FOOD SUSTAINABIL ITY
Beyond Meat

THE BRIGHT
FUTURE OF
TYSON FOODS
TYSON FOODS
Strong Today,
Leading for Tomorrow
Clear
Strategy
Strong
Financials
Future
Focused
Team
Unique
Position
Purpose
Driven

Strong Today,
Leading for
Tomorrow

Thank
You

Appendix

STRONG TODAY, LEADING FOR TOMORROW
$ in millions
(Unaudited)
Net Debt/EBITDA Reconciliations
Fiscal 2016 (a) Fiscal 2015 (a) Fiscal 2014 (a) Fiscal 2013 (a) Fiscal 2012 (a)
Net income 1,772$ 1,224$ 856$ 778$ 576$
Less: Interest income (6) (9) (7) (7) (12)
Add: Interest expense 249 293 132 145 356
Add: Income tax expense 826 697 396 411 351
Add: Depreciation 617 609 494 474 443
Add: Amortization (b) 80 92 26 17 17
EBITDA 3,538$ 2,906$ 1,897$ 1,818$ 1,731$
Adjustments to EBITDA:
Add: China impairment -$ 169$ -$ -$ -$
Add: Merger and integration costs - 57 - - -
Add: Prepared Foods network optimization charges - 59 - - -
Add: Denison plant closure - 12 - - -
Add: Brazil impairment - - 42 - -
Add: Hillshire Brands purchase price accounting adjustments - - 19 - -
Add: Hillshire Brands acquisition, integration and costs associated with our Prepared
Foods improvement plan - - 197 - -
Add: Costs (insurance proceeds, net of costs) related to a legacy Hillshire Brands plant fire - (8) 12 - -
Less: Gain on sale of the Mexico operation - (161) - - -
Less: Gain on sale of equity securities - (21) - - -
Total Adjusted EBITDA 3,538$ 3,013$ 2,167$ 1,818$ 1,731$
Pro forma Adjustments to EBITDA:
Add: Hillshire Brands adjusted EBITDA (prior to acquisition) (c) n/a n/a 422 n/a n/a
Total Pro forma Adjusted EBITDA n/a n/a 2,589$ n/a n/a
Total gross debt (d) 6,279$ 6,690$ 8,128$ 2,398$ 2,418$
Less: Cash and cash equivalents (349) (688) (438) (1,145) (1,071)
Less: Short-term investments (4) (2) (1) (1) (3)
Total net debt 5,926$ 6,000$ 7,689$ 1,252$ 1,344$
Ratio Calculations:
Gross debt/EBITDA 1.8x 2.3x 4.3x 1.3x 1.4x
Net debt/EBITDA 1.7x 2.1x 4.1x 0.7x 0.8x
Gross debt/Adjusted EBITDA 1.8x 2.2x 3.8x 1.3x 1.4x
Net debt/Adjusted EBITDA 1.7x 2.0x 3.5x 0.7x 0.8x
Gross debt/Pro forma Adjusted EBITDA n/a n/a 3.1x n/a n/a
Net debt/Pro forma Adjusted EBITDA n/a n/a 3.0x n/a n/a

STRONG TODAY, LEADING FOR TOMORROW
Net Debt/EBITDA Reconciliations - continued
(a) EBITDA and Adjusted EBITDA for fiscal 2015 were based on a 53-week year while fiscal 2016, 2014, 2013 and 2012 are based on a 52-week year.
(b) Excludes the amortization of debt discount expense of $8 million, $10 million, $10 million, $28 million and $39 million for fiscal 2016, 2015, 2014, 2013 and 2012, respectively, as it is included in Interest
expense.
(c) Represents Hillshire Brands adjusted EBITDA, prior to our acquisition, for the eleven months ended August 28, 2014. This amount is added to our Adjusted EBITDA for the fiscal year ended
September 27, 2014, in order for Net debt to Adjusted EBITDA to include a full twelve months of Hillshire Brands results on a pro forma basis for each of the periods presented. The pro forma adjusted
EBITDA was derived from Hillshire Brand’s historical financial statements for the periods ended March 29, 2014 and June 28, 2014 as filed with the Securities and Exchange Commission, as well as
amounts for the two months ended August 28, 2014, prior to the closing of the acquisition. These amounts were adjusted to remove the impact of deal costs related to Pinnacle Foods, Inc. and Tyson
Foods, Inc. transactions, Storm Lake fire, and severance costs. We believe this pro forma presentation is useful and helps management, investors, and rating agencies enhance their understanding of
our financial performance and to better highlight future financial trends on a comparable basis with Hillshire Brands results included for the periods presented given the significance of the acquisition to
our overall results.
(d) In the fourth quarter of fiscal 2016, we adopted new accounting guidance, retrospectively, requiring classification of debt issuance costs as a reduction of the carrying value of the debt. In doing so, $29
million, $35 million, $50 million, $10 million and $14 million of deferred issuance costs was reclassified from Other Assets to Long-Term Debt in our Consolidated Balance Sheets for fiscal 2016, 2015,
2014, 2013 and 2012 respectively.
EBITDA is defined as net income before interest, income taxes, depreciation and amortization. Net debt to EBITDA (and to Adjusted EBITDA) represents the ratio of our debt, net of cash and short-term
investments, to EBITDA (and to Adjusted EBITDA). EBITDA, Adjusted EBITDA, net debt to EBITDA and net debt to Adjusted EBITDA are presented as supplemental financial measurements in the
evaluation of our business. Adjusted EBITDA is a tool intended to assist our management and investors in comparing our performance on consistent basis for purposes of business decision-making by
removing the impact of certain items that management believes do not directly reflect our core operations on an ongoing basis.
We believe the presentation of these financial measures helps management and investors to assess our operating performance from period to period, including our ability to generate earnings sufficient to
service our debt, and enhances understanding of our financial performance and highlights operational trends. These measures are widely used by investors and rating agencies in the valuation,
comparison, rating and investment recommendations of companies; however, the measurements of EBITDA (and Adjusted EBITDA) and net debt to EBITDA (and to Adjusted EBITDA) may not be
comparable to those of other companies, which limits their usefulness as comparative measures. EBITDA (and Adjusted EBITDA) and net debt to EBITDA (and to Adjusted EBITDA) are not measures
required by or calculated in accordance with generally accepted accounting principles (GAAP) and should not be considered as substitutes for net income or any other measure of financial performance
reported in accordance with GAAP or as a measure of operating cash flow or liquidity. EBITDA (and Adjusted EBITDA) is a useful tool for assessing, but is not a reliable indicator of, our ability to generate
cash to service our debt obligations because certain of the items added to net income to determine EBITDA (and Adjusted EBITDA) involve outlays of cash. As a result, actual cash available to service our
debt obligations will be different from EBITDA (and Adjusted EBITDA). Investors should rely primarily on our GAAP results and use non-GAAP financial measures only supplementally in making investment
decisions.
STRONG TODAY, LEADING FOR TOMORROW
$ in millions, except per share data
(Unaudited)
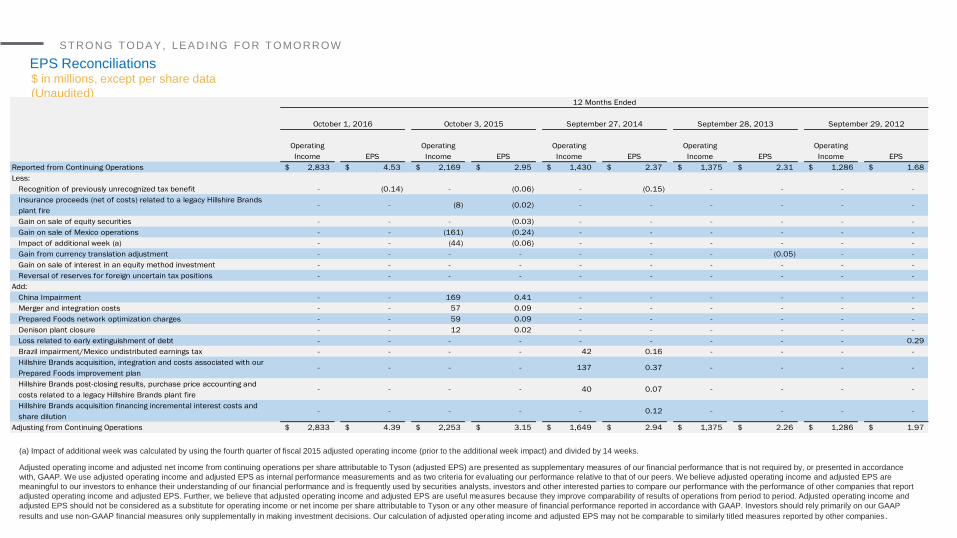
EPS Reconciliations
Operating
Income EPS
Operating
Income EPS
Operating
Income EPS
Operating
Income EPS
Operating
Income EPS
Reported from Continuing Operations 2,833$ 4.53$ 2,169$ 2.95$ 1,430$ 2.37$ 1,375$ 2.31$ 1,286$ 1.68$
Less:
Recognition of previously unrecognized tax benefit - (0.14) - (0.06) - (0.15) - - - -
Insurance proceeds (net of costs) related to a legacy Hillshire Brands
plant fire- - (8) (0.02) - - - - - -
Gain on sale of equity securities - - - (0.03) - - - - - -
Gain on sale of Mexico operations - - (161) (0.24) - - - - - -
Impact of additional week (a) - - (44) (0.06) - - - - - -
Gain from currency translation adjustment - - - - - - - (0.05) - -
Gain on sale of interest in an equity method investment - - - - - - - - - -
Reversal of reserves for foreign uncertain tax positions - - - - - - - - - -
Add:
China Impairment - - 169 0.41 - - - - - -
Merger and integration costs - - 57 0.09 - - - - - -
Prepared Foods network optimization charges - - 59 0.09 - - - - - -
Denison plant closure - - 12 0.02 - - - - - -
Loss related to early extinguishment of debt - - - - - - - - - 0.29
Brazil impairment/Mexico undistributed earnings tax - - - - 42 0.16 - - - -
Hillshire Brands acquisition, integration and costs associated with our
Prepared Foods improvement plan- - - - 137 0.37 - - - -
Hillshire Brands post-closing results, purchase price accounting and
costs related to a legacy Hillshire Brands plant fire- - - - 40 0.07 - - - -
Hillshire Brands acquisition financing incremental interest costs and
share dilution- - - - - 0.12 - - - -
Adjusting from Continuing Operations 2,833$ 4.39$ 2,253$ 3.15$ 1,649$ 2.94$ 1,375$ 2.26$ 1,286$ 1.97$
12 Months Ended
October 1, 2016 October 3, 2015 September 27, 2014 September 28, 2013 September 29, 2012
(a) Impact of additional week was calculated by using the fourth quarter of fiscal 2015 adjusted operating income (prior to the additional week impact) and divided by 14 weeks.
Adjusted operating income and adjusted net income from continuing operations per share attributable to Tyson (adjusted EPS) are presented as supplementary measures of our financial performance that is not required by, or presented in accordance
with, GAAP. We use adjusted operating income and adjusted EPS as internal performance measurements and as two criteria for evaluating our performance relative to that of our peers. We believe adjusted operating income and adjusted EPS are
meaningful to our investors to enhance their understanding of our financial performance and is frequently used by securities analysts, investors and other interested parties to compare our performance with the performance of other companies that report
adjusted operating income and adjusted EPS. Further, we believe that adjusted operating income and adjusted EPS are useful measures because they improve comparability of results of operations from period to period. Adjusted operating income and
adjusted EPS should not be considered as a substitute for operating income or net income per share attributable to Tyson or any other measure of financial performance reported in accordance with GAAP. Investors should rely primarily on our GAAP
results and use non-GAAP financial measures only supplementally in making investment decisions. Our calculation of adjusted operating income and adjusted EPS may not be comparable to similarly titled measures reported by other companies.


