durability test and statistical evaluation of rubber
TRANSCRIPT

DURABILITY TEST AND STATISTICAL EVALUATION OF RUBBER FENDERS
FOR VESSEL BERTHING
Satoru SHIRAISHI1, Kazuhiro NAGAI2 and Hitoshi AKIYAMA3
1Member of JSCE, Professor, Dept. of Civil and Environmental Eng., Hokkaido University of Science (7-5-4-1, Maeda, Teine-ku, Sapporo, Hokkaido 006-8585, Japan)
E-mail: [email protected] 2Chief researcher, Specialists Center of Port and Airport Engineering
(3-3-1, Kasumigaseki, Chiyoda-ku, Tokyo 100-0013, Japan) E-mail: [email protected]
3Member of JSCE, Senior chief researcher, Coastal Development Institute of Technology (1-14-2, Nishishinbashi, Minato-ku, Tokyo 105-0003, Japan)
E-mail: [email protected]
The fender is part of the ancillary equipment of mooring facilities and plays an important role in safe vessel berthing and smooth cargo handling. If fenders are damaged, economic loss will occur due to the suspension of service or restriction of operation of the mooring facility, and the operation and maintenance of the entire facility may be affected. Since fenders are used for a long time, it is necessary to ensure their durability. In 2002, the International Navigation Association (PIANC) published the “Guidelines for the Design of Fender System” and proposed a new method for confirming the durability of rubber fenders. In Japan, in 2010, consistent with the PIANC guidelines, a description of the durability of rubber fenders was added to the Standard Specifications for Port and Harbour Works of the Ports and Harbours Bureau of the Ministry of Land, Infrastructure, Transport and Tourism. In this study, the data of durability tests conducted by rubber fender manufacturers were statistically analyzed. From the results of the durability tests, a long-term performance criterion for rubber fenders was proposed. Key Words: rubber fender, durability test, energy absorption, residual strain, statistical analysis
1. INTRODUCTION
In recent years, the size of vessels has been in-creasing internationally to improve the efficiency of marine logistics. On the other hand, there are some cases in which many port facilities have become ob-solete or have deteriorated and cannot cope with the increase in the size of vessels. As part of the ancillary equipment of mooring facilities, fenders play an im-portant role in safe vessel berthing and smooth cargo handling. Thus, if a fender is damaged, it may cause economic loss due to suspension of service or the re-striction of mooring facilities and may affect the op-eration of the entire port. Therefore, it is necessary to detect damage and deterioration of the fenders at an early stage and to take measures based on an appro-priate functional evaluation. Today, fenders are mainly made of rubber. Rubber deterioration factors include natural environmental factors, chemical fac-tors, fatigue factors, and external force factors1).
Since fenders are used for a long time, it is necessary to ensure their durability taking the above factors into account.
However, evaluation criteria for the long-term du-rability of rubber fenders have not been established. After five years of deliberation at WG33/PTC II, the International Navigation Association (PIANC) pub-lished guidelines2) (hereafter referred to as PIANC guidelines) for the design of fenders in 2002, and a new test method for the durability of rubber fenders was proposed. In Japan, the Ports and Harbours Bu-reau of the Ministry of Land, Infrastructure, Transport and Tourism revised the Standard Specifi-cations for Port and Harbour Works3), and durability tests have been carried out since 2010.
Shiraishi and Nakashima4) investigated the changes in the properties of rubber fenders after du-rability tests based on the data collected by rubber fender manufacturers (five Japanese companies and two overseas companies). The supply of products to
Journal of JSCE, Vol. 9, 71-85, 2021
71
one Japanese company and one overseas company was subsequently discontinued, but they are also in-cluded in the analysis of this study. In this report, a statistical interpretation of the test results in the report of Shiraishi et al., including recent additional test data, is carried out, and future improvements of the test method and statistical evaluation are discussed. 2. BACKGROUND OF THE DESIGN AND
DURABILITY TESTS (1) Design method of rubber fenders
Fenders are designed so that the energy absorption Ea exceeds the vessel’s effective berthing energy Ef, determined by equation (1) 5).
𝐸 𝑀 𝑉 𝐶 𝐶 𝐶 𝐶 (1)
Here, Ms is the vessel mass, Vb is the berthing veloc-ity, Ce is the eccentricity factor, Cm is the virtual mass factor, Cs is the softness factor, and Cc is the berth configuration factor.
When the energy absorption up to the allowable strain (hereafter referred to as the rated strain) of the fender is assumed to be Ea, the fender is determined to meet the condition of equation (2). Here, 0.9 is a factor representing the manufacturing tolerance.
𝐸 0.9 𝐸 (2) The energy absorption Ea used for the design of the
fender is the catalog value provided by the manufac-turer. Ea is obtained under standard temperature (23°C) and standard compression velocity. Accord-ing to the PIANC guidelines, the energy absorption of rubber fenders is affected by the temperature and berthing velocity, and a design method using these coefficients is defined. In Japan, although the effects of velocity and temperature are described in the Technical Standards and Commentaries for Port and Harbour Facilities5), they have not been introduced as standard design methods at present. From the per-spective of future design method changes in Japan and maintaining consistency with the PIANC guide-lines, the “Guidelines for the Design and Testing of Rubber Fenders” were published in 20186). In these guidelines, the factors affecting the performance of rubber fenders are the (a) manufacturing tolerance, (b) angular factor, (c) velocity factor, (d) temperature factor, (e) aging factor, (f) repetition factor, and (g) creep characteristics. Examples of how to consider these factors in fender design are given.
(2) Background of the durability test The Ports and Harbours Bureau of the Ministry of
Land, Infrastructure, Transport and Tourism stipu-lates specifications for the rubber fenders used for port construction in the Standard Specifications for Port and Harbour Works (hereafter referred to as the Standard Specifications). The previous specifications did not have provisions for durability confirmation, and there was a difference from the PIANC guide-lines. To ensure consistency, a description of the du-rability test was added to the Standard Specifications after 2010. The Ministry of Land, Infrastructure, Transport and Tourism has designated the Specialists Center of Port and Airport Engineering (SCOPE) as the organization for this authentication. SCOPE is-sues a certificate based on the results of the durability tests conducted by fender manufacturers (five com-panies in Japan) and reviews and deliberates on the results determined by the committee before authenti-cation. SCOPE also examines the imported materials used for port construction in Japan, and the same cer-tificate is required for fenders produced by foreign manufacturers (two companies in 2019) that have ap-plied for authentication. This study analyzes the data of the test results collected so far with the consent of these fender manufacturers. 3. DURABILITY TEST (1) Test method
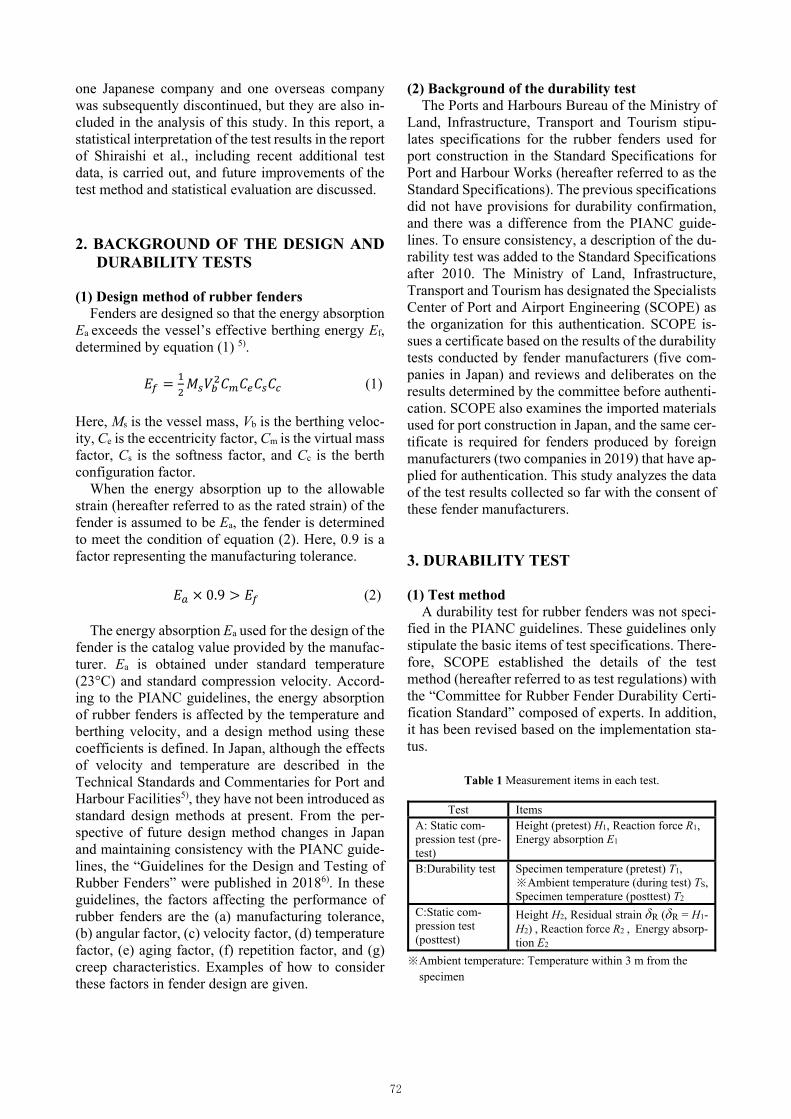
A durability test for rubber fenders was not speci-fied in the PIANC guidelines. These guidelines only stipulate the basic items of test specifications. There-fore, SCOPE established the details of the test method (hereafter referred to as test regulations) with the “Committee for Rubber Fender Durability Certi-fication Standard” composed of experts. In addition, it has been revised based on the implementation sta-tus.
Table 1 Measurement items in each test.
Test Items
A: Static com-pression test (pre-test)
Height (pretest) H1, Reaction force R1, Energy absorption E1
B:Durability test Specimen temperature (pretest) T1, ※Ambient temperature (during test) TS, Specimen temperature (posttest) T2
C:Static com-pression test (posttest)
Height H2, Residual strain δR (δR = H1- H2) , Reaction force R2 , Energy absorp-tion E2
※Ambient temperature: Temperature within 3 m from the specimen
72

Table 1 shows the measurement items in the dura-bility test and the static compression tests performed before and after the durability test.
The test rules stipulate the following: (a) The specimen used for the durability test should
be a fender that is at least the minimum size of a com-mercially available product. This means that the size of the fender is the minimum size or more described in the product catalog by rubber fender manufacturers.
(b) In the durability test, compression is repeated 3,000 times with a cycle of 150 s or less until the rated strain specified by the manufacturer is reached or ex-ceeded. After the durability test, it is confirmed that there are no cracks, defects, or significant perfor-mance degradation. Regarding the cycle and the number of times compression is repeated, the ten-dency of the fender performance to decline due to past test results, the number of times vessels berth at port facilities within their service life, the perfor-mance of the testing machine used for durability tests, etc., are taken into account.
(c) The specimen temperature at the start of the du-rability test must be 23°C±5°C, and the specimen must not be artificially cooled before or during the test.
(d) Although the test room temperature is not spec-ified, continuous measurement is required.
(e) A static compression test (pretest) before the durability test is performed to determine the energy absorption E1 and reaction force value R1. In addition, a static compression test (posttest) after the durability test is performed to obtain the energy absorption E2 and reaction force value R2.
(f) The static compression test must be performed within 24 hours of the durability test. This is a regu-lation established for the reason that the heat gener-ated during the durability test dissipates over time and that the rubber fender’s performance is affected.
Several types of rubber properties, ranging from soft to hard for a fender of the same shape and size, are listed in the manufacturer’s catalog. By selecting these materials appropriately, it is possible to con-sider the structure of the mooring facility and the ves-sel’s hull structure by adjusting the rubber grades. The durability test was specified to be performed on the hardest and softest of these materials. The values of the reaction force and energy absorption for the same shape and dimensions vary depending on the manufacturer and the fender shape, but most of them range from 0.6 to 2.0. (2) Evaluation of the durability test result
The result of the durability test is judged to pass if the following requirements are met:
a. No cracks are observed visually. b. The energy absorption and reaction force values
in the static compression posttest are not signifi-cantly lower than those in the static compression pretest.
Since the above requirements are qualitative ex-pressions and cannot be used in pass/fail judgments, the purpose of this study is to propose an appropriate threshold value for condition b on the basis of the past results. 4. EVALUATION OF TEST RESULTS (1) Evaluation of test data
The reaction force ratio (R2/R1) and energy absorp-tion ratio (E2/E1) were obtained from the results measured in the static compression tests, the pretest, and posttest. The relationship between them, and the residual strain δR of the fender, ambient temperature TS, and specimen temperatures T1, T2, etc., were ana-lyzed.
Rubber fenders are classified into the three catego-ries below according to their shape and how they de-form when loaded. Figure 1 shows examples of typ-ical shapes for each classification.
G-A: V-type, etc. (When the strain reaches approx-imately 10%–20% of the height of the fender, it un-dergoes overall compressive deformation when sub-jected to a load. If the strain exceeds 20%–30%, buckling deformation occurs in the legs, and the re-action force becomes almost constant).
G-B: Vertical cylindrical type, etc. (As with shape G-A, the fender deforms as a whole up to approxi-mately 10%–20% of its height, and the reaction force becomes almost constant due to the buckling defor-mation of the legs over 20%–30%. In addition, the expansion of the diameter of the rubber fender boosts the reaction force).
G-C: Planar structure, etc. (The fender is used mainly for small ships such as in fishing ports, and it absorbs energy mainly by compressive deformation of the rubber against impact).
The relationship between the strain and reaction force of rubber fenders is classified into the four pat-terns below, as shown in Fig. 2. Figure 2 shows the rated strain as 50%, but the rated strain of fenders var-ies depending on the shape and is 40% to 70% of the fender height.
P-1: The reaction force peaks at a certain strain and then decreases and increases again (Buckling type I).
P-2: As with P-1, there is buckling but no peak, and then the reaction force increases (Buckling type II).
P-3: The reaction force increases in a high-order curve with respect to the strain (Curvilinear increase type).
P-4: The reaction force increases proportionally with strain (Linear increase type).
73

(1) Shape G-A
(2) Shape G-B
(3) Shape G-C
Fig. 1 Examples of each classification of fender shape.
Fig. 2 Classification of fender types by the performance curve.
The energy absorption E1 in the static compression test (pretest) of the fender with P-1 is obtained from the area surrounded by A-B-C (the range of the solid line AB, rated strain C, and horizontal axis) in Fig. 3. The method of determining the energy absorption E2 in the static compression test (posttest) is not con-sistent depending on the year of the test. In early 2010, when durability tests began in Japan, the way to handle the residual strain was not standardized in the calculation of the energy absorption E2. Since 2012, the energy absorption E2 has been standardized
Fig. 3 Reaction forces before and after the durability test (conceptual).
in consideration of the effect of the residual strain εR (=δR/H1, on the horizontal axis AA' in Fig. 3). When the residual strain in the static compression test (posttest) is not included in compression (hereafter abbreviated as “not included”), the energy absorption i s the enc losed area of A 'B"C ' in Fig . 3 . (the range of the dashed lines A'B" and C'). In this case, even if there is a residual strain, the reaction force characteristics are considered up to the same compression amount C'(= C+A') as in the initial com-pression. On the other hand, when the residual strain is included (hereafter abbreviated as “included”), the clearance of the residual strain is included in the com-pression. Therefore, the energy absorption when the residual strain is included (A'B'C) is generally smaller than the value when the residual strain is not included.
Figure 4 shows examples of the relationship be-tween the strain and reaction force before and after the durability test for P-1 to P-4 in Fig. 2. “Pretest” indicates the results before the durability test, and “Posttest” indicates the results after the durability test. In all the characteristics, the reaction force after the durability test is reduced, and the energy absorp-tion obtained by integrating the reaction force is also reduced.
Figure 5 shows an example of a comparison of the energy absorption ratios obtained by both methods using the same test results with and without the resid-ual strain. In this example, it can be seen that the en-ergy absorption ratio when the residual strain is in-cluded is evaluated as 5% to 10% lower than when the residual strain is not included. Cases whose en-ergy absorption ratio exceeds 100% correspond to the shape G-C and characteristic P-3 shown above.
(2) Analysis of the test results a) Test results
The number of test samples subjected to the dura-bility test is 131. Table 2 shows the number of test samples according to the classification described
74

(1) P-1
(2) P-2
(3) P-3
(4) P-4
Fig. 4 Reaction forces before and after the durability test.
above with and without the residual strain. The sam-ple numbers are 87 and 44, respectively. Shape G-A and shape G-B are classified as curve pattern P-1 or P-2, and shape G-C is classified as P-3 or P-4. The classifications of P-1 to P-4 in the table are based on
Fig. 5 Ratio of energy absorption with and without the
residual strain.
Table 2 Number of samples of each shape and curve pattern. (Residual strain not included, n=44)
P-1 P-2 P-3 P-4 G-A 24 0 0 0 G-B 16 2 0 0 G-C 0 0 1 1
(Residual strain included, n=87) P-1 P-2 P-3 P-4
G-A 43 10 0 0 G-B 18 0 0 0 G-C 0 0 9 7
Table 3 Conditions and results of durability tests. (Residual strain not included, n=44)
Items Average Standard
deviation
Coefficient
of variation
Specimen height (mm) 291 106 0.37
Compression cycle (s) 52.5 43.5 0.79
Specimen temperature (°C) 22.4 2.34 0.10
Ambient temperature (°C) 23.6 3.50 0.15
Reaction force ratio (%) 93.4 6.72 0.072
Energy absorption ratio (%) 90.5 4.53 0.050
(Residual strain included, n=87)
Items Average Standard
deviation
Coefficient
of variation
Specimen height (mm) 265 128 0.48
Compression cycle (s) 53.3 42.1 0.79
Specimen temperature (°C) 22.9 2.24 0.10
Ambient temperature (°C) 23.4 3.64 0.16
Specimen temperature,
posttest (°C)
27.0 3.36 0.12
Residual strain (%) 2.12 1.05 0.50
Reaction force ratio (%) 92.4 7.97 0.086
Energy absorption ratio (%) 86.4 5.30 0.061
the curve of the strain and reaction force before the durability test, but some of the characteristics change from P-1 to P-2 after the durability test.
Table 3 shows the durability test conditions (the test specimen height, specimen temperature, com-
75

pression cycle, and ambient temperature) and test re-sults (residual strain εR, reaction force ratio R2/R1, and energy absorption ratio E2/E1) with and without the residual strain, as well as the mean value, standard deviation, and coefficient of variation of those data. The average reaction force ratio with the residual strain is 92.4%, which is approximately 1% lower than the average value without the residual strain, 93.4%. In addition, the average value of the energy absorption ratio when the residual strain is included is 86.4%, which is approximately 4% lower than the average value, 90.5%, without the residual strain.
Table 4 shows the test conditions, the average value of the test results, and the standard deviation for each shape of the fender for the test samples that include the residual strain. The average values of the energy absorption ratios are approximately the same at 86.4%, 86.0%, and 86.7% for shape G-A, shape G-B, and shape G-C, respectively, but the standard de-viation is large for shape G-C.
The specimen height used for the durability test is at least the minimum size described in the catalog of the fender. Figure 6 shows the frequency distribution of the specimen heights used in the durability test. The mode value varies depending on the shape of the specimen. For shape G-A, the height is 200 mm (200 mm to less than 300 mm in the figure); for shape G-B, the height is 400 mm (400 mm to less than 500 mm in the figure); and for shape G-C, the height is 100 mm (100 mm to less than 200 mm in the figure).
The specimen temperature at the start of the dura-bility test is specified as 23±5°C, but as shown in Fig. 7, most specimens fall into the range of 20°C to 25°C. Some specimens are close to the upper limit of 28°C and the lower limit of 18°C. On the other hand, there are cases where the ambient temperature (average) during the durability test varies greatly on the high-temperature side (maximum 33.1°C) or on the low-temperature side (minimum 14.5°C). There is no re-quirement for temperature control in the laboratory during the durability test, but there are provisions that the sample must not be artificially cooled. The tests on the low-temperature side may eventually cool the specimen, and the tests on the high-temperature side may accelerate the heating of the rubber surface. The effect of the ambient temperature on the specimen temperature will be described later. b) The reaction force ratio and energy absorption
ratio Figure 8 shows the frequency distribution of the
reaction force ratio. The average reaction force ratio in residual inclusions is 92.4%, as shown in Table 3. If it is not included, it is 93.4%. There are some sam-ples with a reaction force ratio exceeding 100%, and this can be seen in the case where the reaction force
value at the rated strain increases rapidly due to re-peated compression. Increasing the reaction force re-quires caution when the reaction force affects the structural design, such as in a dolphin fender.
Figure 9 shows the frequency distribution of the energy absorption ratio. In relation to the strain and reaction force after the durability test, the reaction force tends to decrease after the durability test for the same strain, so the energy absorption ratio is less than 100%. Among both specimens with and without re-sidual strain, many specimens had a value of 80% or more, but some specimens were below 80%. As shown in Table 3, the average absorbed energy ratio is 86.4% with the residual strain and 90.5% without the residual strain. The most frequent number is 80%–85% with the residual strain and 90%–95% without the residual strain. If the residual strain is not included, the reaction force and energy absorption are overestimated in the static compression test after the durability test, so the subsequent analysis will be lim-ited to the data with the residual strain (87 samples). The number of samples analyzed for the specimen temperature T2 after the test is 35.
Table 4 Conditions and results of durability tests. (by shapes, residual strain included)
G-A (n=53) G-B (n=18) G-C (n=16)
Ave SD Ave SD Ave SD
Specimen height (mm) 271 12.1 378 64.7 119 20.6
Compression cycle (s) 54.5 38.1 83.2 46.7 15.6 8.21
Specimen temperature
(°C)
23.3 2.24 23.2 2.41 21.4 1.36
Ambient temperature (°C) 24.0 3.43 22.9 4.23 21.9 1.24
Specimen temperature,
posttest (°C)
26.5 2.87 30.1 3.12 23.8 1.79
Residual strain (%) 2.16 1.02 1.83 0.94 2.33 1.26
Reaction force ratio (%) 93.7 7.15 93.0 6.57 87.8 10.5
Energy absorption ratio
(%)
86.4 4.39 86.0 5.46 86.7 7.77
Ave: Average, SD: Standard Deviation
Fig. 6 Height of the specimens.
76

Fig. 7 Temperature of the specimens before the test and the
ambient temperature during the test.
Fig. 8 Distribution of the reaction force ratio.
Fig. 9 Distribution of the energy absorption ratio.
Figure 10 shows the relationship between the re-
action force ratio and the energy absorption ratio when the residual strain is included. There are cases where the reaction force ration exceeds 100%, but the energy absorption ratio is less than 100%. A reaction force ratio exceeding 100% can be seen in the exam-ples where the fender material undergoes residual strain, the fender material height decreases, and the reaction force increases near the rated strain. c) Effect of the compression cycle
Each manufacturer’s test was conducted over a wide range of compression cycles, 150 s or less. The minimum compression cycle was 7.9 s (test time 6.6 h), and the maximum compression cycle was 146.5 s
Fig. 10 Reaction force ratio and energy absorption ratio
(residual strain included).
Fig. 11 Compression cycle and energy absorption ratio
(residual strain included). (test time 122.1 h). Figure 11 shows the relationship between the compression cycle and the energy ab-sorption ratio when the residual strain is included. Shape G-C has a small compression cycle due to the small height of the test specimen, as shown in Fig. 6. The figure shows that the compression cycle has little effect on the energy absorption ratio. d) Specimen temperature after the durability test
The temperature of the fender specimen T1 before the durability test increases after the test to T2. Fig. 12 (1) and Fig. 12 (2) show the frequency distribution of the specimen temperature before and after the du-rability test. Since the rubber generates heat due to the repeated compression, the specimen temperature after the test rises. In particular, shape G-B tends to have a high specimen temperature after the durability test.
Figure 13 shows the relationship between the am-bient temperature and the specimen temperature after the test. From the figure, the coefficient of determi-nation R2 of both regression equations is 0.57, but R2 = 0.77 for shape G-A alone.
Figure 14 shows the relationship between the am-bient temperature and the specimen temperature in-crease after the test (T2-T1). Shape G-B shows a large temperature change. From the figure, R2 of both re-gression equations is 0.13, but R2 = 0.27 for shape G-A alone.
77

(1) Before the durability test
(2) After the durability test
Fig. 12 Distribution of specimen temperatures before and after the durability test.
Fig. 13 Ambient temperature and specimen temperature
after the test. Figure 15 shows the relationship between the
rated strain of the fender and the temperature change of the specimen after the test (T2-T1). The fenders with a higher rated strain show a greater temperature increase, especially for the shape G-B. From the fig-ure, R2 of both regression equations is 0.26.
Figure 16 shows the relationship between the fender height and specimen temperature change (T2-T1). The higher the fender height, the larger the tem-perature change after the test. The R2 value of both regression equations is 0.44. Tests at high ambient temperatures lead to an increase in the specimen tem-perature, as described later, which also leads to an in-crease in the residual strain of the fender and a decrease in the energy absorption ratio. Since these
Fig. 14 Ambient temperature and specimen temperature increase.
Fig. 15 Rated strain and specimen temperature increase.
Fig. 16 Fender height and specimen temperature increase.
Fig. 17 Frequency distribution of the residual strain.
items are important factors in the durability evalua-tion, appropriate management of the ambient temper-ature is important.
78

e) Residual strain The fenders undergo a residual strain after the du-
rability test. If the initial height before the test is H1 and the height after the test is H2, the residual dis-placement can be calculated as δR (δR= H1- H2). The value obtained by dividing the residual displacement by the initial height H1 is the residual strain εR.
Figure 17 shows the frequency distribution of re-sidual strain. The average residual strain is 2.12%, as shown in Table 3, with 2%–3% being the most fre-quent values. Figure 18 shows the relationship be-tween the specimen temperature T2 after the test and the residual strain. After the durability test, the rubber was softened, and the surface temperature of the specimen increased due to the heat generated by com-pression. From the figure, the R2 of the regression equation is as low as 0.04, but R2 is 0.45 for the shape G-A alone, as shown in Fig. 19. f) Residual strain and energy absorption
Figure 20 shows the relationship between the re-sidual strain εR and the energy absorption ratio (E2/E1). The energy absorption ratio tends to decrease as the residual strain increases. As shown in the fig-ure, the R2 of the regression equation is as low as 0.10. When limited to shape G-A, R2 is 0.19, as shown in Fig. 21. As shown in Fig. 22, R2 is 0.24 for shape G-B. Although the PIANC guidelines do not provide a quantitative index of performance degradation, an energy absorption ratio of 80% or more and a residual strain of 5% or less may be proposed as a criterion based on many previous test results. This will be an-alyzed in the next section, and a criterion will be pro-posed based on this analysis. g) Consideration on test results
Statistical analysis of test results and correlation analysis of parameters were performed for reaction force, absorbed energy, etc. in the static compression test (pretest and posttest) conducted before and after the durability test. In the test results, the coefficient of variation of the data was large for some parame-ters, and the coefficient of determination R2 was low for the correlation between the variables. The reasons are as follows: a. As mentioned above, the test specimens of rub-
ber fenders were made larger than the minimum size shown in the manufacturer’s catalog. There-fore, the shape and size of the test specimen were different for each specimen.
b. The reaction force and absorbed energy of the rubber fender were temperature-dependent, but in the durability test, there was no temperature regulation in the test room during the durability tests, and the test was conducted at different am-bient temperatures for each test piece.
c. The posttests were performed within 24 hours af-ter durability test, then, there were different heat
dissipation conditions after durability tests. Due to the nature of this test, the shape and size of
the test piece cannot be unified, but in the future, it is considered that the above-mentioned variation can be reduced by making the test environment temperature condition and so on.
Fig. 18 Specimen temperature after the test and the residual
strain.
Fig. 19 Specimen temperature after the test and the residual
strain (shape G-A).
Fig. 20 Residual strain and the energy absorption ratio.
Fig. 21 Residual strain and the energy absorption ratio
(shape G-A).
79

Fig. 22 Residual strain and the energy absorption ratio
(shape G-B). 5. STATISTICAL EVALUATION OF THE
DURABILITY TEST RESULTS (1) Reduction in the reaction force and energy
absorption after the durability tests In the durability test, 3,000 loadings were per-
formed up to the rated strain. As described above, the pass/fail judgment of the durability performance is based on the following: (a) no cracks are observed visually; (b) the reaction force ratio R2/R1 and energy absorption ratio E2/E1 before and after the durability test are not significantly reduced. Here, the reaction force ratio, energy absorption ratio and residual strain are evaluated statistically based on the results of the durability tests. The load conditions of this durability test, which repeatedly compresses fenders to the rated deflection, seem much more severe than actual berth-ing conditions, for instance, as in the results from the survey7). In addition, the berthing interval of an actual vessel differs from several hours to several days ac-cording to the mooring facility, but it must be much larger than the loading cycle of this test (150 s or less).
In addition, regarding the relationship between the number of vessel berthings and years, if the ship berthing interval is one day, then 103, 3 × 10³, 104, and 105 vessel berthing events correspond to 2.7, 8.2, 27.4, and 274 years, respectively. If it is one week, they correspond to 19.2, 57.5, 192, and 1918 years, respectively. The regulation of the number of dura-bility tests is not based on the number of vessel berth-ings, but is rather an index of the durability of rubber fenders.
A reduction in the reaction force due to repeated compression has been reported for fenders used in the mooring of floating bridges8). Although it depends on the strain amplitude, the decreasing tendency at 3,000 compressions is almost the same as in the test results. In addition, for berths where several vessels berth a day, 3,000 repeated tests may be considered insuffi-
Fig. 23 Reaction force degradation of rubber fenders8).
(1) Reaction force ratio
(2) Energy absorption ratio
Fig. 24 Probability of the reaction force ratio and the energy absorption ratio.
cient, but as shown in Fig. 23, the decrease in the re-action force hardly changes up to tens of thousands
80

of compressions. This indicates that there is no sig-nificant difference between 3,000 compressions and tens of thousands of compressions in terms of dura-bility. Therefore, when the performance degradation after 3,000 repeated compression tests is within a cer-tain value, the fender can be expected to maintain its durability against tens of thousands of compressions. From this point of view, an index for the durability evaluation can be obtained based on the statistical analysis of the results of the durability tests that have been conducted so far.
In the durability test, as shown in Table 1, R1 and E1 are obtained in the static compression pretest, and R2 and E2 are obtained in the static compression post-test. Therefore, the values of R2/R1 and E2/E1 are ob-tained for each test specimen. Since these contain samples of various shapes and dimensions, we will investigate the statistical distribution properties of R2/R1 and E2/E1 for each shape and classification shown in Fig. 1.
Figure 24 (1) shows the distribution of the reaction force ratio R2/R1 in the durability test, and Fig. 24 (2) shows the distribution of the energy absorption ratio E2/E1. Shape G-A and shape G-B have similar distri-butions of the reaction force ratio and absorbed en-ergy ratio. In contrast, shape G-C has a different dis-tribution shape. Shape G-A and shape G-B are fend-ers targeted by the PIANC guidelines, while shape G-C is a small fender that is mainly used in fishing ports. Therefore, statistical analysis is performed sep-arately.
(2) Regression curves used in the analysis
As shown in Fig. 24(1) and Fig. 24(2), R2/R1 and E2/E1 show different distribution shapes for each fender sample. In addition, as shown in Fig. 6, the size of the specimen also varies from product to prod-uct. Therefore, it should be noted that the distribution properties shown here are not variations in perfor-mance for standard specimens such as steel and con-crete. Here, we analyze the performance change of rubber fenders. Various factors are involved in the performance of the fender due to repeated loading, and it is difficult to identify the performance with a specific probability distribution model. Therefore, here, we will compare the distribution functions used for the probability distributions of materials and ex-amine them with the goal of identifying the distribu-tion shape and the shape parameter with the best fit.
Regression curves with a normal distribution, lognormal distribution, and Weibull distribution (k = 2.0, 3.0, 4.0, 5.0) were fitted to the test data. The co-efficients of the plotting formula in equation (3) were normalized with reference to Goda9), and the lognor-mal distribution was set to α = 0.375 and β = 0.25 according to Blom10). For the Weibull distribution,
(1) shape G-A, shape G-B
(2) shape G-C
Fig. 25 Probability of the reaction force ratio.
Table 5 Probability distribution of the reaction force ratio (shape G-A, shape G-B).
Shape
parameter A B R2 R2/R1 (%)
0.05 0.025 0.01
Normal - - - 0.972 82.0 79.8 77.3
Lognormal - - - 0.937 82.7 80.8 78.7
Weibull
2.0 15.2 80.0 0.994 83.5 82.5 81.6
3.0 21.4 74.4 0.973 82.3 80.7 79.0
4.0 27.0 69.0 0.951 81.9 79.8 77.6
5.0 32.4 63.7 0.933 81.6 79.3 76.7
81

equation (4), modified by Goda12) from Petruaskas and Aagaard11), was used.
F 𝑥 1 exp 𝐵 𝑥 ∞ (3)
𝐹 1 𝑚 1, 2, … . . ,𝑁 (4)
𝛼 0.20 0.27/√𝑘, 𝛽 0.20 0.23/√𝑘 (5)
Here, A is the scale parameter, B is the position pa-rameter, k is the shape factor, m is the sample number, and N is the sample size. (3) Results by regression analysis
Figure 25 shows the distribution function for the re-action force ratio. Table 5 shows the regression es-timates of the reaction force ratios for R2 and the non-exceedance probabilities of 0.05, 0.025, and 0.01 for each probability distribution of the reaction force ra-tios in shape G-A and shape G-B. If the level of the probability of nonexceedance is set to 0.025, then R2 / R1 = 83% (Weibull distribution, k=2.0).
Table 6 shows the regression estimates of the re-action force ratios for R2 and the nonexceedance probabilities of 0.05, 0.025, and 0.01 for each proba-bility distribution of the reaction force ratios in the durability test for shape G-C. If the nonexceedance probability is set to 0.025, then R2/R1 = 70% (lognor-mal distribution). However, for shape G-C, the num-ber of test samples is small, and R2 of the regression equation is small compared to those of shape G-A and shape G-B; therefore, it is desirable to re-evaluate these equations with accumulated future data.
Figure 26 shows the distribution function for the energy absorption ratio. Table 7 shows the regression estimates of the energy absorption ratios for R2 and the nonexceedance probabilities of 0.05, 0.025, and 0.01 for each probability distribution of the energy absorption ratios for shape G-A and shape G-B. If the level of the probability of nonexcedance is set to 0.025, then E2/E1=77% (Weibull distribution, k=4.0).
Table 6 Probability distribution of the reaction force ratio
(shape G-C).
Shape
parameter A B R2 R2/R1 (%)
0.05 0.025 0.01
Normal - - - 0.916 70.6 67.3 63.4
Lognormal - - - 0.943 72.6 70.1 67.3
Weibull
2.0 21.8 68.4 0.859 73.4 71.9 70.6
3.0 30.4 60.6 0.825 71.9 69.5 67.2
4.0 38.3 53.1 0.801 71.3 68.3 65.2
5.0 45.9 45.7 0.784 71.0 67.7 63.9
(1) shape G-A, shape G-B
(2) shape G-C
Fig. 26 Probability distribution of the energy absorption ratio.
Table 7 Probability distribution of the energy absorption ratio (shape G-A, shape G-B).
Shape
parameter A B R2 E2/E1 (%)
0.05 0.025 0.01
Normal - - - 0.972 78.7 77.2 75.5
Lognormal - - - 0.982 78.9 77.5 76.0
Weibull
2.0 9.97 77.5 0.962 79.7 79.1 78.5
3.0 14.4 73.5 0.987 78.8 77.7 76.6
4.0 18.4 69.6 0.990 78.4 77.0 75.5
5.0 22.2 65.9 0.988 78.2 76.5 74.8
82

Table 8 Probability distribution of the energy absorption ratio (shape G-C).
Shape
parameter A B R2 E2/E1 (%)
0.05 0.025 0.01
Normal - - - 0.912 73.9 71.5 68.6
Lognormal - - - 0.943 74.6 72.5 70.2
Weibull
2.0 16.9 71.7 0.940 75.5 74.4 73.4
3.0 24.1 65.2 0.938 74.1 72.2 70.4
4.0 30.6 58.9 0.928 73.5 71.2 68.6
5.0 36.9 52.8 0.919 73.2 70.5 67.5
Table 8 shows the regression estimates of the en-
ergy absorption ratios for R2 and the nonexceedance probabilities of 0.05, 0.025, and 0.01 for each proba-bility distribution of the energy absorption ratios in the durability test for shape G-C. If the nonexceed-ance probability is set to 0.025, then E2/E1 = 73% (lognormal distribution). Again, for shape G-C-type fenders, the results should be reevaluated by future accumulated data because the number of test samples and the R2 of the regression equation are small.
Figure 27 shows the distribution function for re-sidual strain. Table 9 shows the regression estimates of residual strain for R2 and the nonexceedance prob-abilities of 0.05, 0.025, and 0.01 for each probability distribution of residual strain in the durability tests for shape G-A and shape G-B. If the nonexceedance probability level is set to 0.025, then εR= 4.2% (Weibull distribution, k=5.0).
Table 10 shows the regression estimates of the re-action force ratio for R2 and the nonexceedance prob-ability (0.05, 0.025, and 0.01) for each probability distribution of the residual strain in the durability test for shape G-C. If the nonexceedance probability is set to 0.025, εR = 4.8% (normal distribution). However, shape G-C should be reevaluated by future accumu-lated data because the number of test samples and the R2 of the regression equation are small. As described above, regarding the durability test results, when evaluating the performance ratio for either the reaction force or the energy absorption, the ratio does not change much. Since the evaluation is based on the absorption of the berthing energy, the energy absorption should be considered. The resid- ual train is considered to be an important factor that shows signs of performance degradation. Therefore, the energy absorption ratio and the residual strain are specified based on the durability test results. From the durability test results, it was estimated that the energy absorption ratio after 3,000 repeated compres-sions for the characteristic shapes G-A and G-B was 77% with a nonexceedance probability of 0.025, and the residual strain was 4.2%. However, considering that R2 is not very high and that the difference in the estimated values is large due to the probability distri-
(1) shape G-A, shape G-B
(2) shape G-C
Fig. 27 Probability of residual strain.
Table 9 Probability distribution of the residual strain (shape G-A, shape G-B).
Shape
parameter A B R2 εR (%)
0.05 0.025 0.01
Normal - - - 0.923 3.72 4.04 4.41
Lognormal - - - 0.769 4.36 5.13 6.19
Weibull
2.0 -2.10 3.94 0.921 3.46 3.60 3.73
3.0 -2.27 4.82 0.966 3.68 3.91 4.15
4.0 -3.95 5.66 0.981 3.77 4.08 4.40
5.0 -4.79 6.47 0.987 3.83 4.18 4.56
83

Table 10 Probability distribution of the residual strain (shape G-C).
Shape
parameter A B R2 εR (%)
0.05 0.025 0.01
Normal - - - 0.923 4.41 4.81 5.27
Lognormal - - - 0.842 4.72 5.43 6.40
Weibull
2.0 -2.58 4.81 0.821 4.03 4.20 4.35
3.0 -3.75 5.68 0.848 4.29 4.58 4.87
4.0 -4.83 6.71 0.872 4.41 4.78 5.18
5.0 -5.87 7.72 0.880 4.48 4.90 5.38
bution function, an absorption energy ratio of 80% and residual strain of 5% may be used as criteria.
As described above, using the repeated test results, the reaction force ratio R2/R1, the absorbed energy ratio E2/E1, and the probability distribution of the re-sidual strain were obtained, and a threshold value for judging the performance degradation was proposed. However, among the test conditions, it is considered that the test body temperature and the ambient tem-perature of the test room affecting this cannot be ig-nored, and analysis of these effects is a future subject. 6. CONCLUSION
In this study, we analyzed the relationships among the performance change before and after the durabil-ity test and the ambient temperature, the specimen temperature after the test, and the residual strain. The main conclusions are as follows:
(1) Since the ambient temperature affects the spec-imen temperature after the test and affects the resid-ual strain and energy absorption ratio, appropriate temperature control is required (Figs. 13 to 15).
(2) The manufacturers’ tests are conducted over a wide range of times, 150 s or less, but this has little effect on the energy absorption ratio (Fig. 11).
(3) After the durability test, rubber softens, and re-sidual strain occurs. The variation in the relationship between the specimen temperature and the residual strain after the test is large, and the R2 value is small (Figs. 18 and 19).
(4) The energy absorption ratio tends to decrease as the residual strain increases, but the variation is large and the R2 value is small (Figs. 20 to 22).
(5) The PIANC guidelines stipulate that the perfor-mance required after the durability test is that “there are no visible cracks, and the performance does not significantly reduce.” From the results of previous tests, “the energy absorption ratio does not fall below 80%, and the residual strain is 5% or less” can be pro-posed as one criterion.
7. FUTURE ISSUES
From the results of the durability test, the perfor-mance change after the repeated compression of fenders was analyzed. Among the test conditions, there were cases where the ambient temperature was not required to be constant in the test room, and it was confirmed that the effect on the test results was sig-nificant. In the future, the unification of test methods and conditions will be an issue. The analysis of the test results is based on limited data, such as the reac-tion force ratio, energy absorption ratio, and residual strain, before and after the durability test. Evaluation from a microscopic point of view, such as studying changes in the molecular structure of the rubber ma-terial and internal crack growth during the durability test, has not been performed. Evaluation methods based on the microscopic changes that occur along with the reduction in the reaction force are a topic for the future. ACKNOWLEDGMENT: In preparing this paper, we thank the manufacturers of fenders for their con-sent to announce the test results. In addition, this pa-per has undergone deliberation at the “Rubber Fender Durability Certification Committee” and “Foreign Material Quality Review and Certification Commit-tee” established at SCOPE. Part of the data organiza-tion was performed in cooperation with Hokkaido University of Science graduates Kota Rikanji and Syunsuke Fukazawa. We would like to express our deep appreciation to the above parties. REFERENCES 1) Coastal Development Institute of Technology: Guidelines
for the maintenance of rubber fender systems (2nd Edition), Sep. 2019.
2) PIANC : Guidelines for the Design of Fender System, Re-port of Working Group 33 of the Maritime Navigation Com-mission, 2002.
3) Ports and Harbours Bureau, Ministry of Land, Infrastruc-ture, Transport and Tourism : Standard Specifications for Port and Harbour Works, Vol. 1, 2018. (in Japanese)
4) Shiraishi, S. and Nakashima, S. : Analysis of Durability Test Results on Rubber Fenders for Mooring Facilities in Ports, Journal of Japan Society of Civil Engineers, Vol. 75, No. 2, pp. I_821-I_826, 2019. (in Japanese)
5) The Ports and Harbours Association of Japan : Technical Standards and Commentaries of Port and Harbour Facilities in Japan, 2018.
6) Coastal Development Institute of Technology: Guidelines for Design and Testing of Rubber Fender Systems, June 2019.
7) Murakami, K., Takenobu, M., Miyata, M. and Yoneyama, H.: Fundamental Analysis on the Characteristics of Berthing Velocity of Ships for the Design of Ports Facilities, Tech-nical Note of National Institute for Land and Infrastructure Management, No. 864, 54p., 2015. (in Japanese)
8) Ueda, S., Shiraishi, S., Maruyama, T., Uezono, A., Ta-kasaki, M. and Yamase, S.: Properties of Rubber Fender in
84

use of Mooring for Floating Bridge, 14th Ocean Engineer-ing Symposium, The Society of Naval Architects of Japan, pp. 359-364, 1998. (in Japanese)
9) Goda, Y.: Taiha Kougaku (Wave Resistant Engineering), Chapter 13 Extreme Value Statistical Analysis, Kajima In-stitute Publishing Co., Ltd, pp. 327-379, 2008. (in Japanese)
10) Blom, G.: Statistical Estimates and Transformed Beta-Var-iable, John Wiley and Sons, Chapt. 12, 1958.
11) Petruaskas, C. and Aagaard, P. E.: Extrapolation of Histori-
cal Storm Data for Estimating Design Wave Heights, 2nd Offshore Technology Conference, OTC-1190, 1970.
12) Goda, Y.: Numerical Investigation on Plotting Formulas and Confidence Intervals of Return Values in Extreme Statistics, Report of the Port and Harbour Research Institute, Vol. 27, No. 1, pp. 31-92, 1988. (in Japanese)
(Received March 2, 2020)
(Accepted December 8, 2020)
85