edit begin-ch1 alm finalrev
TRANSCRIPT


Technology Demonstration for Reducing Mercury Emissions from Small-Scale Gold Refining Facilities
ANL/EVS/TM/08-6
byL.J. Habegger,1 L.E. Fernandez,2 M. Engle,2 J.L. Bailey,3 D.P. Peterson,1 and M.M. MacDonell11Environmental Science Division, Argonne National Laboratory2U.S. Environmental Protection Agency3Nuclear Engineering Division, Argonne National Laboratory
forU.S. Environmental Protection Agency Office of International Affairs, Washington, D.C.
February 2008


Technology Demonstration Report i February 2008
TECHNOLOGY DEMONSTRATION FOR REDUCING MERCURY EMISSIONS FROM SMALL-SCALE GOLD REFINING FACILITIES
TABLE OF CONTENTS
NOTATION.............................................................................................................................................. iv ACKNOWLEDGEMENTS...................................................................................................................... v ABSTRACT.............................................................................................................................................. vii 1 INTRODUCTION .............................................................................................................................. 1-1 2 DESIGN BASIS FOR AN AEROSOL COLLECTOR...................................................................... 2-1 2.1 Theoretical Basis ...................................................................................................................... 2-1 2.1.1 Coagulation Theory ..................................................................................................... 2-1 2.1.2 Impaction Theory ........................................................................................................ 2-2 2.2 Critical Parameters for Conceptual Design .............................................................................. 2-5 3 DESIGN AND CONSTRUCTION OF A MERCURY COLLECTION SYSTEM........................... 3-1 3.1 Initial Prototypes and Modifications ........................................................................................ 3-1 3.2 Selected Baffle Plate Design .................................................................................................... 3-3
3.2.1 Steel Drum and Gas Inlet............................................................................................. 3-4 3.2.2 Upper Cover ................................................................................................................ 3-4
3.2.3 Fan ............................................................................................................................... 3-4 3.2.4 Baffle Plate Assembly ................................................................................................. 3-10 3.2.5 Final Assembly ............................................................................................................ 3-10
4 INSTALLATION METHOD ............................................................................................................. 4-1 5 SAMPLING APPROACH.................................................................................................................. 5-1 5.1 Sampling with a Single Charcoal Filter.................................................................................... 5-1 5.2 Particle Size Sampling.............................................................................................................. 5-6 5.3 Determining the Mercury Aerosol Removal Efficiency........................................................... 5-8 6 PROTOTYPE TESTING IN BRAZILIAN GOLD SHOPS ............................................................. 6-1 6.1 Pebble Bed System at Marsam ................................................................................................ 6-1 6.2 Initial Baffle Plate System at Melado Ouro ............................................................................. 6-2 6.3 Initial Baffle Plate System at D’Gold ...................................................................................... 6-3 6.4 Modified (Narrow-Gap) Buffer Plate System at Ourominas ................................................... 6-3 6.5 Modified (Narrow-Gap) Buffer Plate System at Parmetal ...................................................... 6-4 6.6 Water-based Kalimantan System.............................................................................................. 6-5 7 SUMMARY AND RECOMMENDATIONS .................................................................................... 7-1 8 REFERENCES ................................................................................................................................... 8-1

Technology Demonstration Report ii February 2008
TABLE OF CONTENTS (Cont’d.) APPENDIX A: HEALTH AND SAFETY PLAN OUTLINE.......................................................... A-1 APPENDIX B: LOG SHEET FOR REPORTING SAMPLING RESULTS.................................... B-1 APPENDIX C: DRÄGER TUBE INSTRUCTIONS........................................................................ C-1 APPENDIX D: KALIMANTAN FUME HOOD AND WATER-BASED FILTER DESIGN ........ D-1
TABLES
2-1 Stokes Number for the 50% Collection Efficiency for Impactors .................................................. 2-4
3-1 Candidate Systems for Mercury Aerosol Collection....................................................................... 3-1
3-2 Parts Referenced from Engineering Drawings................................................................................ 3-3
6-1 Results of Selected Test Demonstrations ........................................................................................ 6-7
FIGURES
1-1 Location of the Gold Shop Demonstration Sites in Parà, Brazil..................................................... 1-2
1-2 Example of Mercury Collector Installation in Gold Shop in Creporizão, Brazil ............................ 1-3
2-1 Cross-sectional View of an Impactor ............................................................................................. 2-2
2-2 Typical Impactor Efficiency Curve ................................................................................................ 2-3
2-3 Cutoff Curves for Actual and Ideal Impactors ................................................................................ 2-4
2-4 Conceptual Design of a Mercury Collection System ...................................................................... 2-5
2-5 Thermal Coagulation of Aerosols As a Function of Time .............................................................. 2-6
2-6 Ratio of Kinematic to Thermal Coagulation As a Function of Particle Diameter .......................... 2-7
2-7 Nozzles and Impact Surfaces Created by a Pebble Bed Configuration .......................................... 2-8
2-8 Nozzles and Impact Surfaces with the Alternate Baffle Plate Configuration ................................. 2-8
3-1 Schematic Detail of Baffle System Components ........................................................................... 3-2
3-2 Alternate Entry Design and Flow Pattern ....................................................................................... 3-5
3-3 Steel Drum and Gas Inlet Engineering Detail ................................................................................ 3-6
3-4 Steel Drum and Gas Inlet Construction, Side Entry (photos) ........................................................ 3-7
3-5 Upper Cover Section Engineering Detail ....................................................................................... 3-8
3-6 Upper Cover Section Construction Photo ...................................................................................... 3-9
3-7 Fan Section Engineering Detail ..................................................................................................... 3-9
3-8 Measuring Relative Face Velocity .................................................................................................3-10
3-9 Baffle Plate Assembly Engineering Detail .....................................................................................3-11

Technology Demonstration Report iii February 2008
TABLE OF CONTENTS (Cont’d.)
FIGURES (Cont’d.)
3-10 Suggested Baffle Plate Construction Method .................................................................................3-12
3-11 Completed System .........................................................................................................................3-13
4-1 Typical Hood and Exhaust Configuration without Mercury Condenser/Collector......................... 4-1
4-2 Vertical Mercury Collector System Installation with Side Entry.................................................... 4-2
4-3 Horizontal Mercury Collector System Installation with Side and Bottom Entry............................ 4-3
4-4 Examples of Vertical and Horizontal Mercury Collector System Installations (photos) ................ 4-4
5-1 Typical Hood and Exhaust Configuration....................................................................................... 5-1
5-2 Sampling Train ............................................................................................................................. 5-2
5-3 Sample in the Syringe Mixed with Clean Air in the Dilution Bag (photo) ..................................... 5-3
5-4 Diluted Sample Analysis with Dräger Tube (photo)....................................................................... 5-3
5-5 Sample Labels (photo) .................................................................................................................... 5-4
5-6 Sampling Train: Preparing to Draw a Sample (photo).................................................................... 5-5
5-7 Shipping Containers for Used Charcoal Filters (photo) .................................................................. 5-5
5-8 Schematic of the RESPICONTM Multi-Stage Impactor .................................................................. 5-7
5-9 Conceptual Illustration of the Mercury Aerosol Concentration During a Burn.............................. 5-8
6-1 Sampling Locations for the Pebble Bed System: Marsam Gold Shop (photo) ............................... 6-2
6-2 Sampling Locations for the Baffle Plate System: Melado Ouro Gold Shop................................... 6-3
6-3 Sampling Locations for the Modified Baffle Plate System: Ourominas Gold Shop (photo) .......... 6-4
6-4 Sampling Locations for the Modified Baffle Plate System: Parmetal Gold Shop (photo).............. 6-5
6-5 Sampling Locations for the Water-Based Kalimantan System (photo) .......................................... 6-6

Technology Demonstration Report iv February 2008
NOTATION
This section highlights standard abbreviations and acronyms used in this report; in general, those used only in limited text, tables, or equations and defined where used are not repeated here.
cm centimeter(s) EPA U.S. Environmental Protection Agency ft feet g gram(s) GI galvanized iron hr hour(s) HSP health and safety plan IDLH immediately dangerous to life or health (concentration) (NIOSH) in. inch lpm liters per minute m3 cubic meter(s) mg milligram(s) ml milliliter(s) mm millimeter(s) NIOSH U.S. National Institute for Occupational Safety and Health OIA Office of International Affairs (EPA) OSHA U.S. Occupational Safety and Health Administration Pa Pascal (unit of pressure) PEL permissible exposure limit (OSHA) PPE personal protective equipment Re Reynolds number REL recommended exposure limit (NIOSH) RfC reference concentration rpm revolutions per minute s second(s) sm square meter(s) Stk Stokes number TLV threshold limit value (American Conference of Governmental Industrial Hygienists, Inc.
[ACGIH]) µg microgram(s) µm micron(s) USD U.S. dollars

Technology Demonstration Report v February 2008
ACKNOWLEDGEMENTS Argonne National Laboratory Loren J. Habegger Project Manager James L. Bailey Theoretical basis/engineering design of collector systems Adelio C. Corcuera Collector system design graphics John T. Davis, James L. Woodring Industrial hygiene consultation, sampling procedures Margaret MacDonell Final report compilation Dave Peterson Sample collection and analysis, on-site safety procedures Denise M. Seeman Analysis of mercury content in charcoal filter samples U.S. Environmental Protection Agency Marianne Bailey, Marilyn Engle Technical and administrative program management Luis E. Fernandez Technical direction; communication with local, regional, and
federal governmental environmental officials Cameryl J. Hill-Macon, Stephen Hoffman Program technical and policy consultation Itaituba and Creporizao, Para, Brazil Prefeitura Municipal Itaituba, Secretario de Minieraçao e Medio Ambiente: Dirceu Santos Sobrinho, On-site coordination with gold shops Elias Leão Moraes Edison Assunçao de Silva Fabrication and installation of the mercury collector systems Gold shop owners and operators Brazilian Environmental and Information Technology Agency: ECODATA ECODATA personnel Translation of report into Portuguese and Spanish

Technology Demonstration Report vi February 2008
United Nations Industrial Development Organization, Global Mercury Project (GMP) Rodolfo Neiva de Sousa Participation in collector fabrication and installation in the
Parmetal shop, Itaituba Marcello Veiga Chief technical advisor, GMP; coordination with EPA
project leads

Technology Demonstration Report vii February 2008
ABSTRACT Gold that is brought from artisanal and small-scale gold mining areas to gold shops for processing and sale typically contains 5-40% mercury. The uncontrolled removal of the residual mercury in gold shops by using high-temperature evaporation can be a significant source of mercury emissions in urban areas where the shops are located. Emissions from gold shop hoods during a burn can exceed 1,000 mg/m3. Because the saturation concentration of mercury vapor at operating temperatures at the hood exhaust is less than 100 mg/m3, the dominant component of the exhaust is in the form of aerosol or liquid particles. The U.S. Environmental Protection Agency (EPA), with technical support from Argonne National Laboratory (Argonne), has completed a project to design and test a technology to remove the dominant aerosol component in the emissions from gold shops. The objective was to demonstrate a technology that could be manufactured at low cost and by using locally available materials and manufacturing capabilities. Six prototypes designed by Argonne were locally manufactured, installed, and tested in gold shops in Itaituba and Creporizão, Brazil. The initial prototype design incorporated a pebble bed as the media for collecting the mercury aerosols, and a mercury collection efficiency of over 90% was demonstrated. Though achieving high efficiencies, the initial prototype was determined to have practical disadvantages such as excessive weight, a somewhat complex construction, and high costs (>US$1,000). To further simplify the construction, operation, and associated costs, a second prototype design was developed in which the pebble bed was replaced with slotted steel baffle plates. The system was designed to have flexibility for installation in various hood configurations. The second prototype with the baffle plate design was installed and tested in several different hood/exhaust systems to determine the optimal installation configuration. The significance of coagulation and collection of the mercury aerosols in exhaust ducts, which is dependent on the hood and collector configuration, was also evaluated. Prototype demonstration tests verified the theoretical basis for mercury aerosol capture that can be used to optimize the baffle plate design, flow rates, and hood exhaust ducts and plenum to achieve 80% or higher removal efficiencies. Results indicated that installation configuration significantly influences a system’s capture efficiency. Configurations that retained existing inlet ducts resulted in system efficiencies of more than 80%, whereas installation configurations without inlet ducts significantly reduced capture efficiency. As an alternative to increasing the volume of inlet ducts, the number of baffle plates in the system baffle assembly could be doubled to increase efficiency. Recommended installation and operation procedures were developed on the basis of these results. A water-based mercury capture system developed in Indonesia for installation in smaller shops was also tested and shown to be effective for certain applications. The cost of construction and installation of the baffle plate prototype was approximately US$400. These costs were reported as acceptable by local gold shop owners and government regulators, and were significantly lower than the cost of an alternate charcoal/copper mesh mercury filter available in the region, which costs about US$10,000. A sampling procedure that consists of a particle filter combined with a vapor analyzer was demonstrated as an effective procedure for analyzing both the aerosol and vapor components of the mercury concentrations. Two key findings for enhancing higher mercury collection were identified. First, the aerosol/vapor mercury emissions must be given sufficient time for the mercury particles to coagulate to a size that can be readily captured by the baffle plates. An interval of at least 6 seconds of transit time between the point of evaporation and contact with the slotted baffle plates is recommended. Some particles will also deposit in the exhaust ducts between the point of evaporation and the baffle plates. Second, the slots in the baffle plates create jets that force the mercury particles to impinge and adhere on

Technology Demonstration Report viii February 2008
downstream surfaces. The baffle plates should closely follow the designs developed for this system to be most effective.

Technology Demonstration Report 1-1 February 2008
1 INTRODUCTION Millions of people in more than 55 countries are involved with artisanal gold mining and refining, producing 20-30% of the world supply at 500-800 tonnes/year (Telmer 2006). These small-scale artisans have long used mercury as part of the mining process to collect gold from the ore. Adding mercury to the ore forms a mercury-gold amalgam that is easier to separate from the ore than gold alone. The collected amalgam is then retorted by the miners to partially drive off the mercury, producing gold sponge or doré that can contain from 2% to 40% residual mercury. This doré is usually taken to a gold shop where it is heated with a high-temperature torch to more than 1,000°C, the melting temperature of the gold. Because mercury boils at 356°C, it is evaporated during this melting process and, if not captured, is emitted into the atmosphere. Because mercury is a potent neurotoxic, repeated exposures to relatively high levels of mercury can harm the central and peripheral nervous systems as well as other organs and systems. Atmospheric mercury emissions thus pose significant health and environmental concerns, including occupational health effects to gold shop operators, exposure to the communities in the area of the gold shops, long range transport to other regions, and ultimately deposition to land and water. A rudimentary fume hood used with a fan can pull the mercury vapors out of the work area. When mercury evaporates during heating, its vapors rapidly cool as they rise through this hood and out the exhaust. As it cools, the vapor condenses into small droplets so mercury in the hood exhaust is released as a mixture of droplets and vapor. (This process is analogous to vapors leaving a boiling teapot as a mixture of invisible water vapor and visible steam, which is simply microscopic water droplets from the condensed vapor.) Although hoods with exhausts can reduce exposures within the gold shop, that action of venting the mercury into the local air can increase exposures for people living or working nearby. Thus, current practices pose a concern for adverse health effects from chronic mercury exposures, both for workers in the gold-refining facilities and local communities. In response to this concern, the U.S. Environmental Protection Agency (EPA) Office of International Affairs (OIA) has initiated a technology demonstration project in Brazil to reduce mercury emissions associated with gold shops. This work was conducted with technical support from Argonne National Laboratory (Argonne) and the Carnegie Institute of Science at Stanford University. To promote local adoption, a key aim was for the system to be inexpensive and easy to construct using locally available materials and capabilities. Two basic prototypes of mercury collection systems were designed and refined at Argonne and then locally manufactured, installed, and tested in gold shops in Itaituba and Creporizão. These towns are located in the Tapajos gold-producing region of Parà State, Brazil (Figure 1-1). An example of an installation in the gold shop in Creporizão is shown in Figure 1-2. This report presents the results of the demonstrations in Itaituba and Creporizão. To frame the design of candidate systems, it is known that mercury levels can be greatly reduced by passing exhaust from the fume hood inside a gold shop through collectors to remove the mercury droplets, and then through filters to remove any remaining liquid and vapor. Depending on the rate of mercury evaporation and the exhaust velocity of the vapor, mercury levels in the exhaust typically range from several hundred to more than 1,000 mg/m3. As the exhaust from the fume hood rises and cools, mercury in the vapor phase is limited to its saturation concentration, which is about 15 mg/m3 at room temperature. Thus, liquid droplets or aerosols represent the dominant fraction of mercury released in ambient air. For comparison, the enforceable limit for mercury vapor in U.S. workplaces is 0.1 mg/m3 (OSHA 2004, NIOSH 2005), and 10 mg/m3 has been identified as the level immediately dangerous to life or health

Technology Demonstration Report 1-2 February 2008
(IDLH) (NIOSH 2005). Thus, in the absence of technologies to reduce these levels both within and in the vicinity of the gold shops, the health concern is substantial. The design of the mercury removal system focused on condensing/collecting the liquid-aerosol component of the exhaust for two main reasons:
1. To address the primary exposure concern – given that the liquid portion comprises most of the mercury in the exhaust (typically >90%); and
2. To facilitate implementation – by offering a simple system that would be affordable for most gold
shop owners. Increasing the likelihood of local use will help assure that the benefits of reduced mercury emissions are realized.
Toward this end, focusing the collection system on the liquid-aerosol fraction not only limits construction costs, it also avoids additional costs that would have been incurred by including a filter to capture residual vapors, including costs to maintain the dual system and dispose of the spent filters.
FIGURE 1-1 Location of the Gold Shop Demonstration Sites in Parà, Brazil
Itaituba
Creporizão

Technology Demonstration Report 1-3 February 2008
FIGURE 1-2 Example of Mercury Collector Installation in Gold Shop in Creporizão, Brazil This report is organized as follows.
• Chapter 2: Explains the theoretical basis and conceptual design considerations for mercury aerosol collectors. This chapter can be bypassed by readers who are only concerned with the construction, installation, and testing of the collectors.
• Chapter 3: Describes the design and construction of candidate systems for this project. • Chapter 4: Illustrates the system installation process. • Chapter 5: Discusses the sampling procedures used to test system performance. • Chapter 6: Provides the test results and estimated collection efficiencies from previous
applications of the technology. • Chapter 7: Summarizes key findings and offers suggested next steps for other applications of
the technology. • Chapter 8: Identifies the references cited in this report. • Appendix A: Outlines a suggested health and safety plan for projects involving mercury.

Technology Demonstration Report 1-4 February 2008
• Appendix B: Provides a log sheet suggested for reporting sampling data. • Appendix C: Gives operating instructions for the Dräger tube, a mercury vapor analyzer.
• Appendix D: Provides a schematic with explanation of the Kalimantan fume hood and filter
design.

Technology Demonstration Report 2-1 February 2008
2 DESIGN BASIS FOR AN AEROSOL COLLECTOR The scientific theory underlying aerosol collection is presented in Section 2.1, and the conceptual design and critical parameters considered in developing the mercury collectors for this project are described in Section 2.2. The content, including equations, figures, and tables, is summarized from Hinds (1982), a standard resource for aerosol technology. 2.1 THEORETICAL BASIS The most common technology designs for filtration and particle collection rely on two concepts: (1) construction of flow dynamics that cause particles to impact on a collector surface, and (2) adhesion of those particles to the surface after impact. Of the common forces on micrometer-sized aerosol particles, the adhesive forces dominate, and aerosol particles will attach firmly to any surface they contact. The adhesion of particles to surfaces is a complicated phenomenon, and there is no complete theory that accounts for all factors influencing adhesion. For the purposes of this discussion of mercury collector design, it can be assumed that after impact, the particles will adhere to the collector surface (i.e., will be removed from the flow stream), and thus the major design variable relates to improving flow dynamics to force the mercury particles to impact the collector surface more efficiently. Two key processes for this mercury removal, coagulation and impaction, are described below. 2.1.1 Coagulation Theory The effectiveness of flow dynamics in causing mercury particles to impact a collector surface increases for larger particle sizes. Because of the strong adhesion forces, aerosol particles will coagulate into larger particles on contact with each other. Coagulation is the most important interparticle phenomenon for aerosols. The objective of the theory of coagulation is to describe how the particle number concentration and particle size change as a function of time. An exact description is very complicated. However, in many cases a simplified theory is adequate for understanding the characteristics of coagulation and estimating changes in number concentration and particle size. The process of thermal coagulation occurs when the relative motion that causes contact between particles is the result of Brownian motion. Thermal coagulation is a spontaneous and ever-present phenomenon for aerosols. The process of kinematic coagulation occurs when the relative motion arises from external forces such as gravity or electrical forces or from aerodynamic effects. This process is crucial for the design of effective collectors for this demonstration project. The simplest case of coagulation is thermal coagulation of mono-disperse spherical particles. For this ideal case, particles are assumed to adhere at every collision, and the initial assumption is that particle size changes slowly. This type of coagulation is sometimes referred to as Smoluchowski coagulation after the person who developed the original theory. For thermal coagulation, the theory predicts that particle size, d, increases with time as:
d(t) = do (1 + No K t)1/3 (Equation 2.1) where No and K are parameters related to the characteristics of the aerosol material.

Technology Demonstration Report 2-2 February 2008
Turbulent flow produces eddies that cause relative motion between particles. For mono-disperse aerosols, the ratio of coagulation from turbulent flow to thermal coagulation is: (Equation 2.2) where b is a constant of order 10 and ε is the rate of energy dissipation per unit mass of gas. For turbulent flow in a duct of diameter dt and average velocity Uav:
ε = 2 f Uav3/dt, (Equation 2.3)
where f is the friction factor for the duct flow, similar to Cp. The quantity given by Equation 2.2 predicts that turbulent coagulation will be more important than thermal coagulation for particles larger than about 1 micron (μm). 2.1.2 Impaction Theory The typical design feature to achieve optimal impaction of entrained particles is to increase the velocity of the stream by passing it through a nozzle or jet directed toward an impaction plate as shown in Figure 2-1. The impaction plate deflects the flow to form an abrupt 90° bend in the streamlines. Particles with sufficient inertia are unable to follow the streamlines and impact on the flat plate. Smaller particles are able to follow the streamlines and avoid hitting the impaction plate. FIGURE 2-1 Cross-sectional View of an Impactor (Source: Hinds 1982) The parameter that governs collection efficiency is the Stokes number, a dimensionless number for a particle in fluid flow that represents the ratio of the stopping distance of the particle to a characteristic dimension of an obstacle, or:
Stk = τUo / dc (Equation 2.4) where τ is the relaxation time of the particle, Uo is the fluid velocity of the flow well away from the obstacle, and dc is the characteristic dimension of the obstacle. For Stk >>1, particles will continue in a straight line as the fluid turns around the obstacle, therefore impacting on the obstacle. For Stk <<1, particles will follow the fluid streamlines around the obstacle.

Technology Demonstration Report 2-3 February 2008
For an impactor, the Stokes number or impaction parameter is defined as the ratio of the particle stopping distance at the average nozzle exit gas velocity U to the characteristic dimension of the nozzle (jet), Dj/2, where Dj is the diameter of a round jet or width of a rectangular jet: (Equation 2.5) where ρp = particle density, dp = particle diameter, η = gas viscosity, and Cc = Cunningham slip correction factor (which is approximately 1 when dp >1μm). Collection efficiency curves for impactors are defined as the fraction of the trajectories that intercept the impaction plate. They are often plotted in a general form as efficiency versus the square root of the Stokes number (√[Stk]), which is directly proportional to particle size. Determining the characteristic efficiency curve of an impactor (see example in Figure 2-2) requires computer modeling and experimental calibration.
FIGURE 2-2 Typical Impactor Efficiency Curve (Source: Hinds 1982) Once this curve is calibrated, all geometrically similar impactors should give the same efficiency when operated at the same Reynolds number and Stokes number. The Reynolds number (Re) indicates the relative importance of two types of forces for a given flow condition, as a simple ratio of the intertial force (vsρ) and viscous force (μ/L). Turbulent flow is dominated by intertial forces, so the Reynolds number is high. (For laminar flow, viscous forces dominate, and the Reynolds number is low.) Although the shape of the efficiency curve depends on nozzle size, the streamlines are not strongly affected by the spacing between the nozzle and the plate, because the jet of aerosol expands only slightly until it reaches within about one jet diameter of the impaction plate. Hence, the characteristic dimension for the impactor is the nozzle radius or half-width rather than the spacing between the nozzle and the plate.

Technology Demonstration Report 2-4 February 2008
For most impactors, it is not necessary to construct a complete curve for impactor efficiency versus particle size. Impactors that have a “sharp cutoff” curve approach the ideal situation (from the standpoint of particle size classification) for a step-function curve, in which all particles greater than a certain aerodynamic size are collected and all particles less than that size pass through. As a practical matter, most well-designed impactors can be assumed to be ideal, and their efficiency curves can be characterized by a single number, Stk50, which is the Stokes number that gives 50% collection efficiency. This concept is illustrated in Figure 2-3. As shown in the figure, the Stk50 is equivalent to assuming that the mass of particles larger than the cutoff size that get through the impactor (i.e., the upper shaded area) equals the mass of particles below the cutoff size that are collected (i.e., the lower shaded area).
FIGURE 2-3 Cutoff Curves for Actual and Ideal Impactors (Source: Hinds 1982) Values for Stk50 are given in Table 2-1 for two types of impactor nozzles that meet the indicated criteria for Reynolds number and geometry. TABLE 2-1 Stokes Number for the 50% Collection Efficiency for Impactorsa
Impactor Type
Stk50
_____ √ (Stk50)
Circular nozzle 0.22 0.47
Rectangular nozzle 0.53 0.73
a These values apply when the Reynolds number is between 500 and 3,000 and x/Dj >1.5. Source: Hinds (1982).

Technology Demonstration Report 2-5 February 2008
The simplified model of the rectangular nozzle impactor analyzed above gives a Stk50 of 0.32, which is significantly smaller than the actual value given in Table 2-1. Equation 2.5 can be rearranged to identify the particle diameter with a 50% collection efficiency, d50, based on the values of Stk50 from Table 2-1. (Equation 2.6) This equation was used to develop the impactor design for the project, as described in Section 2.2. 2.2 CRITICAL PARAMETERS FOR CONCEPTUAL DESIGN From the underlying theory for physical mechanisms of aerosol coagulation and impaction, a conceptual design was outlined for a system to collect aerosolized mercury in gold shops. Figure 2-4 illustrates the general sequence of mercury aerosol formation and removal in a conceptual system.
FIGURE 2-4 Conceptual Design of a Mercury Collection System

Technology Demonstration Report 2-6 February 2008
Key design features for the test system were determined from the following considerations. The outlet exhaust of the fume hood and plenum of the collector system allow the mercury to cool and coagulate into larger particles. Some of these particles will contact and adhere to the walls of the exhaust and plenum. Remaining particles will be drawn through a collection medium via nozzles or jets that are followed by impactor plates to capture the particles. To support the conceptual design process, a typical fume hood was assumed for the system. In gold shops, mercury is boiled off in the fume hood and forms a hot vapor just above the crucible. Incoming ambient air from the open face of the fume hood causes the mercury vapor to condense rapidly to liquid particles. The flow rate through the fume hood is assumed to be 0.1 m3/sm, and the initial diameter of these liquid particles is conservatively estimated at 0.3 μm (minimum size). For a typical open face of 38 cm 61 cm (15 in. 24 in.), the resulting face velocity for the fume hood is an acceptable 0.44 m/s (86 ft/minute). A heat balance calculation between the heat from the torch and the heat capacity of the incoming air shows a negligible average temperature rise of the air/aerosol mixture in the hood. After condensing, a small amount of mercury remains in the vapor phase, which corresponds to the mercury vapor pressure at ambient temperature. Upon condensation, the 0.3 μm-diameter aerosol particles begin to coagulate into larger particles. As described in Section 2.1, thermal coagulation initially dominates when the particle diameters are small. The projected increase in particle size with time as a result of thermal coagulation is shown in Figure 2-5. Assuming a reasonable initial mass concentration of 600 mg/m3 in the fume hood, the corresponding particle concentration was calculated to be 3.13 1012 particles/m3. The average residence time for air flowing through the fume hood section was estimated to be about 3 seconds. From Figure 2-5, this time would produce a particle growth size of 0.3 to 4 μm from thermal coagulation. Thus, the average diameter of particles in the aerosol entering the duct/plenum section is estimated to be 4 μm. For particles of that diameter, and also considering the high turbulence in this section of the system, kinematic coagulation will dominate.
FIGURE 2-5 Thermal Coagulation of Aerosols As a Function of Time (Source: Hinds 1982) Particle growth by kinematic coagulation is very rapid compared to that for the thermal process. The ratio of kinematic to thermal coagulation verses particle diameter is plotted in Figure 2-6. This graph shows

Technology Demonstration Report 2-7 February 2008
that with an initial particle diameter of 4 μm, kinematic growth is 2 to 3 orders of magnitude faster than thermal growth. To illustrate, assuming the residence time of air and aerosol in the duct/plenum section is the same as that in the hood (3 seconds), then from the thermal coagulation plot in Figure 2-5, growth over 3 to 6 seconds corresponds to a diameter increase of about 1.25, which means a size increase from 4.2 to 5.3 μm. Based on the kinematic coagulation plot in Figure 2-6, a 200-fold increase in coagulation from thermal to kinematic processes could be expected. Increase in particle diameter is related to the cube root of the mass of the particle, which depends on the number, N, of particles that have coagulated. Therefore, the diameter of a particle after a 3-second residence time in the duct/plenum section due to kinematic coagulation can be calculated as follows: (200)1/3 1.25 4 μm = 30 μm. This calculated increase in particle size from 4 to 30 μm diameter is critical to the design of the downstream impactor for the mercury collection system.
FIGURE 2-6 Ratio of Kinematic to Thermal Coagulation as a Function of Particle Diameter (Source: Hinds 1982)
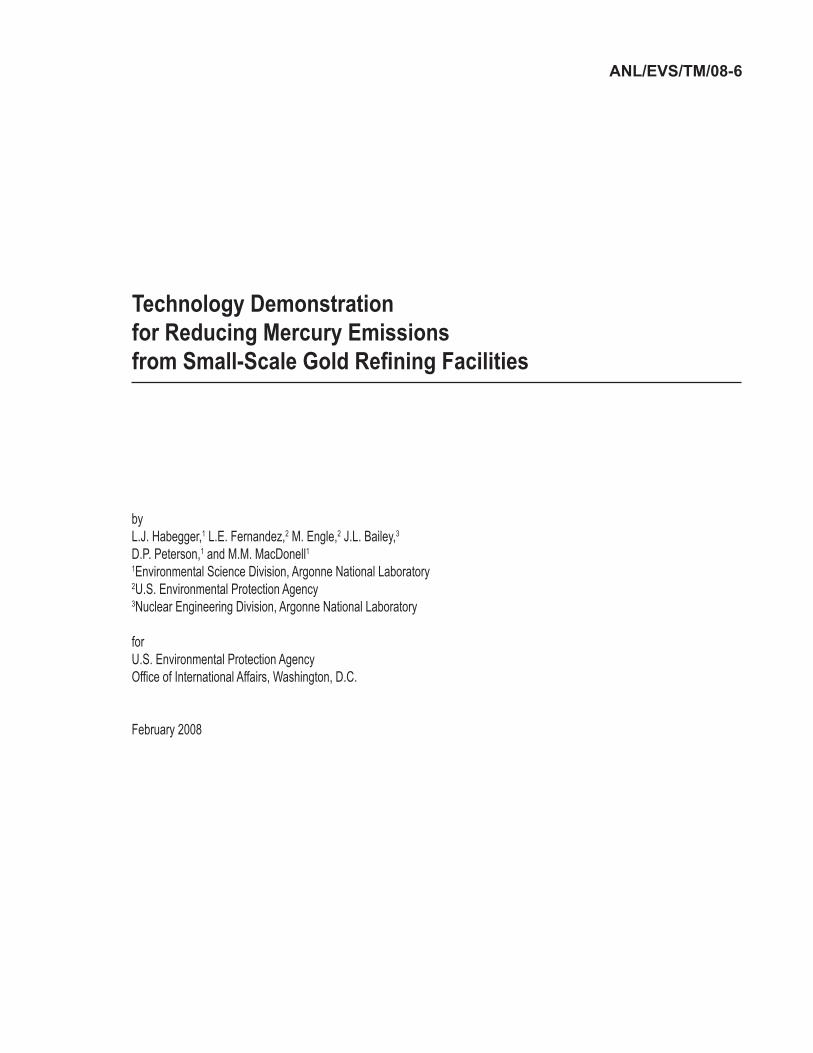
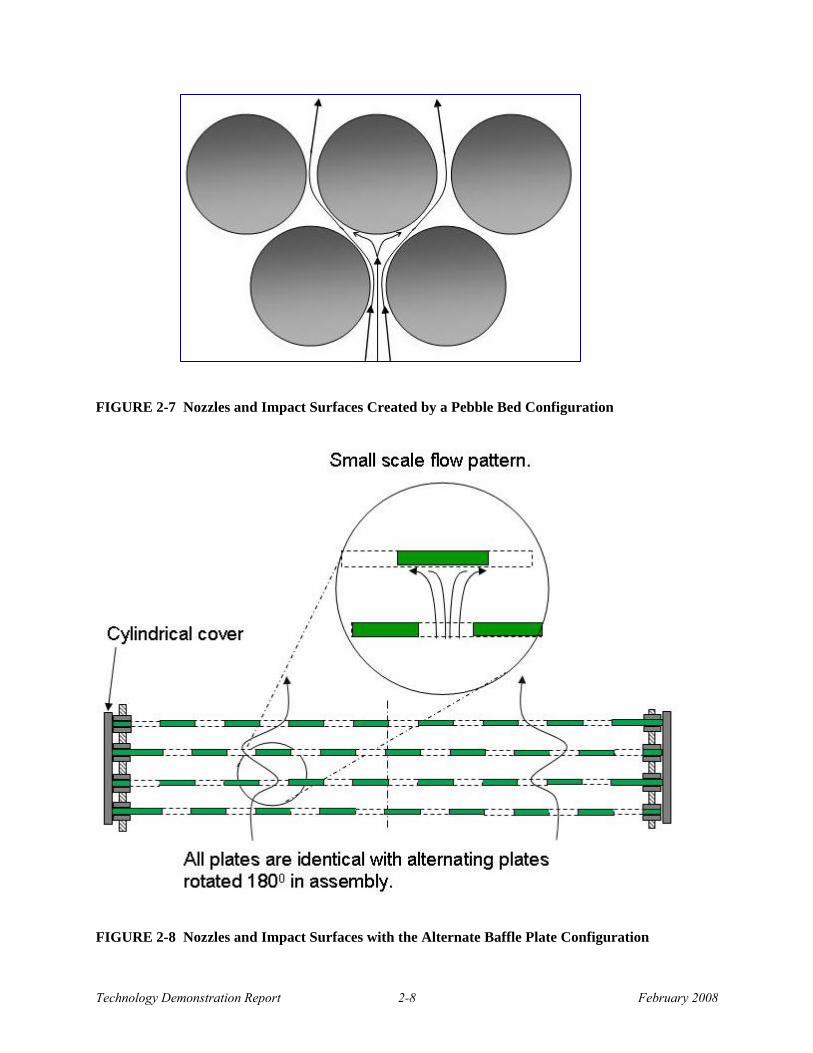
Although general descriptions of the test systems are provided in Chapter 3, conceptual diagrams of the first two prototypes are included in this section to offer useful context for the conceptual design criteria that emerged as key considerations during the evolution of these candidate systems. The initial prototype constructed and tested for this project was a pebble bed configuration, as shown in Figure 2-7. The pebbles effectively created both the nozzles and impaction plates for the air flow. This pebble bed design achieved good collection efficiencies and met design objectives at a reasonable cost. However, implementation was complicated by difficulties in maintaining proper control of the pebble shape and composition, pebble weight, and pebble bed enclosures that were needed for flexibility in system orientation. For these reasons, an alternate nozzle/impaction system was designed that relied on flat plates with slots, as illustrated in Figure 2-8. The slot sizing for this baffle plate design was calculated from information given in Section 2.1. That is, using a Stokes number of 0.53 for rectangular nozzles and considering a reasonable pressure drop across the impactor, a jet velocity of approximately 400 cm/s was calculated for a 1-cm slot. The length of the slots is determined by the total flow through the system (i.e., 0.1 m3/s). This velocity and slot size correspond to a Reynolds number of 2,600, which is within the range of acceptable impactor design. Based on these parameters, it is expected that half of the 4-μm diameter particles will be removed and nearly 100% of particles with diameter >10 μm will be removed.
Technology Demonstration Report 2-8 February 2008
FIGURE 2-7 Nozzles and Impact Surfaces Created by a Pebble Bed Configuration
FIGURE 2-8 Nozzles and Impact Surfaces with the Alternate Baffle Plate Configuration

Technology Demonstration Report 2-9 February 2008
In fact, a slot size of 1 cm is considered very marginal for two reasons: (1) resistance to air flow through the jet, and (2) limited pressure rise available from the fan. Somewhat larger slots (e.g., 2 cm) would assure adequate flow through the system. However, that size would result in loss of impactor efficiency for the smaller particles, notably those with a diameter of 4 μm. From this analysis, it is clear that having larger particles (>4 μm) entering the impactor is important to its efficiency, and that perhaps the average particle diameter should be more in the range of 20 to 30 μm in order to assure high impactor efficiency. It can be concluded from this evaluation that an adequate residence time in the duct/plenum section (where kinematic coagulation occurs) is critical to the design of the filter. This conclusion is also supported by the initial field tests performed to evaluate this design, where the efficiency for units with short duct/plenum sections was considerably lower than that for those with longer sections (see Chapter 6). This general overview of the design basis for a mercury collection system is obviously greatly simplified, and the calculations presented are approximate. However, they provide considerable insight into the features that are critical to filter efficiency and good design practice for this demonstration project.

Technology Demonstration Report 2-10 February 2008

Technology Demonstration Report 3-1 February 2008
3 DESIGN AND CONSTRUCTION OF A MERCURY COLLECTION SYSTEM
This chapter describes the iterative design and construction of demonstration systems for removing airborne mercury from gold shops in Brazil. In all, six demonstrations were conducted, with the design, construction, and testing based on the theoretical and conceptual features discussed in Chapter 2. The first prototype relied on a pebble bed design while subsequent versions reflected a baffle plate system, as outlined in Section 3.1. That section includes information on removal efficiencies highlighted from the overall test results presented in Chapter 6. The mercury collection system selected on the basis of the test demonstrations is described in Section 3.2. That section includes conceptual drawings, detailed engineering drawings, and photographs of actual construction. Together, these materials are intended to serve as a practical resource for guiding others who will construct this system at additional gold shops. 3.1 INITIAL PROTOTYPES AND MODIFICATIONS The initial prototype for a mercury collection system was based on the pebble bed configuration that was illustrated in Figure 2-7. With the pebbles creating effective nozzles and impaction plates for the flow, this system achieved >90% mercury collection efficiencies. Although design objectives were met and the cost was fairly low, several problems were discovered during implementation as noted in Section 2.2. Those difficulties led to a revised design for the nozzle/impaction system in which the pebbles were replaced with slotted flat steel plates as was illustrated in Figure 2-8. The baffle plate prototype was easier to construct, lighter, and less expensive than the pebble bed design. Therefore, this second prototype configuration was chosen as the basic template for the mercury aerosol collection unit, with subsequent refinements aimed at increasing collection efficiencies. An expanded view of the system using the baffle-plate design is presented in Figure 3-1. The variations on this design in terms of construction and assembly for installation produced mercury collection efficiencies ranging from roughly 40 to 95%. The various systems tested in different gold shops in Parà, Brazil are summarized in Table 3-1. TABLE 3-1 Candidate Systems for Mercury Aerosol Collectiona Number General Description of the Mercury Collection Unit Test Gold Shop
1 Pebble bed (first prototype design) Marsam
2 Baffle plate (second prototype design) Melado Ouro
3 Baffle plate (second prototype design) D’Gold
4 Baffle plate with narrow gaps (modified second prototype design) Ourominas
5 Baffle plate with narrow gaps (modified second prototype design) Parmetal
6 Water-based Indonesian system (smaller than project-designed prototypes) (weld shop) a The gold shops for the first, second, fourth, and fifth tests are located in Itaituba; the third test location
(D’Gold) was in Creporizão. For the sixth test, a model of the water-based system originally designed in Indonesia was set up for testing in a local fabrication shop.

Technology Demonstration Report 3-2 February 2008
FIGURE 3-1 Schematic Detail of Baffle System Components
weld
weld
weld

Technology Demonstration Report 3-3 February 2008
3.2 SELECTED BAFFLE PLATE DESIGN Results of the test demonstrations (summarized in Chapter 6) determined the preferred prototype, and this section provides more specific information for that prototype with the aim of guiding future construction activities at other gold shops. Included are conceptual drawings, detailed engineering drawings, and photographs of actual construction. (Some of these pictures are from field demonstrations for earlier prototype designs of the baffle system.) Basic parts referenced in engineering drawings are listed in Table 3-2. The combined cost to construct and install this baffle plate system was roughly $400 (USD). (Note that net operating costs could be reduced by reselling the mercury collected.) This system can be installed in various hood configurations typically found in gold shops. A water-based system for installation in smaller shops was also tested and was shown to be effective for certain applications, as discussed in Chapter 6. TABLE 3-2 Parts Referenced from Engineering Drawings Item Quantity Description Construction Notes
1a 1 200-liter (55-gallon) drum Top and 150-mmb inlet opening cut out 2 1 Drum top mounting ring; outer dia matches
drum dia; 4 t; cover topside with gasket material
Drill 6 holes for bolting to cover; weld bolt nuts to underside of holes
3 1 L-shaped inlet pipe; 3-mm t Weld to drum 4 1 Small dia tube with valve for mercury drain Weld to drum; use locally available tubing 5 1 Deflector plate; semi-circular disc; 3 t Bottom inlet only; dia adjusted for welding to
inside drum 6 1 Flow control damper; 150 dia x 2 t; optional Welded to bolt penetrating exhaust pipe 7 1 Exhaust pipe; 150 dia x 3 t Length adapted to application 8 1 Conical outlet hood; 3 t 9 1 Flat hood supporting ring, 4 t Drill 6 holes to match item 2
10 1 Trapezoidal flow smoothing plenum; 2 t Welded to inside of Item 8 11 1 Cylindrical upper fan support ring; 4 t Sized to fit outside of fan; drill 6 holes for
attaching to fan 12 1 Fan (See Section 2 for fan capacity requirements) 13 4–6c Baffle plate support ring; 3 t 14 Metal baffle plate strips; 9 per plate; 2 t Cut to length for welding to support ring 15 4–6 Reinforcing bar; one per plate; 3 t dia Spot weld to baffle metal strips and
supporting ring 16 1 Cylindrical baffle assembly cover; 2 t 17 1 Cylindrical lower fan support ring; 4 t Sized to fit inside of fan; drill 6 holes for
attaching to fan a Items 1–4 appear in Figure 3-3; item 5 appears in Figure 3-2; items 6–11 appear in Figure 3-5; item 12 appears in
Figure 3-7; and items 13–17 appear in Figure 3-9.
b Dimensions are mm, unless otherwise noted; t=thickness. Some dimensions may need to be adjusted for specific applications and depending on the local availability of materials. All surfaces to be coated with rust-inhibiting paint. Total weight is approximately 45 kg.
b Larger number of plates is to ensure higher collection efficiencies for designs without sufficient mixing volume
preceding the collector.

Technology Demonstration Report 3-4 February 2008
Basic information is provided in the following subsections for five main construction elements: steel drum and gas inlet, upper cover, fan, baffle plate assembly, and final assembly. 3.2.1 Steel Drum and Gas Inlet To simplify construction and keep costs down, a standard steel drum is used to house the aerosol collection system. These drums have an approximate volume of 200 liters (55 gallons) and dimensions of 600 mm (23.5 in.) in diameter and 880 mm (35 in.) in height. A clean, used drum in good condition is recommended to avoid problems that could be caused by residual materials or leaks. As an important precaution, welding torches or hot sparks from grinding should not be allowed in the vicinity of partially closed drums because those drums could explode if they formerly contained flammable materials. The inside of the drum and other internal surfaces should be coated with rust-inhibiting paint to extend the operating life of this system. The location of the gas inlet from the hood exhaust can be at the side or bottom of the drum, as shown in Figure 3-2. The critical aspect of inlet construction is that the gas be directed either toward the bottom of the drum as shown in Figure 3-2(a), or toward a baffle plate as shown in Figure 3-2(b). This ensures mixing of the gas in the drum to increase the residence time, which promotes mercury cooling and coagulation. Also, driving the gas against the steel plate will cause some of the mercury droplets to be removed by adherence at the point of impact. Engineering details of the steel drum and gas inlet are shown in Figure 3-3, and construction photos are provided in Figure 3-4. The cover of the drum is removed and a flat ring is welded to the top for bolting the internal assembly in place. Holes for bolt fasteners are drilled into the ring, and the bolt nuts are welded below the ring because after the assembly is attached, there will no longer be access below the ring to hold the nuts. 3.2.2 Upper Cover The drum cover is a cone-shaped plenum that is welded to a flat ring with bolt holes that match the upper ring on the drum, as illustrated in Figures 3-5 and 3-6. (A pyramid-shaped plenum could be used to facilitate this part of the construction.) Inside the plenum is a vertical vane that is necessary to prevent fan-induced rotational flow that will inhibit upward flow. A section of pipe is attached to the top of the cone for connecting to the duct that leads to the outside of the gold shop. A valve for regulating flow is shown installed in the pipe, although for many applications there is no need to regulate flow. Below the cone, a ring is welded for attaching this component to the upper part of the fan housing. 3.2.3 Fan A 50-cm (20-in.) fan (illustrated in Figure 3-7) is connected at the top to the ring welded to the cone assembly, and at the bottom to the ring welded to the baffle assembly. The fan used in this design was 220 volt and 3,600 rpm, and it produced a flow rate of approximately 0.1 m3/s. The flow rate was 6 m/s in the 15-cm (6-in.) diameter ducts at the system inlet and exit and 0.5 m/s in the drum cavity with the 50-cm diameter. The electrical wiring from the fan is drawn through a hole in the conical plenum. Where it passes through the hole, this electrical wire should be wrapped with a protective insulation such as electrical tape.

Technology Demonstration Report 3-5 February 2008
(a) Side Entry and Flow
(b) Bottom Entry and Flow FIGURE 3-2 Alternate Entry Design and Flow Pattern
Side view Top view
5
Deflector plate

Technology Demonstration Report 3-6 February 2008
FIGURE 3-3 Steel Drum and Gas Inlet Engineering Detail (dimensions are in mm)
Internal rust Inhibitor paint
Weld to top of drum
362
150 mm cut out
1
2
3
4
597
597 mm outer diameter 510 mm inner diameter
Six bolt holes with mounting nuts welded on under side

Technology Demonstration Report 3-7 February 2008
FIGURE 3-4 Steel Drum and Gas Inlet Construction, Side Entry

Technology Demonstration Report 3-8 February 2008
FIGURE 3-5 Upper Cover Section Engineering Detail (dimensions are in mm)
140
Threaded steel rod
Flow control damper
Baffle to smooth
air flow
Upper fan support ring Holes for bolt fasteners
6
7
8
9
11
597 515
500 Inner dia
500 inner dia 597 outer dia
10
257

Technology Demonstration Report 3-9 February 2008
FIGURE 3-6 Upper Cover Section Construction Photo FIGURE 3-7 Fan Section Engineering Detail (dimensions are in mm)

Technology Demonstration Report 3-10 February 2008
Flow inlet
Some adaptation may be required if local fans are used. The flow rate should not be significantly higher than 0.1 m3/s, or 0.5 m/s in the drum cavity, in order to allow sufficient transit time for the mercury droplets to coagulate. On the other hand, the flow should be high enough so the velocity into the hood opening (the face velocity) is at least 0.25 m/s (50 ft/minute) to protect the safety of workers in the shop. This face velocity can be controlled at a given volumetric flow rate by changing the size of the hood face. At a flow rate of 0.1 m3/s, a hood face of 0.4 m2 will give the minimum face velocity of 0.25 m/s. The photograph below (Figure 3-8) illustrates the measurement of relative face velocity with an inexpensive Alcor™ wind speed monitor.
For fans with higher flow rates, an adjustable baffle can be placed in the collector system exhaust to control the rate (see Figure 3-5). The fan can also be placed external to the drum. However, it should always be downstream from the drum to maintain a negative relative pressure within the drum. This will ensure that any flows from leaks are directed inward into the mercury collection system.
FIGURE 3-8 Measuring Relative Face Velocity 3.2.4 Baffle Plate Assembly The purpose of the baffle plate assembly is to force the air flow through slots that serve as nozzles or jets. These slots are designed such that the momentum of the mercury aerosol particles in the jet flow will cause them to impact and adhere on baffle surfaces downstream. The four plates are constructed identically with the slot openings on each individual plate offset from the plate centerline so that when the alternating plates are assembled with a 180o rotation, the solid strips are over open slots on the plate below. This assembly is illustrated in Figures 3-9 and 3-10. More baffle layers can be added to increase overall collection efficiency. The suggested construction method for individual baffle plates is to weld sized strips that are 40 mm (1.25 in.) wide, with 10-mm spacing between strips, onto a flat ring. A ring is welded to the top of the baffle assembly for bolting it to the fan housing, and a cylindrical ring around the assembly prevents bypass flow around the baffle assembly. 3.2.5 Final Assembly The cone plenum, fan, and baffle assembly are bolted together into an integral unit, which is then set into the drum and bolted to the upper ring of the drum with gasket material between, as shown in Figure 3-11.

Technology Demonstration Report 3-11 February 2008
FIGURE 3-9 Baffle Plate Assembly Engineering Detail (dimensions are in mm)
Cover
Support ring; weld to top baffle;
bolted to fan
Baffle plates (4)
20
Individual baffle plate design
15
14
13
Metal strips
Support ring
16
17
495 outer dia
500
40
40
10
32.5

Technology Demonstration Report 3-12 February 2008
FIGURE 3-10 Suggested Baffle Plate Construction Method
Strips of flat bar steel (40 mm width and 10 mm spacing) are welded to a flat ring.

Technology Demonstration Report 3-13 February 2008
FIGURE 3-11 Completed System

Technology Demonstration Report 3-14 February 2008

Technology Demonstration Report 4-5 February 2008
4 INSTALLATION METHOD The installation of each system needs to be adapted to the configuration of the gold shop for which it has been made. A typical hood-and-exhaust system without a mercury collector is shown in Figure 4-1. Installation can be either horizontal or vertical, and the inlet can be from the side or bottom of the drum if the inlet is appropriately designed (see Figure 3-2). Some of the collector installation options are illustrated in Figures 4-2 through 4-4. As stated in the analysis in Section 2.2, to ensure mercury aerosol collection efficiencies of 80% or more, the hood and collector configuration should result in a transit time of the mercury from the point of evaporation to the collector baffles of at least 6 seconds. This transit times allows the mercury aerosol particles to coagulate to sizes of 10-30 μm, which are readily captured by the baffle plate design shown in Section 3. If it is not possible to construct the system to allow this transit time, additional baffle plates can be added to increase efficiency. The quantitative effect of additional baffle plates has not been demonstrated. The design of the hood and collector system must consider several factors to ensure appropriate flow rates and transit times. The collector system design is based on a nominal flow rate of 0.1 m3/s to be delivered by the collector fan (Figure 3-7). For some installations, achieving and maintaining this rate may require continued use of an existing fan as a supplement. For the safety of gold shop staff, the hood face velocity (i.e., the flow of the air into the hood opening during operation) should be a minimum of 0.4 m/s (~80 ft per minute) The combination of face velocity of at least 0.4 m/s and 0.1 m3/s volume flow rate implies a hood opening of no more than 0.2 m2. The transit time can be approximated by dividing the estimated combined hood and duct volume by the flow rate. For example, a 1-meter volume of the hood plus duct with a 0.1 m3/s flow rate gives a 10-s transit time. This estimated transit time assumes perfect mixing of the evaporated mercury vapor/aerosol with the air in the hood. (The web site in Filip [undated] can be used to calculate the volume of the portion of the hood that is pyramid shaped.) FIGURE 4-1 Typical Hood and Exhaust Configuration without Mercury Condenser/Collector

Technology Demonstration Report 4-5 February 2008
FIGURE 4-2 Vertical Mercury Collector System Installation with Side Entry

Technology Demonstration Report 4-5 February 2008
FIGURE 4-3 Horizontal Mercury Collector System Installation with Side and Bottom Entry

Technology Demonstration Report 4-5 February 2008
FIGURE 4-4 Examples of Vertical and Horizontal Mercury Collector System Installations

Technology Demonstration Report 5-1 February 2008
5 SAMPLING APPROACH
The objective of a collector system is to remove aerosol or particulate components in the hood exhaust. Thus, the basic function of a sampling and analysis scheme is to determine what level of particulates remain after the gas exits the system and is discharged to the atmosphere. To assess system performance, the monitoring system also measures aerosol levels at the collection system inlet as well as the vapor concentration at the inlet and outlet. The scheme for sampling with a single charcoal filter is described in Section 5.1, and that for sampling by particle size is described in Section 5.2. The approach for calculating the mercury aerosol removal efficiency by using sampling results is presented in Section 5.3. 5.1 SAMPLING WITH A SINGLE CHARCOAL FILTER Aerosol at the inlet of the collection system and the vapor concentration at the inlet and outlet can be measured using (1) a pump or syringe (or other vacuum chamber) to draw a sample, and (2) a filter to capture the particulates. An analysis of the mercury content in the filter for the volume of sample withdrawn will then indicate the mercury aerosol or particulate concentration. The design of the sampling and analysis scheme to assess mercury removal is based on typical parameters of the evaporation process used in gold shops and the equipment configuration. Typical hood and exhaust configurations (one without and one with a mercury collector system) are shown in Figure 5-1.
(a) No Controls Installed (b) With Mercury Collector System
FIGURE 5-1 Typical Hood and Exhaust Configuration
Sampling Ports

Technology Demonstration Report 5-2 February 2008
Pump or syringe
Charcoal filter
Typical concentrations of mercury in the hood exhaust can be illustrated by using a hypothetical example: • Consider evaporation of 5 grams of mercury in the hood using a high-temperature torch. • Assume the rate of mercury evaporation is uniform over a 60-second period. • Assume a typical exhaust flow rate of 0.1 m3/s.
The exhaust concentration during the 60-second evaporation can then be estimated as:
5,000 mg / (60 s × 0.1 m3/s) = 830 mg/m3 Because the saturated vapor concentration in air is on the order of 15 mg/m3, the mercury in the exhaust is composed of vapor and liquid particles or aerosols with approximate quantities:
15 mg/m3 saturated vapor + 815 mg/m3 aerosol A conceptual drawing and photographs of the sampling scheme are shown in Figure 5-2. With this system, a known volume of air/mercury is drawn using a calibrated syringe during the evaporation process. The sample is drawn through a micro-filter to capture the aerosol, and the sample passing through to the syringe contains only the air/vapor component. The filter is sent to a laboratory for analysis of the mercury content, and the syringe gas is analyzed with a mercury vapor analyzer.
(a) Conceptual Drawing
(b) Components (c) Assembled
FIGURE 5-2 Sampling Train

Technology Demonstration Report 5-3 February 2008
To avoid exceeding the upper limit of the vapor analyzer, a portion of the gas sample in the syringe is mixed with a known content of clean air in a dilution bag, as illustrated in Figure 5-3.
FIGURE 5-3 Sample in the Syringe Mixed with Clean Air in the Dilution Bag The dilution bag mixture is then sampled by using a mercury Dräger tube (shown in Figure 5-4) or other mercury vapor analyzer.
FIGURE 5-4 Diluted Sample Analysis with Dräger Tube
D
Technology Demonstration Report 5-4 February 2008
The step-by-step procedure for this sampling system is outlined below.
1. Drill sampling ports at the collection system inlet and exhaust, as shown in Figure 5-1(b). The size of the sampling port must be consistent with the stopper on the sampling train, as shown in Figure 5-4. A solid stopper should be inserted in the sampling port when the port is not in use.
2. Remove the plugs on the charcoal filter cartridge and assemble the sampling train as shown in
Figure 5-2. Make certain that the filter is oriented according to the indicated inlet and outlet.
3. Fill the dilution bag with a known volume of clean air (2,000 ml is recommended) by using a syringe and connecting tubing (a 140-ml syringe is recommended). This step is illustrated in Figure 5-3.
4. Start a log sheet for the sample run; an example log sheet is provided in Appendix B.
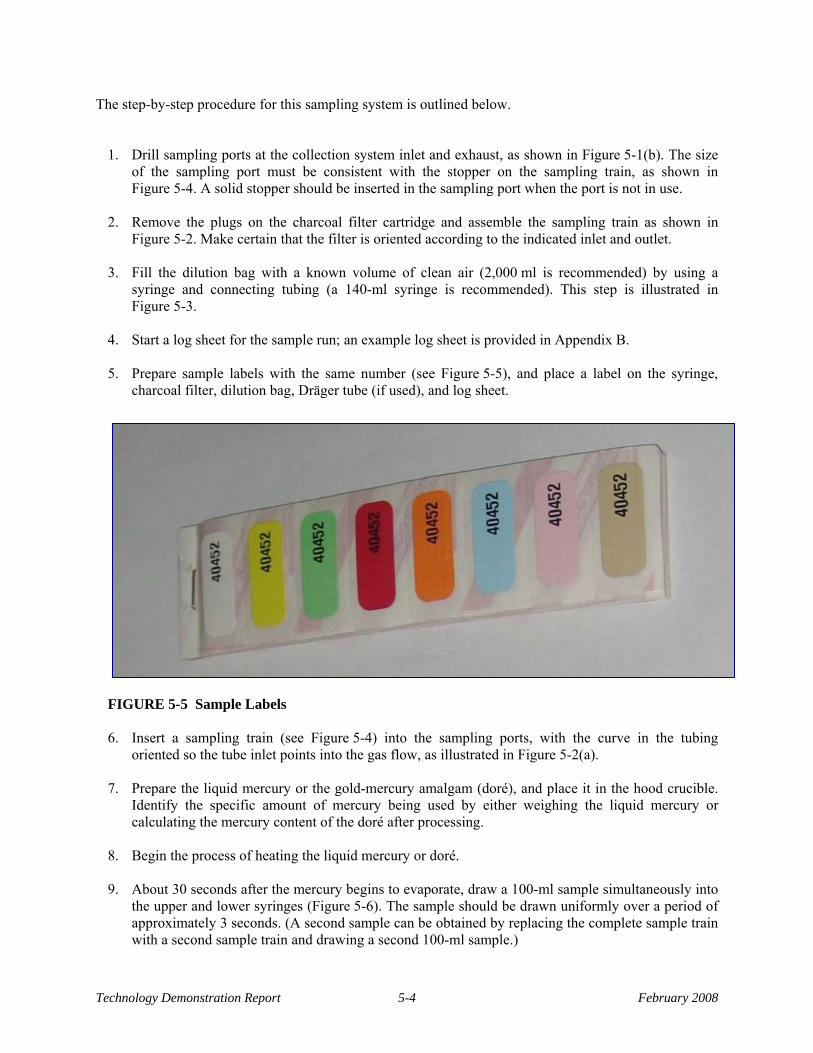
5. Prepare sample labels with the same number (see Figure 5-5), and place a label on the syringe,
charcoal filter, dilution bag, Dräger tube (if used), and log sheet.
FIGURE 5-5 Sample Labels
6. Insert a sampling train (see Figure 5-4) into the sampling ports, with the curve in the tubing
oriented so the tube inlet points into the gas flow, as illustrated in Figure 5-2(a).
7. Prepare the liquid mercury or the gold-mercury amalgam (doré), and place it in the hood crucible. Identify the specific amount of mercury being used by either weighing the liquid mercury or calculating the mercury content of the doré after processing.
8. Begin the process of heating the liquid mercury or doré.
9. About 30 seconds after the mercury begins to evaporate, draw a 100-ml sample simultaneously into
the upper and lower syringes (Figure 5-6). The sample should be drawn uniformly over a period of approximately 3 seconds. (A second sample can be obtained by replacing the complete sample train with a second sample train and drawing a second 100-ml sample.)

Technology Demonstration Report 5-5 February 2008
FIGURE 5-6 Sampling Train: Preparing to Draw a Sample
10. Remove the sample train and place a solid stopper in each of the sample ports. 11. Disassemble the sampling train, keeping the syringe plunger in a fixed position.
Replace the filter assembly plugs, and place the filter in the shipping container (see Figure 5-7) to send to the laboratory for analysis (Step 17). Keep the label on the filter.
FIGURE 5-7 Shipping Containers for Used Charcoal Filters

Technology Demonstration Report 5-6 February 2008
12. Connect the syringe to the dilution bag, and pump 50 ml or other known quantity from the syringe into the dilution bag.
13. Close the dilution bag, disconnect the syringe, and discharge the remaining contents of the syringe
into an open space away from the breathing zone.
14. To analyze the mercury vapor content, connect a Dräger tube (shown in Figure 5-4) or other vapor-monitoring device to the dilution bag by using connecting tubes. Break off both ends of the Dräger tube and orient it as indicated by the arrow on the tube. Specific instructions for using a Dräger tube are provided in Appendix C.
15. If the volume of clean air in the dilution bag was 2000 ml and 50 ml was inserted from the syringe,
the concentration of the vapor from the sample train is calculated as follows: Sample train concentration = (dilution bag concentration) × (2000 + 50)/50
16. If the vapor-monitoring device is a mercury Dräger tube, draw 100 ml from the bag and through the
Dräger tube by using either the syringe or one stroke with a Dräger pump (which equals 100 ml). Repeat until the Dräger tube changes color. The concentration is estimated by using the table in Appendix C that correlates the mercury concentration with the number of 100-ml strokes needed to obtain a change in color within the tube.
17. Send the packaged filter to the predesignated laboratory for analysis of the sample.
18. Complete the sample log sheet with copies to the EPA (or its contractor), the local environmental
agency, and appropriate shop managers.
5.2 PARTICLE SIZE SAMPLING To fully understand the dynamics and efficiency of mercury aerosol collectors, it is useful to know the distribution of particles by size. This information can be obtained by multi-stage impactors that trap airborne particles onto individual collection filters. Airborne particles are drawn through the sampling inlet via a sampling pump. Coarse particles pass straight through to the lower collectors while other particles are aerodynamically separated onto the appropriate filter. A RESPICON™ multi-stage impactor (RESPICON™ 1999) was used in this study, and this equipment is illustrated in Figure 5-8. In this system, the first impactor stage separates out and collects the particles smaller than 4 μm. The second stage collects particles below 10 μm, while the third stage collects the remaining particles. The mass of deposited particles is determined by comparing the filter weights before and after sampling.

Technology Demonstration Report 5-7 February 2008
FIGURE 5-8 Schematic of the RESPICON™ Multi-Stage Impactor (lpm = liters per minute)

Technology Demonstration Report 5-8 February 2008
5.3 DETERMINING THE MERCURY AEROSOL REMOVAL EFFICIENCY The efficiency of a system for removing mercury from the exhaust gas can be determined from the reduction in mercury levels between the inlet and outlet measurement points. The combination of aerosol and vapor components should be included in this evaluation since some of the vapor will condense to the particulate or aerosol form. A second approach for assessing collection efficiency is to compare the estimated total mercury released from the hood with the total estimated quantity at the collection system exhaust. To test the system, a known weight of mercury is evaporated in the hood. If the mercury comes from burning gold doré, the quantity of mercury can be calculated by the difference in weight of the doré and the final gold product. Sampling results can be used to estimate the total quantity of mercury released, as shown by the conceptual drawing in Figure 5-9. The actual shape of the curve for the hood exhaust concentration as a function of time is estimated as a constant value between the start and finish of the burn that is conducted to evaporate the mercury. By assuming this constant value is equal to the value identified from a given sample analysis, the total quantity of mercury passing the sample point is estimated as follows:
Total mercury (g) = mercury in collected sample (g/m3) × flow rate (m3/s) × burn time (s)
FIGURE 5-9 Conceptual Illustration of the Mercury Concentration During a Burn

Technology Demonstration Report 6-1 February 2008
6 PROTOTYPE TESTING IN BRAZILIAN GOLD SHOPS
The project team made three trips to Parà, Brazil to coordinate the construction, installation, and testing of mercury collectors designed at Argonne for this project. During the first trip in December 2006, a demonstration unit based on the pebble bed design was built by a local craftsman and installed in the first shop:
• Marsam gold shop in Itaituba The second design used baffle plates inside a steel drum, and it was installed in July 2007 in three shops:
• Melado Ouro gold shop in Itaituba • D’Gold gold shop in Creporizão • Ourominas gold shop in Itaituba
During the third trip in October/November 2007, a revised version of the second prototype was tested. The major change for this revised design was narrowing the width of the gap in the baffle plates on the basis of the theoretical consideration discussed in Chapter 2. This system was locally built and installed in two hoods inside a fourth shop:
• Parmetal gold shop in Itaituba In addition, the unit that was installed in the Ourominas shop in July (the previous design) was replaced by a unit with this revised design. In addition to the prototype systems that had been designed at Argonne and then locally constructed, a water-based system developed in Kalimantan, Indonesia that was designed for smaller hoods – which routes the aerosol through a container of water to collect the mercury (see Appendix D) –had become available and so was also tested during the third trip. This chapter highlights results from the demonstration tests conducted during the third trip. These data were collected by using the sampling procedure outlined in Chapter 5. This procedure incorporates lessons learned in applying earlier sampling schemes during the first two trips. The data collected during those earlier trips used different procedures and are not considered sufficiently reliable for comparative analyses; thus, they are not included here. 6.1 PEBBLE BED SYSTEM AT MARSAM The initial pebble bed prototype was installed in the Marsam gold shop as shown in Figure 6-1. Sampling locations are also shown on this figure, and results are summarized in Table 6-1 at the end of this chapter. The data identified a dramatic decrease in mercury levels in the smaller-particle size range. This decrease is believed to result from (1) condensation that forms larger particles, which are more easily captured; and (2) collection on the long inlet duct and large inlet mixing area. The sampling procedure with charcoal filters was used to measure total particulates, and a Jerome mercury analyzer (Arizona Instrument LLC 2005) was used to measure vapor inside the dilution bags (see the general procedure described in Chapter 5). The concentrations measured at sample points A and B (see Figure 6-1) were 509 mg/m3 at the inlet (A) and 190 mg/m3 at the outlet (B), which translates to a collection efficiency of 63%.

Technology Demonstration Report 6-2 February 2008
For a 60-second test burn of 6.1 g mercury with a flow rate of 0.126 m3/s, the concentration exiting the hood (thus representing the inlet concentration to the collector) is calculated to be 800 mg/m3. Based on the measured outlet concentration of 190 mg/m3, this result suggests a collection efficiency of 76%. Charcoal filter, Sample B RESPICON Sample A (inside ducts) RESPICON Sample B FIGURE 6-1 Sampling Locations for the Pebble Bed System: Marsam Gold Shop 6.2 INITIAL BAFFLE PLATE SYSTEM AT MELADO OURO The second prototype, which relies on a series of baffle plates inside the drum, was installed in the Melado Ouro gold shop. The sampling points for this system are shown in Figure 6-2, and results are summarized in Table 6-1. The sampling procedure with charcoal filters was used to measure total particulates, and a Jerome mercury analyzer was used to measure vapor inside the dilution bags. The concentrations measured at sample points A and B were 1,580 mg/m3 at the inlet (A) and 330 mg/m3 at the outlet (B), for a collection efficiency of 79%. The relatively good collection efficiency at this shop is thought to result from the large-diameter duct that precedes the collection system. This large duct lowers the flow velocity and allows larger particles to form, which are easier to capture.

Technology Demonstration Report 6-3 February 2008
120 fpm 126 fpm 105 fpm
1.55 m (61 in.)
16 cm (6 in.)
55 cm (21 in)
61 cm (24 in)
50 cm (20 in)
A
B
A
RESPICON
Charcoal filters RESPICON
FIGURE 6-2 Sampling Locations for the Baffle Plate System: Melado Ouro Gold Shop 6.3 INITIAL BAFFLE PLATE SYSTEM AT D’GOLD The second prototype design, a baffle plate system, was constructed in Itaituba and transported to the gold mining and processing village of Creporizão in Parà, Brazil. Installation followed the vertical configuration that was illustrated in Figure 4-4. Sampling procedures were still under development at that time, so although mercury reduction was demonstrated, the test data for this system are not considered reliable so they are not included in this summary. 6.4 MODIFIED (NARROW-GAP) BAFFLE PLATE SYSTEM AT OUROMINAS The original design of the second prototype was modified to narrow the gaps in the baffle plates on the basis of a review of the underlying theory presented in Chapter 2. This system was locally constructed and installed in the Ourominas gold shop as shown in Figure 6-3. The components include a relatively long duct that extends about 4 to 6 m between the hood and the collection system. The sample points for this system are shown in Figure 6-3, and results are summarized in Table 6-1. By using the sampling procedure with charcoal filters to measure total particulates and the Jerome mercury analyzed to measure vapor inside the dilution bags, the sample points A and B gave total measured concentrations of 104 mg/m3 at the outlet (B). No reliable charcoal filter data were obtained from the inlet (A) as a result of a faulty syringe used during sampling. Thus, only a calculated efficiency is available for this system. For a 60-second test burn of 5.25 g mercury with a flow rate of 0.2 m3/s, the concentration exiting the hood is calculated to be 1,100 mg/m3. The measured outlet concentration of 104 mg/m3 suggests a collection efficiency of 91% for the combined duct and collection unit.

Technology Demonstration Report 6-4 February 2008
Sample Port B (outlet) Sample Port A (inlet) FIGURE 6-3 Sampling Locations for the Modified Baffle Plate System: Ourominas Gold Shop 6.5 MODIFIED (NARROW-GAP) BAFFLE PLATE SYSTEM AT PARMETAL The two similar installations in the Parmetal gold shop also used the second prototype that was revised with smaller gaps in the baffle plates. The installed system did not include a duct between the hood and the collection unit as shown in Figure 6-4. The sample points are also illustrated on this figure, and results are summarized in Table 6-1. By using the sampling procedure with charcoal filters to measure total particulates and the Jerome mercury analyzed to measure vapor inside the dilution bags, the sample points A and B in Figure 6-4 gave total measured concentrations of 745 mg/m3 at the inlet (A) and 468 mg/m3 at the outlet (B) for a collection efficiency of 37%. For a 30-second test burn of 5.47 g mercury with a flow rate of 0.25 m3/s, the concentration exiting the hood is calculated to be 745 mg/m3. This result is the same as the measured inlet concentration, so the calculated efficiency is also 37%. This level of collection efficiency across the system is consistent with efficiencies indicated by the RESPICONTM data across that unit at the Ourominas gold shop. The lower efficiency for this Parmetal system reflects the way it was assembled. That is, the collection unit is connected directly to the hood so
Technology Demonstration Report 6-5 February 2008
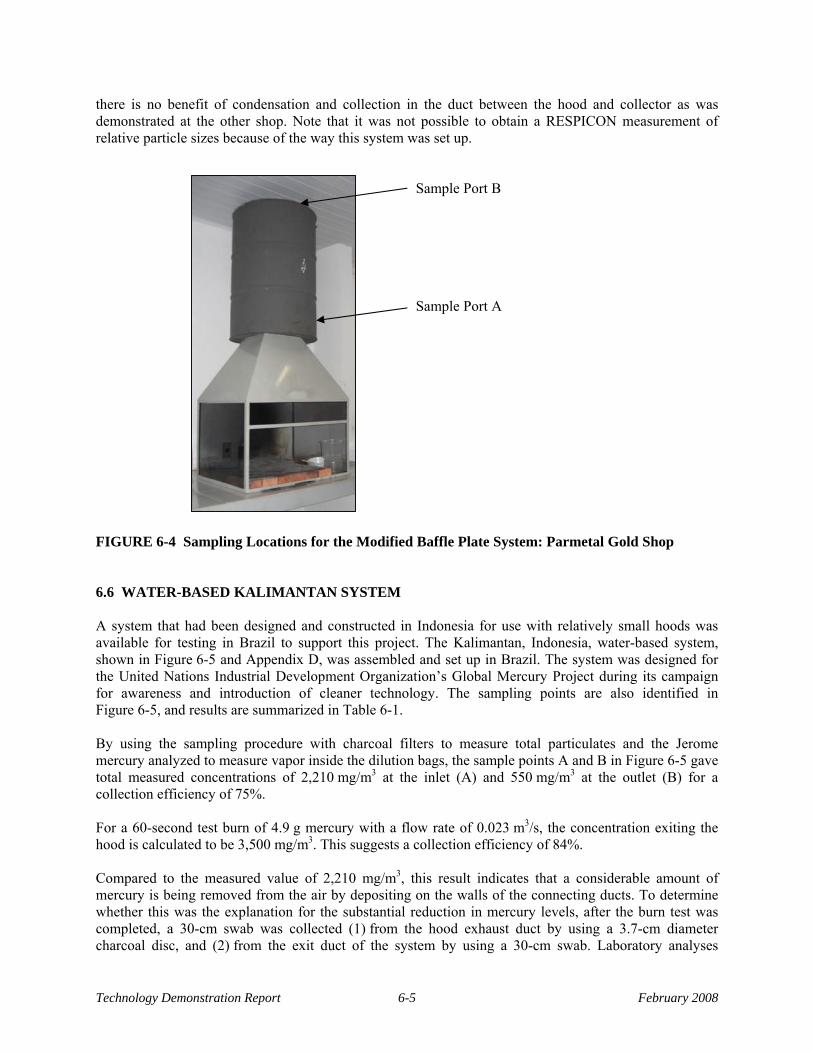
there is no benefit of condensation and collection in the duct between the hood and collector as was demonstrated at the other shop. Note that it was not possible to obtain a RESPICON measurement of relative particle sizes because of the way this system was set up.
Sample Port B
Sample Port A FIGURE 6-4 Sampling Locations for the Modified Baffle Plate System: Parmetal Gold Shop 6.6 WATER-BASED KALIMANTAN SYSTEM A system that had been designed and constructed in Indonesia for use with relatively small hoods was available for testing in Brazil to support this project. The Kalimantan, Indonesia, water-based system, shown in Figure 6-5 and Appendix D, was assembled and set up in Brazil. The system was designed for the United Nations Industrial Development Organization’s Global Mercury Project during its campaign for awareness and introduction of cleaner technology. The sampling points are also identified in Figure 6-5, and results are summarized in Table 6-1. By using the sampling procedure with charcoal filters to measure total particulates and the Jerome mercury analyzed to measure vapor inside the dilution bags, the sample points A and B in Figure 6-5 gave total measured concentrations of 2,210 mg/m3 at the inlet (A) and 550 mg/m3 at the outlet (B) for a collection efficiency of 75%. For a 60-second test burn of 4.9 g mercury with a flow rate of 0.023 m3/s, the concentration exiting the hood is calculated to be 3,500 mg/m3. This suggests a collection efficiency of 84%. Compared to the measured value of 2,210 mg/m3, this result indicates that a considerable amount of mercury is being removed from the air by depositing on the walls of the connecting ducts. To determine whether this was the explanation for the substantial reduction in mercury levels, after the burn test was completed, a 30-cm swab was collected (1) from the hood exhaust duct by using a 3.7-cm diameter charcoal disc, and (2) from the exit duct of the system by using a 30-cm swab. Laboratory analyses

Technology Demonstration Report 6-6 February 2008
indicated 2,000 μg of mercury was collected on the swab of the hood exhaust duct, and 280 μg was collected on the swab of the system exit duct. These results confirmed that deposition was occurring in the ducts, further reducing mercury releases from the system.
Sample Port A Sample Port B
FIGURE 6-5 Sampling Locations for the Water-Based Kalimantan System

Technology Demonstration Report 6-7 February 2008
TABLE 6-1 Results of Selected Test Demonstrations
Mercury Collected System Tested, Sample Location, and Particle Size
Location Particle Size (μm) Sample Number Weight (µg)
Concentrations (mg/m3) as noted
Percent of Total Weight
(%)
Overall Change
Initial Pebble Bed System at Marsam Top <4 RESPICON A: 39775 480 88 Comparison level
Middle 4–10 39776 0.73 <1 Comparison level Bottom >10 39777 66 12 Comparison level
Total: 547 Top <4 RESPICON B: 40343 3.9 14 99% decrease
Middle 4–10 40344 7 25 860% increase Bottom >10 40345 17 61 74% decrease
Total: 27.9 95% net reduction Particulate concentration samples Charcoal filter, A (inlet) 509 mg/m3 Collection efficiency: Charcoal filter, B (outlet) 190 mg/m3 63% Calculated at hood exit 800 mg/m3 76% (calculated) Initial Baffle Plate System at Melado Ouro Estimated transit time: 13 sa
Top <4 RESPICON A: 40348 18 82 Comparison level Middle 4–10 40349 2.9 13 Comparison level Bottom >10 40350 1.06 5 Comparison level
Total: 22 Top <4 RESPICON B: 40340 0.37 10 98% decrease
Middle 4–10 40341 0.67 18 77% decrease Bottom >10 40342 2.7 72 154% increase
Total: 3.74 83% net reduction Particulate concentration samples Charcoal filter, A (inlet) 1,580 mg/m3 Collection efficiency: Charcoal filter, B (outlet) 330 mg/m3 79% Modified (Narrow-Gap) Baffle Plate System at Ourominas Estimated transit time: 15 s a
Top <4 RESPICON A: 40477 483 84 Comparison level Middle 4–10 40477 49.7 9 Comparison level Bottom >10 40477 42.8 7 Comparison level
Total: 575.5 Top <4 RESPICON B: 40476 321 89 34% decrease
Middle 4–10 40476 26.5 7 47% decrease Bottom >10 40476 12.9 4 70% decrease
Total: 360.4 37% net reduction Particulate concentration samples Charcoal filter, A (inlet) (faulty syringe) Collection efficiency: Charcoal filter, B (outlet) 104 mg/m3 (not quantifiable) Calculated at hood exit 1,100 mg/m3 91% (calculated) Modified (Narrow-Gap) Baffle Plate System at Parmetal Estimated transit time: 2 s a Particulate concentration samples Charcoal filter, A (inlet) 745 mg/m3 Collection efficiency: Charcoal filter, B (outlet) 468 mg/m3 37% Calculated at hood exit 745 mg/m3 37% (calculated)

Technology Demonstration Report 6-8 February 2008
Mercury Collected System Tested, Sample Location, and Particle Size
Location Particle Size (μm) Sample Number Weight (µg)
Concentrations (mg/m3) as noted
Percent of Total Weight
(%)
Overall Change
Water-based Kalimantan System Top <4 RESPICON A: 40478 43 79 Comparison level
Middle 4–10 40478 10 18 Comparison level Bottom >10 40478 1.6 3 Comparison level
Total: 54.6 Top <4 RESPICON B: 40479 0.56 57 99% decrease
Middle 4–10 40479 0.22 22 98% decrease Bottom >10 40479 0.2 20 87% decrease
Total: 0.98 98% net reduction Particulate concentration samples Charcoal filter, A (inlet) 2,210 mg/m3 Collection efficiency: Charcoal filter, B (outlet) 550 mg/m3 75% Calculated at hood exit 3,500 mg/m3 84% (calculated) a Estimated transit time of mercury from point of evaporation to baffle plates, based on the volumes of the hood, duct, and drum below the baffle plates divided by the flow volume rate. The implications of these test results are discussed in Chapter 7.

Technology Demonstration Report 7-1 February 2008
7 SUMMARY AND RECOMMENDATIONS Emissions from gold shop hoods during a burn can exceed 1,000 mg/m3. Because the saturation concentration of mercury vapor at operating temperatures at the hood exhaust is below 100 mg/m3, the dominant form of mercury in the exhaust is as an aerosol or liquid particles. The goal of this project was to demonstrate technology to remove this dominant aerosol component of emissions from gold-processing shops. To determine the total mercury concentration in the flow, both the aerosol and vapor components must be measured. This objective was achieved by drawing a known volume of air through an activated charcoal filter. The quantity of mercury captured on the filter was analyzed at the Argonne laboratory, and the concentration of vapor not captured by the filter was analyzed in the field by using a Jerome vapor analyzer. Although it is not as accurate, a Dräger tube could be used to analyze vapor concentrations at low cost. Coagulation is an important mechanism underlying the removal of mercury aerosols. By using a device that identified size distributions of the aerosols, measurements at the Marsam and Melado Ouro shops and from the Indonesian system indicated that approximately 80% or more of the aerosols (by weight) at the exit of the hood are less than 4 μm or less in diameter. From the theoretical analysis, when the particles were allowed transit times of 6 seconds or more, they coagulated to sizes on the order of 30 μm, resulting in significant improvements in collection efficiency. The collection system design is based on forcing the gaseous flow through narrow openings that form jets directed toward downstream surfaces. If this system is properly designed, the momentum of the particles will cause them to impinge and adhere to downstream surfaces. A pebble bed design was tested first; this configuration was effective in creating narrow passages and impingement surfaces, and a high collection efficiency was confirmed. The first prototype using a pebble bed demonstrated that jets impacting on surfaces could collect about 90% of the mercury particles. An alternative to the pebble bed design was pursued because of difficulties concerning its weight, in ensuring the necessary consistency in pebble characteristics, and in designing the pebble bed enclosure with flexibility for application in various hood configurations. The alternative design is based on a series of baffle plates in which slots create the jets that impinge on succeeding baffle plates. A theoretical analysis determined the key design requirements for the baffle plate construction: the slots must be narrow enough to create jets that could carry the particles with adequate momentum to impinge and adhere to downstream surfaces; if the slots are too narrow, however, they could inhibit the overall flow rate needed. On the basis of typical total flow rates of 0.1 m3/s through the hood, slot widths of 1 cm between 4 cm strips were determined to be near optimal. The preferred method of constructing the baffle plates to provide the necessary dimensions is to weld precut strips onto a ring. (In the applications described in this report, the use of a cutting torch to cut openings in a flat disc resulted in uneven gaps that were not optimal to achieve the necessary jet flow dynamics.) A further refinement to achieve greater collection efficiency involved enclosing the baffle plate assembly to prevent bypass of the flow around the outer edges of the plates. Although shown in the construction plans of this report, this feature was not implemented in the prototype demonstrations. The number of baffle plates in the assembly could also be increased to increase the collection efficiency.

Technology Demonstration Report 7-2 February 2008
The second prototype system installed in the Melado Ouro gold shop in Itaituba, Parà, Brazil, had a measured inlet-to-outlet efficiency of about 80%. This high collection efficiency is attributed to the unusually large hood and exhaust duct (50-cm diameter) at this shop, which allowed for long transit time and thus greater opportunity for the aerosol to coagulate. Recall that collection efficiency increases with particle size. For the system installed in the Ourominas gold shop in Itaituba, the total reduction in mercury concentration from the hood exhaust to the system exhaust, which includes a 4–5 m connecting duct, was approximately 80%. Results indicated the reduction in concentration achieved by the baffled portion without the inlet duct was about 40%, demonstrating the importance of sufficient transit time to allow particles to coagulate and adhere on the walls of the hood exhaust ducts. The significance of mercury collection on the exhaust duct walls was directly confirmed from the tests of a smaller Kalimantan water-based system. Following the test run on this system, an activated charcoal swab over about 60 cm2 of the hood exhaust pipe removed about 2 mg (2,000 μg) of mercury. Further confirmation of the significance of exhaust duct configuration on mercury collection was demonstrated by test results of the system installed in the Parmetal gold shop. The Parmetal collector installation was different from others in that the collector was installed directly above the hood without the benefit of a connecting duct that would allow the particles to coagulate to a larger size and provide additional surface area (i.e., duct walls) on which particles could collect. As a result, the measured inlet-to-outlet efficiency of the collector in this configuration was lower than the other configurations at approximately 40%. Three key recommendations are offered for future applications of the mercury collection system.
First, it has been demonstrated that this collection system can be effective in removing a high percentage of the mercury particles that are the dominant component of mercury being released by gold-processing shops. To be most effective, the system should be placed at a sufficient distance from the point of high-temperature mercury evaporation so there is at least a 6-second transit time before the mercury reaches the collection system. This allows the mercury particles to coagulate to a diameter of at least 30 μm, and these can be captured with a high efficiency. Second, adherence of mercury particles to the walls of the exhaust duct between the hood and collection system can also be an important contributor to mercury removal from the exhaust. Mercury collection points should thus also be provided in the exhaust ducts for removal of the collected mercury. Third, construction refinements regarding precision in baffle slot openings and cover to prevent bypass flow as discussed above should be included in future applications.
By implementing these three recommendations alone, one can expect collector efficiencies in the range of 60 to 80% on the basis of results obtained during this demonstration project. If combined with the effect of mercury removal in the ducts preceding the collector, the combined efficiency of the baffle design mercury collector can be expected to exceed 80%. A final recommendation goes beyond system design and addresses knowledge transfer. This recommendation is to encourage the development of a procedure for ongoing collection and dissemination of test results from future applications of the mercury collector system. In this way, information can be made available to guide continual improvement of the system.

Technology Demonstration Report 8-1 February 2008
8 REFERENCES Arizona Instrument LLC, 2005, Jerome 431-X Mercury Vapor Analyzer, Tempe, AZ. ATSDR (Agency for Toxic Substances and Disease Registry), 1999, Toxicological Profile for Mercury, Atlanta, GA (March); http://www.atsdr.cdc.gov/toxprofiles/tp46.html. Filip, S., undated, ABE Volume Calculator Page, Agricultural and Biological Engineering, Mississippi State University; http://grapevine.abe.msstate.edu/~fto/tools/vol/index.html. Hinds, W.C., 1982, Aerosol Technology; Properties, Behavior, and Measurement of Airborne Particles, John Wiley & Sons, New York, NY. NIOSH (National Institute for Occupational Safety and Health), 2005, NIOSH Pocket Guide to Chemical Hazards, U.S. Department of Labor, Washington, DC (September); http://www.cdc.gov/niosh/npg/npgd0383.html. OSHA (U.S. Occupational Safety and Health Administration), 2004, Safety and Health Topics, Mercury (Vapor) (as Hg), U.S. Department of Labor, Washington, DC (weblink accessed January 2008); http://www.osha.gov/dts/chemicalsampling/data/CH_250510.html. (Also see: NIOSH and OSHA, 2005, Occupational Safety and Health Guideline for Mercury Vapor, U.S. Department of Labor, Washington, DC [weblink accessed January 2008]; http://www.osha.gov/SLTC/healthguidelines/mercuryvapor/recognition.html.) RESPICON™ (RESPICON™ Particle Sampler from TSI), 1999; http://www.tsi.com/documents/resp_bro.pdf. Telmer, K., 2006, Mercury and Small-Scale Gold Mining – Magnitude and Challenges Worldwide, presented at the International Conference on Managing the International Supply and Demand of Mercury, European Commission, Brussels, Belgium (October).

Technology Demonstration Report 8-2 February 2008

Technology Demonstration Report A-1 February 2008
APPENDIX A:
HEALTH AND SAFETY PLAN OUTLINE

Technology Demonstration Report A-2 February 2008

Technology Demonstration Report A-3 February 2008
APPENDIX A: HEALTH AND SAFETY PLAN OUTLINE
People can be exposed to mercury by two main routes: (1) inhalation, which is the main route of interest for gold shops; and (2) ingestion, which can also be a significant pathway or route because local fish are typically contaminated with mercury (notably from tailings generated by the amalgamation process for gold separation). Absorption through the skin following dermal contact is also a potential route of exposure, but this exposure is of relatively minor concern. About 80% of inhaled mercury can enter the bloodstream from the lungs and be distributed throughout the body. Mercury exposures from eating contaminated fish are said to be in the methylated (organic) form, and more than 95% is absorbed from the gastrointestinal tract after intake. This amount contrasts with the less than 0.01% amount of metallic mercury absorbed following ingestion and only about 10% for inorganic forms (ATSDR 1999). Mercury taken into the body and distributed via the bloodstream accumulates in the kidney and can also accumulate in the liver. In the brain, metallic mercury and methylmercury can be converted to an inorganic form and become trapped there. Mercury stays in the body for weeks to months, and it can harm the brain (causing neurological effects), kidneys, and a developing fetus. During purification of the gold-mercury amalgam with high-temperature torches inside a gold shop, the vapor concentrations of elemental mercury produced could be lethal if exposures are not controlled, such as inside a vapor hood. At times it may be necessary to use personal protective equipment (PPE) to limit exposures. PPE can include protective clothing, gloves, and a respirator, depending on the anticipated concentrations. Inhalation exposures should be monitored by using mercury vapor detection equipment such as Dräger tubes, or real-time vapor measurement devices such as Jerome or Lumex mercury vapor analyzers. Baseline blood and urine mercury levels should also be measured (i.e., prior to the work) to serve as a point of reference for the levels measured after the activities are conducted. It is important to note that if the area being visited for a given project is highly contaminated with mercury, it is likely that this contamination extends to local fish. In certain regions of Brazil, the fish are so highly contaminated with mercury that routine dietary consumption is believed to cause mercury toxicity in a small percentage of the population. If the level of mercury in local fish is unknown, it would be prudent to choose an alternate food during the period of the project when inhalation exposures are also a potential issue in order to limit overall exposures. When activities are conducted in areas with high mercury contamination, such as when testing mercury collection technologies in gold shops, a health and safety plan for project personnel should be developed to guide protective measures as indicated. Proper planning can minimize mercury exposures. A suggested outline of a health and safety plan developed for this project is presented on the following pages.

Technology Demonstration Report A-4 February 2008
I. COMPREHENSIVE WORK PLAN A. Scope of Work/Objective(s)
1. Describe the nature of the tasks that will be performed. 2. Describe the methods that will be used to complete the tasks. 3. Describe the personnel required to complete the task (e.g., level of expertise, education
requirements). 4. Describe the applicable regulations. 5. Provide a list of references for the regulations. 6. Describe the duration of the field work and time of year it will occur.
B. Schedule of Work
1. List the necessary permits. 2. Describe the contact of area utilities. 3. Describe which local municipalities must be notified. 4. Describe the work that was subcontracted and those employed. 5. Describe any site preparation necessary. 6. Describe the site project schedule, including a list of the major tasks (as described in the scope of
work). 7. Describe the site deactivation and cleanup.
C. Management Organization
1. Provide a flow chart that identifies the Project Officer and those responsible for project health and safety
a. Describe the line of authority. b. Describe the duties/responsibilities of each member of the team. 2. Describe training requirements. 3. Describe any medical surveillance requirements.
D. Site Description and History
1. Describe the physical setting. 2. Describe the climatology, including temperature, rainfall, etc. 3. Include records concerning the site. 4. Include information from previous investigations (i.e., sample results).
II. HAZARD ANALYSIS A. Chemical Hazards
1. List the chemicals of concern and describe how to recognize symptoms and signs of exposure. 2. Attach materials safety data and related information.
B. Physical Hazards
1. List the equipment to be used. 2. List the types of illumination necessary. 3. Describe the areas of confined space entry (trenches, pits, silos, unventilated spaces). 4. Describe the electrical systems present. 5. Describe the actions for noise control, if necessary. 6. Describe the actions for excavation. 7. Describe the methods for dust control. 8. Describe the methods to combat cold and heat stress.

Technology Demonstration Report A-5 February 2008
9. Describe the interactions that may occur with animals and insects. III. PERSONAL PROTECTIVE EQUIPMENT (PPE) A. Levels of PPE
1. Provide a description of each level and specific tasks for each level. 2. Describe the equipment specific for each level. 3. Describe the type of respirator identified for required tasks.
B. Provide PPE limitations and procedure/justification for up/downgrading of PPE. IV. AIR MONITORING PLAN/INSTRUMENTATION A. Held Monitoring Equipment to be Utilized
1. Describe monitoring equipment capabilities. 2. Describe monitoring procedures (personnel and area).
a. Describe the location to be monitored. b. Describe how frequently the procedure needs to be performed. c. Attach a copy of the monitoring log. d. Describe how the equipment is calibrated. Describe the maintenance regularly made to the
system. 3. Describe the action levels and associated response.
B. Permanent Monitoring Equipment (Stations) To Be Utilized V. OTHER ENVIRONMENTAL MANAGEMENT A. Personnel Decontamination
1. Describe the procedures for personnel decontamination. 2. Describe the layout of the facility where personnel will be decontaminated. 3. Describe the location and provide a list and description of the decontamination solution(s).
B. Equipment Decontamination
1. Describe the procedures for equipment decontamination. 2. Describe the layout of the facility where equipment will be decontaminated. 3. Describe the location and provide a list and description of the decontamination solution(s).
C. Waste Control and Disposal
1. Describe the process for disposal of uncontaminated waste. 2. Describe the process for disposal of contaminated waste.
D. Spill Control
1. Describe the procedures used to ensure the spill will be controlled. 2. Describe the equipment used for the procedure. 3. Describe the reporting/notification system.

Technology Demonstration Report A-6 February 2008
E. Transportation 1. Describe transportation mode(s). 2. Describe transportation hazards. 3. Describe safety equipment and use.
F. Sanitation
1. Describe the resource of potable and nonpotable water. 3. Describe the toilet facilities available. 5. Describe the washing facilities available.
VI. EMERGENCY EQUIPMENT AND CONTINGENCY PROCEDURES A. Specific Emergency Plan
1. Describe the procedure necessary if a worker is injured (chemical and physical injuries). 2. Describe the procedures used for first aid. 3. Describe the procedures used for notification and evacuation.
B. Describe fire emergency procedures.
1. Describe first responder actions. 2. Describe the procedures used for notification and evacuation.
C. Provide maps of the site that specify emergency safety locations.
1. Provide maps that outline hospital(s) routes. 2. Provide a map of routes used during evacuation.
D. Provide information about emergency equipment.
1. Provide a list of the quantity of equipment. 2. Provide a list of the location of the equipment.
E. Describe any adverse weather conditions that would necessitate mission restraints and describe how the mission restraints would be completed.

Technology Demonstration Report B-1 February 2008
APPENDIX B:
LOG SHEET FOR REPORTING SAMPLING RESULTS

Technology Demonstration Report B-2 February 2008

Technology Demonstration Report B-3 February 2008
Charcoal Filter
Charcoal Filter
APPENDIX B: LOG SHEET FOR REPORTING SAMPLING RESULTS
Date Time
Location: City Shop
Quantity Mercury Burned
Liquid Mercury or Gold Sponge
Person(s) conducting sample and analysis
Person completing Log Sheet
Port A Description of Sample Train (Markup Diagram)
Sample Number
Sample Port Location
Sample timing:
Time after Hg evaporation began that draw started
Time to draw sample
Sample size drawn ml
Dilution bag volume (A) ml Sample size from syringe into dilution bag (B) ml
Dilution C = (A + B)/B:
Diluted conc. (D) (From number strokes through Dräger to change color) mg/m3
Actual concentration: E = C x D mg/m3
Port B Description of Sample Train (Markup Diagram)
Sample Number
Sample Port Location
Sample timing:
Time after Hg evaporation began that draw started
Time to draw sample
Sample size drawn ml
Dilution bag volume (A) ml Sample size from syringe into dilution bag (B) ml
Dilution C = (A + B)/B:
Diluted conc. (D) (From number strokes through Dräger to change color) mg/m3
Actual concentration: E = C x D mg/m3

Technology Demonstration Report B-4 February 2008

Technology Demonstration Report C-1 February 2008
APPENDIX C:
DRÄGER TUBE INSTRUCTIONS

Technology Demonstration Report C-2 February 2008

Technology Demonstration Report C-3 February 2008
APPENDIX C: DRÄGER TUBE INSTRUCTIONS These instructions are excerpted from a standard method for measuring mercury vapor in air.

Technology Demonstration Report C-4 February 2008

Technology Demonstration Report D-1 February 2008
APPENDIX D:
KALIMANTAN FUME HOOD AND WATER-BASED FILTER DESIGN

Technology Demonstration Report D-2 February 2008

Technology Demonstration Report D-3 February 2008
APPENDIX D: KALIMANTAN FUME HOOD AND WATER-BASED FILTER DESIGN

Technology Demonstration Report D-4 February 2008

Technology Demonstration ReportWorking Draft D-1 February 2008

Technology Demonstration ReportWorking Draft D-1 February 2008