重力崩壊型超新星の下限質量と - jicfus...tems with low-mass white dwarf companions...
TRANSCRIPT

重力崩壊型超新星の下限質量とONeMg超新星
(Low mass core-collapse SNe & ONeMg SNe)
Hideyuki Umeda, Takashi Yoshida & Koh Takahashi
梅田秀之, 吉田 敬, 高橋亘
素核宇融合による計算基礎物理学の進展December 3-5, 2011, 合歓の郷
Department of Astronomy, University of Tokyo

Introduction
• Supernovae from Massive Stars
• Pair Instability SNe (M ~ 140-300M⦿
• Iron core collapse (M > ~ 10M⦿
• ONeMg SNe ~ 8-10M⦿?

Iron core collapse (M > ~ 10M⦿
• What is the lowest mass for Iron CCSN?
• Is the lowest mass progenitor something special?
• Iron core mass is minimum? So What?

ONeMg SNe ~ 8-10M⦿?
• 1D Explosion succeeded !(Electron capture SN) • Chandrasekhar critical Mass = 1.47 (Ye/0.5)2 M⦿
• But, , ,• Only one (relatively old) progenitor model
• なぜなら、計算が大変(super-AGB star; thermal pulses)
• Mass range seems very narrow• maybe no range (?
• ちょっと重いとNeが燃え、ちょっと軽いと ONeMgコアが 1.47 (Ye/0.5)2 M⦿ に成長する前に(super-AGB星として)外層を失って白色矮星のまま終わる。

SN channel of SAGB Stars 3
TABLE 1Summary of our detailed stellar evolution sequences. The
columns give the model identifier (S means STERN, E isEVOL, and K is KEPLER), the initial mass (M!), the
helium core mass prior to the second dredge-up (M!), thehelium core mass after the second dredge-up (M!),
information the end of the simulation, and the final fateof the sequence according to our fiducial SAGB evolutionproperties (mass loss, dredge-up, as described in Sect. 6.4)
Model Mi pre-2DU post-2DU comments fate
S5.0 5.0 0.91 0.84 14 TP CO WDS8.5 8.5 1.73 1.02 10 TP CO WDS9 9 1.90 1.07 30 TP ONe WDS9.5 9.5 2.00 1.11 ONe WDS10 10 2.14 1.16 55 TP ONe WDS10.5 10.5 2.30 1.20 ONe WDS11 11 2.45 1.23 ONe WDS11.5 11.5 2.61 1.27 15 TP ONe WDS12 12 2.79 1.32 dredge-out ECSNS12.5 12.5 2.95 2.95 dredge-out CCSNS13.0 13 3.13 3.13 Ne ignition CCSNS16.0 16 4.33 4.33 Ne ignition CCSNE6.5 6.5 1.59 0.99 CO WDE7.5 7.5 1.90 1.07 ONe WDE8.5 8.5 2.27 1.24 ONe WDE9.5 9.5 2.65 1.43 CCSNE10.0 10.0 2.82 2.82 dredge-out CCSNE10.5 10.5 3.00 3.00 Ne ignition CCSNE0099 9.0 2.15 1.17 fover = 0.004K8 8.0 1.808 1.168 ONe WDK8.5 8.5 1.955 1.247 ONe WDK9 9.0 2.130 1.338 ONe WDK9.1 9.1 2.161 1.357 ECSNK9.2 9.2 2.190 1.548 Ne ignition CCSNK9.3 9.3 2.221 1.603 Ne ignition CCSNK9.4 9.4 2.253 1.690 Ne ignition CCSNK9.5 9.5 2.283 1.799 Ne ignition CCSNK10 10.0 2.439 2.315 Ne ignition CCSNK10.5 10.5 2.598 2.596 Ne ignition CCSNK11 11.0 2.759 2.759 Ne ignition CCSN
(Schwarzschild criterion for convection is similar to veryfast mixing in semiconvective regions).
The EVOL code has previously been used to studylow-mass (e.g. Herwig & Austin 2004) and massive AGBstars (Herwig 2004a,b). KEPLER has in the pastbeen applied to study massive stars (Woosley et al.2002), but has not previously been used for AGB sim-ulations. STERN has been used for low mass AGBstars (Langer et al. 1999; Herwig et al. 2003; Siess et al.2004) as well as for massive stars (Heger et al. 2000;Heger & Langer 2000).
3. PRE-AGB EVOLUTION AND THE INITIAL MASSRANGE FOR SAGB STARS
In order to identify the processes that lead to SAGBstar formation we calculate stellar evolution sequenceswith initial masses between 6.5 M! and 13 M!, startingfrom the zero age main sequence until the completion ofthe second dredge-up or Ne ignition (Table ??). Up tothe end of the second dredge-up, no mass loss is takeninto account. The initial metallicity of our models isZ = 0.02. The e!ects of rotation or magnetic fields arenot taken into account.
3.1. H- and He-core burning
The evolution of stars toward the SAGB has beenstudied previously (Ritossa et al. 1996; Iben et al. 1997;Garcia-Berro et al. 1997; Ritossa et al. 1999; Siess 2006),
Fig. 1.— Time evolution of convection zones and energy gener-ation for three evolution sequences with di!erent mass, computedwith STERN. The initial masses and evolution scenarios are: toppanel: 5M!, massive AGB, middle panel:11.5M!, SAGB, lowerpanel: 16.0M! star, Fe-core, CCSN. Convective regions are indi-cated by green hatching while semiconvective regions are indicatedby red cross-hatching. The energy generation from nuclear burningis shown in greyscale with a legend to the side in units of log ergg"1 s"1.
and our simulations qualitatively confirm these results,although quantitative di!erences occur. In our STERNmodels, a consequence of including semiconvection isthat during core helium burning, a semiconvective layerlimits the mixing between the inner helium burning coreand the outer convective core, which still grows in mass(see also Fig. 1 below). This decreases the lifetime ofthe core helium burning phase, because the availableamount of helium is reduced, and leads to smaller he-lium and CO-core masses compared to models which usethe Schwarzschild criterion for convection.
Girardi et al. (2000) studied the e!ect of convectiveovershooting on the maximum initial mass for whichstars do not ignite carbon, Mup, and which defines thelower limit of SAGB stars. They find for models with-out overshooting a value of Mup of 6 M!...7 M!, while amoderate amount of overshooting reduces this by 1 M!.In our models we find Mup = 7.5 M! (EVOL/KEPLER),while our STERN models – without any overshooting –give Mup = 9.0 M!. We will discuss these di!erences inthe next paragraph.
3.2. The second dredge-up
The second dredge-up is a key di!erences betweenSAGB stars and massive stars that encounter Fe-corecollapse. After core-He exhaustion, the core resumes con-traction while the envelope expands. As the star evolvesup the asymptotic giant branch the envelope convectiondeepens, and eventually penetrates into the H-free core.Only due to this mixing event is the H-free core masssu"ciently reduced so that an electron-degenerate core
Poelarends et al. 2008 ApJ 675, 614 3 codes:no ECSN for E-code
8-10M⦿ ≠ ONeMg SNe

Massive Star EvolutionMini≧10M⦿
Yoshida & Umeda 2012

Massive Star Evolution Code (Yoshida & Umeda 2010~
Based on Saio code (e.g., Saio, Nomoto, and Kato 1988)Stellar evolution model
From H burning to onset of core-collapseMass loss rateMain-sequence Vink et al. (2001) ∝ Z0.69 , Z0.64
Red giant de Jager et al. (1988)
(Metallicity dependence: Vink & de Koter 2005)Wolf-Rayet stars Nugis & Lamers (2000)
(Metallicity dependence: ∝ Z0.64 )
Convection criterionSchwarzschild criterion
Dynamical evolution is included (hopefully?).

Z=0.02 starslog ρC-log TC Diagram
Takashi Yoshida “From Quarks to Supernovae”, November 30, 2010
He-b
C-bNe-b
O-b
Si-b
7.5
8
8.5
9
9.5
10
0 2 4 6 8 10
15M25M40M100M
log T C
log ρC

Mini=10, 11, 12 M⦿

Mini=11 M⦿
Off center Si-burning

(enclosed mass)

He-core Mass (単調増加)

definition of Fe-core --- ambiguous

Eexp=4 R3 a T4/4 with T=5x10⁹K
Radius for 56Ni Production

Mr for 56Ni production
For Eexp= E51 x 1051 erg ===== 10 M ==== 11 M ==== 12 M ===E51 = 0.5; 1.344, 1.421, 1.488E51 = 1.0; 1.365, 1.436, 1.532E51 = 2.0; 1.388, 1.450, 1.566
Mass cut (Neutron star mass for M(56Ni)=0.07) ===== 10 M ==== 11 M ==== 12 M ===E51 = 0.5; 1.274, 1.351, 1.418E51 = 1.0; 1.295, 1.366, 1.462E51 = 2.0; 1.318, 1.380, 1.496
The Neutron Star Mass Distribution 5
0.0 0.5 1.0 1.5 2.0 2.5Neutron star mass [M ]
J0737-3039AJ0737-3039BJ1518+4904J1518+4904comp.B1534+12B1534+12comp.J1756-2251J1756-2251comp.J1811-1736J1811-1736comp.J1829+2456J1829+2456comp.J1906+0746J1906+0746comp.B1913+16B1913+16comp.B2127+11CB2127+11comp.
J0024-7204H(47TucH)*J0437-4715J0514-4002A*J0621+1002J0751+1807J1012+5307J1141-6545B1516+02B*J1614-2230J1713+0747J1748-2446I(Ter5I)*J1748-2446J(Ter5J)*B1802-07*J1802-2124B1855+09J1909-3744B1911-5958A*B2303+46
0.0 0.5 1.0 1.5 2.0 2.5
0.0 0.5 1.0 1.5 2.0 2.5
Double neutron star systems
Neutron star-white dwarf systems
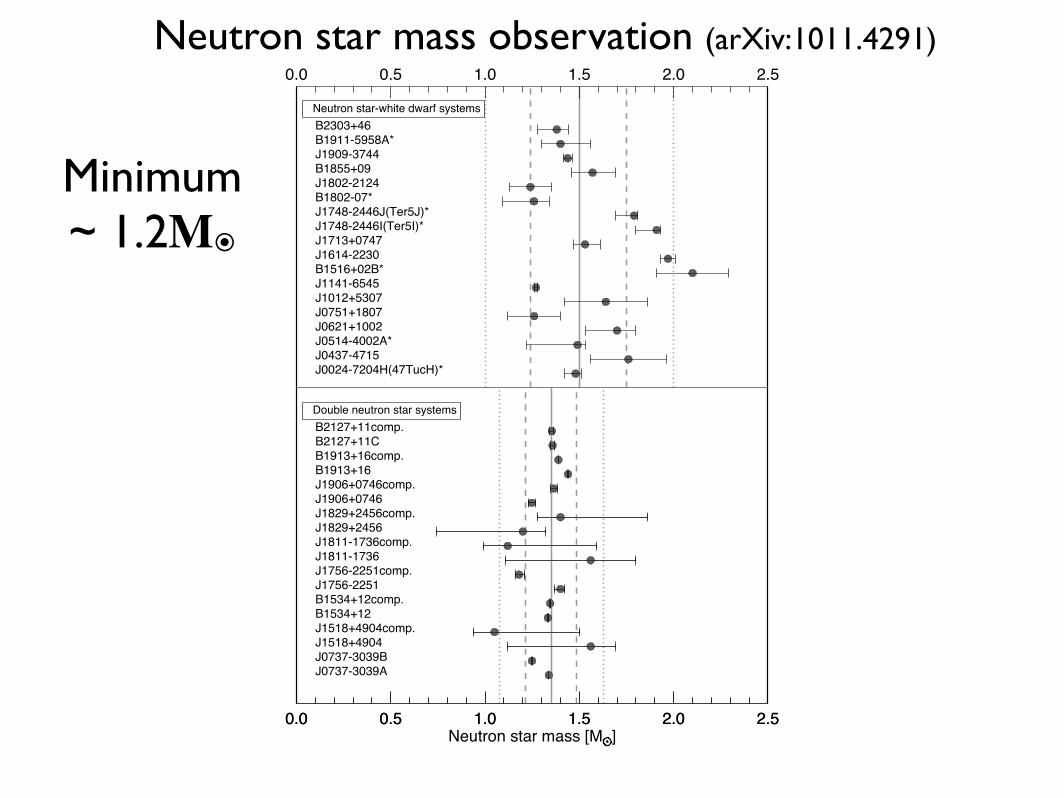
Figure 1. Measured masses of radio pulsars. All error barsindicate the central 68% confidence limits. Vertical solid linesare the peak values of the underlying mass distribution for DNS(m = 1.35 M!) and NS-WD (m = 1.50 M!) systems. The dashedand dotted vertical lines show the central 68% and 95% predictiveprobability intervals of the underlying mass distribution shown inFigure 2. “!” points to pulsars found in globular clusters.
4.1. Double Neutron Star Systems
Several scenarios have been suggested for the formationof DNS systems. Each NS in DNS systems is believed tooriginate from massive main sequence stars with massesthat exceed 8M!. While the formation sequence andprocesses are not well understood, the first formed NSproduced by the more massive primary may initially ac-cumulate additional mass through wind accretion whenthe less massive secondary continues to undergo nuclearevolution during the early phases of the red giant branch.In the standard scenario, the system enters a high-massX-ray binary (HMXB) phase in which unstable masstransfer leads to a common envelope evolution. Thefirst formed NS is then expected to accumulate addi-tional mass during this phase and form pulsars such asB1913+16. A double-core model has also been suggestedin which a He and a CO star evolves through a commonenvelope phase following the initial Roche-lobe overflow(Podsiadlowski et al. 2005). After the common envelopeand a second phase of mass transfer, DNS systems suchas J0737!3039 can be produced following two consecu-tive SN explosions. Alternative evolutionary scenarios inwhich the progenitor of the secondary (less massive) pul-sar is a main sequence star with a mass less than 2M!
have also been proposed as a viable production channel(Stairs et al. 2006).
4.2. Neutron Star-White Dwarf Systems
The evolutionary paths that may lead to the forma-tion of NS-WD systems include possible episodes of ac-cretion through wind, disk or a common envelope. Sec-ular disk accretion is generally accepted as the domi-nant process of mass transfer for long-period NS-WD sys-tems with low-mass white dwarf companions (e.g., PSRJ1713+0747). On the other hand, NSs with more mas-sive white dwarf secondaries in close orbit systems areexpected to go either primarily through a common enve-lope phase (e.g., PSR J1157+5112) or Roche-lobe over-flow followed by mass transfer through common enve-lope (e.g., PSR J1141!6545) (Stairs 2004). It’s been alsosuggested that it may be possible to produce NS-WD bi-nary systems with orbital parameters that resemble PSRJ2145!0750 if the donor stars fill their Roche-lobe on theasymptotic giant branch (van den Heuvel 1994).
5. ESTIMATING THE UNDERLYING MASSDISTRIBUTION
Recent advances in statistical methods have reached alevel which allows us to extract information from sparsedata with unprecedented detail. Generally, there is aninverse correlation between the level of sophistication ofthe model and the confidence of the prediction. By dy-namically measuring the performance (see §6) one canchoose an optimal level of detail to be implemented intothe model.It can be clearly argued why modeling the underly-
ing NS mass distribution as a single homogenous pop-ulation is over-simplistic. There is no compelling lineof reasoning that would require a single coherent (uni-modal) mass distribution for NSs that we know have dis-similar evolutionary histories and possibly di!erent pro-duction channels (e.g., see Podsiadlowski et al. 2004).In fact, there is an increasing number of measurementsthat show clear signatures for masses that deviate fromthe canonical value of 1.4M!. For instance, recent find-ings of van Kerkwijk et al. (2010) imply that the mass forPSR B1957+20 may be as high as 2.4±0.12M!. Many ofNSs in globular clusters also show systematically highermasses (see Freire et al. 2008b). Therefore, it is neces-sary to infer the implied mass distributions separatelyfor di!erent sub-populations (DNS vs. NS-WD). As weshow in §6, an extensively tested and calibrated numeri-cal method can then be used to test whether the impliedmasses belong to the same distribution. We argue thatwith the number of secure mass measurements available(Table 1 and Table 2), clear signatures should be man-ifest in the inferred underlying mass distributions if ap-propriate statistical techniques are utilized. Since we stilloperate in the sparse data regime, it is useful, if not nec-essary, to use Bayesian inference methods.For the range of calculations we use mass measure-
ments obtained directly from pulsar timing. The meth-ods used for estimating NS masses other than radio tim-ing, have intrinsically di!erent systematics, and there-fore require a more careful treatment when assessing theimplied NS mass distribution. The inclusion of mass es-timates of NSs in X-ray binaries along with these more
Neutron star mass observation (arXiv:1011.4291)
Minimum~ 1.2M⦿

Mini < 10M⦿
ONeMg core formation
Takahashi, Umeda & Yoshida

Core evolutions
Fe core
O+Ne+Mg core→・ONeMg WDs?・ECSNe ?
→ CCSNe
Mcrit
・for Ne ignition... Mcrit = ??・How Ne burning propagate ?
... and more detailed features
H burning phase
TH ~10^7 yr
C burning phaseTC ~10^4 yr
He burning phaseTHe ~10^6 yr
Ne+O+Si burning phase
7
7.5
8
8.5
9
9.5
10
0 2 4 6 8 10
T c
!c
M=9 MoM=10 Mo

Core evolutions
1. core H burning
for 9Mo
1e-05
0.0001
0.001
0.01
0.1
1
0 1 2 3 4 5 6 7 8 9
mas
s fra
ctio
n
mass[M/Mo]
HHe
CO
NeMgSiFe
↑convective H burning
↑↓ by CNO cycle
7
7.5
8
8.5
9
9.5
10
0 2 4 6 8 10
T c
!c
M=9 MoM=10 Mo
Core evolutions
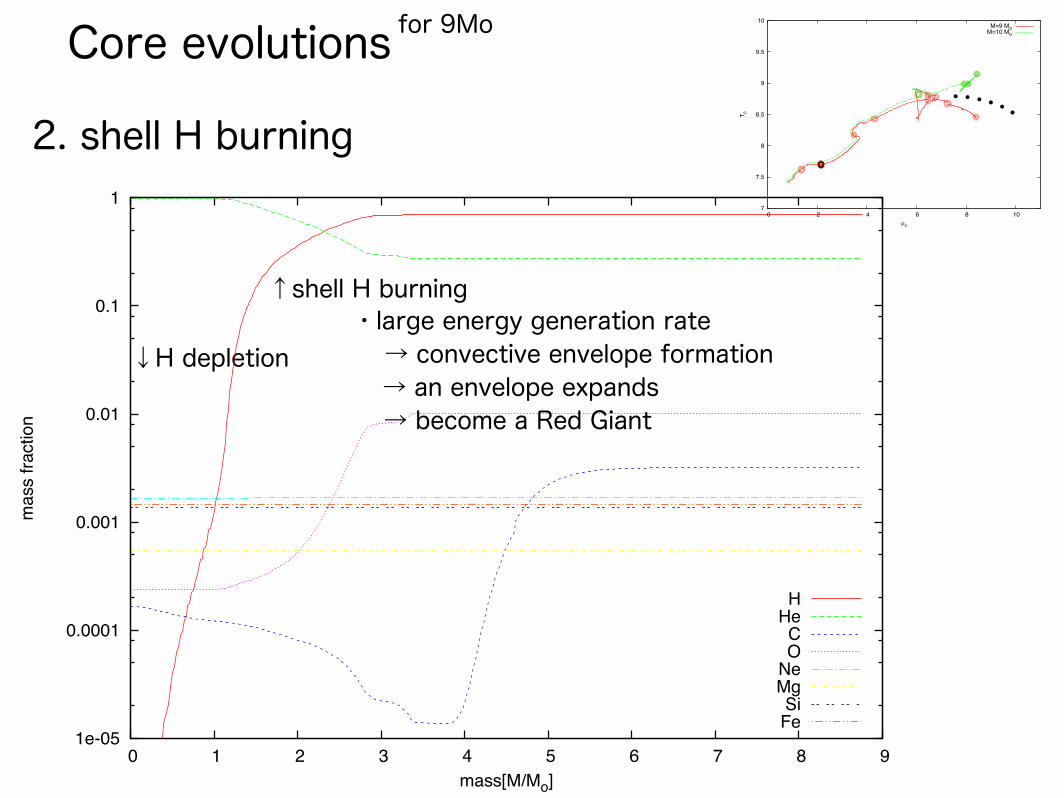
2. shell H burning
for 9Mo
↓H depletion
↑shell H burning
1e-05
0.0001
0.001
0.01
0.1
1
0 1 2 3 4 5 6 7 8 9
mas
s fra
ctio
n
mass[M/Mo]
HHe
CO
NeMgSiFe
・large energy generation rate→ convective envelope formation→ an envelope expands→ become a Red Giant
7
7.5
8
8.5
9
9.5
10
0 2 4 6 8 10
T c
!c
M=9 MoM=10 Mo

Core evolutions
3. core He burning
for 9Mo
↑convective core
↑shell H burning
1e-05
0.0001
0.001
0.01
0.1
1
0 1 2 3 4 5 6 7 8 9
mas
s fra
ctio
n
mass[M/Mo]
HHe
CO
NeMgSiFe
・energy generation rate decreases→ an envelope contracts→ become a Horizontal Branch star
7
7.5
8
8.5
9
9.5
10
0 2 4 6 8 10
T c
!c
M=9 MoM=10 Mo

Core evolutions
4. shell He burning
for 9Mo
↓He depletion
↑shell H burning terminate
・regained energy generation rate→ an envelope expands→ becomes an Asymptotic Giant Branch star
1e-05
0.0001
0.001
0.01
0.1
1
0 1 2 3 4 5 6 7 8 9
mas
s fra
ctio
n
mass[M/Mo]
HHe
CO
NeMgSiFe
・the core contracts until C ignites
↑shell He burning
7
7.5
8
8.5
9
9.5
10
0 2 4 6 8 10
T c
!c
M=9 MoM=10 Mo

Core evolutions
5. Off-center C ign.
for 9Mo
↑Off-center C ignition↑shell He burning
・degenerate-electron pressure・neutrino cooling
→ in a degenerate core, central temperature harder to increase than surrounding hot mantles
→ temperature inversion
1e-05
0.0001
0.001
0.01
0.1
1
0 0.5 1 1.5 2
mas
s fra
ctio
n
mass[M/Mo]
HHe
CO
NeMgSiFe
7
7.5
8
8.5
9
9.5
10
0 2 4 6 8 10
T c
!c
M=9 MoM=10 Mo

Core evolutions
6. C front propagation
for 9Mo
↑Off-center C ignition・longer characteristic time・less neutrino cooling → propagation due to heat conduction
1e-05
0.0001
0.001
0.01
0.1
1
0 0.5 1 1.5 2
mas
s fra
ctio
n
mass[M/Mo]
HHe
CO
NeMgSiFe
7
7.5
8
8.5
9
9.5
10
0 2 4 6 8 10
T c
!c
M=9 MoM=10 Mo

Core evolutions
7. Several C burnings
for 9Mo
↑C ignition・compressional heating → remaining outer carbon reignites
1e-05
0.0001
0.001
0.01
0.1
1
0 0.5 1 1.5 2
mas
s fra
ctio
n
mass[M/Mo]
HHe
CO
NeMgSiFe
↑C ignition↑C ignition MHe ~ 1.27 Mo
7
7.5
8
8.5
9
9.5
10
0 2 4 6 8 10
T c
!c
M=9 MoM=10 Mo

Core evolutions
8. the 2nd Dredge UP
for 9Mo
・convective H envelope → at the base of the envelope convection the inner He-rich components are “dredged-up” into the outer envelope
C burning↓
1e-05
0.0001
0.001
0.01
0.1
1
0 0.5 1 1.5 2
mas
s fra
ctio
n
mass[M/Mo]
HHe
CO
NeMgSiFe
He/H boundary moves inward→
7
7.5
8
8.5
9
9.5
10
0 2 4 6 8 10
T c
!c
M=9 MoM=10 Mo

Core evolutions
9. O+Ne+Mg core
for 9Mo
Ne ignition does not occur for the 9 Mo star
1e-05
0.0001
0.001
0.01
0.1
1
0 0.5 1 1.5 2
mas
s fra
ctio
n
mass[M/Mo]
HHe
CO
NeMgSiFe
↑ after the 2nd DUPthin He layer remains
→ Thermal Pulse phase
→ How much core mass increases during TP phase?
・Mcore > Mchandra ECSNe・Mcore < Mchandra ONeMg WDs
7
7.5
8
8.5
9
9.5
10
0 2 4 6 8 10
T c
!c
M=9 MoM=10 Mo

8.4
8.6
8.8
9
9.2
9.4
5.5 6 6.5 7 7.5 8 8.5 9 9.5 10
T c
!c
M/Mo=99.29.59.79.8
9.789.79
9.99.81
1011
Core mass @2nd dredge up
Mcrit ~ 1.37 Mo
1.71
1.27
1.491.40
1.401.38
1.370
1.3691.331.29
1.373
