effects of surface geology on seismic motionesg.eri.ucsb.edu/sites/default/files/5.4 maeda et...
TRANSCRIPT
1
4th IASPEI / IAEE International Symposium:
Effects of Surface Geology on Seismic Motion August 23–26, 2011 · University of California Santa Barbara
SPATIAL VERIATION OF SITE EFFECT IN HIROO TOWN, HOKKAIDO, JAPAN
Takahiro MAEDA Nobuo TAKAI Tsutomu SASATANI National Research Institute for Hokkaido Univeristy Sapporo, Hokkaido, 002-8071 Earth Science and Disaster Prevention Sapporo, Hokkaido, 060-8628 JAPAN Tsukuba, Ibaraki, 305-0006 JAPAN JAPAN ABSTRACT We investigate a spatial site-amplification variation in Hiroo town, Hokkaido, Japan, where five strong-motion stations are operating within a 1.5-km radius; one rock site, one building site, and three soil sites. We estimate site amplification factors at the stations using a traditional spectral ratio technique and a theoretical evaluation based on the subsurface structure model. Site amplification factors based on the traditional spectral ratio technique are estimated by taking a ratio of S-wave spectra for weak motions at soil sites to that at a rock site. The spectral ratio shows site specific spectral peaks. The subsurface structure model used in the theoretical evaluation is estimated at one rock and three soil sites by two explorations; the array measurement of microtremors and the spectral analysis of surface waves. Although the site amplification factors based on the two methods correspond with each other at one site, two of three shows a discrepancy. These discrepancies will be verified by operating the explorations at a lot of points around the strong-motion stations.
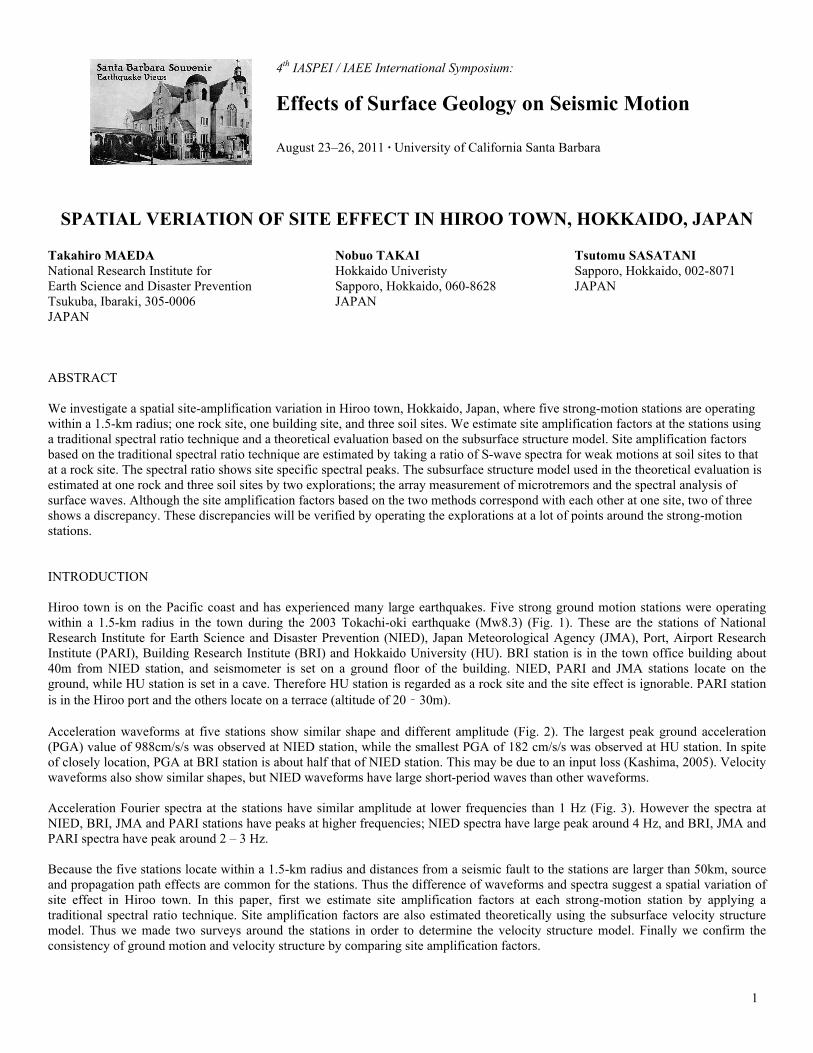
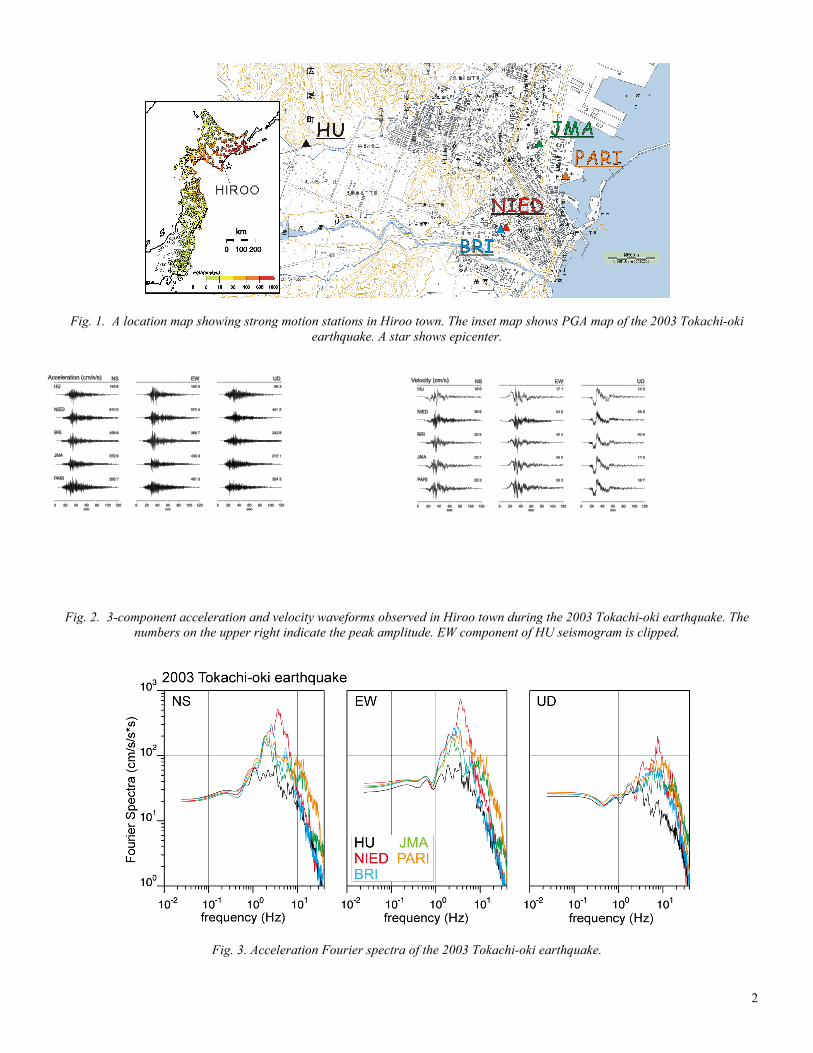
INTRODUCTION Hiroo town is on the Pacific coast and has experienced many large earthquakes. Five strong ground motion stations were operating within a 1.5-km radius in the town during the 2003 Tokachi-oki earthquake (Mw8.3) (Fig. 1). These are the stations of National Research Institute for Earth Science and Disaster Prevention (NIED), Japan Meteorological Agency (JMA), Port, Airport Research Institute (PARI), Building Research Institute (BRI) and Hokkaido University (HU). BRI station is in the town office building about 40m from NIED station, and seismometer is set on a ground floor of the building. NIED, PARI and JMA stations locate on the ground, while HU station is set in a cave. Therefore HU station is regarded as a rock site and the site effect is ignorable. PARI station is in the Hiroo port and the others locate on a terrace (altitude of 20 ‒ 30m). Acceleration waveforms at five stations show similar shape and different amplitude (Fig. 2). The largest peak ground acceleration (PGA) value of 988cm/s/s was observed at NIED station, while the smallest PGA of 182 cm/s/s was observed at HU station. In spite of closely location, PGA at BRI station is about half that of NIED station. This may be due to an input loss (Kashima, 2005). Velocity waveforms also show similar shapes, but NIED waveforms have large short-period waves than other waveforms. Acceleration Fourier spectra at the stations have similar amplitude at lower frequencies than 1 Hz (Fig. 3). However the spectra at NIED, BRI, JMA and PARI stations have peaks at higher frequencies; NIED spectra have large peak around 4 Hz, and BRI, JMA and PARI spectra have peak around 2 – 3 Hz. Because the five stations locate within a 1.5-km radius and distances from a seismic fault to the stations are larger than 50km, source and propagation path effects are common for the stations. Thus the difference of waveforms and spectra suggest a spatial variation of site effect in Hiroo town. In this paper, first we estimate site amplification factors at each strong-motion station by applying a traditional spectral ratio technique. Site amplification factors are also estimated theoretically using the subsurface velocity structure model. Thus we made two surveys around the stations in order to determine the velocity structure model. Finally we confirm the consistency of ground motion and velocity structure by comparing site amplification factors.
2
Fig. 1. A location map showing strong motion stations in Hiroo town. The inset map shows PGA map of the 2003 Tokachi-oki earthquake. A star shows epicenter.
Acceleration (cm/s/s)HUNIEDBRIJMAPARINS EW UD Velocity (cm/s)HUNIEDBRIJMAPARINS EW UD
Fig. 2. 3-component acceleration and velocity waveforms observed in Hiroo town during the 2003 Tokachi-oki earthquake. The numbers on the upper right indicate the peak amplitude. EW component of HU seismogram is clipped.
Fig. 3. Acceleration Fourier spectra of the 2003 Tokachi-oki earthquake.
3
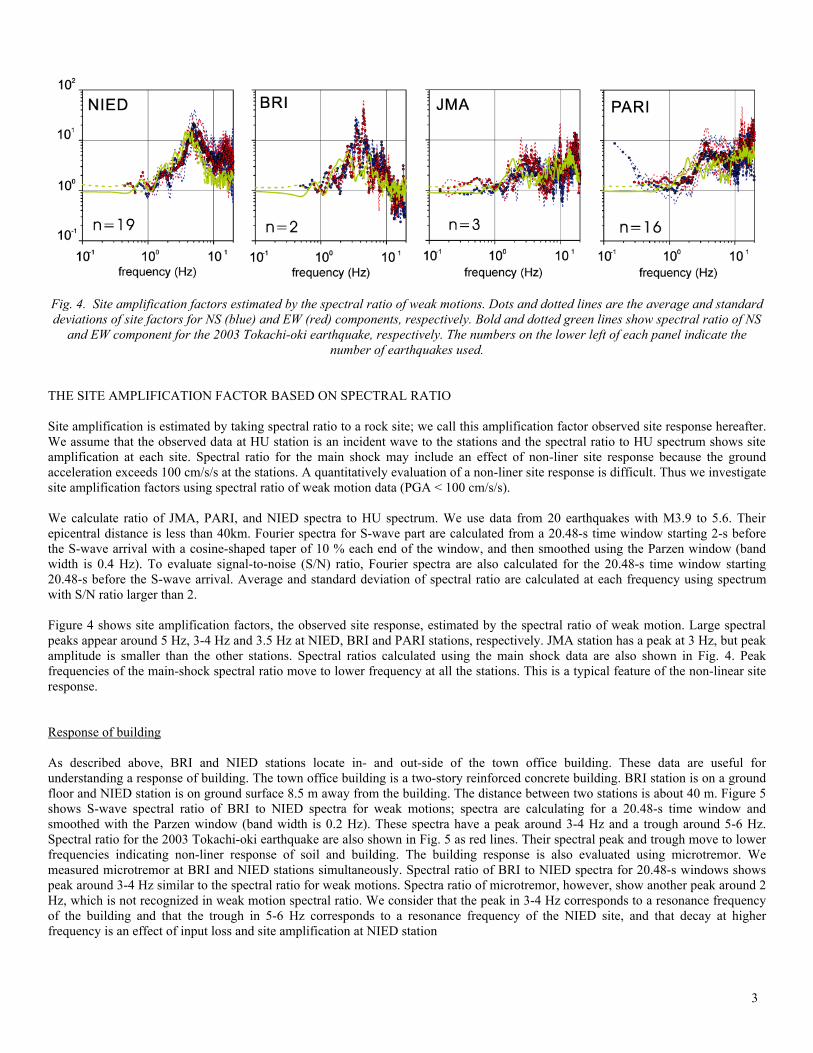
Fig. 4. Site amplification factors estimated by the spectral ratio of weak motions. Dots and dotted lines are the average and standard deviations of site factors for NS (blue) and EW (red) components, respectively. Bold and dotted green lines show spectral ratio of NS
and EW component for the 2003 Tokachi-oki earthquake, respectively. The numbers on the lower left of each panel indicate the number of earthquakes used.
THE SITE AMPLIFICATION FACTOR BASED ON SPECTRAL RATIO Site amplification is estimated by taking spectral ratio to a rock site; we call this amplification factor observed site response hereafter. We assume that the observed data at HU station is an incident wave to the stations and the spectral ratio to HU spectrum shows site amplification at each site. Spectral ratio for the main shock may include an effect of non-liner site response because the ground acceleration exceeds 100 cm/s/s at the stations. A quantitatively evaluation of a non-liner site response is difficult. Thus we investigate site amplification factors using spectral ratio of weak motion data (PGA < 100 cm/s/s). We calculate ratio of JMA, PARI, and NIED spectra to HU spectrum. We use data from 20 earthquakes with M3.9 to 5.6. Their epicentral distance is less than 40km. Fourier spectra for S-wave part are calculated from a 20.48-s time window starting 2-s before the S-wave arrival with a cosine-shaped taper of 10 % each end of the window, and then smoothed using the Parzen window (band width is 0.4 Hz). To evaluate signal-to-noise (S/N) ratio, Fourier spectra are also calculated for the 20.48-s time window starting 20.48-s before the S-wave arrival. Average and standard deviation of spectral ratio are calculated at each frequency using spectrum with S/N ratio larger than 2. Figure 4 shows site amplification factors, the observed site response, estimated by the spectral ratio of weak motion. Large spectral peaks appear around 5 Hz, 3-4 Hz and 3.5 Hz at NIED, BRI and PARI stations, respectively. JMA station has a peak at 3 Hz, but peak amplitude is smaller than the other stations. Spectral ratios calculated using the main shock data are also shown in Fig. 4. Peak frequencies of the main-shock spectral ratio move to lower frequency at all the stations. This is a typical feature of the non-linear site response.
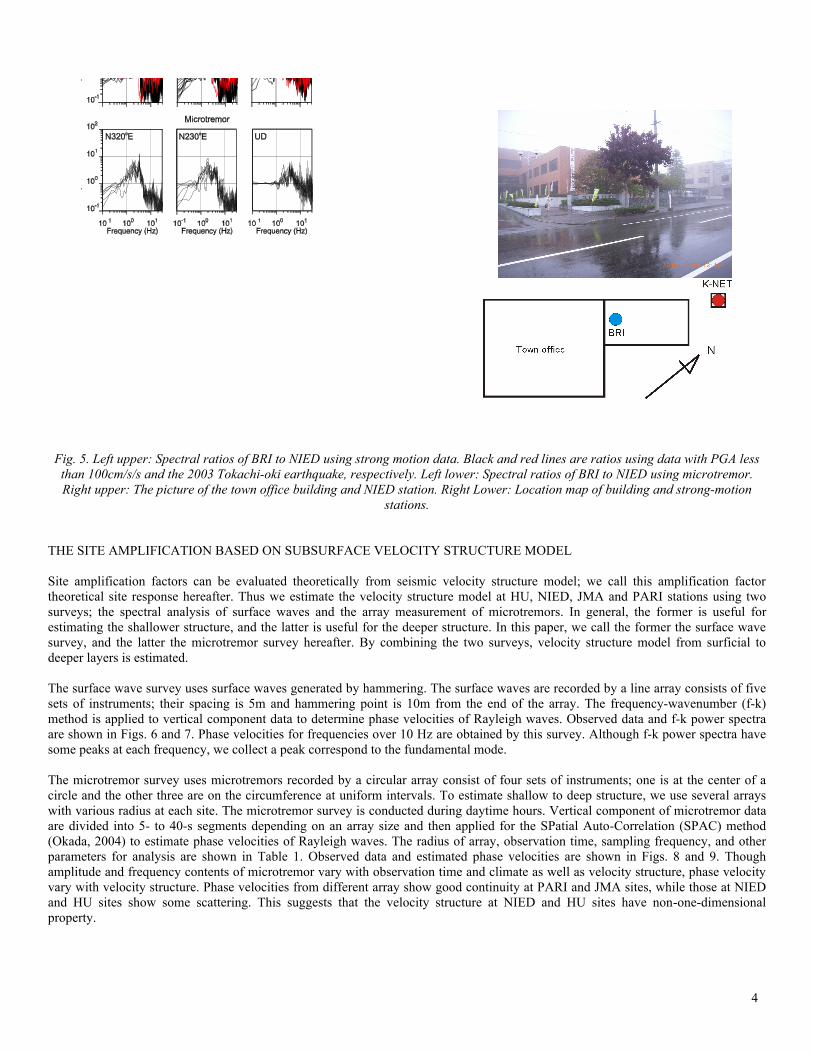
Response of building As described above, BRI and NIED stations locate in- and out-side of the town office building. These data are useful for understanding a response of building. The town office building is a two-story reinforced concrete building. BRI station is on a ground floor and NIED station is on ground surface 8.5 m away from the building. The distance between two stations is about 40 m. Figure 5 shows S-wave spectral ratio of BRI to NIED spectra for weak motions; spectra are calculating for a 20.48-s time window and smoothed with the Parzen window (band width is 0.2 Hz). These spectra have a peak around 3-4 Hz and a trough around 5-6 Hz. Spectral ratio for the 2003 Tokachi-oki earthquake are also shown in Fig. 5 as red lines. Their spectral peak and trough move to lower frequencies indicating non-liner response of soil and building. The building response is also evaluated using microtremor. We measured microtremor at BRI and NIED stations simultaneously. Spectral ratio of BRI to NIED spectra for 20.48-s windows shows peak around 3-4 Hz similar to the spectral ratio for weak motions. Spectra ratio of microtremor, however, show another peak around 2 Hz, which is not recognized in weak motion spectral ratio. We consider that the peak in 3-4 Hz corresponds to a resonance frequency of the building and that the trough in 5-6 Hz corresponds to a resonance frequency of the NIED site, and that decay at higher frequency is an effect of input loss and site amplification at NIED station
4
Fig. 5. Left upper: Spectral ratios of BRI to NIED using strong motion data. Black and red lines are ratios using data with PGA less than 100cm/s/s and the 2003 Tokachi-oki earthquake, respectively. Left lower: Spectral ratios of BRI to NIED using microtremor. Right upper: The picture of the town office building and NIED station. Right Lower: Location map of building and strong-motion
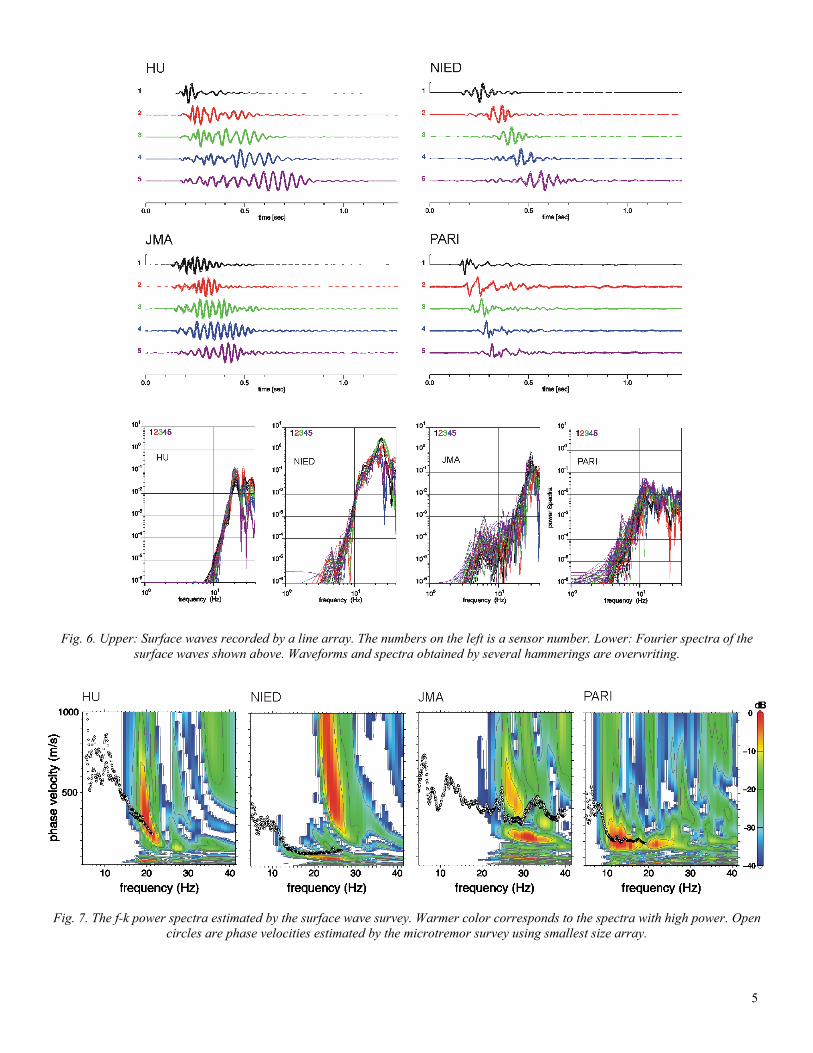
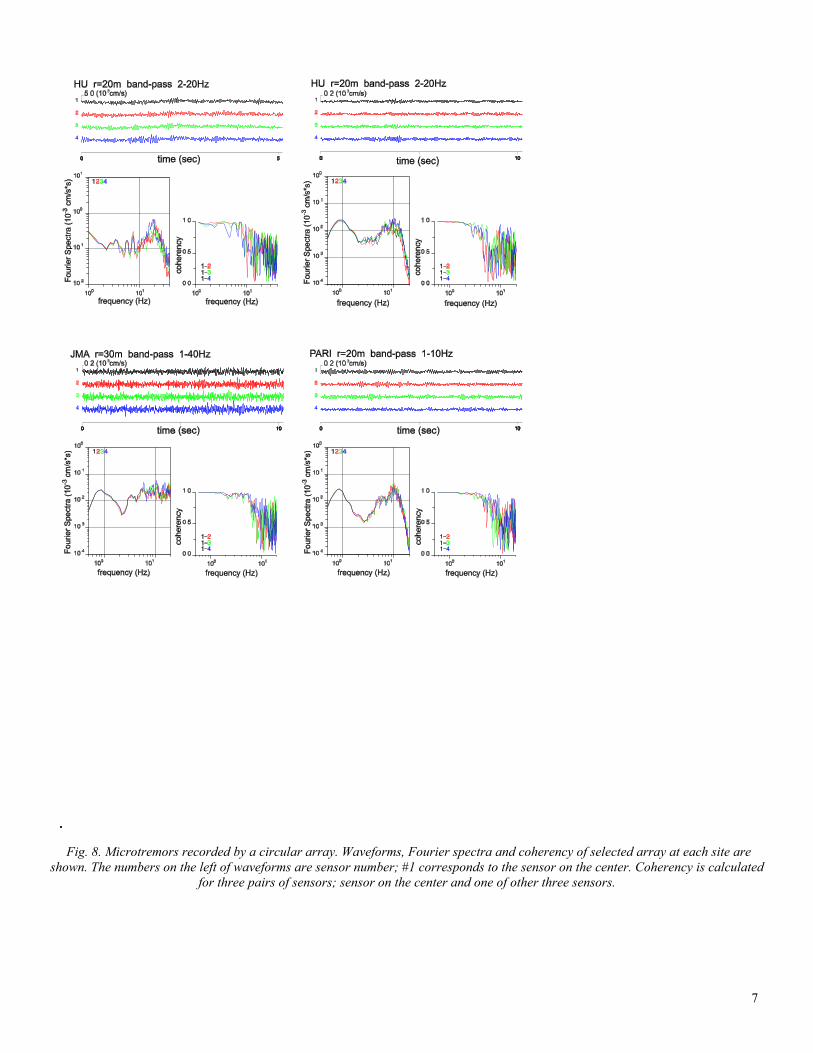
stations. THE SITE AMPLIFICATION BASED ON SUBSURFACE VELOCITY STRUCTURE MODEL Site amplification factors can be evaluated theoretically from seismic velocity structure model; we call this amplification factor theoretical site response hereafter. Thus we estimate the velocity structure model at HU, NIED, JMA and PARI stations using two surveys; the spectral analysis of surface waves and the array measurement of microtremors. In general, the former is useful for estimating the shallower structure, and the latter is useful for the deeper structure. In this paper, we call the former the surface wave survey, and the latter the microtremor survey hereafter. By combining the two surveys, velocity structure model from surficial to deeper layers is estimated. The surface wave survey uses surface waves generated by hammering. The surface waves are recorded by a line array consists of five sets of instruments; their spacing is 5m and hammering point is 10m from the end of the array. The frequency-wavenumber (f-k) method is applied to vertical component data to determine phase velocities of Rayleigh waves. Observed data and f-k power spectra are shown in Figs. 6 and 7. Phase velocities for frequencies over 10 Hz are obtained by this survey. Although f-k power spectra have some peaks at each frequency, we collect a peak correspond to the fundamental mode. The microtremor survey uses microtremors recorded by a circular array consist of four sets of instruments; one is at the center of a circle and the other three are on the circumference at uniform intervals. To estimate shallow to deep structure, we use several arrays with various radius at each site. The microtremor survey is conducted during daytime hours. Vertical component of microtremor data are divided into 5- to 40-s segments depending on an array size and then applied for the SPatial Auto-Correlation (SPAC) method (Okada, 2004) to estimate phase velocities of Rayleigh waves. The radius of array, observation time, sampling frequency, and other parameters for analysis are shown in Table 1. Observed data and estimated phase velocities are shown in Figs. 8 and 9. Though amplitude and frequency contents of microtremor vary with observation time and climate as well as velocity structure, phase velocity vary with velocity structure. Phase velocities from different array show good continuity at PARI and JMA sites, while those at NIED and HU sites show some scattering. This suggests that the velocity structure at NIED and HU sites have non-one-dimensional property.
5
Fig. 6. Upper: Surface waves recorded by a line array. The numbers on the left is a sensor number. Lower: Fourier spectra of the surface waves shown above. Waveforms and spectra obtained by several hammerings are overwriting.
Fig. 7. The f-k power spectra estimated by the surface wave survey. Warmer color corresponds to the spectra with high power. Open circles are phase velocities estimated by the microtremor survey using smallest size array.

6
For both surveys, we used velocity type seismometer LE-3D/5S (Lennartz Electric) and data logger DATAMARK LS-7000XT (HAKUSAN CORPORATION). Time correction is made using GPS at each data logger. Due to limitations of space, survey point is few tens meter away from the strong-motion station at JMA and NIED sites, and about 500 m at HU site. The surveys at HU site are conducted to investigate velocity structure down to seismic basement.
By using the phase velocities estimated by two surveys, we obtain phase velocities for wider frequency range. The phase velocities from two surveys show good continuity at HU, NIED and PARI sites, thus we use phase velocities from both surveys (Fig. 7). Phase velocities by two surveys at JMA site, however, have discrepancy of 100 cm/s at 30 Hz (Fig. 7). This discrepancy may come from a difference of survey points. Because survey point of the microtremor survey is closer to strong-motion station, we use phase velocities by the microtremor survey at JMA site. Based on these phase velocities, we determine a dispersion curve of phase velocity at each site (Fig. 9 lower).
Table 1. Details of the microtremor survey.
Observation time Parameters for the analysis Site Radius
(m) Date Start End
Sampling (Hz) Filter**
(Hz) Time window
(s) N&&
5 2006/06/23 10:50 11:01 4 – 40 30 10 2006/06/23 11:10 11:21 2 – 30 42 20 2006/06/23 11:27 11:41 2 – 20 9 30 2006/08/08 12:09 12:26 2 – 20
5.12
8 40 2006/06/23 11:48 12:02 2 – 20 31 80 2006/08/08 11:33 12:00 1 – 10
10.24 16
130 2006/08/08 16:23 17:08
200
0.4 – 10 20.48 17
HU
450 2005/09/30 08:38 09:45 100 0.2 – 3 40.96 28 2 2006/09/29 16:07 16:19 1 – 40 10.24 15 5 2006/08/09 06:41 06:50 1 – 40 27
10 2006/08/09 06:26 06:36 1 – 15 5.12
15 20 2006/08/09 06:06 06:20 1 – 20 16 40 2006/9/30 09:00 09:31 1 – 10 17
NIED
64 2006/9/30 09:37 10:07 0.4 – 10 10.24
30 2 2006/09/29 15:08 15:19 4 – 40 37
4.62 2006/09/29 14:44 14:58 1 – 40 42 15 2006/09/29 14:10 14:30 1 – 40 22
JMA
30 2006/09/29 13:44 14:05 1 – 40
10.24
27 4 2006/06/24 09:24 09:35 2 – 20 5.12 45 8 2006/06/24 09:41 09:51 2 – 20 18
15 2006/08/09 10:06 10:25 1 – 10 10 20 2006/09/30 06:21 06:46 1 – 10 32 26 2006/08/09 09:35 10:00 1 – 10 24
PARI
50 2006/09/30 06:53 07:16
200
1 – 10
10.24
24
** Pass band of the band-pass filter && The number of segments used in the analysis.
7
HU r=20m band-pass 2-20HzPARI r=20m band-pass 1-10HzJMA r=30m band-pass 1-40HzHU r=20m band-pass 2-20Hzfrequency (Hz)Fourier Spectra (10-3 cm/s*s)coherencytime (sec)frequency (Hz)frequency (Hz)Fourier Spectra (10-3 cm/s*s)coherencytime (sec)frequency (Hz)frequency (Hz)Fourier Spectra (10-3 cm/s*s)coherencytime (sec)frequency (Hz)frequency (Hz)Fourier Spectra (10-3 cm/s*s)coherencytime (sec)frequency (Hz)
Fig. 8. Microtremors recorded by a circular array. Waveforms, Fourier spectra and coherency of selected array at each site are shown. The numbers on the left of waveforms are sensor number; #1 corresponds to the sensor on the center. Coherency is calculated
for three pairs of sensors; sensor on the center and one of other three sensors.

8
frequency (Hz)Velocity (km/s)SPAC coef.frequency (Hz)frequency (Hz)frequency (Hz)HU NIED JMA PARI
Fig. 9. Upper: SPAC coefficient and lower: phase velocity estimated by the microtremor survey. Colored lines show results of each array. The numbers shown with phase velocity indicate radius of the circular array. Open circles are visually averaged phase velocity
at each site. Red circles shown in HU, NIED and PARI panels are phase velocities estimated by the surface wave survey.
HU NIED JMA PARIfrequency (Hz)Phase velocity (km/s)frequency (Hz)frequency (Hz)frequency (Hz)Depth (m)Vs (m/s) Slowness (s/m)Vs (m/s) Slowness (s/m)Vs (m/s) Slowness (s/m)Vs (m/s) Slowness (s/m)
Fig. 10. Results of inversion analysis based on the genetic algorithm for estimating S-wave velocity structure. Upper: Fitting of the observed (red circles) and calculated (black lines) phase velocities for the fundamental-mode Rayleigh wave. Phase velocity is calculated using several low-misfit velocity models estimated by the inversion shown in the lower. Lower: The S-wave velocity
structure model determined by the inversion of phase velocity. Several low-misfit models are overwriting.

9
Fig. 11. Comparison of the site amplification factors. Blue and red circles shows the observed site response for NS and EW components. Red lines show the theoretical site response for the velocity structure model estimated in this study. Blue line shows the theoretical site response for the PS-logging velocity structure model. The Parzen window of 0.4 Hz is applied for the theoretical site
responses.
Table 2. Minimum misfit S-wave velocity structure model of GA inversion.
HU NIED JMA PARI
Layer # Vs m/s
H m Vs
m/s H m Vs
m/s H m Vs
m/s H m
1 140.56 2.73 87.38 2.61 297.94 7.10 188.59 9.40
2 669.00 22.50 581.64 37.70 626.22 39.50 867.80 90.61
3 1167.43 39.10 1205.50 96.80 2130.66 29.92 2737.07
4 2207.14 89.58 2715.37 2692.95
5 2722.76 S-wave velocity structure is estimated by fitting observed dispersion of phase velocity with theoretical one for the fundamental mode of Rayleigh wave. We assume one-dimensional velocity structure at each site consist of 2 to 4 layers over a common half space. First, S-wave velocity of the half space (seismic basement) is estimated by forward fitting of HU dispersion curve. 2.7 km/s is obtained for the half space. Then S-wave velocity and thickness for each layer at each site are estimated by the inversion analysis using the genetic algorithm (GA) (Yamanaka and Ishida, 1996). Fitting of dispersion curve and estimated S-wave velocity structures are shown in Fig. 10. In general, the inversion analysis based on GA does not provide unique solution. Thus we show several solutions having low misfit in Fig. 10. The solutions with minimum misfit are shown in Table. 2. Although the fitting of phase velocity at JMA site seems well, estimated S-wave velocity for deeper layers have variety. Because the observed phase velocities at JMA site are less than 2 km/s, analyzing power for the S-wave velocity for deeper layers is low. DISCUSSION AND CONCLUSION The observed and theoretical site responses are show in Fig. 11. The theoretical site response is calculated for the vertically incident SH wave using the Propagator Matrix method (Aki and Richards, 2002). We assume that HU station locates in the 3-rd layer (S-wave velocity of 1167 m/s: Table. 2) and then calculate the site response of 1st and 2nd layers for NIED and JMA and that of 1st layer for PARI. The theoretical site response should correspond to the observed site response. However, peak frequencies of observed and

10
calculated site responses are different at NIED and PARI stations. At these stations, logging data down to several meters are available. For NIED station, S-wave velocity and thickness of surficial layer estimated from PS-logging are 100–126 m/s and 8 m, respectively, while those of our result are 87m/s and 2.6m. Peak frequency calculated from PS-logging velocity structure model is slightly lower than that of observed site response. Phase velocity based on the PS-logging structure model does not agree with that of our surveys. For PARI station, thickness of surficial layer estimated from N value of logging data and our result show discrepancy; 5 m and 9.4 m, respectively. Because the surveys are operated at some distance from the strong-motion station, these discrepancies indicate spatial variation of the subsurface structure around the stations. These discrepancies will be verified by operating the explorations at a lot of points around the strong-motion stations. ACKNOWLEDGEMENTS We thank National Research Institute for Earth Science and Disaster Prevention (NIED), Japan Meteorological Agency (JMA), Port, Airport Research Institute (PARI), Building Research Institute (BRI) and Hokkaido University for providing strong-motion data. We are grateful to Goro Miwada, Shinako Noguchi, Masayuki Shin-ya, Shota Honma, Masayoshi Ichiyanagi and Masashige Furuya for helps in the observation. REFERENCES Aki, K., and P. G. Richards [2002], “Quantitative Seismology. second edition”. University Science Books, Sausalito, CA. Kashima, T. [2005], “ Strong Motion Observation by Building Research Institute (in Japanese with English abstract)”, Technical Note of the National Research Institute for Earth Science and Disaster Prevention, Vol 264, pp. 33-39. Okada, H. [2004], “The microtremor survey method”. Society of Exploration Geophysicists, Tulsa, OK. Yamanaka, H., and H. Ishida [1996], “Application of Genetic Algorithms to an Inversion of Surface-Wave Dispersion Data”, Bull. Seism. Soc. Am., Vol. 86, No. 2, pp. 436-444.