employment policy department...comments received in a seminar held in turin, italy, in the summer of...
TRANSCRIPT

Employmentand Labour Market Policies Branch
EMPLOYMENT Working Paper No. 195
Employment Policy Department
2015
Nomaan Majid
The great employment transformation in China
EMPL
OYM
ENT
EMPL
OYM
ENT
EMPL
OYM
ENT
EMPL
OYM
ENT
EMPL
OYM
ENT

i
Employment Policy Department EMPLOYMENT
Working Paper No. 195
2015
The Great Employment Transformation in China
Nomaan Majid
Employment and Labour Market Policies Branch

ii
Copyright © International Labour Organization 2015
First published 2015
Publications of the International Labour Office enjoy copyright under Protocol 2 of the Universal Copyright Convention.
Nevertheless, short excerpts from them may be reproduced without authorization, on condition that the source is indicated. For
rights of reproduction or translation, application should be made to ILO Publications (Rights and Permissions), International Labour
Office, CH-1211 Geneva 22, Switzerland, or by email: [email protected]. The International Labour Office welcomes such
applications.
Libraries, institutions and other users registered with reproduction rights organizations may make copies in accordance with the
licences issued to them for this purpose. Visit http://www.ifrro.org to find the reproduction rights organization in your country.
ILO Cataloguing in Publication Data
Majid, Nomaan
The great employment transformation in China / Nomaan Majid ; International Labour Office, Employment Policy Department,
Employment and Labour Market Policies Branch. - Geneva: ILO, 2015
(Employment working paper; No. 195)
ISSN 1999-2939 (print); ISSN 1999-2947 (web pdf)
International Labour Office. Employment Policy Dept.
employment / economic growth / productivity / labour force / structural change / dual economy / wages / China
13.01.3
The designations employed in ILO publications, which are in conformity with United Nations practice, and the presentation of
material therein do not imply the expression of any opinion whatsoever on the part of the International Labour Office concerning
the legal status of any country, area or territory or of its authorities, or concerning the delimitation of its frontiers.
The responsibility for opinions expressed in signed articles, studies and other contributions rests solely with their authors, and
publication does not constitute an endorsement by the International Labour Office of the opinions expressed in them.
Reference to names of firms and commercial products and processes does not imply their endorsement by the International Labour
Office, and any failure to mention a particular firm, commercial product or process is not a sign of disapproval.
ILO publications and electronic products can be obtained through major booksellers or ILO local offices in many countries, or
direct from ILO Publications, International Labour Office, CH-1211 Geneva 22, Switzerland. Catalogues or lists of new
publications are available free of charge from the above address, or by email: [email protected]
Visit our website: http://www.ilo.org/publns
Printed by the ILO Geneva, Switzerland
iii
Preface
The primary goal of the ILO is to work with member States towards achieving full
and productive employment and decent work for all. This goal is elaborated in the ILO
Declaration 2008 on Social Justice for a Fair Globalization,1 which has been widely
adopted by the international community. Comprehensive and integrated perspectives to
achieve this goal are embedded in the Employment Policy Convention of 1964 (No. 122),
the Global Employment Agenda (2003) and – in response to the 2008 global economic
crisis – the Global Jobs Pact (2009) and the conclusions of the Recurrent Discussion
Reports on Employment (2010 and 2014).
The Employment Policy Department (EMPLOYMENT) is engaged in global
advocacy and in supporting member States in placing more and better jobs at the center of
economic and social policies and growth and development strategies. Policy research and
knowledge generation and dissemination are essential components of the Employment
Policy Department’s activities. The resulting publications include books, country policy
reviews, policy and research briefs, and working papers.2
The Employment Policy Working Paper series is designed to disseminate the main
findings of research on a broad range of topics undertaken by the branches of the
Department. The working papers are intended to encourage the exchange of ideas and to
stimulate debate. The views expressed within them are the responsibility of the authors
and do not necessarily represent those of the ILO.
Azita Berar Awad
Director
Employment Policy Department
1 See http://www.ilo.org/global/about-the-ilo/mission-and-objectives/WCMS_099766/lang--en/index.htm
1 See http://www.ilo.org/employment

iv
Foreword
The aim of this paper is to make an assessment of the employment situation in China
at an aggregate level that is (a) supported by existing macro data related to output and
labour; and (b) that is consistent with the historical information on the policy shifts that
have taken place in China. The paper focuses on the employment situation in China from
1990, although as a preamble it starts with a discussion of the pre 1990 periods. It shows
that given the available aggregate measures of employment, it is difficult to say much
about the employment situation that accompanied growth in China in the last 25 years;
although indirect evidence on income and poverty suggests that there were definite
improvements. It then constructs measures of regular and non-regular employment for the
Chinese economy since 1990, and examines the relationship of these measures with other
indicators of the labour market and output growth. Essentially the improvement in the
employment situation on which we had partial views before can be established at the
aggregate level. More importantly it is with the use of these variables that particular
adverse situations that occurred with respect to labour in the past can be identified and
explained.
The author presents a comprehensive picture of employment at an aggregate level by
analysing sectoral productivity and labour migrant flows along with trends in the new
categories of employment. China has certainly improved her employment situation in the
last 25 years. However, it still has a large population that is in non-regular work in both
rural and urban areas. It has a growing open unemployment problem which is mostly
urban. The author argues that the employment challenge for China’s policy makers in
today’s context of relatively lower growth rates is to strive to increase the overall share of
regular employment in total employment in such a way that (a) the open urban
unemployment problem is meaningfully contained and then reduced; and (b) the process
of labour transfer out of agriculture to non-agriculture is still freely permitted.
Iyanatul Islam
Chief
Employment and Labour Market Policies
Branch
Employment Policy Department

v
Acknowledgements
The author is grateful to Wang Zi for careful data compilation of Chinese statistics
from published documents for various years and from official websites. Pedro Oluwaseun
provided statistical assistance for productivity decompositions. Thanks are due to Rong
Zhang and Vicky Leung Pui Sze for translating selected Chinese texts and to Laura
Schmidt for bibliographic assistance. Special thanks are due to Susanne Karine Gjonnes
who gave both research and editorial support. The author is particularly grateful for
comments received in a seminar held in Turin, Italy, in the summer of 2015 at the ITC-
ILO, where this paper was presented. Ajit Ghose, Honorary Professor at the Institute for
Human Development (IHD), New Delhi, read the draft and made very valuable
suggestions. The usual disclaimer applies.

vi
Contents
Preface ................................................................................................................................................... iii
Foreword ................................................................................................................................................ iv
Acknowledgements ................................................................................................................................. v
List of abbreviations .............................................................................................................................. ix
Abstract ................................................................................................................................................... x
1. Introduction .................................................................................................................................. 1
2. Examining the employment situation in developing countries ..................................................... 2
3. The historical context of employment and growth in China......................................................... 4
4. The measure of employment and its relationship to population and output ............................... 12
5. The unemployed in China: Trends and attributes ....................................................................... 15
6. Output, income and productivity growth .................................................................................... 17
7. Trends in regular and non-regular employment in China ........................................................... 22
8. Towards an historically consistent explanation of employment trends ...................................... 25
9. Wages and the regularization of employment in China .............................................................. 30
10. Conclusions ................................................................................................................................ 31
Selected Bibliography ........................................................................................................................... 37
Annex .................................................................................................................................................... 41
Annex A Data sources .................................................................................................................. 41
Annex B Data tables ..................................................................................................................... 42
List of figures
Figure 1. Annual population growth rate in China, 1961-2013 .................................................... 6
Figure 2. Value added per worker in agriculture, 1960-2013 ....................................................... 6
Figure 3. Employment in township and village enterprises, 1978-2011 (in millions) ................. 7
Figure 4. Migration and income differentials in China ................................................................ 8
Figure 5. Internal migration in China, 1993-2013 (in millions) ................................................... 8
Figure 6. Rural-urban migrant workers in China, 1990-2013 (in millions) .................................. 9
Figure 7 Value added per employed in industry (in constant US$) and employment in
traditional formal enterprises (in ten thousands), 1990-2012 ........................................ 9
Figure 8. Rural employment as a percentage of total employment, 1990-2011 ......................... 10
Figure 9. Percentage gap of employed with more than junior school education (urban China-all
China), 2002-2012 ....................................................................................................... 10
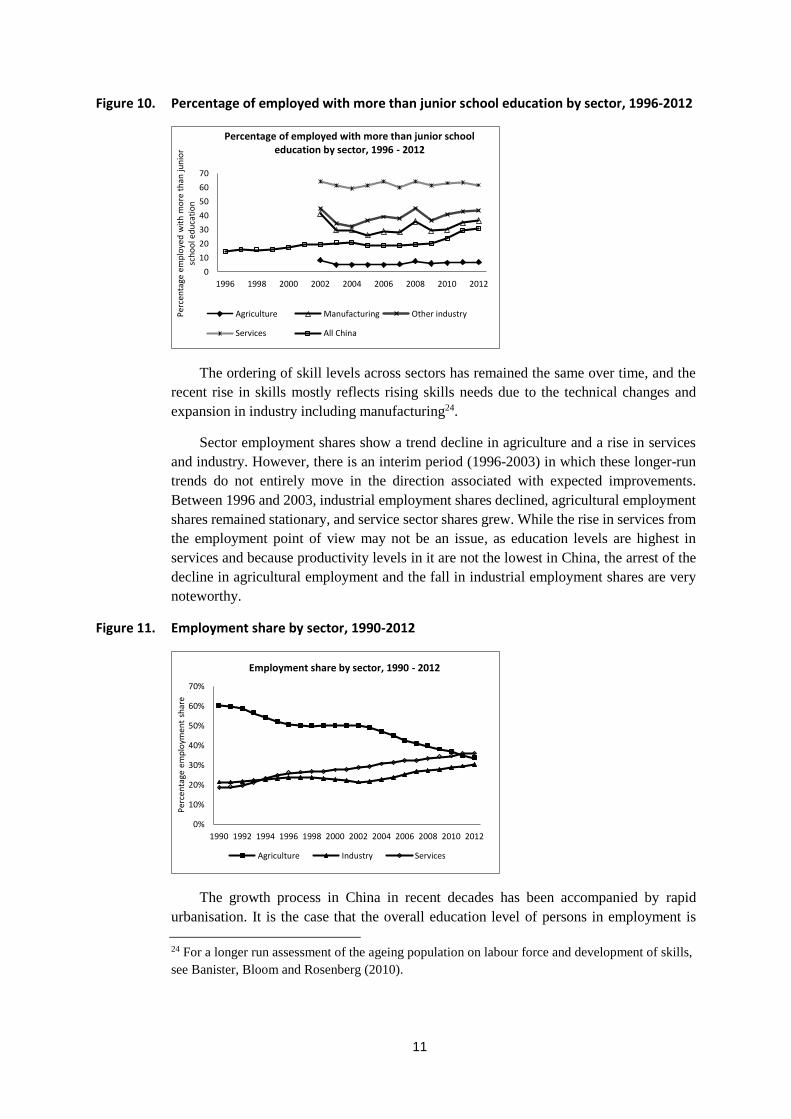
Figure 10. Percentage of employed with more than junior school education by sector, 1996-2012
..................................................................................................................................... 11
Figure 11. Employment share by sector, 1990-2012 ...................................................................... 11
Figure 12. Value added per employed person and employment population ratio (log) ................. 13
Figure 13. Employment and working age population, 1990-2011 (log) ........................................ 13

vii
Figure 14 Percentage employed with more than junior school qualifications and percentage of
employed over 45 years, 1996-2012 ........................................................................... 14
Figure 15. Total employment and labour force, 1990-2010 (in millions) ...................................... 14
Figure 16. Labour force participation rate, 1990-2010 .................................................................. 15
Figure 17. Registered and estimated unemployment in China, 1990-2010 (in millions) ............... 16
Figure 18. Percentage of unemployed persons with primary education or less and percentage
unemployed persons with more than junior school education, 2001-2012 ................. 16
Figure 19. Unemployment rate (estimated) and GDP per capita (constant 2005 US$).................. 16
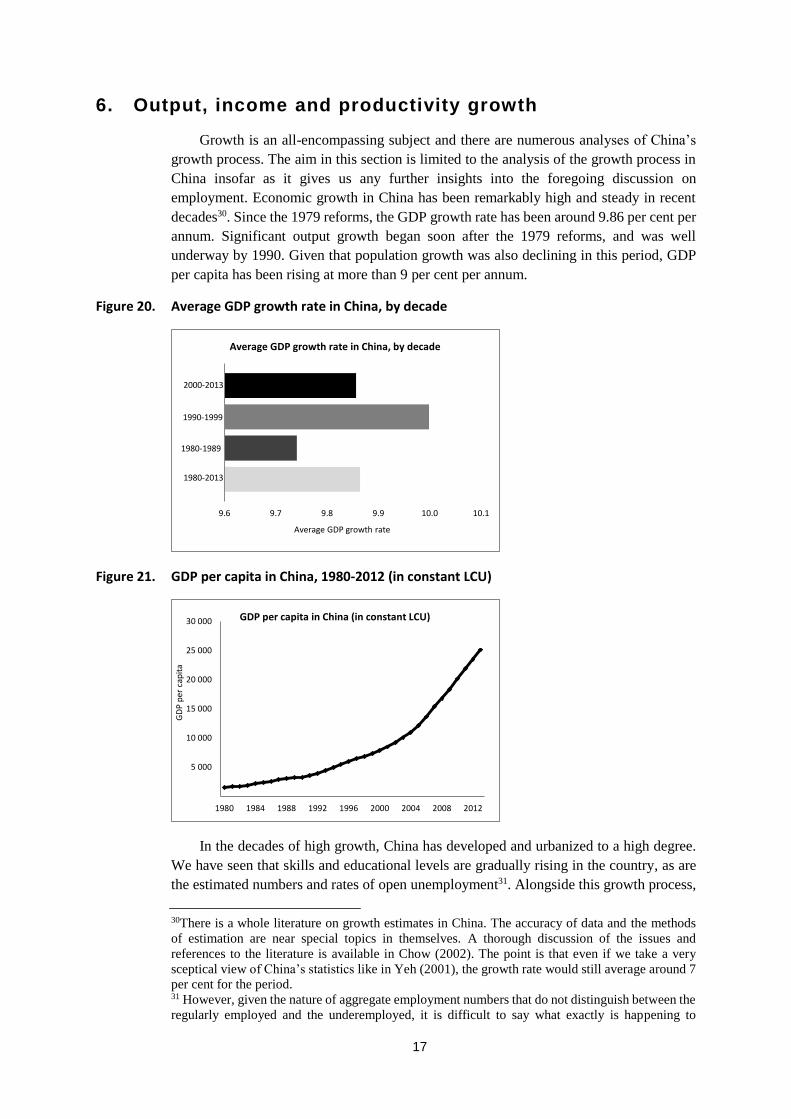
Figure 20. Average GDP growth rate in China, by decade ............................................................ 17
Figure 21. GDP per capita in China, 1980-2012 (in constant LCU) .............................................. 17
Figure 22. Real urban and rural income in China, 1978-2003 (income in 1978 constant prices) .. 18
Figure 23. Urban – rural ratio of real income, 1978-2003 ............................................................. 18
Figure 24. Labour productivity growth in China, 1990-2012 (in constant ¥ per person) ............... 19
Figure 25. Decomposition of labour productivity growth I, 1990-2012 ........................................ 21
Figure 26. Decomposition of labour productivity growth II, 1990-2012 ....................................... 21
Figure 27. Employment composition in China, 1990-2010 (in millions)....................................... 24
Figure 28. Regular employment as a percentage of total employment, 1990-2011 ....................... 25
Figure 29. Rural employment composition in China, 1990-2010 (in millions) ............................. 25
Figure 30. Agricultural productivity (productivity index, with 1990=100) and regular rural
employment as a percentage of total rural employment .............................................. 26
Figure 31. Employment in TVEs as a percentage of total rural employment and regular
employment as a percentage of total rural employment .............................................. 27
Figure 32. Regular and non-regular urban employment, 1990-2011 (in millions) ........................ 28
Figure 33. Composition of urban regular employment in China, 1990-2011 (in millions) ............ 28
Figure 34. Urban traditional formal employment as a percentage of regular employment and
registered urban unemployment .................................................................................. 29
Figure 35. Urban non-regular employment and rural-urban migrants without hukou ................... 30
Figure 36. Real wages proxy in modern and traditional sectors, 1985-2012 (in ¥) ....................... 31
Figure 37. Regular employment as a percentage of total employment and GDP per capita
(constant 2005 US$) .................................................................................................... 32
Figure 38. Regular employment and labour force growth rates, 1991-2012 .................................. 33
Figure 39. Agriculture and services productivity index (1990=100), 1990-2012 .......................... 33
Figure 40. Employment situation index (1990=100), 1990-2011 .................................................. 34
List of tables in annex
Table A1. Annual population growth rate in China, 1990-2013 .................................................. 42
Table A2. Average value added per worker in agriculture, 1990-2012 (in constant ¥) ............... 42
Table A3. Total employment in town and village enterprises, 1990-2012 (in millions) ............. 43
Table A4. Internal migration in China, 1993-2013 (in millions) ................................................. 43
Table A5. Rural-urban migrant workers in China, 1990-2013 (in millions) ................................ 44
Table A6. Value added per employed in industry (in constant US$) and employment in
traditional formal enterprises (in ten thousands), 1990-2012 ...................................... 44
Table A7. Rural employment as a percentage of total employment, 1990-2011 ......................... 45
Table A8. Percentage of employed with education above junior school level, by sector, 1996-
2012 ............................................................................................................................. 45
Table A9. Employment share by sector, 1990-2012 .................................................................... 46

viii
Table A10. Value added per employed person and employment population ratio, 1990-2011 (log)
..................................................................................................................................... 46
Table A11. Employment and working age population, 1990-2011 (log)....................................... 47
Table A12. Percentage employed with more than junior school qualifications and percentage
employed over 45 years, 1996-2012 .......................................................................... 47
Table A13. Total employment and labour force, 1990-2010 (in millions) .................................... 48
Table A14. Labour force participation rate, 1990-2010 ................................................................. 48
Table A15. Registered and estimated unemployed, 1990-2011 (in millions) ................................ 49
Table A16. Percentage of unemployed persons with primary education or less and percentage
unemployed with more than junior school education, 2001-2012 .............................. 49
Table A17. GDP per capita (constant US$) and the unemployment rate in China, 1990-2012 ..... 50
Table A18. Average GDP growth in China, by decade, 1980-2013 .............................................. 50
Table A19. Annual GDP per capita, 1980-2013 (constant LCU) .................................................. 51
Table A20. Labour productivity by sector, 1990-2012 (in constant ¥ per person) ........................ 52
Table A21. Decomposition of labour productivity growth by sector, 1990-2012 ......................... 52
Table A22. Employment composition in China, 1990-2010 (in millions) ..................................... 53
Table A23. Regular employment as a percentage of total employment, 1990-2011 ..................... 53
Table A24. Rural employment composition in China, 1990-2010 (in millions) ............................ 54
Table A25. Agricultural productivity (productivity index, with 1990=100) and regular rural
employment as a percentage of total rural employment, 1990-2011 .......................... 55
Table A26. Employment in TVEs as a percentage of total rural employment and regular
employment as a percentage of total rural employment, 1990-2011 .......................... 55
Table A27. Regular and non-regular urban employment, 1990-2011 (employed in millions) ...... 56
Table A28. Composition of urban regular employment in China, 1990-2011 (in millions). Built up
by aggregating sectors. ................................................................................................ 56
Table A29. Urban traditional formal employment as a percentage of regular employment and
registered urban unemployment rate, 1990-2012 ........................................................ 57
Table A30. Urban non-regular employment and rural-urban migrants without hukou, 1993-2011
(in millions) ................................................................................................................. 57
Table A31. Proxy for weal wages in modern and traditional sectors, 1990-2011 ......................... 58
Table A32. Regular employment and labour force growth rates, 1991-2012 ................................ 58
Table A33. Rural and urban income per capita, 1978-2003 (in 1978 constant prices) .................. 59
Table A34. Urban-rural ratio of real income, 1978-2003 .............................................................. 60
Table A35. Employment situation index (1990=100), 1990-2011 ................................................ 61
Table A36. Agriculture and services productivity index (1990=100), 1990-2012 ........................ 61
Table A37. Percentage gap of employed with more than junior school education (urban China –
all China), 2002-2012 .................................................................................................. 62
Table A38. Decomposition of labour productivity growth, 1990-2012 ......................................... 62

ix
List of abbreviations
CE Cooperative Enterprises
CO Collective-owned and Cooperative Enterprises
EF Emerging Formal Enterprises
EP Small Private Enterprises
ES Individual Businesses
HRS Household Rural Responsibility System
MOLSS Ministry of Labour and Social Security (China)
NBS National Bureau of Statistics of China
NRE Non-regular Employment
SEZs Special Economic Zones
SOEs State Owned Enterprises
TF Traditional Formal Employment
TFs Traditional Formal Enterprises
TVEs Township and Village Enterprises
UNDESA United Nations Department of Economic and Social Affairs

x
Abstract
This paper assesses the employment situation in China in terms of (a) existing macro
data related to output and labour and (b) its historical consistency with policy shifts in the
country. It discusses the problems in analysing aggregate employment in typical large
developing countries and identifies possible ways to overcome these. After an historical
overview of the employment and growth process in China from 1949 to the 1990s, the
paper examines the trends in the standard measures of employment and unemployment in
the context of growth from 1990 onwards. This is supported by an analysis of sectoral
labour productivity and its decomposition into its component sources of capital
accumulation and labour transfer respectively. The paper then uses an alternative aggregate
indicator of employment to study the trends in regular and non-regular employment and
produce a cross-validated narrative of what has really happened to “employment” in China
at the macro level since the 1990s. The paper concludes by identifying core employment
challenges for China and suggesting some policy directions for the future.
Key words: China, dual economy, economic growth, employment, employment measures
internal labour migration, labour force, productivity, structural change, wages

1
1. Introduction
In the last three and a half decades, some large countries in the developing world have
achieved and sustained high rates of output growth. China is the leader of this group of
emerging developing countries. It has had such phenomenal growth that the US $1
international poverty line which is typically used to measure extreme poverty is no longer
relevant for the country1. It is likely that the overall conditions of employment in China
ought to have improved in this period as well. Unfortunately, the relationship between
measures of growth and employment is more difficult to demonstrate than the one between
measures of growth and poverty. This is largely because of limitations of the employment
indicator itself. The main objective of this paper is to construct a credible quantitative
economy-wide assessment of the changing employment situation in China, especially since
1990. The idea is to make an assessment of the employment situation that is (a) supported
by macro data related to output and labour that exists on the Chinese economy; and (b)
that is consistent with historical information on the policy shifts that have taken place in
China2.
The paper is organised in the following way. Section 2 discusses problems associated
with the analysis of aggregate employment in typical large developing countries and
identifies possible ways to deal with these problems. Section 3 provides an historical
discussion relevant to the employment and growth process in China from the time of her
independence to the present. This overview gives the minimum necessary policy context
for the following discussion on the post-1990 period. Section 4 of the paper looks at the
standard measure of employment in China and changes in this indicator in the context of
growth from 1990 onwards. It examines trends in employment as well as some its
correlates. In Section 5, unemployment is examined, both in terms of its trends and what
the measure represents in the Chinese context. Section 6 examines sectoral labour
productivity and its decomposition into component sources of capital accumulation and
labour transfer respectively, and asks how far this takes us in explaining changes in the
employment situation. In Section 7, we look at an alternative aggregate indicator of
employment that captures regular employment. Trends in regular and non-regular
employment, their variation with other related economic indicators and relationships with
known policy shifts are analysed to produce a cross-validated narrative of what has really
happened to “employment” in China at the macro level since the 1990s. Section 8
corroborates these findings with an overview of wage based indicators. Section 9 makes
some concluding observations on the employment situation in China, identifies core
employment challenges and indicates some policy directions for the future.
1 Poverty in China has seriously declined from the time of reforms. The major decline in poverty in
China began quite early in the 1980s, with changes in the rural economy. 2 See Annex for details on the data that is used. All the figures in the paper are based on the author’s
estimates of indicators directly taken from or calculated on the basis of official Chinese databases.
The data used in the graphs is given in the Annex.

2
2. Examining the employment situation in developing countries
In typical large developing economies, the organised sector often employs a minority
proportion of workers. Within the organised part of such economies, most of the
employment is regular and full time. Most of such organised and regular employment has
returns in the form of wage income whose levels are socially acceptable in the context of
those societies. Some of this regular employment in the organised economy can also be
characterized as “formal”, where additional features pertaining to rights and collective
bargaining obtain. Such employment on average also has relatively higher productivity. In
general, such employment related attributes cannot be assumed for much of the non-
organized parts of a typical developing economy, in which a majority of the labour force
works either as self-employed or as temporary and casual labour. This is the reason why,
when looking at social transformations that accompany economic development, we are
particularly concerned with the changing structure of employment that accompanies
economic growth3. Original two sector models in development economics (Lewis, 1954),
suggest that growth driven changes will take the developing economy in a direction that
will be beneficial from the point of view of employment in the longer run. It is expected
that successful economic growth in modernizing developing economies would exhaust
labour surplus and ultimately eliminate underemployment, as employment increasingly
takes on regular waged forms and eventually becomes formal. When this happens, the
developing economy could be characterised, for analytical purposes, as a structurally
homogeneous capitalist economy as opposed to being a dual economy.
The objective of focusing on the growth-employment relationship is that we want to
know the extent to which economic growth in a country has or has not led to desirable
employment – that is, employment with the likelihood of having many, if not all, of the
aforementioned attributes of regularity, adequacy of returns, productivity and rights. This
is why the indicator used for measuring employment becomes critical (Ghose et al., 2008;
Majid, 2014). While each of the attributes that we associate with the idea of desirable
employment are in themselves subject to discussion and debate, what ought to be clear is
that the aggregate employment indicator as it is normally calculated for a typical
developing economy environment is analytically unusable because it includes not just the
regularly employed but also the severely underemployed and the working poor who must
work in very productivity activities in order to survive4. The use of employment elasticities
for policy work in developing economies is subject to cautions and warnings precisely
because of this problem. Small wonder then, that the employment elasticity measure can
only be justifiably used for analysing parts of the manufacturing sector in developing
economies. Thus, we need to have a defensible measure of employment that allows us to
take a stand on whether the employment situation in an economy as a whole has improved
3 See Sen (1975) for the first empirical cross country discussion of employment structure on existing
categories of employment. For a more recent version of this exercise, see Majid (2005). 4 This is what the employment measure captures in those developing economies that do not have a
welfare system. This is also the reason why aggregate employment elasticity measures are quite
meaningless in most developing economies. This is of course less true for the employment indicator
in developed and advanced countries. The only workers that are excluded from the measurement in
such exercises are unemployed, who while not exactly well off; are often also not the worst off
workers in the labour force. The unemployed are also in limited numbers compared to those working
in poverty in developing countries (Majid, 2014).
3
or deteriorated. In the absence of such an alternative, which is often the situation we face,
we are left with indirect strategies to assess employment situations that can be severely
misleading5.
Sectoral productivity analysis is sometimes considered an alternative way of
examining employment without changing the measure of employment. This approach
examines labour productivity over time in an economy that is split into broad economic
sectors (typically agriculture, industry and services and sub-divisions within these).
Sectoral productivity analysis assumes that employment quality improves if the share of
employment in the sector with the highest productivity growth increases over time. The
broad sectoral divisions in labour productivity analysis implicitly distinguish more and less
productive labour at the sectoral level, without changing the measure of employment.
Sectoral productivity analysis thus gives a partial picture of what is happening to
employment in an economy-wide sense. The reason for this is quite simple. Its direct
concern is not with what is happening to the overall employment situation in a country in
the growth process. Instead, the question that a decomposition analysis of labour
productivity asks concerns the contribution of labour (reallocation across sectors) and
capital accumulation to labour productivity growth.
These are two ways in which the employment situation can be assessed in a
developing economy. The first is to do nothing about the employment indicator and
proceed as if there is nothing fundamentally wrong with it. This approach leads to an
economy-wide assessment that relies on unemployment as the main indicator of labour
market distress and the employment rate as an indicator of employment, and in which
poverty is thrown in as an extra for a view on income and welfare. The main problem with
this approach is that the economy-wide analysis of employment and growth becomes
misleading because the employment rate is not an “employment” rate, and the
unemployment rate’s variation with growth as well as with poverty requires a deeper
appreciation of what the unemployment rate precisely captures in a typical developing
economy compared to an advanced one (Majid, 2014). The second way is to maintain the
employment indicator as it is, but divide the economy into broad sectors and then examine
sectoral growth and productivity in these sectors over time. The assumption that can be
made here is that more productive sectors have less underemployment or surplus labour
and therefore more of the type of employment that we wish to capture. In our view, the
sectoral labour productivity decomposition approach while critical for the analysis of
growth is only partly useful for the analysis of employment, because the causation it is
largely focussed on concerns what employment does for growth and not vice versa. The
third approach is to generate an alternative indicator of employment that is likely to capture
employment of a regular kind, and examine the employment situation using that indicator
at the economy-wide level.
5 Often the unemployment rate, the poverty rate, the employment rate are used together to make
such an aggregate economy-wide assessment, without appreciation of how these indicators stand in
relation to each other. As has been demonstrated in our earlier work, this is an inappropriate
employment assessment strategy for a typical large developing economy.

4
3. The historical context of employment and growth in China
While it is simplistic to describe the monumental changes that have occurred over
past decades in the Chinese economy in a few paragraphs, it is still important to sketch the
broad outlines of this history to set the economic context of the post-1990 period. The
People’s Republic of China was founded in 1949. The first decade of Chinese
independence is effectively that of the 1950s. Central economic planning began in this
period (from 1953) with the objective of developing a heavy industrial base in parts of
urban China and maintaining an agricultural sector able to feed modern industrial China
by providing consumption goods at low prices. This was the received wisdom of planning
in a socialist setting at the time6. Planned industrialization and maintaining agriculture
related populations within rural China, was the broad strategy of development in the first
decade7. It was therefore necessary that the movement of labour across China was
governed by rules on migration. A residence permit system (the hukou system) eventually
evolved on this premise. Those living in rural China obtained rural residence permits and
those born in urban China were given urban permits. Even temporary movements were
subject to permissions from both points of departure and arrival. Movement of labour in
China was probably just short of an internal visa system. In short, in the early days, not
only was the production of output planned, but by the end of the first decade so was the
movement of labour.
Attempts to transform agriculture in the very initial period involved the promulgation
of the Agrarian Reform Law passed in 1950. This law essentially redistributed land from
large landlords to millions of landless peasants. However, only a couple of years later, in
1952, the collectivization process began (Lin, 1990). In hindsight, it can be said that the
initial redistribution of land from large landowners to poor peasants in 1950 politically
eased the collectivization that was to follow in 1952. There was a serious incentive problem
associated with this change, although the Chinese authorities perhaps believed that
working for objectives that were collective and national would subsume private incentives
to gain embedded in the idea of land ownership. Collectivization to some extent undid the
redistribution of land associated with the Agrarian Reform Law of 1950; and
independently damaged incentive structures that may well have adversely affected
agricultural output8.
The crisis in economic development in China in the first decade was in considerable
part a consequence of collectivization9, although there are other reasons for it as well. The
hukou registration law, which was given a legal form in 1958 (Chan and Zhang, 1999;
6 Economic planning introduced in China was modelled on the Soviet planning system. The first
Chinese Five-Year Plan was for 1953-7. 7 There were no attempts at evolving a population control policy in this period, and early ideas on
population- due to Mao Zedong, were in fact against any birth control at all. 8 A convincing case for separating the famine from the agricultural crisis is made by Lin and Yang
(1998). Their argument about urban bias in food supply and distribution is an important one for
understanding the mechanics of the famine. 9 While estimates of the number of deaths in the great Chinese famine vary, we estimate from
Chinese data that within a matter of three years, from 1958- 1961, rural employment numbers
declined by 10.46 million. For a larger and detailed view on the famine, see Dikötter (2010). Meng,
Qian and Yared (2010) focus on the institutional failure of the State to respond to the crisis. Also
see Lin (1990) and Lin and Yang (1998).

5
Chen, 1998; Cheng and Selden, 1994), effectively acted as an instrument for restricting the
movement of the rural workers. In effect, an urban bias in the distribution and supply of
food grains was reinforced by the hukou system. In addition, China pursued a quixotic
rural industrialization policy towards the end of the 1950s (Sigurdson, 1977). This included
large scale experiments with steel production based on small backyard wood-fed
furnaces10. Collectivization, the increasing control on labour mobility; and rural
industrialization all came under the umbrella of the Great Leap Forward. It is well known
that this leap ended in a catastrophic fall, and the largest famine known to modern history
came to pass. It is still not clear how many perished, but the figure is definitely above
millions. It is quite possible that the active restrictions on mobility of labour may have
contributed to trapping labour in rural areas at the time of the famine but this is an historical
counterfactual that is difficult to answer. The hukou system, which was conceived as an
instrument of manpower planning may have contributed to increasing the fatalities of the
great famine. But this was not officially understood as such; rather, the problem was
identified more as one of high incidence of rural population11.
Following the 1961 famine, the rest of the 1960s was marked by the Chinese
government’s Agriculture First Policy. Increased agricultural inputs, as well as tube well
irrigation improved the food supply12. While there was a policy stance on controlling
population, population growth in fact peaked in China during the decade of the 1960s,
especially in the aftermath of the famine. This was expected as a response to the fatalities
of the famine. People wanted bigger families. It was despite of the growth in population
and continued restriction on physical movement that there was some recovery in
agricultural productivity, although agricultural productivity really takes off in China in the
post-reform period of the 1980s. As a result of high population growth in the 1960s,
country-wide birth control campaigns began in earnest in the 1970s, with the famous
recommended family sizes for rural and urban China formulated under the aegis of the
Chinese State Council13. This ultimately led to the stricter one child family planning
programme of 1979. The restrictions on the movement of labour remained intact in the
1970s and went well in to the 1980s. These were initially relaxed, first with respect to
rural-rural migration; then in the context of rural-urban migration to selected urban areas,
and finally, from the 1990s, more generally.
10 Apart from leading to a growth disaster in agriculture, it also brought massive deforestation in
the country. 11 The idea that famine was also caused by neglect because of mass rural migration to urban areas
may be true but begs the question. People may have started to move because there was an urban
bias in food distribution. The evidence on labour movement in this period is limited, but the larger
point is that disincentives and collectivization were the more obvious reasons. 12 See Zhang (2011) for an evidence based discussion on the subject. 13 See Greenhalgh and Winckler (2005) for a detailed discussion on the population policy and
governance of China’s great economic transformation. After 1979, when one child policy became
law in China, extreme practices of population control like forced sterilization- that had become
common practice in India only a few years earlier in 1976 during the Emergency- were perceptibly
less in China (Scott, 2014). Nevertheless there were punishments associated with violation as there
were incentives associated with adherence. In many ways the Chinese population control policy
was less authoritarian that the Indian one that preceded it by a couple of years.

6
Figure 1. Annual population growth rate in China, 1961-2013
Figure 2. Value added per worker in agriculture, 1960-2013
China’s economy began opening to the rest of the world after the death of Mao
Zedong in 1976. We see evidence of this in the modernization programme under Deng
Xiaoping in the late 1970s14. The critical moment in agrarian China came with the effective
reversal of collective agriculture through the Household Rural Responsibility System
(HRS) in 1984 (Lin, 1987; Lin, 1988)15. From the early 1980s, agricultural growth picked
up in China16. The reason for this is that part of the surplus labour in agriculture began to
flow not only to other rural activities in the township and village enterprises (TVEs), but
also towards employment in urban areas. In other words, the statutes that were promulgated
in 1958 on Regulations of Hukou Registration began to get selectively and slowly relaxed
from the 1980s.
The policy principle behind the HRS was general and not just focused on agriculture,
although it began with the agrarian economy. Essentially, the idea was to inject incentives
in order to enhance productivity through giving workers responsible for the production of
output, a stake in the profits and losses of an enterprise. Farmers who previously received
14 Technically speaking the four modernizations was a strategy that originated with Zhou Enlai in
1975, while Mao was still alive. 15 Also see Ghose (2005) for estimates of the size of the responsibility system. 16 See Lin (1992) on reforms and growth. For a comprehensive discussion of post-reform
agricultural policy and the important insights in to policy making, see Ash (1988).
-1.5%
-1.0%
-0.5%
0.0%
0.5%
1.0%
1.5%
2.0%
2.5%
3.0%
3.5%
1960 1965 1970 1975 1980 1985 1990 1995 2000 2005 2010
Po
pu
lati
on
gro
wth
rat
e
Annual population growth rate in China, 1961 - 2013
2 000
4 000
6 000
8 000
10 000
12 000
1960 1965 1970 1975 1980 1985 1990 1995 2000 2005 2010
Val
ue
add
ed p
er w
ork
er, i
n c
on
stn
at ¥
Value added per worker in agriculture 1960 - 2013, in constant ¥

7
output quota targets, were given lower quotas and rewarded directly for producing output
above and beyond targets, which they sold in what was effectively an open market. This
HRS system, which was in certain respects also a partial de-collectivization programme,
allowed farmers to use their household labour in other non-agricultural activities. This
necessitated some relaxation in the enforcement of the hukou system, as even rural to rural
movement was previously subject to some control. Thus, the 1979 reforms began with
altering agricultural production organization by reintroducing private enterprise, which in
turn led to increased agricultural productivity. To complement this, the successful advent
of the Township and Village Enterprises (TVEs) also absorbed significant rural surplus
labour that was released through the HRS17. The establishment of the HRS freed surplus
labour in agriculture. Some was absorbed in TVEs and some became rural-urban migrant
labour. This system also improved the incentive structure in team based production
organization.
Figure 3. Employment in township and village enterprises, 1978-2011 (in millions)
It was in the mid-1980s that the transformation of the modern sectors of the Chinese
economy began. As early as 1980, special economic zones (SEZs) were set up in Shenzhen,
Zhuhai, Shantou and Xiamen, and by 1984 (Zeng, 2011), 14 major coastal cities were
opened up to foreign investment18. Not only did the SEZs require labour for production,
but more importantly, the new target cities needed construction and services. It was also
because of the SEZs that residency rules affecting rural-urban migration began to be
relaxed in China. This was viable because freer movement of labour had in principle
already become possible with the HRS; and rural-rural migration was in turn more
permissible because of the TVEs. The social and economic choice to migrate for Chinese
farmers became a feasible option in this period19. For the State, the easing of control of the
migrant flows has been a key instrument in affecting the desired steps in this
transformation. We have evidence from 1993 to 2003 suggesting that differentials in
potential earnings in urban and rural areas were positively related to migrant flows.
17 See Zou (2003); Chen (1998). 18 While the objective of SEZs was not to provide employment, but technology transfer and to attract
foreign investment, the SEZ did provide a structured basis upon which the labour market and rules
governing labour movement could change. See Liang (1999) for a case study (Shenzhen)
perspective on the core objectives of SEZs. 19 See Knight and Song (2003); Zhang and Song (2003); and Zhao (1999).
0
20
40
60
80
100
120
140
160
180
1978 1982 1986 1990 1994 1998 2002 2006 2010
Emp
loym
en i
n T
VEs
, in
mill
ion
s
Employment in township and village enterprises (in millions)

8
Figure 4. Migration and income differentials in China
Note: The regression equation is y = 194.13x2 - 174.86x + 41.243, R² = 0.6198, N = 11. Source: Real income
figures derived from Heilig, et al. (2005). Migration figures based on NBS (2013). Report on Monitoring and
Survey of Migrant Rural Workers in China as well as data in Chan (2013).
While the 1990s saw considerable increase in this migration, it was still not fully
open20. However, the rules governing the hukou system were being eased in practice21. By
the early 2000s, the migrant population in China had become very large indeed. Only the
long-run rural-urban migrants were more than 166 million. Today, the total migrant
population is likely to be over 300 million.
Figure 5. Internal migration in China, 1993-2013 (in millions)
20 Even until the mid-1990s there was tension in the way some city governments looked at migrants
on the one hand, and central driven view encouraging relaxation of constraints on the physical
movement of labour 21 It is our view that this relaxation of rules on movement of labour needs to be seen as a broader
instrument used by the State for sequencing the transition in China. When this dimension is not
taken into account it is possible to look at restrictions on movement of labour simply as output
restricting.
0.00
0.50
1.00
1.50
2.00
2.50
3.00
0.43 0.44 0.45 0.46 0.47 0.48 0.49 0.5 0.51
Urb
an-r
ura
l ra
tio
of
real
inco
me
Rural-urban migrants as a share of urban employment
Migration and income differentials
0
50
100
150
200
250
300
350
1993 1995 1997 1999 2001 2003 2005 2007 2009 2011 2013
Mig
ran
ts,
in m
illio
ns
Internal migration in China (in millions), 1993 - 2013
All long term rural urban migrants, hukou and non-hukou
All floating migrants
All migrants

9
Figure 6. Rural-urban migrant workers in China, 1990-2013 (in millions)
The economic transformation that took place in the first half of the 1990s in China
importantly involved industry and growth in the modern sectors of the economy22. Industry
was restructured and the closure of state enterprises came into force and harder market
reforms were implemented. The figure below shows how, as industrial productivity rose,
employment in large scale state-owned enterprise fell.
Figure 7 Value added per employed in industry (in constant US$) and employment in traditional
formal enterprises (in ten thousands), 1990-2012
Since the 1990s, changes in the Chinese economy have been clearly visible in the
urbanisation process. The employment data in China is divisible between rural and urban
estimates, and this sub-division of the employment measure carries some useful albeit
general information. What it does confirm is that there has been a large movement of
labour across the two classifications in recent decades. Rural employment was just above
half of all China employment in 2011 and is probably no longer in the majority today23.
This is also entirely consistent with the trends in migration patterns that we observed
earlier.
22 See Faint (2005); Garnaut, Song and Yao (2006); Hassard, Morris, Sheehan and Yuxin (2010);
Zu (2009). 23 The pattern of urbanisation is very important in explaining the spread of the labour force and the
evolution of small to medium sized cities in a large country like China. See Schneider and Mertes
(2014).
0
40
80
120
160
200
1990 1992 1994 1996 1998 2000 2002 2004 2006 2008 2010 2012
Mig
ran
t w
ork
ers,
in m
illio
ns
Rural-urban migrant workers in China, 1990 - 2013
Long term rural-urban migrant workers (non hukou)
Long term rural-urban migrant workers (with hukou)
All long term rural-urban migrants, hukou and non-hukou
2 000
4 000
6 000
8 000
10 000
12 000
14 000
16 000
10 000
20 000
30 000
40 000
50 000
60 000
70 000
80 000
1960 1965 1970 1975 1980 1985 1990 1995 2000 2005 2010
Emp
loye
d (
in t
en t
ho
usa
nd
s)
Val
ue
add
ed p
er w
ork
er, i
n c
on
stan
t U
S$
Value added per employed person in industry (left axis)
Employment in traditional formal enterprises (right axis)

10
Figure 8. Rural employment as a percentage of total employment, 1990-2011
This process of change has also been accompanied by a changing skill profile of the
rural and urban workforce. Although education estimates are not available for rural
employment separately, these are available at the all China and the urban China level. We
calculate the percentage of employment with qualifications above the junior school level
for all China and for urban China respectively. The difference between the two percentages
is taken as a proxy for the relative skills of the rural employed. Data for this measure is
only computable from the early 2000s. It would appear that this gap may have been falling
gradually on trend since 2000. It fell in the early 2000s, stabilised from the mid-2000s, and
may be rising now.
Figure 9. Percentage gap of employed with more than junior school education (urban China-all
China), 2002-2012
Note: The equation is y = 0.1952x2 - 784.15x + 787443, R² = 0.7366, N = 11
40
45
50
55
60
65
70
75
80
1990 1992 1994 1996 1998 2000 2002 2004 2006 2008 2010
Ru
ral e
mp
loym
ent
as a
% o
f to
tal
Rural employment as a % of total employment, 1990 - 2011
10
12
14
16
18
20
22
24
26
28
2002 2004 2006 2008 2010 2012Per
cen
tage
gap
of
emp
loye
d w
ith
mo
re t
han
ju
nio
r sc
ho
ol e
du
cati
on
Percentage gap of employed with more than junior school education (urban China - all China), 2002 - 2012
11
Figure 10. Percentage of employed with more than junior school education by sector, 1996-2012
The ordering of skill levels across sectors has remained the same over time, and the
recent rise in skills mostly reflects rising skills needs due to the technical changes and
expansion in industry including manufacturing24.
Sector employment shares show a trend decline in agriculture and a rise in services
and industry. However, there is an interim period (1996-2003) in which these longer-run
trends do not entirely move in the direction associated with expected improvements.
Between 1996 and 2003, industrial employment shares declined, agricultural employment
shares remained stationary, and service sector shares grew. While the rise in services from
the employment point of view may not be an issue, as education levels are highest in
services and because productivity levels in it are not the lowest in China, the arrest of the
decline in agricultural employment and the fall in industrial employment shares are very
noteworthy.
Figure 11. Employment share by sector, 1990-2012
The growth process in China in recent decades has been accompanied by rapid
urbanisation. It is the case that the overall education level of persons in employment is
24 For a longer run assessment of the ageing population on labour force and development of skills,
see Banister, Bloom and Rosenberg (2010).
0
10
20
30
40
50
60
70
1996 1998 2000 2002 2004 2006 2008 2010 2012
Per
cen
tage
em
plo
yed
wit
h m
ore
th
an ju
nio
r sc
ho
ol e
du
cati
on
Percentage of employed with more than junior school education by sector, 1996 - 2012
Agriculture Manufacturing Other industry
Services All China
0%
10%
20%
30%
40%
50%
60%
70%
1990 1992 1994 1996 1998 2000 2002 2004 2006 2008 2010 2012
Per
cen
tage
em
plo
ymen
t sh
are
Employment share by sector, 1990 - 2012
Agriculture Industry Services

12
increasing, but it is also true that a considerable rural-urban skills gap is likely to still exist.
While this gap was narrowing earlier, this may not be narrowing anymore. Sectoral
employment shares also show trend declines in agriculture and rises in industry except for
an interim period in which there are signs of possible employment problems. Even though
this turbulence may be over now, and we are back on the desired trend, it is important to
unravel this phase in Chinese employment history in an empirically grounded manner, as
it will give us insights in to how the employment transformation has come about in China.
The great employment transformation in China has had three prominent sequenced
policy drivers:
The restructuring of agricultural production organization that came into being through
the introduction of the HRS in the early 1980s.
The rural industrialization initiative that produced the expansion in TVEs in the
1980s, was second.
The transformation of the modern sectors of the economy came third:
o Initially with SEZs based external opening up in the 1980s;
o And subsequently, with state enterprise industrial restructuring in the 1990s.
These sequenced initiatives required changing the enforcement of rules governing
internal labour migration. Post-reform China first effectively decollectivized agriculture,
then embarked upon rural industrialization via the expansion of TVEs. Subsequently, the
government opened the economy to external investment and manufacturing and finally
embarked upon domestic industrial restructuring. This process required a complex and
calibrated process of guided institutional change involving decentralization and
fundamental changes in the enterprise culture25. The purposive and timed relaxation of the
rules governing the movement of labour was absolutely critical in this sequence. These
shifts in the Chinese economy ought to be reflected in changes in employment structure if
one were able to capture employment meaningfully at an aggregate level. The aim of the
following sections is to demonstrate how the overall employment situation changed during
this Great Chinese transformation, with a special focus on the period after 1990.
4. The measure of employment and its relationship to population and output
The employment indicator has a number of limitations. This is something that was
discussed earlier, but we illustrate this point in the Chinese context briefly. The figures
below show two things about employment. First, that value added per employed person,
which is an output proxy, is unrelated to the share of employed persons in the population.
Second, that employment as it is calculated and working age population are directly and
positively related to each other. In other words, at the most general level, if the measure of
employment is taken at face value, employment and population are very likely to be closely
25 For an excellent and clear discussion of how this institutional transformation was guided by the
State that not only maximised growth but carried over China’s accumulated social capital in the
first two decades of the reform. See Husain, Stern and Stiglitz (2000).

13
related, and output and employment unlikely to be so. The deficiency of capture in the
employment indicator is a subject that has been addressed elsewhere (Ghose et al., 2008;
Majid, 2001; Majid, 2014).
Figure 12. Value added per employed person and employment population ratio (log)
Note: The regression equation is y = 58.597x - 227.27, R² = 0.1823, N = 22.
Figure 13. Employment and working age population, 1990-2011 (log)
Note: The regression equation is y = 0.5437x + 2.8344 with R² = 0.9738, N = 22. The coefficient is statistically
significant at the 1 per cent level.
It is however still worth examining some attributes of persons who are generally and
so broadly classified as employed. We first focus on the period after 1990 with regards to
education and skills. Since 1990, the age structure amongst the employed and their
education profile has changed (Banister et al., 2010). Earlier we saw that population
growth had been declining. There is considerable discussion in the literature on the end of
the demographic dividend in China26. A critical observation in this regard is that while the
share of older workers in total employment is rising, this older workforce is also more
qualified.
In the two decades under review (1990-2011), the Chinese population (above 16)
increased by 1.5 per cent, while the Chinese labour force did so at 0.87 per cent per annum.
26 For example, see Golley and Tyers (2012).
6
6.5
7
7.5
8
8.5
9
9.5
10
10.5
11
4.03 4.04 4.04 4.05 4.05
Log
of
valu
e ad
ded
per
em
plo
yed
per
son
Log of employment to population
Value added per employed person and employment population ratio (log)
6.45
6.5
6.55
6.6
6.65
6.7
6.7 6.75 6.8 6.85 6.9 6.95 7 7.05
Emp
loym
ent
(lo
g)
Working age population (log)
Employment and working age population, 1990 - 2011

14
The participation rates of the labour force are falling27, and the gap between employment
and total labour force has widened on trend. The latter can be reflective of rising open
unemployment.
Figure 14 Percentage employed with more than junior school qualifications and percentage of
employed over 45 years, 1996-2012
Figure 15. Total employment and labour force, 1990-2010 (in millions)
27 There is no evidence to suggest that there is a gender based explanation to the falling participation
rates.
0
5
10
15
20
25
30
35
40
45
1996 1998 2000 2002 2004 2006 2008 2010 2012
Per
cen
tage
em
plo
yed
Percentage employed with more than junior school qualifications and percentage employed over 45 years
Employed with more than junior school qualifications
Employed over 45 years
500
550
600
650
700
750
800
850
1990 1992 1994 1996 1998 2000 2002 2004 2006 2008 2010
Tota
l em
plo
ymen
t an
d la
bo
ur
forc
e, in
m
illio
ns
Total employment and labour force (in millions), 1990 - 2010
Total employment Labour force

15
Figure 16. Labour force participation rate, 1990-2010
5. The unemployed in China: Trends and attributes
China does not collect unemployment figures through surveys28. All it has is a
registration system of unemployed persons where the onus of registration is on the
unemployed person. We can, however, estimate the unemployed by using labour force and
total employment figures. This figure would include the unemployed who are registered
as well as those who are not. Unemployment rose from 5.7 million in 1990 to 21.6 million
in 2011. The registered unemployed were a majority of all unemployed in 1990 (66 per
cent), in 2011 they became a minority (43 per cent). The estimated unemployment rate
also shows a rising trend with a spike during 1996-2001. This period overlaps with the
period in which we found sectoral employment shares to be moving in a direction that
suggested turbulence (1995 to 2003). One can say that not only is estimated unemployment
(and the unemployment rate) rising in China, but the composition of the unemployed is
moving in favour of the unregistered. It is also the case that the unemployment rate is
significantly and positively associated with GDP per capita growth29. If we examine the
educational composition of the unemployed in urban China, it is quite clear that the shares
of the educated unemployed (senior school and above) in urban unemployment are high
and that their share in total unemployment is also rising over time. In short, open
unemployment has been increasing systematically with output growth in China and these
unemployed are increasingly more educated.
28 See Wang and Sun (2014); Giles, Park and Zhang (2005). For earnings and re-employment data
of the registered unemployed see Knight and Li (2006). 29 This may be indicative of the fact that China has increasing open unemployment (and declining
underemployment). For a discussion of the rationale behind the positive association between
unemployment and growth, see Majid (2014).
64%
66%
68%
70%
72%
74%
76%
78%
80%
1990 1992 1994 1996 1998 2000 2002 2004 2006 2008 2010
Lab
ou
r fo
rce
par
tici
pat
ion
rat
e
Labour force participation rate, 1990 - 2010

16
Figure 17. Registered and estimated unemployment in China, 1990-2010 (in millions)
Figure 18. Percentage of unemployed persons with primary education or less and percentage
unemployed persons with more than junior school education, 2001-2012
Figure 19. Unemployment rate (estimated) and GDP per capita (constant 2005 US$)
Note: The regression equation is y = 0.0006x + 0.816; R² = 0.6731, N = 23. The coefficient is statistically
significant at the 1 per cent level.
0
5
10
15
20
25
1990 1992 1994 1996 1998 2000 2002 2004 2006 2008 2010
Nu
mb
er o
f u
nem
plo
yed
(in
mill
ion
s)
Registered and estimated unemployment in China (in millions), 1990 - 2010
Registered unemployment Estimated unemployment
0.0
10.0
20.0
30.0
40.0
50.0
60.0
2000 2002 2004 2006 2008 2010 2012 2014
educated unemployed as a share total urban unemployed
low qualification unemployed as a share of urbanunemployed
0.00
0.50
1.00
1.50
2.00
2.50
3.00
3.50
0 1000 2000 3000 4000
Un
emp
loym
ent
rate
GDP per capita (constant 2005 US$)
Unemployment rate (estimated) and GDP per capita
17
6. Output, income and productivity growth
Growth is an all-encompassing subject and there are numerous analyses of China’s
growth process. The aim in this section is limited to the analysis of the growth process in
China insofar as it gives us any further insights into the foregoing discussion on
employment. Economic growth in China has been remarkably high and steady in recent
decades30. Since the 1979 reforms, the GDP growth rate has been around 9.86 per cent per
annum. Significant output growth began soon after the 1979 reforms, and was well
underway by 1990. Given that population growth was also declining in this period, GDP
per capita has been rising at more than 9 per cent per annum.
Figure 20. Average GDP growth rate in China, by decade
Figure 21. GDP per capita in China, 1980-2012 (in constant LCU)
In the decades of high growth, China has developed and urbanized to a high degree.
We have seen that skills and educational levels are gradually rising in the country, as are
the estimated numbers and rates of open unemployment31. Alongside this growth process,
30There is a whole literature on growth estimates in China. The accuracy of data and the methods
of estimation are near special topics in themselves. A thorough discussion of the issues and
references to the literature is available in Chow (2002). The point is that even if we take a very
sceptical view of China’s statistics like in Yeh (2001), the growth rate would still average around 7
per cent for the period. 31 However, given the nature of aggregate employment numbers that do not distinguish between the
regularly employed and the underemployed, it is difficult to say what exactly is happening to
1980-2013
1980-1989
1990-1999
2000-2013
9.6 9.7 9.8 9.9 10.0 10.1
Average GDP growth rate
Average GDP growth rate in China, by decade
5 000
10 000
15 000
20 000
25 000
30 000
1980 1984 1988 1992 1996 2000 2004 2008 2012
GD
P p
er c
apit
a
GDP per capita in China (in constant LCU)

18
it is worth highlighting two simple indicators of income. Both urban and rural income grew
in China since the reforms. Trends in real rural and urban income suggest that it was in the
early post-reform period from 1979 to the mid-1980s that agricultural incomes grew
rapidly. This is also when the incidence poverty declined significantly32. The second point
to note is that during the first phase of agrarian transformation and rural industrialization,
the income gap between rural and urban China was not rising. It is after 1990, and
particularly after 1996 (and up to 2002, the end date of estimates), that the income gap
between rural and urban China began to grow33.
Figure 22. Real urban and rural income in China, 1978-2003 (income in 1978 constant prices)
Figure 23. Urban – rural ratio of real income, 1978-2003
Note: Ratio of income is based on NBS average consumption data at constant prices.
While productivity is an important subject of analysis on its own, labour productivity
analyses are often carried out not only to take a sectoral view of output but also to shed
desirable employment or quality employment in China. By virtue of this problem, the
unemployment numbers themselves do not give an economy-wide view of the adversity in the
labour force or the extent of unemployment throughout the economy. There are, however, clear
signs of an increasing open unemployment problem in China. 32 Ravallion and Chen (2004) show that between 1980 and 1985 the biggest decline in poverty
occurred. 33 Income inequality has of course risen in China during the entire period. See Xie and Zhou (2014).
200
400
600
800
1 000
1 200
1 400
1 600
1 800
2 000
1978 1981 1984 1987 1990 1993 1996 1999 2002
Inco
me,
in 1
97
8 c
on
stan
t p
rice
s
Real urban and rural income in China, 1978 - 2003
Rural income per capita Urban income per capita
0
0.5
1
1.5
2
2.5
3
3.5
4
4.5
Urb
an-r
ura
l rat
io o
f re
al in
com
e
Urban-rural ratio of real income

19
light on employment. The categories that are examined here are employment shares and
(real) labour productivity in each of the three broad sectoral classifications: agriculture,
industry and services34. As suggested above, the levels of sectoral productivity in
comparison to the national average, and relative to each other, can be seen as indicative of
the existence of surplus labour (in economies where surplus labour is independently known
to exist)35. The measure or indicator of employment in such exercises remains unaltered.
Figure 24. Labour productivity growth in China, 1990-2012 (in constant ¥ per person)
We find that productivity in each sectoral division, including agriculture, has been
rising on trend in the long-run. As noted above, the ordering of sectors in terms of
productivity levels have remained the same in China since 1993, with industry leading and
services and agriculture respectively following until 201236. The gaps between industrial
productivity and services productivity have been rising; as is the case for an industry-
agriculture comparison. It is quite clear that productivity growth in China since the 1990s
has been led by industry37. By and large, during the period under review, economic growth
has been associated with discernibly rising productivity levels in industry and services.
Agricultural productivity growth exists, but its level is low and its growth weaker in
comparison to services and industry in recent decades.
34 For primary, secondary and tertiary definitions we have a full series from 1980 to 2012. Sub-
sectoral classifications for all China discontinue after 2001. We have all China estimates before
2001, but after 2001 we have urban units’ estimates only. 35 This qualifier is important because even in economies without surplus labour there will be
differences in productivities across sectors. But once we assume that surplus labour exists, then if a
sector’s productivity is below the national average, it is likely to have a proportionately higher
percentage of surplus labour in total employment within the sector. Thus, for the sector that has
below (national) average productivity, the share of employment (as it is normally calculated) in that
sector is something that one needs to automatically focus on. In China’s case, like many developing
countries, this sector is agriculture. 36 It is worth bearing in mind that while industrial productivity is often above the productivity
average and agriculture below, the case of services can and does go either way in many countries.
In many countries service sector productivity is lower than the national average, in some it is higher.
In China it was on a par with industry before 1993 and has been higher than the average as well as
agriculture for the period under review. For discussions on sectoral productivity growth in China,
see Nabar and Yan (2013); Hussin and Yik (2012). For a comparison to India see Bosworth and
Collins (2008). For an assessment of growth and total factor productivity in China see Zhang, Jiang
and Wang (2014). 37 In fact the output and employment growth was largely driven by manufacturing exports in China
between 1984 and 1995. See Ghose (2003).
10 000
20 000
30 000
40 000
50 000
60 000
70 000
80 000
90 000
1990 1992 1994 1996 1998 2000 2002 2004 2006 2008 2010 2012
Pro
du
ctiv
ity
gro
wth
, in
co
nst
ant
¥ p
er
per
son
Labour productivity growth in China (in constant ¥ per person)
Agriculture Industry Services All Sectors

20
Do the drivers of change in labour productivity shed some further light on the pattern
of changing employment shares that we observed in the previous section? The standard
way to examine the sources of productivity change with employment and output data, at a
sectoral level, is by growth accounting. A growth accounting framework essentially takes
a measure of employment that includes all types of employment within a sector as given.
The exercise can be done for any number of additive sectoral divisions of an economy. On
a three sector level, it divides all employment into a sectoral space for growth episodes.
The idea is to decompose changes in aggregate labour productivity into two separable
components38. One component of productivity change is capital accumulation (and
technology) calculated for a given employment share. It is sometimes called the within
component, we call it the capital accumulation component of productivity growth. The
second component is that part of sectoral productivity growth that takes place through the
mobility and transfer of labour across sectors (i.e. from a low productivity sector to a
higher productivity sector) given productivity. We refer to this component as the labour
transfer component39.
We find that the capital accumulation makes the dominant positive contribution to
growth in aggregate labour productivity in China over 1990-2012, while labour transfer
across sectors has made a lower, but still positive, contribution to changes in productivity.
It is worth noting the positive sign of the labour transfer component throughout the two
decade period as well as its sub periods. Therefore, it can be said that the labour transfer
(or across sectors) component has at least always contributed positively to aggregate
productivity in both decades in China, although it has done so to a lesser degree than capital
accumulation.
38 For the method, see McMillan and Rodrik (2011). 39 Symbolically decomposition can be expressed:
∆𝑃𝑡 = ∑ 𝜃𝑖,𝑡−𝑘
𝑛
𝑖=1
∆𝑝𝑖,𝑡 + ∑ 𝑝𝑖,𝑡∆
𝑛
𝑖=1
𝜃𝑖,𝑡
where Pt and pi,t represents aggregate and sectoral labour productivity levels at year t, respectively,
and θi,t represents the share of employment in sector i. The ∆ operator captures the changes in
productivity or the changes in the shares of employment. The first term in the decomposition is the
weighted sum of productivity growth within each individual sector, where the weights are the
employment share of each of the sectors from the beginning of the time period. This is supposed to
capture the contribution of productivity growth within sectors (through accumulation of capital and
thus investment) to aggregate productivity growth. The second term in the decomposition represents
the contribution of labour reallocation and labour transfers across sectors to changes in aggregate
labour productivity.

21
Figure 25. Decomposition of labour productivity growth I, 1990-2012
Note: Value added in the decomposition is in real terms taken in constant Yuan.
It is worth recalling the observation we made earlier that sectoral employment shares
in China have been moving the right direction on trend, except for the 1995-2003 period,
when the shares of industrial employment actually declined and that of agricultural
employment remained nearly stationary. We suggested that this was a period worth re-
examining as a period of employment problems. By repartitioning the data in order to
separate the 1996-2003 period, we can see this result again.
Figure 26. Decomposition of labour productivity growth II, 1990-2012
The results are not very different. In the first period, the contribution of labour transfer
to productivity growth is most significant. In the next two periods, it becomes
progressively smaller. It nevertheless remains significant throughout. The examination of
the components of productivity growth in a periodisation that is supposed to capture a
problem period (1996-2003) gives no further insight other than perhaps the fact this was
also a relatively lower growth period (average annual growth of productivity was 7.5 per
cent).
Thus, in the period in which we detected ostensible signs of an employment problem
on the basis of trends in sectoral employment shares, we find that productivity growth,
although comparatively lower than in other periods, was still high; capital accumulation
still led the growth process; and labour transfer continued to make a significant and
0 2 4 6 8 10 12
1990-2012
1990-2000
2001-2012
Total Labour transfer component Capital accumulation component
Decomposition of labour productivity growth I, 1990-2012
0 2 4 6 8 10 12
1990-2012
1990-1995
1996-2002
2003-2012
Total Labour transfer component Capital accumulation component
Decomposition of labour productivity growth II, 1990-2012

22
positive contribution to productivity growth. In other words, one can say that if there was
an employment problem in the sub-period 1996-2003, it was not caused by a crisis in
output and productivity. So what was the nature of this employment problem?
7. Trends in regular and non-regular employment in China
We have observed that in the context of China, the indicator of employment in the
aggregate economy-wide sense is of limited value. We have also noted that indicative signs
of an employment problem (including a declining share of industrial employment coupled
with a stationary share of agricultural employment) that one can pick up by examining
employment shares at the sectoral level in a certain period (1995-2003) may not be fully
reflected in the labour productivity components analysis.
In this section we reconstruct the existing employment database by dividing it into
regular and non-regular parts to see if this reconstructed database can give us some further
insights into the employment situation in China between 1990 and 2013.
As is the case for most developing countries, we need to devise special ways to tackle
the problem of measuring employment in China as well, precisely because the aggregate
economy-wide employment number is only useful for very limited purposes and sectoral
productivity analysis, as we have seen, is likely to be limited for examining employment
effects of the growth process. Such a re-classification often depends on the ways in which
employment information is collected and aggregated in a country in the first place, and can
only be done imperfectly. However, such an attempt is absolutely necessary not only to
develop an economy-wide picture of changes in the employment situation, but also to
confirm, reject or qualify what we can indirectly infer about employment through sectoral
productivity and growth analysis on the one hand, and sectoral employment shares as
estimated by the unaltered measure of employment, on the other.
In China, estimates are available on employment types on a rural and urban division
defined according the classifications made by Chinese labour statisticians. In our view,
these jobs can be classified as regular. They include both registered self-employment as
well as salaried and wage workers. When these numbers are added, they can be considered
a proxy for the total regular employment figure for China. This number can also be divided
between rural and urban components. Regular employment in China can be divided into
the following sub-categories of employment40:
1) Employment in Township and Village Enterprises (TVER). These are essentially
rural.
2) Two types of self-employment. First, employment in registered small private
enterprises (EP). This employment can be both rural and urban (EPR and EPU).
Second, we have registered self-employment in individual business (ES). The latter
type of self-employment can also be both rural and urban (ESR and ESU). We add
these two categories EP and ES into a new category, EI, which can also be both urban
and rural. In other words, EIA = EIU + EIR.
40 Of these (1) to (4) below are available.

23
3) Employment in traditional formal enterprises (TFU). This includes state-owned
enterprises (SOU), collective-owned (COU) and cooperative enterprises (CEU). These
are essentially urban.
4) Employment in emerging formal enterprises (EFU). They include joint ownership
enterprises, limited liability corporations, shareholding corporations and foreign-
funded enterprises, including those funded by residents of Hong Kong, Macao and
the Taiwan Province of China. These are also essentially urban.
These categories taken together constitute regular employment for our purposes.
Given that we have separate census adjusted estimates of total employment both at the
rural and urban level, employment that is not regular can be deduced as a residual. We call
employment that is not registered and is of a non-regular variety in rural areas NRER. This
category includes persons in the HRS (Household Responsibility System) discussed
earlier, as well as casual labour and the small unregistered self-employed. Non-regular
employment in urban areas, NREU, similarly includes urban casual wage workers as well
as urban small scale unregistered self-employment. Employment of a non-regular variety
at the all China level can be written as NREA = NREU + NRER. The sum of all regular
employment types and non-regular employment can be said to constitute the total census
adjusted employment figure.
Thus, total urban employment EU = REU + NREU. Similarly, total rural employment
ER = RER + NRER.
It follows that all the forms of regular employment in urban areas as well as those in
rural areas constitute total economy wide regular employment. If we add to this all forms
non-regular employment in urban and rural areas respectively (that are calculated as
residuals), this would constitute total employment:
E= (REU + RER + NREU + NRER) = ((TFU+ EFU +EIU) + (TVER+EIR) + NREU + NRER)
The rural labour surplus that has been discussed earlier is likely to be within the category
NRER, that is also the core source of internal migration, which can move to other rural
areas or to urban areas or to both, and of course across sectors in rural and urban areas.
Levels of regular and non-regular employment thus calculated are plotted over time
in the figure below at the all China level.

24
Figure 27. Employment composition in China, 1990-2010 (in millions)
What is encouraging from the point of view of the estimate is that the problems
identified by looking at trends in sectoral employment shares and labour productivity are
evident in this re-classification for the same period. The figure above shows a few things.
First, that the employment transformation was under way at the all China level from before
1990, as the trend in levels of non-regular employment was downward and that of regular
employment upward. The two trends were set on a convergence path, and for a few years
in the 1990s, the regular employment level even exceeded that of non-regular employment.
Second, that the period of 1996 to 2003 - that we identified from looking at sectoral
employment shares as a matter of possible concern and on which productivity
decomposition analysis did not shed too much light - can be seen as one in which there is
the possibility of labour market turmoil, as both forms of employment, regular and non-
regular, tend to move in unsystematic and sometimes divergent directions.
In other words, the period in which we find that industrial employment shares were
falling and agricultural employment shares stopped doing so (and which was importantly
not an output growth crisis period), also happens to be the period in which the path of
convergence between the regular and non-regular employment level is disturbed.
However, in 2003, this process stops and both trends are set once again on a
convergence path. In fact, in 2006, there is a breakthrough as lines cross and regular
employment starts to exceed non-regular employment in absolute terms. A concise and
standardised way to see this process is to look at regular employment as a share of total
employment over time. The period between 1996 and 2003 is one in which regular
employment shares adjust downward and then stagnate.
200
400
600
800
1 000
1990 1992 1994 1996 1998 2000 2002 2004 2006 2008 2010
Emp
loym
ent
in m
illio
ns
Employment composition in China (in millions), 1990 -2010
Total Employment Non-regular employment
Regular employment

25
Figure 28. Regular employment as a percentage of total employment, 1990-2011
8. Towards an historically consistent explanation of employment trends
To what extent was this situation driven by changes in agriculture and to what extent
was it driven by shifts in industry or in the service sector? This is a special question that
the previous graph poses. To probe this matter further, we need to examine these trends in
absolute numbers at the rural and urban level separately41. We first do this for rural
employment.
Figure 29. Rural employment composition in China, 1990-2010 (in millions)
Rural employment trends reveal some things. First, that in absolute terms rural
employment remained at almost the same level until 2001. If anything, there is a very
slow positive growth in rural employment. It is only after 2001 that a decline in the rural
employment level can be seen in a pronounced manner.
Second, non-regular employment has dominated regular employment levels in rural
China until very recently – in fact until as late as 2009. However, trends in regular and
non-regular rural employment levels for the entire period were by and large converging
41 In the rural case we need to bear in mind that a good amount of rural employment that is non-
regular is also agricultural.
20
30
40
50
60
70
1990 1995 2000 2005 2010
Reg
ula
r en
plo
ymen
t as
a %
of
tota
l
Regular employment as a % of total employment, 1990 - 2011
0
100
200
300
400
500
600
1990 1992 1994 1996 1998 2000 2002 2004 2006 2008 2010
Emp
loym
ent
in m
illio
ns
Rural employment composition in China (in millions), 1990 - 2010
Regular rural employment Non regular rural employment
Total rural employment

26
in rural China42. It is also the case that in the period 1995 to 2002, when the share of
agricultural employment in total employment had stopped falling, these trends also
continue. The rise in regular rural employment can be discerned just as the fall in non-
regular employment also obtains. This suggests that a good part of the story for the sub-
period that we identified as potentially problematic from the point of view of employment
shares may well lie outside the rural context. It is after all the industrial sector’s
employment share that falls. For the sake of completeness it is important to see what is
behind these gradual but positive movements in rural employment. The first point that
needs to be made here is that the regularization of employment that we find in rural China
was related to the changes in agricultural productivity which increased very gradually prior
to 1990 and more quickly later. It is likely that the migration of workers out of agriculture
was an important source of rising agricultural productivity and the rising share of regular
workers in total rural employment43.
Figure 30. Agricultural productivity (productivity index, with 1990=100) and regular rural
employment as a percentage of total rural employment
Note: The regression equation is: y = 20.065ln(x) - 63.78; R² = 0.8594, N = 23
The figure below shows that the gradual regularization of employment in rural areas
also had much to do with employment in TVEs that are largely non-agrarian enterprises44.
42 1996-97 and 2002-2003 are the exceptional years. 43 Agriculture has made major contributions to China's economic growth and poverty reduction.
The institutional factors (government policy instruments for land reallocation and use certification)
that accompany this growth are discussed in a recent paper by Deininger, Songquing and Fang
(2012). 44 TVEs involved in agriculture on average employ around 2 million persons. This number has
ranged from 2.5 per cent of total TVE employment in 1990 to 1.2 per cent in 2011.
0
10
20
30
40
50
60
0 50 100 150 200 250 300 350 400
Reg
ula
r ru
ral e
mp
loym
ent
as a
% o
f to
tal
emp
loym
ent
Productivity Index (1990=100)
Agricultural productivity (productivity index, with 1990=100) and regular rural employment as a % of total rural employment

27
Figure 31. Employment in TVEs as a percentage of total rural employment and regular
employment as a percentage of total rural employment
Note: The regression equation is y = 0.7255x - 0.2258; R² = 0.8761, N = 22. The coefficient is statistically
significant at the 1 per cent level.
In short, we have a broad perspective on slowly increasing shares of regular
employment in rural China. In the 1990s, these were driven by non-agricultural
employment and particularly by employment in TVEs. The slowly rising trend in post 1990
agricultural productivity (slow between 1996 and 2003 and faster subsequently) still needs
to be seen in the context of the shrinking share of employment in agriculture and the
movement of labour out of agriculture, part of which also went to rural TVEs.
The urban employment story is very different. Non-regular employment has been
lower than regular employment in urban China for a very long time. The reason for this
has essentially been the control of the movement of rural labour, which, as we noted, was
gradually and selectively relaxed in China after the reforms of 1979. We find that non-
regular employment in urban China begins to show a serious rise from around 1995 and
this process lasts until 200345. From then onwards, non-regular employment starts to
stabilize in urban China and stops rising. It does not go back to previous levels, but it stops
rising. On the other hand, regular employment undergoes a fall in absolute terms in urban
China during this period.
The employment problems during 1995 -2003 detected earlier when we looked at
sectoral employment shares is reflected much more directly in the employment story of
urban China: It is a period of sharply rising non-regular employment and significantly
falling regular employment.
45 See Park, Wu and Du (2012).
0
5
10
15
20
25
30
35
40
45
20 25 30 35 40 45 50 55
Emp
loym
ent
in T
VEs
as
a %
of
tota
l ru
ral
emp
loym
ent
Regular employment as a % of total rural employment
Employment in TVEs as a % of total rural employment and regular employment as a % of total rural
employment

28
Figure 32. Regular and non-regular urban employment, 1990-2011 (in millions)
A rising trend of urban employment shares in total employment in itself tells us little
about what was happening to regular employment shares within urban employment46.
Falling absolute numbers of urban regular employees (1997-2001) are related to particular
types of changes. The question of the source of rising absolute numbers of non-regular
urban employment (1997-2003), as we shall see, is a separate one. We first look at falling
numbers of regular urban employment. For this we need to look at the trends in different
components of urban regular employment.
Figure 33. Composition of urban regular employment in China, 1990-2011 (in millions)
What is absolutely clear is that employment in traditional formal enterprises (TFU),
which includes state-owned (SOU), collective-owned and cooperative enterprises (COU),
is where employment levels plummeted from 1997 onwards, but the slide, as we can see,
had begun from as early as 1992. In 1997, these enterprises employed over 135 million
persons. By 2004, this number had gone down to 72 million! The largest employer of
regular and formal workers, not only in China, but in the world, nearly halved its
employment in six years. While some of those who were made redundant may have been
re-employed in other regular jobs, and others may have migrated elsewhere, even back to
rural areas, many of these redundant workers are likely to have joined the group of
46 We saw the same thing with rural employment, when the absolute numbers of rural employment
remained stable but changes occurred in the composition of rural employment in favour of regular
employment.
0
50
100
150
200
250
300
350
400
1990 1992 1994 1996 1998 2000 2002 2004 2006 2008 2010
Emp
loye
d in
mill
ion
s
Regular and non-regular urban employment (employed in millions), 1990 - 2011
Total urban employment Non regular urban employment
Regular urban employment
0
100
200
300
1990 1992 1994 1996 1998 2000 2002 2004 2006 2008 2010 2012Nu
mb
er o
f em
plo
yed
in m
illio
ns
Composition of urban regular employment in China, 1990 -2011
Traditional formal urban employment
Employment in urban emerging formal enterprises
Employment in urban individual businesses and small enterprises
Total regular employment

29
registered urban unemployed in China. After all, the persons who were made redundant
were also relatively skilled workers. Many of these persons would not have had problems
in registering as unemployed since they belonged to public enterprises, collectives and
large cooperatives in the first place47. We can clearly see that as the share of traditional
formal employment (TFU) in urban regular employment declines, the registered urban
unemployment rate increases in China.
Figure 34. Urban traditional formal employment as a percentage of regular employment and
registered urban unemployment
Note: The regression equation is y = -31.856x + 170.59 with R² = 0.9184, N = 22. The coefficient is statistically
significant at the 1 per cent level.
Going back to the graph with absolute employment trends in different components of
urban employment, we find that emerging formal enterprises (EFU) and registered small
private enterprises and individual business (EIU) showed the greatest rise in
employment. This is the high employment growth part of the urban economy48; and this
component continued to rise during the 1995-2003 sub-period as well. From around 2003
employment growth in such small enterprises along with growth in larger emerging formal
companies together outstripped the employment losses from the TFU enterprises. At least
in terms of employment there is not much that can be said about the conflict between the
small private businesses and large enterprises in urban China. If the argument about
redundancies in TFU enterprises and registered unemployment is correct, then it follows
that falling employment in TFU enterprises cannot be a major explanation of rising non-
regular urban employment. The rise in non-regular employment in urban China is
relatively more about rural-urban migration. This is a process that seems to continue while
the TFU employment is declining. It is our view that rural-urban migration increased the
size of non-regular employment in urban China. The 1990s saw an easing of controls on
47 While we have reservations against using the registered unemployment rate as an “unemployment
rate” for the Chinese economy as such, the measure is clearly useful in establishing an explanation
of the redundancies from state enterprises. 48 Many authors (see for example Huang (2008) suggest that excessive advantages to large scale
domestic (as well foreign) investment existed in China’s transformation. While this may be so in
some way, in terms of employment growth this is not clear. In 1990 employment in each of the two
employment categories was around 7 million; by 2011 employment in small enterprises and
businesses was 121.7 million while in large scale emerging formal enterprises was 71 million. And
the gaps continue to widen.
0
20
40
60
80
100
120
2 2.5 3 3.5 4 4.5
Urb
an T
F em
plo
ymen
t as
a%
of
urb
an
regu
lar
emp
loym
ent
Registered urban unemployment rate
Urban TF employment as a % of regular employment and registered urban unemployment

30
migration in China. Estimates of rural-urban migration from 1992 to 2013 show a link
between the changing structures of urban employment and rural-urban migration. As rural
urban migration in China was increasing, it was swelling the ranks of the non-regular urban
employed. It is also interesting to note that there may be a limit to or a “natural level of
informality” of urban non-regular employment (around 100 million) in China beyond
which migrants are much more likely to be absorbed into regular employment.
Figure 35. Urban non-regular employment and rural-urban migrants without hukou
Note: The equation is y = -0.0217x2 + 6.5523x - 381.8; R² = 0.9234; N = 19. The coefficient is statistically
significant at the 1 per cent level.
Therefore, in the urban context, while a good part of the rise in overall employment
and urbanisation has in fact taken place on the basis of rural-urban migration, migrants
from rural China came in predominantly to take up non-regular work in urban China. The
workers who became redundant from restructured state enterprises are more likely to have
joined the queue of the registered unemployed or found other regular jobs in enterprises
that were growing in urban China.
9. Wages and the regularization of employment in China
What have these trends in employment meant for the returns to workers? Since we
have clear indications of the rise in regular forms of work in China, it would be useful to
have an idea about real wages. This is an assessment that is indeed very difficult to make
for any large developing economy and China is no exception49. A lot of judgement is
required in order to construct proxies for trends in rural and urban wages and the wage
gap. We have taken average real wages for employment in the TVEs as representing the
wage at the low end of the modern sectors or the high end of the traditional sectors; and a
composite of all other wage rates that were available to represent wages in modern sector.
49 For sector specific assessments see Banister (2004) and Banister (2007).
0
20
40
60
80
100
120
70 90 110 130 150 170 190
Urb
an n
on
-reg
ula
r em
plo
ymen
t in
mill
ion
s
Rural urban migrants without hukou (in millions)
Urban non-regular employment and rural-urban migrants without hukou

31
Figure 36. Real wages proxy in modern and traditional sectors, 1985-2012 (in ¥)
What is quite clear is that in the post-reform period since 1992, real wages have
consistently risen for regular employment in the modern sector. This has been concomitant
with the restructuring and the process of rising regular employment described earlier. The
TVE wage, if it is acceptable as proxy for wages in the less advanced parts of the regular
economy, rose up to 1997, remained very stable until the late 2000s. In particular, the
1997-2007 decade shows wage stagnation for the high end of the traditional sector. It is
only after 2007 that we see a rise in real wages in the TVEs, alongside rising real wages in
the modern sectors of the Chinese economy. This may be indicative of the beginning of a
Lewisian transformation in the Chinese labour market50. That is to say, real wages start
rising in both parts of the dual economy.
10. Conclusions
Although the employment situation in China has transformed for the better in the
recent high-growth decades, it is difficult to see this transformation at the aggregate level
in an empirically credible manner because of data capture problems in available measures
of employment. Growth has definitely been high and consistent in China in this period.
We can make some inferences on what may have happened to employment based on
sectoral growth patterns. Nevertheless, at best this gives us indirect evidence and hence
limited grounds to link the known changes that have occurred in the Chinese economy and
the overall employment situation. Interim aggregate measures of employment of an
imperfect kind are however possible to construct. In the case of China, such second best
measures of regular and non-regular employment can help us form a view of the changing
50 There are many interesting discussions in the literature on the Lewisian turning point in China
see for example Wang (2008) ; Das (2013). Our general view on this matter is that the search for
such a turning point in developing economies where this can be expected is not only too literal and
mechanical, but betrays Lewis original intent. It is best seen as a phase in the transformation of an
economy, in which certain conditions need to be met. Indicators for these conditions ought to be
carefully constructed with a core requirement that these give a picture of the change in the economy
represented as a whole. In many ways this is what we have tried to do in this paper.
2 000
4 000
6 000
8 000
10 000
1985 1990 1995 2000 2005 2010 2015
Wag
es p
roxy
, in
¥
Real wages proxy in modern and traditional sectors, 1985 - 2012
Modern sectors real wage proxy Traditional sectors real wage proxy

32
employment situation, as well as providing some plausible links with other labour related
variables.
In 1990, regular employment in China was around 265 million and non-regular
employment was close to 383 million. In a matter of two decades, regular employment in
China has increased to nearly 480 million and non-regular employment was down to 285
million in 2011. The increase in the share of the regular employment from 40.1 per cent in
1990 to 62.7 per cent in 2011 in the most populous country of the world is staggering. This
is around 132 million persons. This is the magnitude of the great Chinese employment
transformation. The transformation is clearly visible in the positive relationship between
the rising share of regular employment in total employment and changing levels of per
capita GDP.
Figure 37. Regular employment as a percentage of total employment and GDP per capita
(constant 2005 US$)
Note: The regression equation is y = 2E-06x2 - 0.0016x + 46.757; R² = 0.7358, N = 22
Despite the positive longer run trends in this transformation, some sub-periods have
not been smooth. Regular employment as a share of total employment faced stagnation
and stopped rising between the mid-1990s and early 2000s, after which this share started
rising again. We have argued that these disturbances in the employment trends were not
only produced by the State’s economic and sectoral policies, but also managed by it
through its post-reform administrative policies, through easing controls on the movement
of labour. This particular employment problem was dominantly urban. We have shown
that in this sub-period there was a rise in urban non-regular employment and a fall in urban
regular employment. The former, i.e. rising non-regular employment, was directly linked
to rural-urban migration on which effective controls were being relaxed; the latter, i.e.
falling regular employment, was a result of industrial restructuring in the State sector that
in turn increased “registered” unemployment. In this sense, this ostensible turbulence in
employment is best seen as a managed urban employment problem, as its causes lay in
sectoral and labour policies that the government was consciously adopting as a condition
for transition. We have also indicated that this industrial restructuring was a final policy
move in the long-term strategy of the post-reform period that began in 1979.
A summary illustration of this process can be seen in the relative growth rates of
absolute numbers of regular employment and the labour force. When the labour force
number increases faster than regular employment, the employment situation is unlikely to
0
10
20
30
40
50
60
70
0 500 1000 1500 2000 2500 3000 3500
Reg
ula
r em
plo
ymen
t as
a %
of
tota
l em
plo
ymen
t
GDP per capita (constant 2005 US$)
Regular employment as a percentage of total and GDP per capita (constant 2005 US$)

33
be improving. There are three times between 1995 and 2003 when the labour force growth
in China exceeded the increase in the numbers of the regularly employed. Other than this,
growth in regular employment has consistently been higher than labour force growth.
Figure 38. Regular employment and labour force growth rates, 1991-2012
The rural economy and in particular agriculture were already on an even (albeit slow)
growth path from the time of the reforms in 1979. The introduction of the HRS in 1979,
the setting up of the TVEs in the 1980s and the relaxation of the rules governing rural-rural
and rural-urban migration facilitated the slow productivity growth in the rural economy,
especially in agriculture. This is partly why shares of regular employment in rural China
have been rising gradually since 1990. It is also the case that productivity growth in both
agriculture and services - sectors with higher shares of non-formal employment- has been
positive. It was low in the 1990s, especially for agriculture during the urban employment
crisis period, but increased in the 2000s.
Figure 39. Agriculture and services productivity index (1990=100), 1990-2012
Note: To highlight the growth differences original values in the graph have been transformed into index
numbers by setting the 1990 value to 100.
In order to make a composite assessment of the employment situation in China we
use three indicators to make a simple index51. These are:
51 For a fuller explanation of this index, see Ghose et al. (2008).
-12%
-8%
-4%
0%
4%
8%
12%
1991 1993 1995 1997 1999 2001 2003 2005 2007 2009 2011
Gro
wth
rat
e
Regular employment and labour force, 1991 - 2012
Regular employment Labour force

34
(1) The share of regular employment (or the formal segment) in total employment.
(2) Output per worker (i.e. productivity) in the sectors that are likely to cover the
majority of the non-formal part of the economy.
(3) The rate of open unemployment52.
Other things being equal:
The larger the share of regular employment in total employment, the better the
employment situation will be.
The higher the output per worker in the non-formal segment, the better the
employment situation will be.
The higher the employment ratio53 (i.e. the lower the unemployment rate), the better
the employment situation will be.
We take these indicators, to produce a simple Employment Situation Index. This is plotted
over time below.
Figure 40. Employment situation index (1990=100), 1990-2011
Note: The index is a composite of the average of three indicators: (1) regular employment as a percentage of
total employment, (2) productivity in agriculture, and (3) 1 - the estimated unemployment rate. Their original
values have been transformed into an index by setting the 1990 value to 100. The three separate components
have been given equal weight. A higher value compared to the previous year indicates improvement.
Productivity is computed through dividing value added in agriculture (constant LCUs) by total employment in
agriculture.
The improvement in the employment situation in China has been consistent between
1990 and 2011. There was a slowdown between 1995 and 2003, but the overall situation
was improving even then. Since 2003, employment has improved much faster.
It is our view that the factors behind the improvement of the employment situation
stem from the sequenced policy shifts in the country’s sectoral economic growth strategies
52 We use its inverse because we want each of the components to be additive. 53 Employment Ratio= 100- (unemployment rate in percentage). For a fuller explanation of this
index, see Ghose et al. (2008). The employment ratio is used instead of a measure of unemployment
because we want the indicators to be additive for the index.
75
100
125
150
175
200
225
1990 1992 1994 1996 1998 2000 2002 2004 2006 2008 2010
Emp
loym
en
t si
tuat
ion
ind
ex
Employment situation index (1990 = 100)

35
on the one hand, and the removal of constraints on the physical movement of labour on the
other. Our analysis has shown that it is both economic growth, which is the outcome of
sectoral growth strategies, and the simultaneous management of available labour flows,
that have brought about this improvement in the employment situation in China. This
improving employment situation reflects the increase in productive employment in the
country. We also know from the income side that poverty has declined and observed that
real wages have risen.
These findings are not just indicative of what has been achieved, but also show the
extent of the future employment challenge. In 1990, over 59 per cent of the labour force
was either unemployed or underemployed in China, by 2011 this percentage had come
down to 38 per cent. But 38 per cent it was. China may well be in a Lewisian turning phase
but it has not crossed the Lewis turning point, if there is one, yet. Surplus labour in the
economy has declined, but is not eliminated. On the other hand, open unemployment has
risen. It can be said that the hard part of industrial restructuring is over, and in a sense the
accumulation of (a non-Lewisian) surplus labour in the “modern” part of the economy,
which was due to incentive problems associated with planning, has been dealt with to a
considerable degree.
Serious employment concerns for the future are high incidence of non-regular
employment and now, increasingly, the problem of open (urban) unemployment. There is
a growing urban open unemployment problem which was around 21.6 million in 2011. It
is likely to be higher today. While it is the case that some of the unemployed have skills
and may have been part of those who were made redundant during the restructuring, it is
also the case that demands for even higher skills from upcoming and newer enterprises
may not allow some these persons to be easily reabsorbed into new jobs. Parts of the
unemployed are relatively more educated and are now also younger. The second area of
concern is that while non-regular employment is declining as a share of the total, it is still
extremely high and also being urbanised. As the regulatory instrument of controlling
labour flows (the residency permit) has been exhausted, and there will be few non-market
mechanisms available to the State to control this urbanisation of underemployment. The
point is that the instrument (easing enforcement of regulations on migration) that originally
allowed for the reduction in rural non-regular employment and contributed to increasing
productivity in agriculture, also contributed significantly to the urbanisation of non-regular
employment, and is likely to additionally do the same to open urban unemployment in the
future.
The present employment challenge for China’s policy makers is to continue to
increase the overall share of regular employment in total employment in such a way that
(a) the open urban unemployment problem is meaningfully contained and then reduced;
and (b) the process of labour transfer out of agriculture to non-agriculture is also freely
permitted without reverting to the control of residency permits.
Even with the exceptionally high rates of growth that China has sustained over past
decades, this would be a challenge; but with lower growth rates than ones that we have
seen in past decades, this challenge is likely to be great. We propose a three-fold
employment policy focus as a socially sustainable response to the Chinese employment
challenge for the coming years:

36
The first policy focus concerns incentives for encouraging growth in key sectors of
the economy. Growth in the emerging non-state formal enterprises and individual
business in particular needs to be the focus of any future growth strategy. The
objective here is to absorb new entrants to the labour market as well as migrants who
get re-skilled. There are supply side implications for targeted and niche skilling
programmes for the latter here. There is also an additional case for re-focusing on
those TVEs that are likely to increase productivity in the rural non-farm economy and
thus also influence the rural-urban migrant flows. There should be mechanisms put in
place to ensure that new employment in these focus areas – i.e. in emerging
enterprises, individual businesses and targeted TVEs – is of a regular and not of an
informal or casual kind. This task is going to be most challenging in the context of
smaller individual businesses and TVEs because of costly monitoring.
The second employment policy focus concerns regulation. The eased movement of
labour must continue, or at least there should be no attempt to roll this process back
simply because we have slower growth prospects on the horizon. Ease of migration
is an important objective in itself. While the State’s skilful deregulation of labour
residency permissions over the past decades to manage growth and development is
worth admiring from an historical policy point of view; the stricter permit system
whose origins are in the early decades, is not something that ought to be reverted to.
In fact, much more pro-active facilities for obtaining full residency rights in urban
areas for those who do not have them or are in need of them should be put in place.
The third focus ought to be to increase social protection. Open unemployment in
urban China cannot be ignored anymore by simply referring to the smaller number of
registered unemployed. It size compared to non-regular employment may still not be
very large, but it is over 20 million and it is urban. Enhanced protection systems that
have fewer bureaucratic filters to screen out non-resident workers need to be
developed for the rising numbers of the openly unemployed.

37
Selected Bibliography
Ash, R. F. 1988. “The evolution of agricultural policy”, in The China Quarterly, Vol. 116, pp.
529 – 555.
Banister, J. 2004. “Manufacturing employment and compensation in China”, Beijing: Beijing
Javelin Investment Consulting Company. http://www.bls.gov/fls/chinareport.pdf
[accessed 14 Sept 2015].
Banister, J. 2007. Manufacturing in China today: Employment and labor compensation, The
Conference Board Economics Program Working Paper Series, 07-01 (New York NY).
Banister, J., Bloom, D. E. and Rosenberg, L. 2010. Population aging and economic growth in
China, PGDA Working Paper, No. 53. (Cambridge MA).
Bosworth, B. and Collins, S. M. 2008. “Accounting for growth: Comparing China and India”,
in Journal of Economic Perspectives, Vol. 22, Issue 1, pp. 45 – 66.
Bureau of National Statistics of China. Various years. China Labour Statistical Yearbooks,
available at: http://tongji.cnki.net/overseas/engnavi/HomePage.aspx?id=N2011010069
—. Various years. China Statistical Yearbooks, available at: http://www.stats.gov.cn/tjsj/ndsj/
Chan, K. W. 2013. “China, internal migration”, in Ness, I. and Bellwood, P. (eds.) The
Encyclopaedia of Global Human Migration (Maiden, MA, Blackwell Publishing Ltd)
Chan, K. W. and Zhang, L. 1999. “The Hukou system and rural-urban migration in China:
Processes and changes”, in The China Quarterly, Vol. 160, pp. 818 – 855.
Chen, W. 1998. “The political economy of rural industrialization in China: Village
conglomerates in Shandong province”, in Modern China, Vol. 24, No. 1, pp. 73 – 96.
Cheng, T. and Selden, M. 1994. “The origins and social consequences of China's Hukou
system”, in The China Quarterly, Vol 139, pp. 644 - 668.
Chow, G. 2002. China’s economic transformation. (Maiden, MA, Blackwell Publishing Ltd)
Das, M. and N’Diaye, P. 2013. Chronicle of a decline foretold: Has China reached the Lewis
turning point? IMF Working Paper, 13/26 (Washington DC).
Deininger, K. Songqing, J. and Fang, X. 2012. Moving off the Farm Land Institutions to
Facilitate Structural Transformation and Agricultural Productivity Growth in China,
World Bank Policy Research Working Paper No. 5949 (Washington DC).
Dikötter, F. 2010. Mao's great famine: The history of China's most devastating catastrophe,
1958-1962, (London, Walker & Company).
Faint, T. 2005. Review of the China State-Owned Enterprise Restructuring and Enterprise
Development (SOERED) Project, (London, the Department for International
Development).
Garnaut, R., Song, L. and Yao, Y. 2006. “Impact and Significance of State-Owned Enterprise
Restructuring in China”, in The China Journal, No. 55, pp. 35 – 63.

38
Ghose, A. K. 2003. “Trade, jobs and wages”, in Jobs and Incomes in a Globalizing World,
(Geneva, International Labour Office), pp. 41 – 78.
Ghose, A. K. 2005. Employment in China : recent trends and future challenges. ILO
Employment Strategy Papers, No. 18 (Geneva) . Employment strategy Paper No. 14
Ghose, A. K., Majid, N. and Ernst, C. 2008. The global employment challenge (Geneva,
International Labour Office).
Giles, J. Park, A. and Zhang, J. 2005. “What is China's true unemployment rate?” in China
Economic Review, Vol. 16, pp. 149 – 170.
Golley, J. & Tyers, R. 2012. “Demographic dividends, dependencies, and economic growth in
China and India”, in Asian Economic Papers, Vol. 11, No. 3, pp. 1 – 26.
Greenhalgh, S. and Winckler, E. A. 2005. Governing China's population: From Leninist to
neoliberal biopolitics, (Stanford: Stanford University Press).
Guisheng, W., Junb, T. and Shulinc, G. Innovation System and Transformation of the
Agricultural Sector in China, With the Case of Shouguang City (Beijing, School of
Economics and Management, Tsinghua University).
Hassard, J., Morris, J., Sheehan, J. and Yuxin, X. 2010. “China's state‐owned enterprises:
economic reform and organizational restructuring”, in Journal of Organizational Change
Management, Vol. 23, Issue 5, pp. 500 – 516.
Heilig, G. K. et. al. (2005). Poverty alleviation in China: A Lesson for the Developing World?
Paper presented at the International Conference on the West Development and Sustainable
Development, 2 – 4. Aug. (Urumqi)
Huang, Y. 2008. Capitalism with Chinese Characteristics: Entrepreneurship and the State,
(Cambridge, Cambridge University Press).
Hussin, F. and Yik, S. Y. 2012. “The Contribution of Economic Sectors to Economic Growth:
The Cases of China and India”, in Research in Applied Economics, Vol. 4, No. 4, pp. 38
– 58.
Hussain, A., Stern, N. and Stiglitz, J. 2000. Chinese Reforms from a Comparative perspective
in Incentives , Organization and Public Economics, essays in Honour of Sir James
Mirrlees. Edited by Peter J . Hammond and Gareth D. Myles. Oxford University Press.
2000.
Knight, J. and Li. S. 2006. “Unemployment duration and earnings of re-employed workers in
urban China”, in China Economic Review, Vol. 17, pp. 103 – 119.
Knight, J. and Song, L. 2003. “Chinese peasant choices: Migration, rural industry or
farming”, in Oxford Development Studies, Vol. 31, No. 2, pp. 123 – 148.
Lewis, W.A. 1954. “Economic development with unlimited supplies of labour”, in The
Manchester School, Vol. 22, Issue 2, pp. 139 – 191.
Lin, J. Y. 1987. “The household responsibility system reform in China: A peasant's
institutional choice”, in American Journal of Agricultural Economics, Vol. 69, No. 2, pp.
410 – 415.

39
—. 1988. “The household responsibility system in China's agricultural reform: A theoretical
and empirical study”, in Economic Development and Cultural Change, Vol. 36, No. 3,
pp. 199 – 224.
—. 1990. “Collectivization and China's agricultural crisis in 1959-1961”, in Journal of
Political Economy, Vol. 98, No. 6, pp. 1228 – 1254.
—. 1992. “Rural Reforms and Agricultural Growth in China”, in The American Economic
Review, Vol. 82, No. 1, pp. 34 – 51.
Lin, J. Y. and Yang, D. T. 1998. On the causes of China’s agricultural crisis and the great leap
famine, in China Economic Review, Vol. 9, No. 2, pp. 125 – 140.
Majid, N. 2001. “Working poor in deveoping countries”, in International Labour Review,
Vol. 140, No. 3, pp. 271 – 291.
—. 2005. On the evolution of the employment structure in developing countries, ILO
Employment Strategy Papers, No. 18 (Geneva)
—. 2014. “Measuring employment in developing countries”, in World Economics, Vol. 15,
No. 3, July – September, pp. 1 – 31.
McMillan, M. and S. Rodrik, D. 2011. Globalization, structural change and productivity
growth, NBER Working Paper No. 17143 (Cambrdige MA).
Meng, X., Qian, N. and Yared, P, 2010. The institutional causes of China’s Great Famine,
Columbia Business School research Paper, November 2010 (New York NY).
Nabar, M. and Yan, K. 2013. Sector-Level Productivity, Structural Change, and Rebalancing
in China, IMF Working Paper (Washington DC).
National Bureau of Statistics. 2013. Report on the rural migrant workers monitoring survey
(Beijing, Rural Department of NBS).
Park, A., Wu, Y. and Du, Y. 2012. Informal employment in urban China: Measurement and
implications, World Bank Working Paper 77737 (Washington DC).
Ravallion, M., and Chen, Shaohua (2004), China's (Uneven) Progress Against Poverty, World
Bank Policy Research Working Paper No. 3408. World Bank.
Schneider, A. and Mertes, C. M. 2014. “Expansion and growth in Chinese cities, 1978–2010”,
in Environmental Research Letters, Vol 9, No. 2, pp. 1 – 11.
Scott, G. 2014. Gender and power: Sterilisation under the emergency in India, 1975-1977,
paper presented at the North West Gender Conference, Lancaster, 22 Apr.
Sen, A. 1975. Employment and technology and development (Oxford, Clarendon Press).
Sigurdson, J. 1977. Rural Industrialization in China, Harvard East Asian Monographs, No 73.
(Cambridge MA, Harvard University Asia Center).
UN DESA. 2015. World Population Prospects 2015. Available at:
http://esa.un.org/unpd/wpp/DVD/

40
Wang, X. and Sun, W. 2014. “Discrepancy between registered and actual unemployment rates
in China: An investigation in provincial capital cities”, in China & World Economy, Vol.
22, Issue 4, pp. 40 – 59.
Wang, D. 2008. “Lewis turning point and China’s experiences” in Reports on China’s
Population and Labor, No. 9, pp. 88 – 101.
World Bank, 2015. World Development Indicators, available at:
http://data.worldbank.org/data-catalog/world-development-indicators [downloaded
August 2015].
Xie, Y. and Zhou, X. 2014. “Income inequality in today’s China”, in Proceedings of the
National Academy of Sciences, Vol. 111, No. 19, pp. 6928 – 6933.
Yeh, K.C. 2001. “China’s economic growth: recent trends and prospects”, In Chen, S. and
Wolf Jr, C. (eds.), China, United States and the global economy (Santa Monica, CA, The
Rand Corporation).
Zeng, D. Z. 2011. How do special economic zones and industrial clusters drive China's rapid
development? World Bank Policy Research Working Paper Series, No. 5583
(Washington DC).
Zhang, J. 2011. “China’s success in increasing per capita food production”, in Journal of
Experimental Botany, May 2011, pp. 1 – 5.
Zhang, J., Jiang, C. and Wang, P. 2014. Total factor productivity and China's miraculous
growth: An empirical analysis. Available at SSRN: http://ssrn.com/abstract=2456009
[18. Aug. 2015].
Zhang, K. H. and Song, S. 2003. “Rural–urban migration and urbanization in China: Evidence
from time-series and cross-section analyses”, in China Economic Review, Vol. 14, Issue
4, pp. 386 – 400.
Zhang, M. 2013. “China's declining labor pool approaching the ‘Lewis turning point’: IMF
Paper”, in: International Business Times, 4 Feb. 2013, Available at:
http://www.ibtimes.com/chinas-declining-labor-pool-approaching-lewis-turning-point-
imf-paper-1059950 [18. Aug. 2015].
Zhao, Y. 1999. “Leaving the countryside: Rural-to-urban migration decisions in China”, in
American Economic Review, Vol. 89, No. 2, pp. 281 – 286.
Zou, Wei. 2003. “The Changing Face of Rural Enterprises”, in: China Perspectives, Issue 50.
November – December, pp. 2 – 17.
Zu, L. 2009. “Enterprise Reform and Restructuring in China”, in Corporate Social
Responsibility, Corporate Restructuring and Firm's Performance: Empirical Evidence
from Chinese Enterprises, (Heidelberg, Springer), pp. 135 – 191.

41
Annex
Annex A Data sources
Data presented in this annex are either directly taken from or estimated on the basis of data
from the following sources:
China Labour Statistical Yearbooks, various years; available at:
http://tongji.cnki.net/overseas/engnavi/HomePage.aspx?id=N2011010069
China Statistical Yearbooks, various years; available at:
http://www.stats.gov.cn/tjsj/ndsj/.
China Statistical Yearbooks, various years .We have also used hard copies of older
yearbooks going back to 1990s.
Report on the rural migrant workers monitoring survey, (Beijing, Rural Department
of NBS) National Bureau of Statistics (NBS). 2013.
United Nations Department of Economic and Social Affairs (UNDESA) database,
available at: http://esa.un.org/unpd/wpp/DVD/
World Bank, World Development Indicators, available at:
http://data.worldbank.org/data-catalog/world-development-indicators
The aggregates of regular and non- regular employment in rural and urban China have
been built up by adding annual data separated by sectors for agriculture, manufacturing,
other industry and services. These are sometimes not equal to the aggregates for the
category in any particular year. For post-2001 data we use the following sources: NBS,
China Statistical Yearbook 2004 Tables 5-6,5-7,5-10,5-12,5-16 and 5-17; China Statistical
Yearbook 2005-2012 Tables 5-7,5-9,5-10,5-11; NBS and Ministry of Labour and Social
Security (MOLSS) China Labour Statistical Yearbook 2003 Table 1-18 and 7-3. For TVEs
we have used China Labour Statistical Yearbook 2013Table 7-2. For rural estimates on
registered small private enterprises and registered self-employment in individual
businesses, prior the 2001, we use Ghose (2005). Our choice of building up data from
broad sectoral aggregates as opposed to using the aggregates that are given for each year
in the latest online are not large enough to affect regression results.
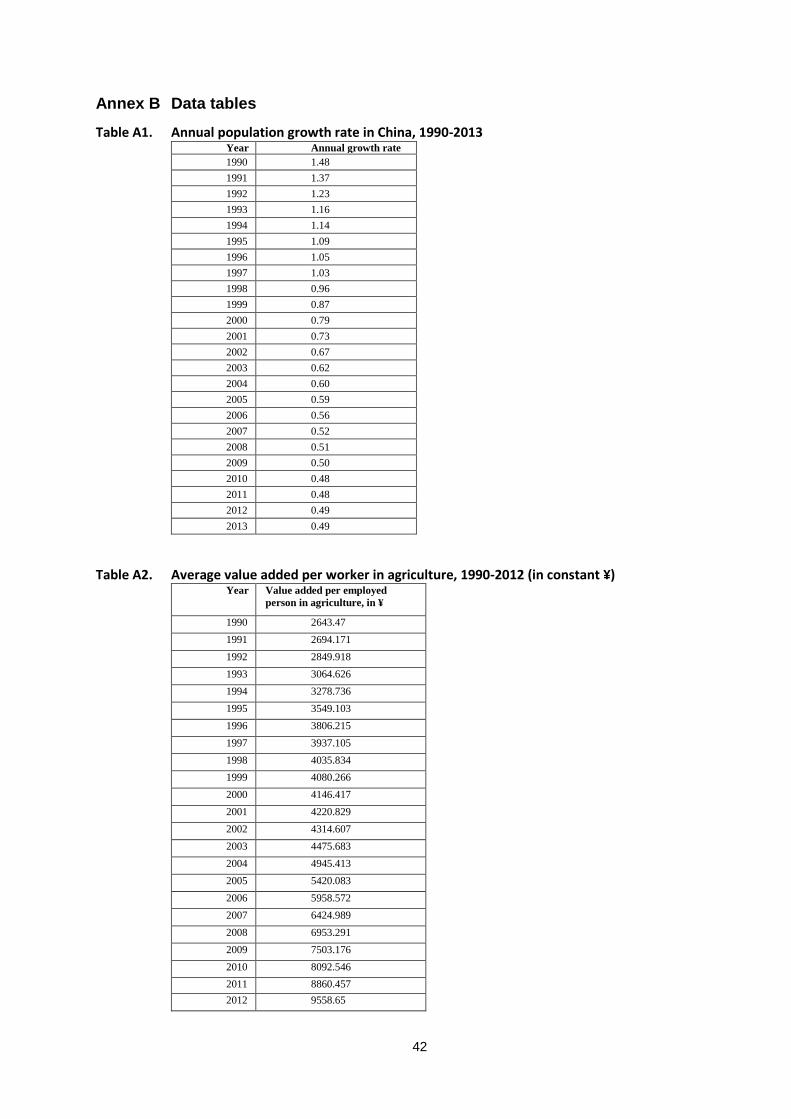
42
Annex B Data tables
Table A1. Annual population growth rate in China, 1990-2013 Year Annual growth rate
1990 1.48
1991 1.37
1992 1.23
1993 1.16
1994 1.14
1995 1.09
1996 1.05
1997 1.03
1998 0.96
1999 0.87
2000 0.79
2001 0.73
2002 0.67
2003 0.62
2004 0.60
2005 0.59
2006 0.56
2007 0.52
2008 0.51
2009 0.50
2010 0.48
2011 0.48
2012 0.49
2013 0.49
Table A2. Average value added per worker in agriculture, 1990-2012 (in constant ¥) Year Value added per employed
person in agriculture, in ¥
1990 2643.47
1991 2694.171
1992 2849.918
1993 3064.626
1994 3278.736
1995 3549.103
1996 3806.215
1997 3937.105
1998 4035.834
1999 4080.266
2000 4146.417
2001 4220.829
2002 4314.607
2003 4475.683
2004 4945.413
2005 5420.083
2006 5958.572
2007 6424.989
2008 6953.291
2009 7503.176
2010 8092.546
2011 8860.457
2012 9558.65

43
Table A3. Total employment in town and village enterprises, 1990-2012 (in millions) Year Total employment in TVEs,
in millions
1990 93.67
1991 92.65
1992 96.09
1993 106.25
1994 123.45
1995 120.17
1996 128.62
1997 135.08
1998 91.58
1999 125.37
2000 127.04
2001 128.20
2002 130.86
2003 132.88
2004 135.73
2005 138.66
2006 142.72
2007 146.80
2008 150.90
2009 154.51
2010 155.88
2011 158.93
2012 161.86
Table A4. Internal migration in China, 1993-2013 (in millions) Year All long term rural-
urban migrants hukou
plus non-hukou
All
migrants
All floating
migrants
1993 80.19
1994 88.49
1995 93.46 143.16 49.7
1996 94.11 154.11 60.0
1997 96.05 157.85 61.8
1998 96.93 159.33 62.4
1999 102.90 166.595 63.7
2000 111.33 255.73 144.4
2001 115.49 235.5225 120.0
2002 121.92 229.92 108.0
2003 131.16 237.06 105.9
2004 137.69 240.69 103
2005 145.13 298.23 153.1
2006 152.70 274.3 121.6
2007 157.84 278.54 120.7
2008 159.33 283.63 124.3
2009 163.78 287.4821 123.7
2010 171.83 294.4071 122.575
2011 177.11 299.6871 122.575
2012 181.84 304.4171 122.575
2013 184.58 307.1571 122.575

44
Table A5. Rural-urban migrant workers in China, 1990-2013 (in millions) Year Long term rural-urban
migrant workers (non
hukou)
Long term rural-urban
migrant workers (with
hukou)
All long term rural-
urban migrants, hukou
and non-hukou
1990 19.24
1991 19.24
1992 18.7
1993 62.00 18.19 80.19
1994 70.00 18.49 88.49
1995 75.00 18.46 93.46
1996 76.60 17.51 94.11
1997 78.20 17.85 96.05
1998 79.80 17.13 96.93
1999 86.03 16.87 102.90
2000 92.25 19.08 111.33
2001 98.48 17.01 115.49
2002 104.70 17.22 121.92
2003 113.90 17.26 131.16
2004 118.20 19.49 137.69
2005 125.80 19.33 145.13
2006 132.10 20.6 152.70
2007 137.00 20.84 157.84
2008 140.41 18.92 159.33
2009 145.30 18.48211 163.78
2010 153.35 18.48211 171.83
2011 158.63 18.48211 177.11
2012 163.36 18.48211 181.84
2013 166.10 18.48211 184.58
Table A6. Value added per employed in industry (in constant US$) and employment in traditional formal enterprises (in ten thousands), 1990-2012
Year Value added per employed person
in industry (constant US$)
Employment in traditional formal
enterprises (in ten thousands)
1990 9242.71 13910
1991 10404.01 14290
1992 12306.38 14510
1993 14149.88 14310
1994 16367.89 14100
1995 18231.04 14040
1996 19746.55 13900
1997 21362.15 13590
1998 23192.23 10720
1999 25352.58 9990
2000 28087.75 9330
2001 30431.38 8650
2002 34598.63 7990
2003 38383.14 7520
2004 40651.42 7240
2005 42853.31 6950
2006 45689.71 7120
2007 49208.35 7090
2008 53102.44 6830
2009 56922.13 7030
2010 61666.28 7120
2011 65891.48 7310

45
Table A7. Rural employment as a percentage of total employment, 1990-2011 Year Rural employment as a % of
total employment
1990 73.68
1991 73.33
1992 73.00
1993 72.66
1994 72.35
1995 72.03
1996 71.11
1997 70.24
1998 69.40
1999 68.61
2000 67.88
2001 66.86
2002 65.67
2003 64.43
2004 63.25
2005 61.97
2006 60.48
2007 58.91
2008 57.52
2009 56.06
2010 54.42
2011 53.01
Table A8. Percentage of employed with education above junior school level, by sector, 1996-2012
Year All Agriculture Manufacturing Other industry Services
1996 14.2
1997 15.7
1998 15.4
1999 15.8
2000 17.5
2001 19.1
2002 19.1 8.3 41.4 45.1 64.1
2003 20.4 5.0 29.7 34.6 61.3
2004 20.6 5.0 29.6 32.1 59.2
2005 18.9 4.9 26.2 36.6 61.7
2006 18.5 5.0 28.6 39.0 64.5
2007 18.8 5.2 28.2 37.9 60.1
2008 19.2 7.5 35.7 45.3 64.2
2009 20.3 6.0 29.2 36.6 61.3
2010 23.9 6.4 29.9 40.6 63.1
2011 29.7 6.9 34.8 42.7 63.4
2012 30.7 6.9 36.4 43.4 61.7
Note: New industry classification is adopted in the year of 2003 and 2011.

46
Table A9. Employment share by sector, 1990-2012 Year Primary
Industry
Secondary
Industry
Tertiary
Industry
1990 60% 21% 19%
1991 60% 21% 19%
1992 59% 22% 20%
1993 56% 22% 21%
1994 54% 23% 23%
1995 52% 23% 25%
1996 51% 24% 26%
1997 50% 24% 26%
1998 50% 24% 27%
1999 50% 23% 27%
2000 50% 23% 28%
2001 50% 22% 28%
2002 50% 21% 29%
2003 49% 22% 29%
2004 47% 23% 31%
2005 45% 24% 31%
2006 43% 25% 32%
2007 41% 27% 32%
2008 40% 27% 33%
2009 38% 28% 34%
2010 37% 29% 35%
2011 35% 30% 36%
2012 34% 30% 36%
Table A10. Value added per employed person and employment population ratio, 1990-2011 (log) Year Log of employment
to population ratio
Log of value added
per employed
person
1990 4.04 8.67
1991 4.04 8.74
1992 4.04 8.86
1993 4.04 8.98
1994 4.04 9.08
1995 4.03 9.18
1996 4.04 9.26
1997 4.04 9.33
1998 4.04 9.39
1999 4.04 9.46
2000 4.04 9.53
2001 4.05 9.60
2002 4.05 9.68
2003 4.05 9.77
2004 4.05 9.86
2005 4.05 9.96
2006 4.05 10.08
2007 4.05 10.20
2008 4.04 10.29
2009 4.04 10.38
2010 4.04 10.47
2011 4.04 10.56

47
Table A11. Employment and working age population, 1990-2011 (log) Year Log of
employment
Log of working age
population
1990 6.47 6.72
1991 6.48 6.73
1992 6.49 6.74
1993 6.50 6.76
1994 6.51 6.77
1995 6.52 6.79
1996 6.54 6.80
1997 6.55 6.82
1998 6.56 6.83
1999 6.57 6.84
2000 6.58 6.88
2001 6.59 6.90
2002 6.60 6.90
2003 6.60 6.91
2004 6.61 6.93
2005 6.62 6.95
2006 6.62 6.96
2007 6.62 6.97
2008 6.63 6.98
2009 6.63 6.99
2010 6.63 7.02
2011 6.64 7.03
Table A12. Percentage employed with more than junior school qualifications and percentage employed over 45 years, 1996-2012
Year Percentage employed
with more than junior
school qualifications
Percentage
employed over 45
years
1996 14.2 25.6
1997 15.7 26.5
1998 15.4 27.3
1999 15.8 28.3
2000 17.5 28.8
2001 19.1 29.2
2002 19.1 30.3
2003 20.4 30.9
2004 20.6 30.9
2005 18.9 33.6
2006 18.5 35.4
2007 18.8 36.6
2008 19.2 38.3
2009 20.3 38.8
2010 23.9 35.0
2011 29.7 35.2
2012 30.7 37.1

48
Table A13. Total employment and labour force, 1990-2010 (in millions) Year Total
employment (in
millions)
Labour force (in
millions)
1990 647.49 653.23
1991 654.91 660.91
1992 661.52 667.82
1993 668.08 674.68
1994 674.55 681.35
1995 680.65 688.55
1996 689.50 697.65
1997 698.20 708.00
1998 706.37 720.87
1999 713.94 727.91
2000 720.85 739.92
2001 727.97 738.84
2002 732.80 744.92
2003 737.36 749.11
2004 742.64 752.90
2005 746.47 761.20
2006 749.78 763.15
2007 753.21 765.31
2008 755.64 770.46
2009 758.28 775.10
2010 761.05 783.88
2011 764.20 785.79
Table A14. Labour force participation rate, 1990-2010
Year Labour force
participation rate (aged
16 and above)
1990 79.0
1991 78.9
1992 78.7
1993 78.1
1994 77.9
1995 77.4
1996 77.4
1997 77.3
1998 77.8
1999 77.6
2000 75.7
2001 74.7
2002 74.7
2003 74.4
2004 73.8
2005 73.0
2006 72.3
2007 71.9
2008 71.6
2009 71.2
2010 70.1
2011 69.8

49
Table A15. Registered and estimated unemployed, 1990-2011 (in millions) Year Unemployment
estimate
Registered
unemployed
1990 5.74 3.83
1991 6.00 3.52
1992 6.30 3.64
1993 6.60 4.20
1994 6.80 4.76
1995 7.90 5.20
1996 8.15 5.53
1997 9.80 5.77
1998 14.50 5.71
1999 13.97 5.75
2000 19.07 5.95
2001 10.87 6.81
2002 12.12 7.70
2003 11.75 8.00
2004 10.26 8.27
2005 14.73 8.39
2006 13.37 8.47
2007 12.10 8.30
2008 14.82 8.86
2009 16.82 9.21
2010 22.83 9.08
2011 21.59 9.22
Table A16. Percentage of unemployed persons with primary education or less and percentage unemployed with more than junior school education, 2001-2012
Year Percentage of urban
unemployed with
more than junior
school education
Percentage of urban
unemployed with
primary education or
less
2001 42.50 7.50
2002 41.10 8.50
2003 42.70 7.90
2004 43.30 7.40
2005 42.28 9.34
2006 46.23 8.51
2007 49.48 6.36
2008 50.13 6.79
2009 51.07 7.55
2010 51.59 7.78
2011 53.50 6.77
2012 51.34 7.38

50
Table A17. GDP per capita (constant US$) and the unemployment rate in China, 1990-2012 Year GDP per capita
(constant US$)
Unemploymen
t rate
1990 483.19 0.88
1991 494.94 0.91
1992 533.79 0.94
1993 602.84 0.98
1994 679.30 1.00
1995 759.85 1.15
1996 834.08 1.17
1997 908.22 1.38
1998 983.17 2.01
1999 1051.05 1.92
2000 1122.26 2.58
2001 1206.61 1.47
2002 1307.41 1.63
2003 1429.55 1.57
2004 1564.40 1.36
2005 1731.13 1.94
2006 1939.71 1.75
2007 2202.89 1.58
2008 2402.78 1.92
2009 2611.16 2.17
2010 2870.05 2.91
2011 3121.97 2.75
2012 3344.54 2.78
Table A18. Average GDP growth in China, by decade, 1980-2013 Period Average GDP growth
2000-2013 9.86
1990-1999 10.00
1980-1989 9.74
1980-2013 9.86

51
Table A19. Annual GDP per capita, 1980-2013 (constant LCU) Year GDP per capita
(constant LCU)
1980 1543.506
1981 1603.758
1982 1723.44
1983 1883.078
1984 2140.583
1985 2395.989
1986 2569.444
1987 2821.459
1988 3089.589
1989 3166.208
1990 3239.87
1991 3489.32
1992 3937.67
1993 4436.244
1994 4960.154
1995 5442.593
1996 5924.889
1997 6409.79
1998 6845.885
1999 7304.014
2000 7857.676
2001 8448.298
2002 9154.04
2003 10009.23
2004 10953.41
2005 12120.75
2006 13581.2
2007 15423.86
2008 16823.47
2009 18282.46
2010 20095.14
2011 21858.98
2012 23417.37
2013 25089.59

52
Table A20. Labour productivity by sector, 1990-2012 (in constant ¥ per person) Year Agriculture Industry Services All
Sectors
1990 2643.47 9242.71 12241.69 5831.38
1991 2694.17 10404.01 12897.98 6272.60
1992 2849.92 12306.38 13705.28 7051.33
1993 3064.63 14149.88 14219.07 7912.47
1994 3278.74 16367.89 14420.24 8812.52
1995 3549.10 18231.04 14557.88 9656.13
1996 3806.22 19746.55 14999.91 10462.55
1997 3937.11 21362.15 16152.02 11291.58
1998 4035.83 23192.23 17107.44 12027.71
1999 4080.27 25352.58 18367.63 12816.20
2000 4146.42 28087.75 19529.45 13763.55
2001 4220.83 30431.38 21168.11 14760.18
2002 4314.61 34598.63 22493.62 15994.59
2003 4475.68 38383.14 23894.04 17489.27
2004 4945.41 40651.42 25000.72 19116.19
2005 5420.08 42853.31 27203.11 21169.06
2006 5958.57 45689.71 30144.08 23758.55
2007 6424.99 49208.35 34588.28 27015.84
2008 6953.29 53102.44 37146.48 29530.00
2009 7503.18 56922.13 39486.95 32148.11
2010 8092.55 61666.28 42556.00 35392.56
2011 8860.46 65891.48 44942.26 38565.81
2012 9558.65 68974.81 47847.19 41383.60
Table A21. Decomposition of labour productivity growth by sector, 1990-2012 Period Primary
industry
Secondary
industry
Tertiary
industry Total
1990-2000 4.64
11.8
1 4.81 8.99
1990-2012 6.06 9.62 6.43 9.33
1996-2002 2.85 9.60 6.43 7.48
2001-2012 7.25 7.80 7.78 9.62
2003-2012 8.29 7.16 7.88 9.99

53
Table A22. Employment composition in China, 1990-2010 (in millions) Year Regular
employment
Non-regular
employment
Total
employment
1990 264.85 382.64 647.49
1991 275.39 379.52 654.91
1992 293.25 368.27 661.52
1993 325.25 342.83 668.08
1994 332.97 341.58 674.55
1995 353.02 327.63 680.65
1996 363.68 325.82 689.50
1997 325.98 372.22 698.20
1998 347.07 359.30 706.37
1999 345.74 368.20 713.94
2000 346.50 374.35 720.85
2001 347.56 380.41 727.97
2002 356.58 376.22 732.80
2003 336.53 400.83 737.36
2004 345.46 397.18 742.64
2005 363.72 382.75 746.47
2006 381.40 368.38 749.78
2007 398.60 354.61 753.21
2008 412.31 343.33 755.64
2009 433.48 324.80 758.28
2010 453.83 307.22 761.05
2011 479.56 284.64 764.20
Table A23. Regular employment as a percentage of total employment, 1990-2011 Year Regular employment as a % of total
employment
1990 40.90
1991 42.05
1992 44.33
1993 47.74
1994 49.36
1995 51.87
1996 52.96
1997 46.69
1998 49.13
1999 48.43
2000 48.07
2001 47.74
2002 48.66
2003 45.64
2004 46.52
2005 48.73
2006 50.87
2007 45.27
2008 54.56
2009 49.31
2010 51.65
2011 54.68

54
Table A24. Rural employment composition in China, 1990-2010 (in millions) Year Regular
employment
Non-regular
employment. Built up
by sectors
Total
employment
1990 117.45 359.63 477.08
1991 122.69 357.57 480.26
1992 136.95 345.96 482.91
1993 165.75 319.71 485.46
1994 169.07 318.95 488.02
1995 183.52 306.73 490.25
1996 191.78 298.50 490.28
1997 152.38 338.01 490.39
1998 191.27 298.94 490.21
1999 193.44 296.38 489.82
2000 199.80 289.54 489.34
2001 203.06 283.68 486.74
2002 207.48 273.73 481.21
2003 175.33 299.73 475.06
2004 179.56 290.15 469.71
2005 187.62 274.96 462.58
2006 194.60 258.88 453.48
2007 199.50 244.18 443.68
2008 203.11 231.50 434.61
2009 209.88 215.18 425.06
2010 217.83 196.37 414.2
2011 214.16 190.94 405.1
Note : Non regular employment in rural China is the difference between estimates of regular and total
employment. Regular employment in rural areas is simply the addition of TVE employment estimates and
the estimates registered self-employment.
TVE estimates are based on the 2013 Statistical Yearbook. For regular employment our estimates of self
employment (EI) prior to 2001 also see Ghose (2005).

55
Table A25. Agricultural productivity (productivity index, with 1990=100) and regular rural employment as a percentage of total rural employment, 1990-2011
Year Regular rural
employment as a % of
total rural employment
Agricultural
productivity per
worker (in constant ¥)
Agricultural
productivity index
(1990 = 100)
1990 24.62 2643.47 100
1991 25.55 2694.17 101.92
1992 28.36 2849.92 107.81
1993 34.14 3064.63 115.93
1994 34.65 3278.74 124.03
1995 37.43 3549.10 134.26
1996 39.12 3806.22 143.99
1997 31.07 3937.11 148.94
1998 39.02 4035.83 152.67
1999 39.49 4080.27 154.35
2000 40.83 4146.42 156.85
2001 41.72 4220.83 159.67
2002 43.12 4314.61 163.22
2003 36.91 4475.68 169.31
2004 38.23 4945.41 187.08
2005 40.56 5420.08 205.04
2006 42.91 5958.57 225.41
2007 44.96 6424.99 243.05
2008 46.73 6953.29 263.04
2009 49.38 7503.18 283.84
2010 52.59 8092.55 306.13
2011 52.87 8860.46 335.18
Table A26. Employment in TVEs as a percentage of total rural employment and regular employment as a percentage of total rural employment, 1990-2011
Year Regular rural employment as
a % total rural employment
TVE employment as a %
total rural employment
1990 24.62 19.42
1991 25.55 20.01
1992 28.36 22.00
1993 34.14 25.43
1994 34.65 24.62
1995 37.43 26.24
1996 39.12 27.55
1997 31.07 18.68
1998 39.02 25.57
1999 39.49 25.94
2000 40.83 26.20
2001 41.72 26.88
2002 43.12 27.61
2003 36.91 28.57
2004 38.23 29.52
2005 40.56 30.85
2006 42.91 32.37
2007 44.96 34.01
2008 46.73 35.55
2009 49.38 36.67
2010 52.59 38.37
2011 52.87 39.96

56
Table A27. Regular and non-regular urban employment, 1990-2011 (employed in millions) Year Regular
employment
Non-regular
employment
Total urban
employment
1990 147.4 23.01 170.41
1991 152.7 21.95 174.65
1992 156.3 22.31 178.61
1993 159.5 23.12 182.62
1994 163.9 22.63 186.53
1995 169.5 20.9 190.4
1996 171.9 27.32 199.22
1997 173.6 34.21 207.81
1998 155.8 60.36 216.16
1999 152.3 71.82 224.12
2000 146.7 84.81 231.51
2001 144.5 96.73 241.23
2002 149.1 102.49 251.59
2003 161.2 101.1 262.3
2004 165.9 107.03 272.93
2005 176.1 107.79 283.89
2006 186.8 109.5 296.3
2007 199.1 110.43 309.53
2008 209.2 111.83 321.03
2009 223.6 109.62 333.22
2010 236 110.87 346.87
2011 265.4 93.74 359.14
Table A28. Composition of urban regular employment in China, 1990-2011 (in millions). Built up by aggregating sectors.
Year Traditional
formal
employment
Emerging
formal
enterprises
Individual
businesses
and small
enterprises
Total
regular
employment
1990 139.1 1.6 6.7 147.4
1991 142.9 2.2 7.6 152.7
1992 145.1 2.8 8.4 156.3
1993 143.1 5.2 11.2 159.5
1994 141 7.4 15.5 163.9
1995 140.4 8.7 20.4 169.5
1996 139 9.4 23.5 171.9
1997 135.9 10.8 26.9 173.6
1998 107.2 16.3 32.3 155.8
1999 99.9 17.8 34.6 152.3
2000 93.3 19.3 34.1 146.7
2001 86.5 21.4 36.6 144.5
2002 79.9 25.7 43.5 149.1
2003 75.2 34.3 51.7 161.2
2004 72.4 38.3 55.2 165.9
2005 69.5 44.2 62.4 176.1
2006 71.2 45.9 69.7 186.8
2007 70.9 49.3 78.9 199.1
2008 68.3 53.6 87.3 209.2
2009 70.3 55.4 97.9 223.6
2010 71.2 59.4 105.4 236
2011 73.1 71 121.3 265.4

57
Table A29. Urban traditional formal employment as a percentage of regular employment and registered urban unemployment rate, 1990-2012
Year
Urban TF as a % of
regular urban
employment
Urban registered
unemployment rate (%)
1990 94.37 2.5
1991 93.58 2.3
1992 92.83 2.3
1993 89.72 2.6
1994 86.03 2.8
1995 82.83 2.9
1996 80.86 3
1997 78.28 3.1
1998 68.81 3.1
1999 65.59 3.1
2000 63.60 3.1
2001 59.86 3.6
2002 53.59 4
2003 46.65 4.3
2004 43.64 4.2
2005 39.47 4.2
2006 38.12 4.1
2007 35.61 4
2008 32.65 4.2
2009 31.44 4.3
2010 30.17 4.1
2011 27.54 4.1
2012 4.1
Table A30. Urban non-regular employment and rural-urban migrants without hukou, 1993-2011 (in millions)
Year Non-regular urban
employment
All rural -urban
migrants
1993 23.12 80.19
1994 22.63 88.49
1995 20.9 93.46
1996 27.32 94.11
1997 34.21 96.05
1998 60.36 96.93
1999 71.82 102.90
2000 84.81 111.33
2001 96.73 115.49
2002 102.49 121.92
2003 101.1 131.16
2004 107.03 137.69
2005 107.79 145.13
2006 109.5 152.70
2007 110.43 157.84
2008 111.83 159.33
2009 109.62 163.78
2010 110.87 171.83
2011 93.74 177.11

58
Table A31. Proxy for weal wages in modern and traditional sectors, 1990-2011 Year Wages
proxy TF
and non-
TF
TF Non TF TVEs
1990 980.00 980.00 1217.00
1991 980.50 980.50
1992 981.00 981.00
1993 981.50 981.50 490.75
1994 982.00 982.00 491.00
1995 982.50 982.50 491.25 2152.66
1996 983.00 983.00 491.50
1997 983.50 983.50 491.75 2666.88
1998 984.00 984.00 393.60 2807.22
1999 656.33 656.33 393.80 2730.97
2000 656.67 656.67 394.00
2001 657.00 657.00 394.20
2002 657.33 657.33 394.40
2003 657.67 657.67 394.60 2797.16
2004 658.00 658.00 394.80 2753.70
2005 658.33 658.33 395.00 2905.28
2006 658.67 658.67 395.20 2890.61
2007 659.00 659.00 395.40 2860.35
2008 659.33 659.33 395.60 3018.63
2009 659.67 659.67 395.80 3168.16
2010 660.00 660.00 396.00 3286.86
2011 660.33 660.33 396.20 3857.21
Table A32. Regular employment and labour force growth rates, 1991-2012
Year
Regular
employment
growth
Labour force
growth
1991 4.0% 1.2%
1992 6.5% 1.0%
1993 10.9% 1.0%
1994 2.4% 1.0%
1995 6.0% 1.1%
1996 3.0% 1.3%
1997 -10.4% 1.5%
1998 6.5% 1.8%
1999 -0.4% 1.0%
2000 0.2% 1.6%
2001 0.3% -0.1%
2002 2.6% 0.8%
2003 -5.6% 0.6%
2004 2.7% 0.5%
2005 5.3% 1.1%
2006 4.9% 0.3%
2007 4.5% 0.3%
2008 3.4% 0.7%
2009 5.1% 0.6%
2010 4.7% 1.1%
2011 5.7% 0.2%

59
Table A33. Rural and urban income per capita, 1978-2003 (in 1978 constant prices) Year Rural income per
capita
Urban income per
capita
1978 133.6 343.4
1979
1980 185.7 436.1
1981
1982
1983
1984
1985 359.3 550.8
1986 370.9 626.7
1987 390.1 641.8
1988 415.1 626.7
1989 408.4 627.7
1990 415.8 680.3
1991 424.0 729.4
1992 449.2 799.8
1993 463.5 876.0
1994 486.8 950.5
1995 512.6 996.9
1996 558.7 1035.7
1997 584.4 1071.1
1998 609.5 1132.9
1999 632.6 1238.3
2000 646.0 1317.6
2001 673.1 1429.6
2002 705.4 1621.2
2003 735.7 1767.1

60
Table A34. Urban-rural ratio of real income, 1978-2003 Year Urban-rural ratio
of real income
1978 2.57
1979
1980 2.35
1981
1982
1983
1984
1985 1.53
1986 1.69
1987 1.65
1988 1.51
1989 1.54
1990 1.64
1991 1.72
1992 1.78
1993 1.89
1994 1.95
1995 1.94
1996 1.85
1997 1.83
1998 1.86
1999 1.96
2000 2.04
2001 2.12
2002 2.30
2003 2.40
Source: Derived from Heilig et al. (2005). Poverty alleviation in China: A Lesson for the Developing World?
Paper presented at the International Conference on the West Development and Sustainable Development, 2 –
4. Aug. (Urumqi)

61
Table A35. Employment situation index (1990=100), 1990-2011 Year Share of
regular
employment
index
Output per
worker index
Estimated
unemployment
rate index
Total
1990 100 100 100 100
1991 102.80 105.00 99.97 102.59
1992 108.37 114.12 99.93 107.48
1993 119.02 124.67 99.90 114.53
1994 120.68 134.50 99.88 118.35
1995 126.80 144.71 99.73 123.75
1996 128.95 155.24 99.71 127.97
1997 114.14 166.51 99.49 126.72
1998 120.12 175.38 98.86 131.45
1999 118.39 185.04 98.95 134.13
2000 117.51 195.91 98.29 137.24
2001 116.72 209.33 99.40 141.82
2002 118.96 222.93 99.25 147.05
2003 111.58 239.32 99.30 150.07
2004 113.73 262.39 99.51 158.54
2005 119.12 293.65 98.93 170.57
2006 124.36 333.90 99.12 185.79
2007 129.38 385.32 99.29 204.66
2008 133.40 422.69 98.95 218.34
2009 139.76 461.17 98.70 233.21
2010 145.79 506.20 97.95 249.98
2011 153.42 553.41 98.11 268.32
Table A36. Agriculture and services productivity index (1990=100), 1990-2012 Year Services
productivity
index
Agricultural
productivity
index
1990 100 100
1991 105.36 101.918
1992 111.96 107.8098
1993 116.15 115.9319
1994 117.80 124.0315
1995 118.92 134.2592
1996 122.53 143.9856
1997 131.94 148.937
1998 139.75 152.6718
1999 150.04 154.3527
2000 159.53 156.8551
2001 172.92 159.67
2002 183.75 163.2176
2003 195.19 169.3109
2004 204.23 187.0804
2005 222.22 205.0367
2006 246.24 225.41
2007 282.54 243.0513
2008 303.44 263.0365
2009 322.56 283.8382
2010 347.63 306.1335
2011 367.12 335.1828
2012 390.85 361.5948

62
Table A37. Percentage gap of employed with more than junior school education (urban China – all China), 2002-2012
Year
Percentage gap of
employed with more than
junior school education
2002 23.40
2003 24.70
2004 23.90
2005 17.51
2006 18.54
2007 17.70
2008 16.86
2009 16.67
2010 18.33
2011 20.32
2012 19.29
Table A38. Decomposition of labour productivity growth, 1990-2012 Year Capital
accumulation
Labour transfer
component
Total
1990-2012 6.89 2.44 9.33
2003-2012 7.93 2.06 9.99
1990-2000 6.20 2.79 8.99
2001-2012 7.52 2.10 9.62
1990-1995 7.44 3.19 10.63
1996-2002 5.36 2.11 7.48

63
Employment Working Papers The Working Papers from 2008 are available at:
www.ilo.org/employment/Whatwedo/Publications/working-papers
Employment Policy Department
For more information visit our website: http://www.ilo.org/employment
International Labour Office Employment Policy Department 4, route des Morillons CH-1211 Geneva 22 Email: [email protected]
Please
scan the
code

ISSN 1999-2939
For more information, visit our websitehttp://www.ilo.org/employment
International Labour Offi ceEmployment Policy DepartmentRoute des Morillons 4CH-1211 Geneva 22
Email: [email protected]
Employment Policy Department