eni’s strategy and sustainable growth - 30 january 2012 · enieni s strategy and sustainable...
TRANSCRIPT
eni’s strategy and sustainable growtheni s strategy and sustainable growth
30 January 2012
eni.com
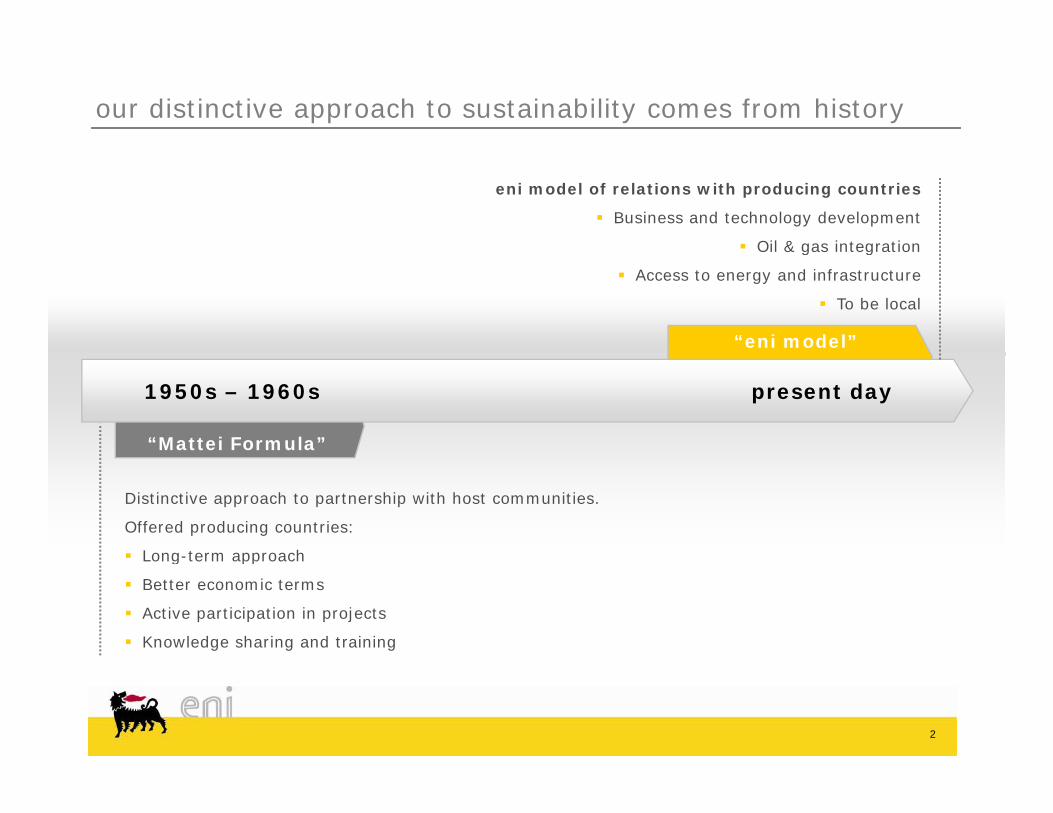
our distinctive approach to sustainability comes from history
eni model of relations with producing countries
Business and technology development
Oil & gas integration
“eni model”
g g
Access to energy and infrastructure
To be local
“Mattei Formula”
1950s – 1960s present day
Distinctive approach to partnership with host communities.
Offered producing countries:
Long-term approachLong term approach
Better economic terms
Active participation in projects
Knowledge sharing and training
2

continued innovation on sustainability initiatives
2003First
biodiversity pilot project (Val d’Agri,
Italy)
2007eni
Foundation
2010EST pilot
project completed at
Taranto refinery
2011eni model
leads to giant gas
discovery, Mozambique
1999First HSE
Report
1970sFirst long-term gas pipeline deals with
major suppliers
1994First code of
2001Endorse-
2007First
2011eni for
2011eni is First code of
conduct (revised in
2008 > Code of Ethics)
Endorse-ment of the
Global Compact
First Sustaina-
bility Report
eni for develop-
ment, first integrated
report
eni is selected to the Global
Compact LEAD
Initiative
3
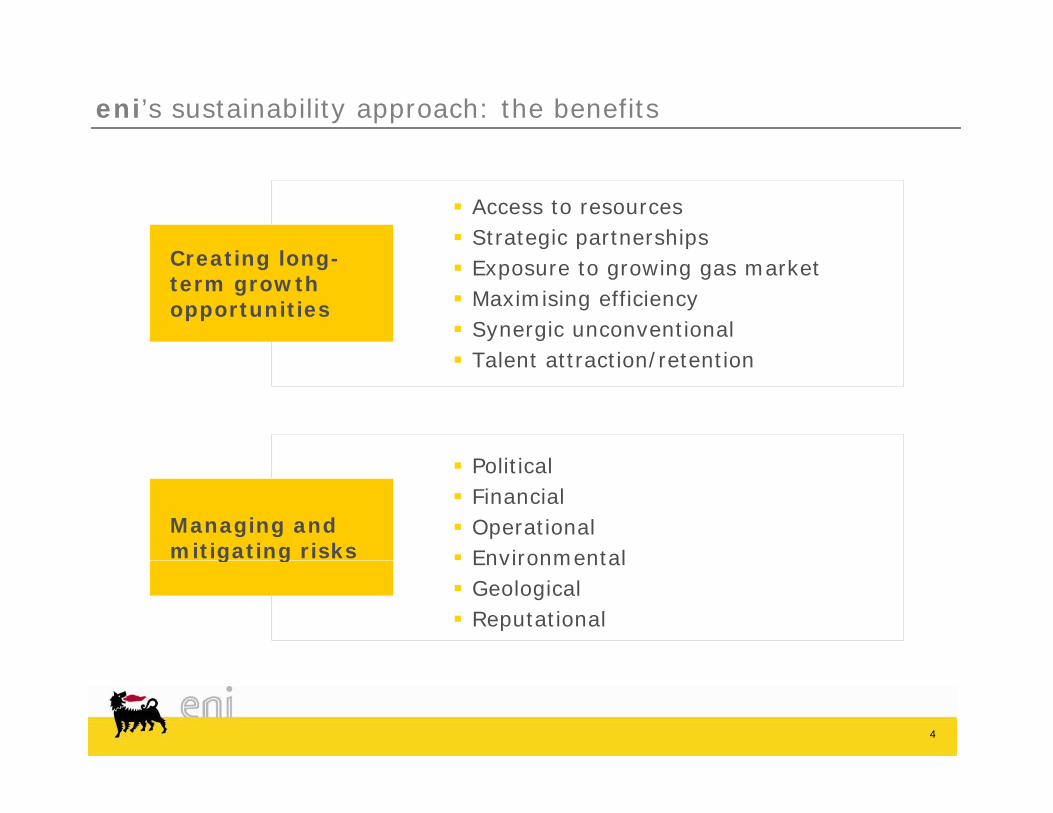
eni’s sustainability approach: the benefits
Access to resources Strategic partnerships
C ti l Exposure to growing gas market Maximising efficiency Synergic unconventional
Talent att action/ etention
Creating long-term growth opportunities
Talent attraction/retention
P li i l Political Financial Operational Environmental
Managing andmitigating risks Environmental
Geological Reputational
g g
4
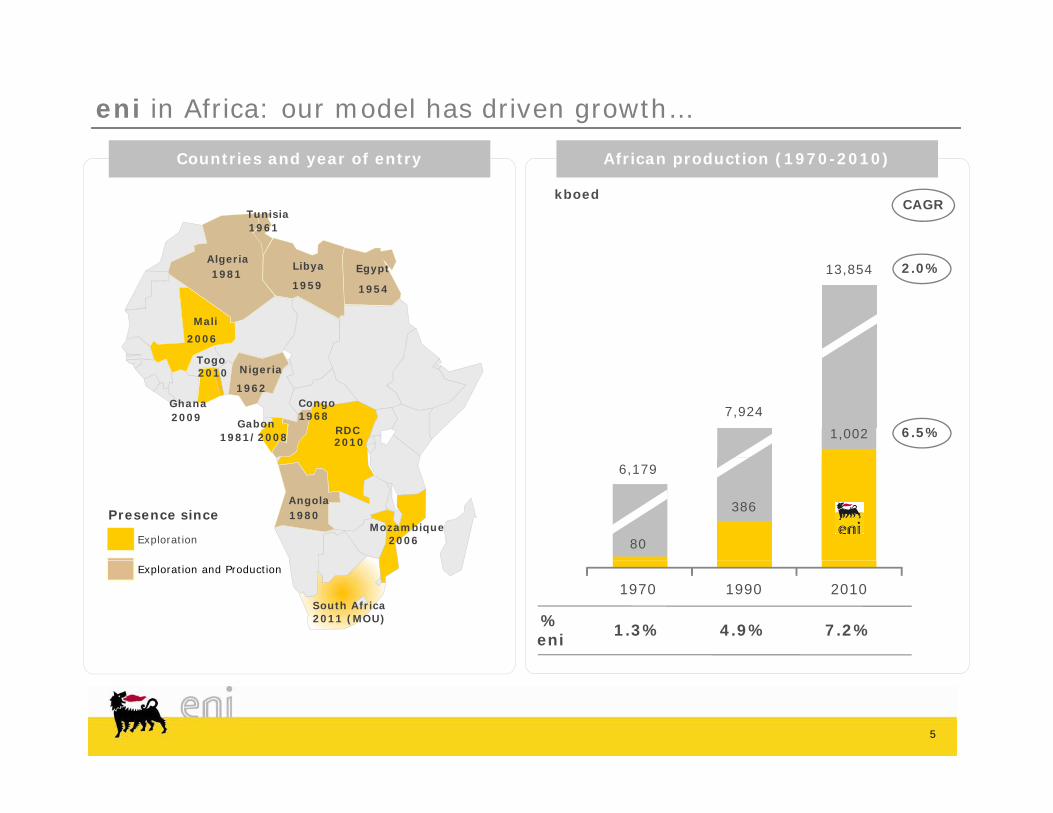
eni in Africa: our model has driven growth…
Tunisia1961
Countries and year of entry
kboed
African production (1970-2010)
CAGR
Algeria1981
Libya
1959
Egypt
1954
Mali
2006
13,854 2.0%
Nigeria
1962Congo1968
Gabon1981/2008
Ghana2009
RDC2010
Togo 2010
7,924
1,002 6.5%
Angola1980
Mozambique2006
Presence since
Exploration
6,179
80
386
Exploration and Production
South Africa2011 (MOU) %
eni1.3% 4.9% 7.2%
1970 1990 2010
5
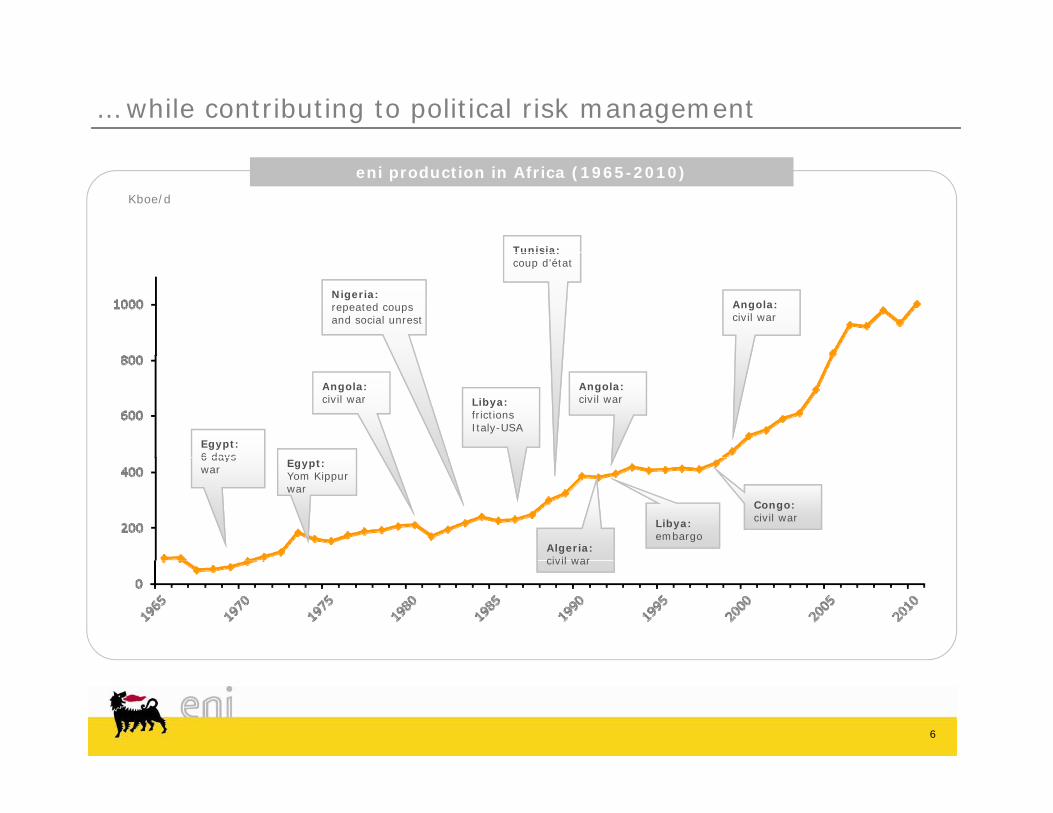
… while contributing to political risk management
eni production in Africa (1965-2010)
Kboe/d
Tunisia:
Nigeria:repeated coups and social unrest
Angola: civil war
Tunisia: coup d’état
Libya: frictionsItaly-USA
Egypt:6 days
Angola: civil war
Angola: civil war
Libya:embargo
Egypt:Yom Kippur war
6 dayswar
Congo: civil war
Algeria: civil warcivil war
6
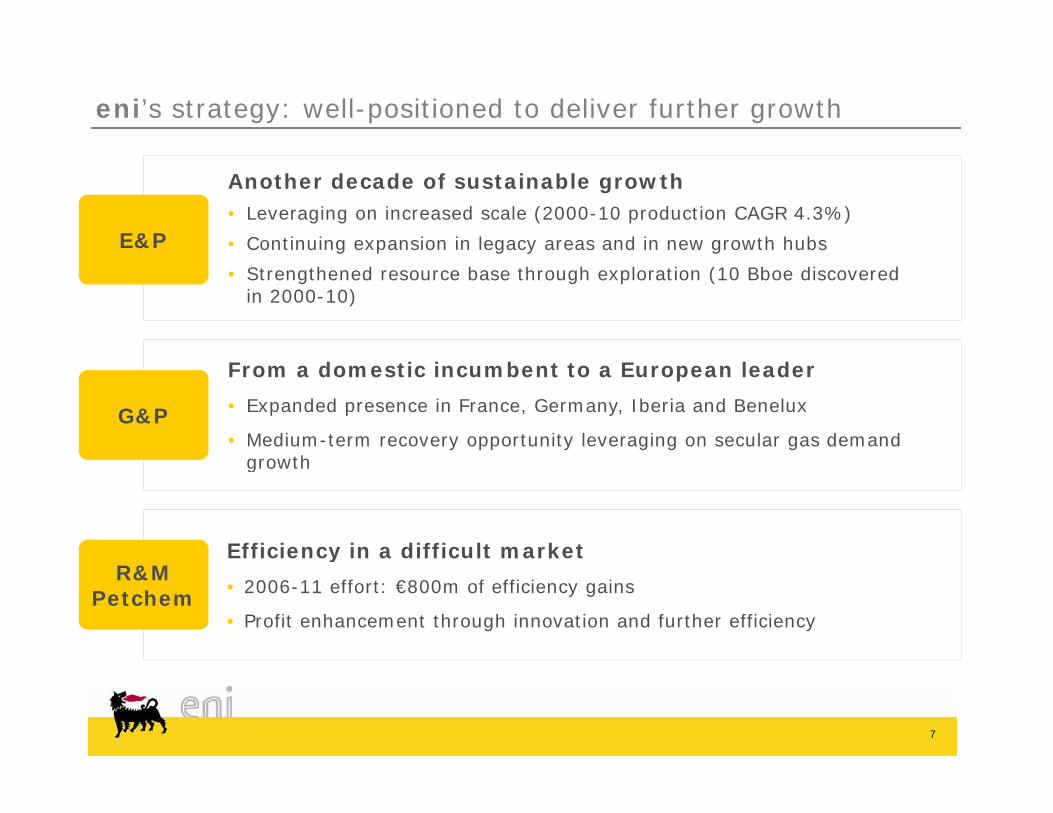
eni’s strategy: well-positioned to deliver further growth
E&P
Another decade of sustainable growth• Leveraging on increased scale (2000-10 production CAGR 4.3%)
• Continuing expansion in legacy areas and in new growth hubsg p g y g
• Strengthened resource base through exploration (10 Bboe discovered in 2000-10)
G&P
From a domestic incumbent to a European leader
• Expanded presence in France, Germany, Iberia and Benelux
• Medium-term recovery opportunity leveraging on secular gas demand thgrowth
Efficiency in a difficult marketR&M
Petchem
y
• 2006-11 effort: €800m of efficiency gains
• Profit enhancement through innovation and further efficiency
7
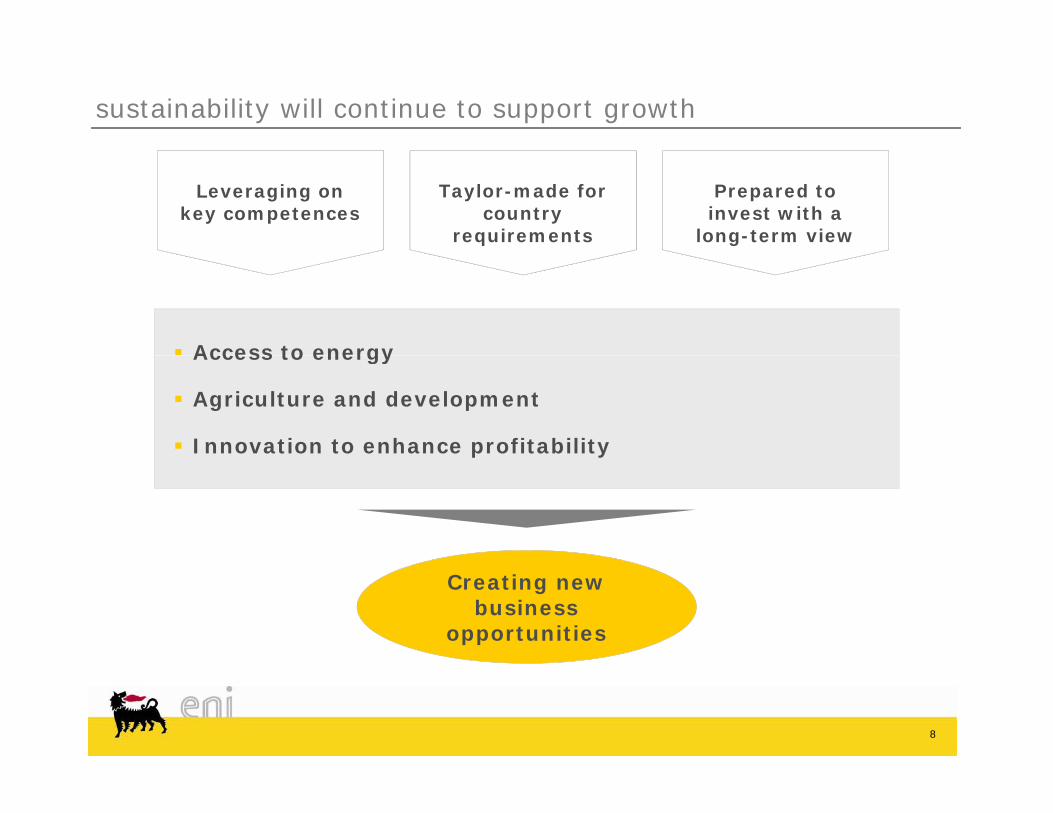
sustainability will continue to support growth
Leveraging on key competences
Taylor-made for country
requirements
Prepared to invest with a
long-term view
Access to energyAccess to energy
Agriculture and development
Innovation to enhance profitability
Creating new business
opportunities
8
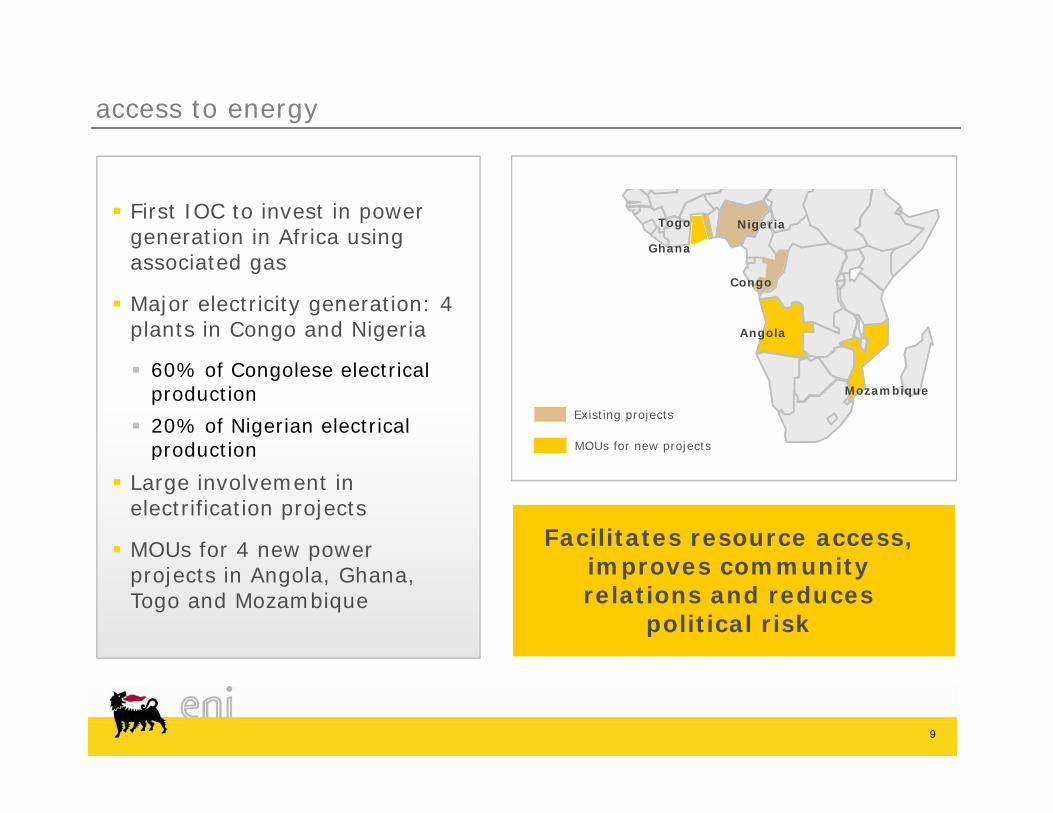
access to energy
First IOC to invest in power generation in Africa using
Ghana
Togo Nigeria
associated gas
Major electricity generation: 4 plants in Congo and Nigeria Angola
Congo
60% of Congolese electrical production
20% of Nigerian electrical production
Existing projects
MOUs for new projects
Mozambique
p
Large involvement in electrification projects
MOUs for 4 new power Facilitates resource access, i it
pprojects in Angola, Ghana, Togo and Mozambique
improves community relations and reduces
political risk
9
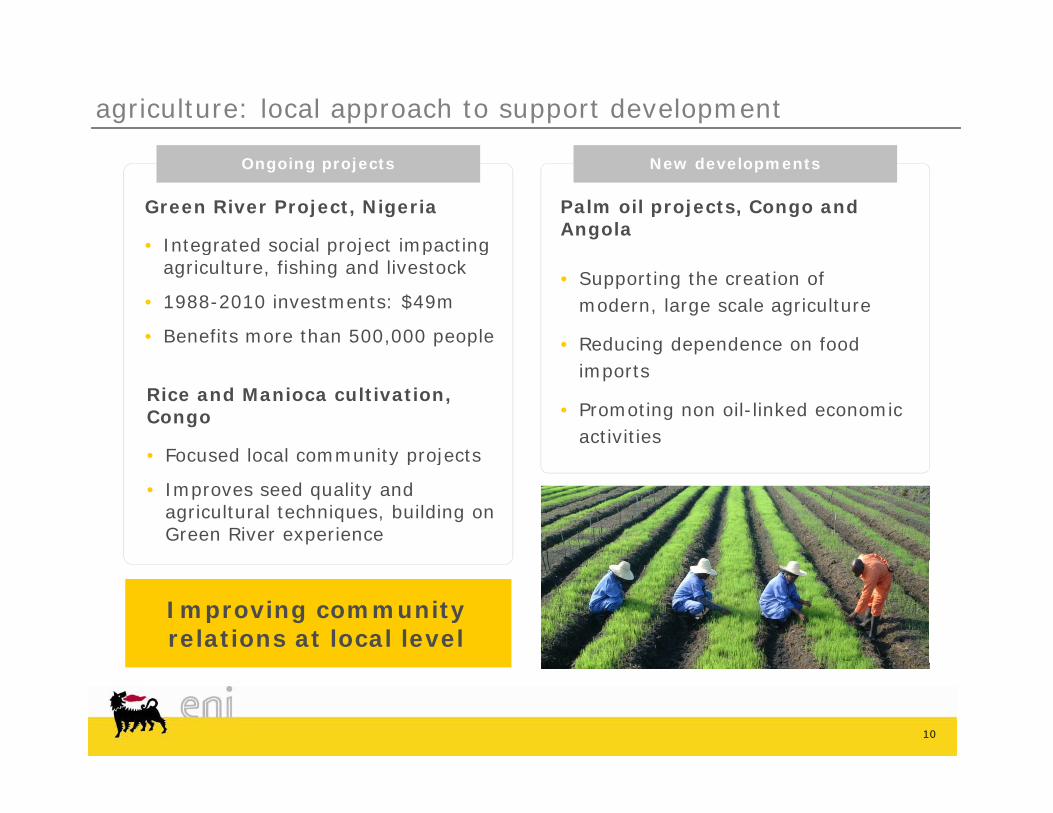
agriculture: local approach to support development
Green River Project, Nigeria
• Integrated social project impacting
Palm oil projects, Congo and Angola
Ongoing projects New developments
g p j p gagriculture, fishing and livestock
• 1988-2010 investments: $49m
• Benefits more than 500,000 people
• Supporting the creation of modern, large scale agriculture
• Reducing dependence on food imports
• Promoting non oil-linked economic activities
Rice and Manioca cultivation, Congo
• Focused local community projectsFocused local community projects
• Improves seed quality and agricultural techniques, building on Green River experience
Improving community relations at local level
10
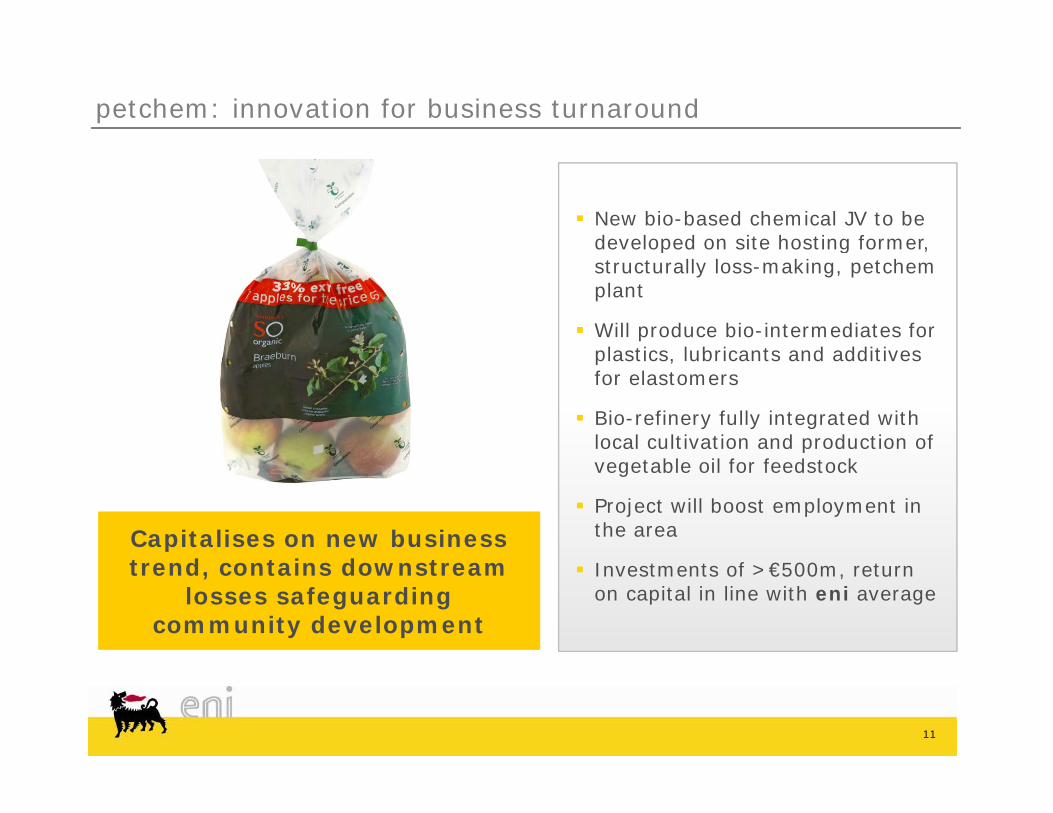
petchem: innovation for business turnaround
New bio-based chemical JV to be developed on site hosting former, p g ,structurally loss-making, petchemplant
Will produce bio-intermediates for plastics lubricants and additives plastics, lubricants and additives for elastomers
Bio-refinery fully integrated with local cultivation and production of
bl l f f d kvegetable oil for feedstock
Project will boost employment in the areaCapitalises on new business
t d t i d t Investments of >€500m, return on capital in line with eni average
trend, contains downstream losses safeguarding
community development
11
eni’s strategy and sustainable growtheni s strategy and sustainable growth
Claudio Descalzi, E&P COO,
eni.com
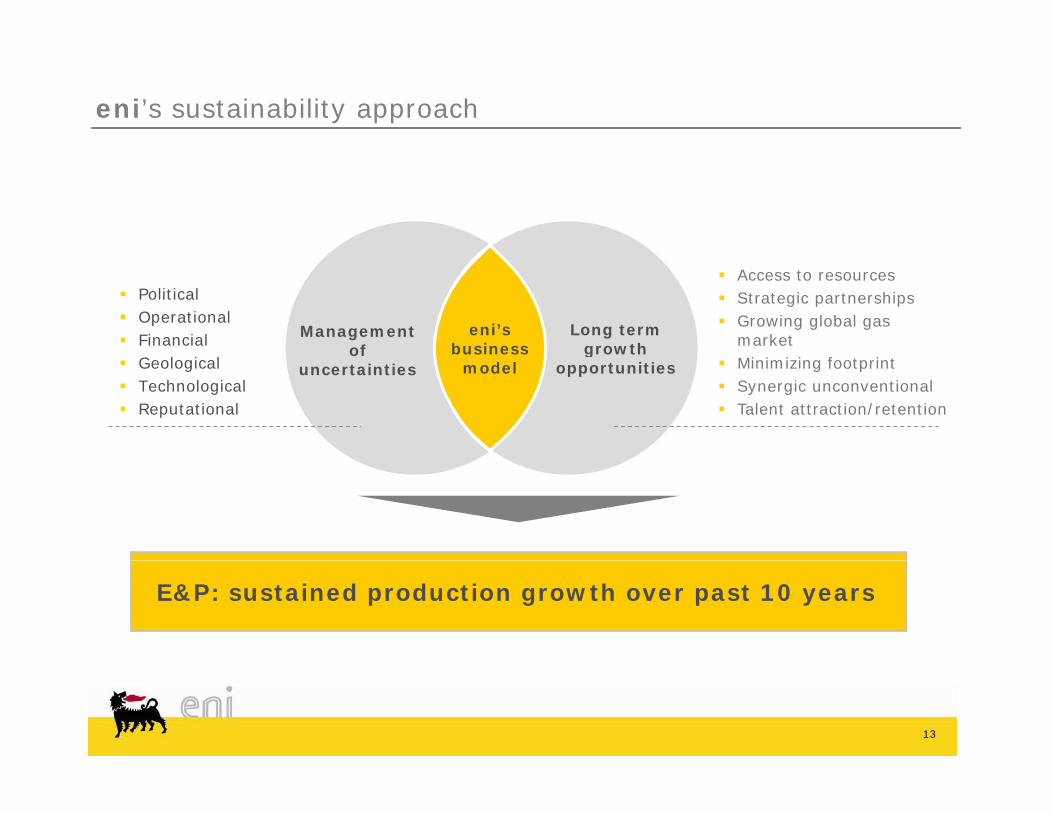
eni’s sustainability approach
Political Operational Financial
Access to resources Strategic partnerships Growing global gas
marketManagement of
Long term growth
eni’s business
Geological Technological Reputational
Minimizing footprint Synergic unconventional Talent attraction/retention
of uncertainties
gopportunitiesmodel
E&P: sustained production growth over past 10 years
13
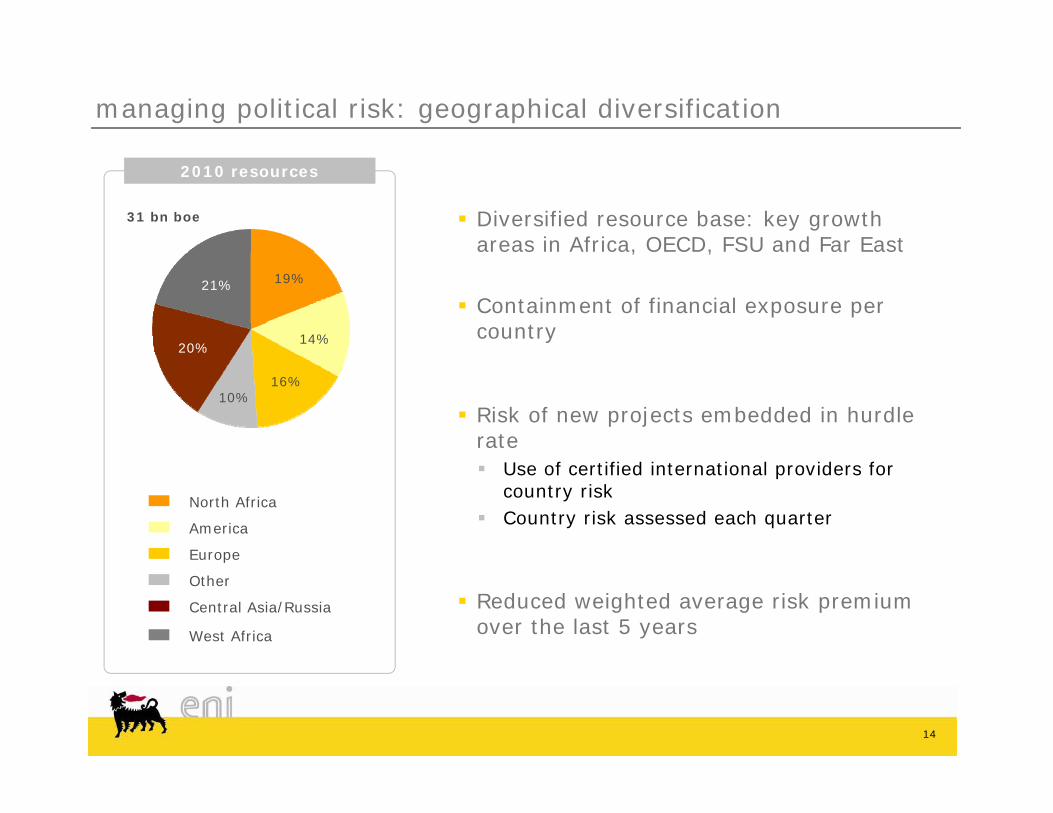
managing political risk: geographical diversification
2010 resources
31 bn boe Diversified resource base: key growth areas in Africa, OECD, FSU and Far East, ,
Containment of financial exposure per country
19%
14%20%
21%
Risk of new projects embedded in hurdle rate
16%10%
Use of certified international providers for country risk
Country risk assessed each quarterNorth Africa
America
Europe
Reduced weighted average risk premium over the last 5 years
p
Other
Central Asia/Russia
West Africa
14
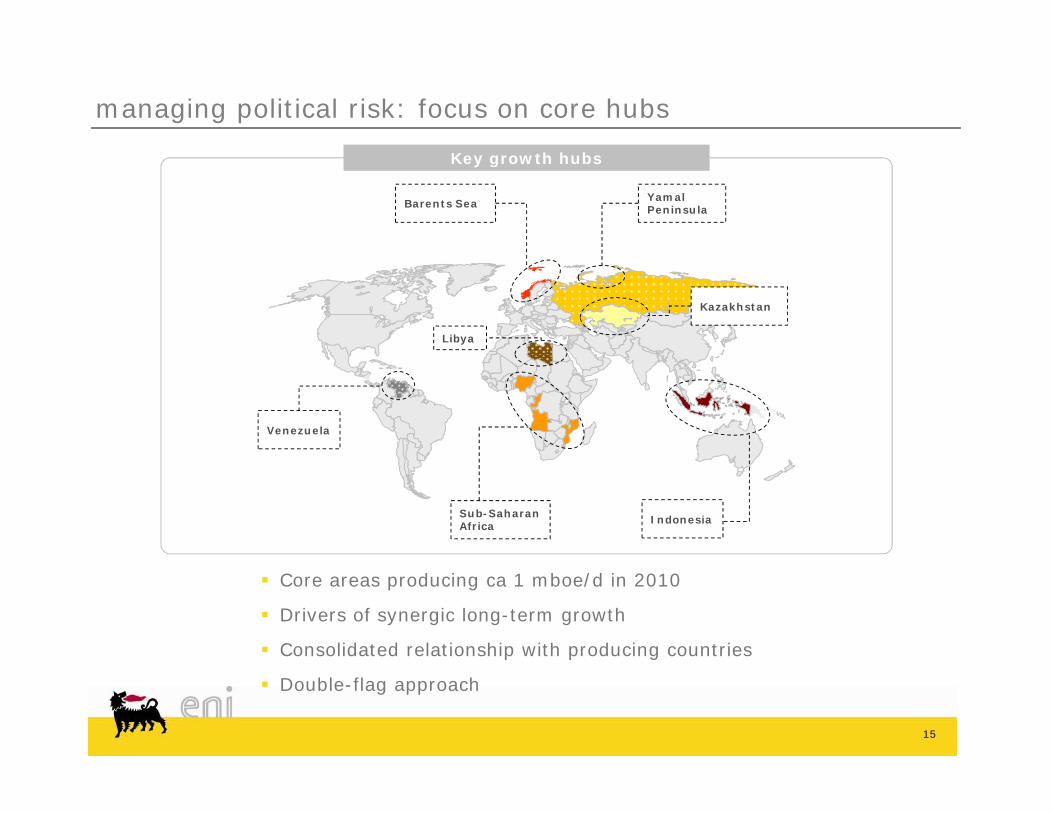
managing political risk: focus on core hubs
Key growth hubs
Barents Sea Yamal Peninsula
Kazakhstan
Libya
Venezuela
IndonesiaSub-Saharan Africa
Core areas producing ca 1 mboe/d in 2010
Drivers of synergic long-term growth
Consolidated relationship with producing countries
15
Double-flag approach
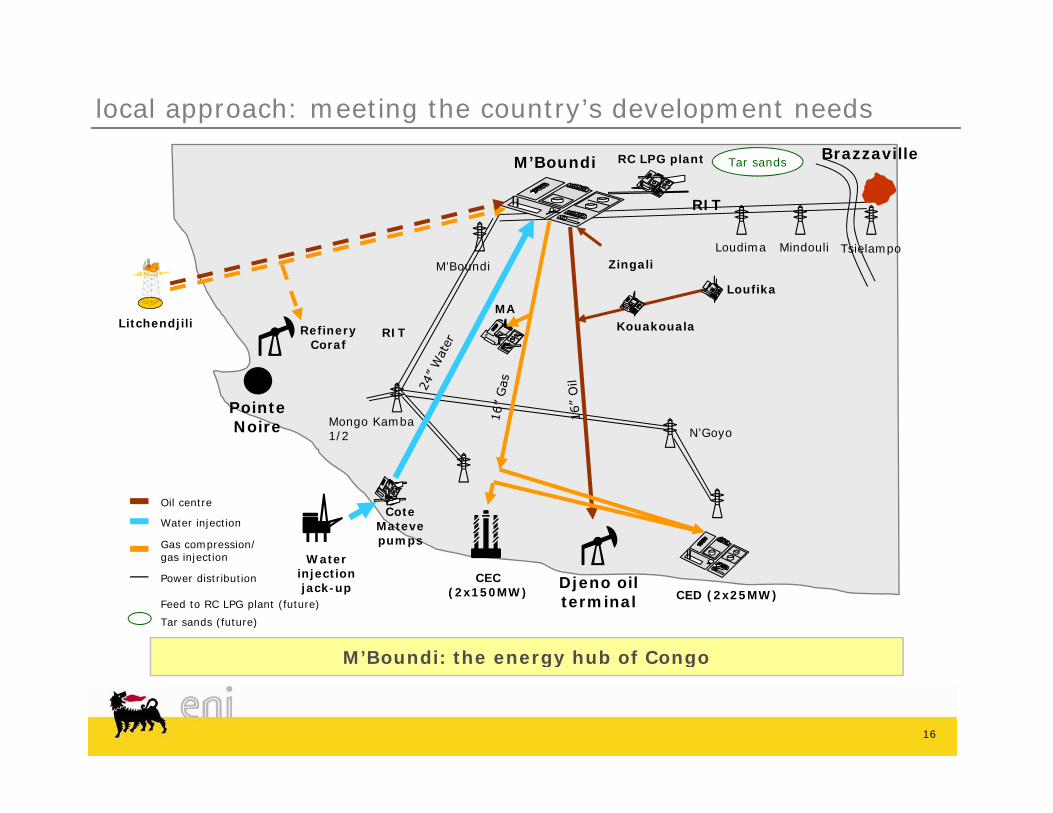
local approach: meeting the country’s development needs
Brazzaville
Mindouli
RIT
Loudima Tsielampo
M’Boundi BrazzavilleRC LPG plant Tar sands
RIT
M’Boundip
Zingali
Loufika
KouakoualaLitchendjili Refinery Coraf
MAG
N’GoyoMongo Kamba 1/2
Pointe Noire
Oil centre
Gas compression/ gas injection Water
Cote Mateve pumps
Water injection
Power distribution Djeno oil terminal CED (2x25MW)
CEC (2x150MW)
gas injection
Feed to RC LPG plant (future)
Tar sands (future)
Water injection jack-up
M’Boundi: the energy hub of Congo
16
M Boundi: the energy hub of Congo
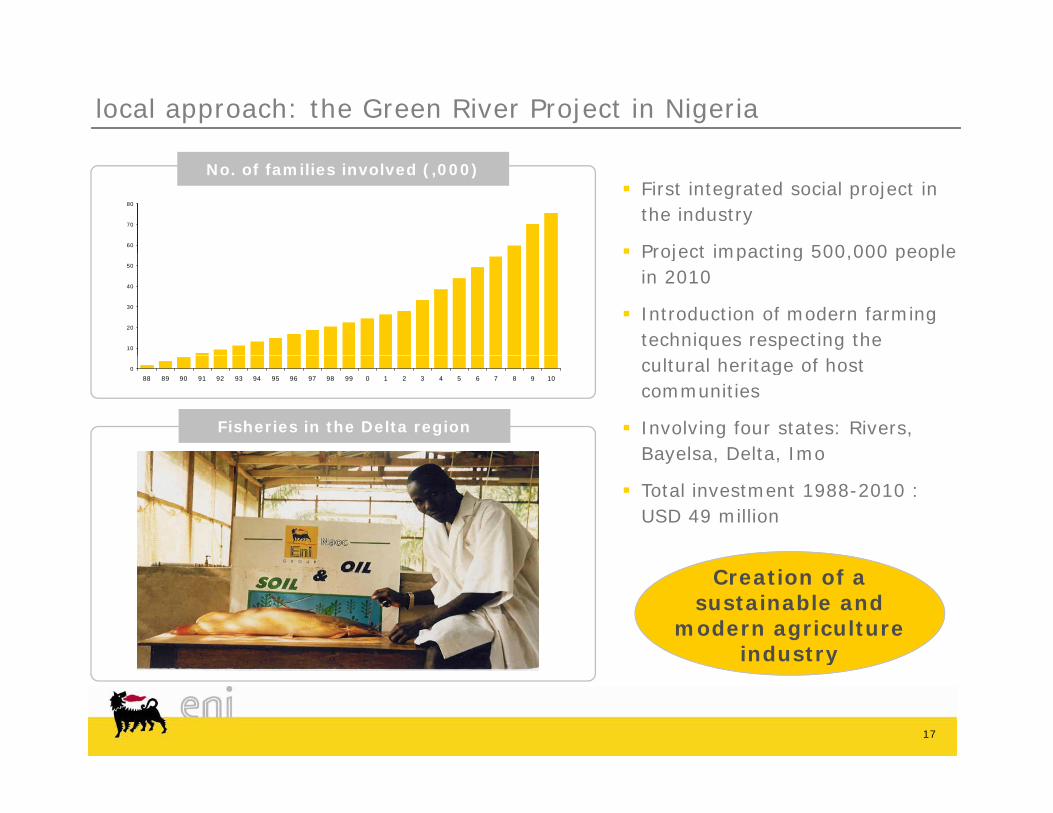
local approach: the Green River Project in Nigeria
First integrated social project in the industry
Project impacting 500 000 people
No. of families involved (,000)
60
70
80
Project impacting 500,000 people in 2010
Introduction of modern farming techniques respecting the
10
20
30
40
50
cultural heritage of host communities
Involving four states: Rivers, Bayelsa, Delta, Imo
0
88 89 90 91 92 93 94 95 96 97 98 99 0 1 2 3 4 5 6 7 8 9 10
Fisheries in the Delta region
Bayelsa, Delta, Imo
Total investment 1988-2010 : USD 49 million
Creation of a sustainable and
modern agriculture industry
17
y
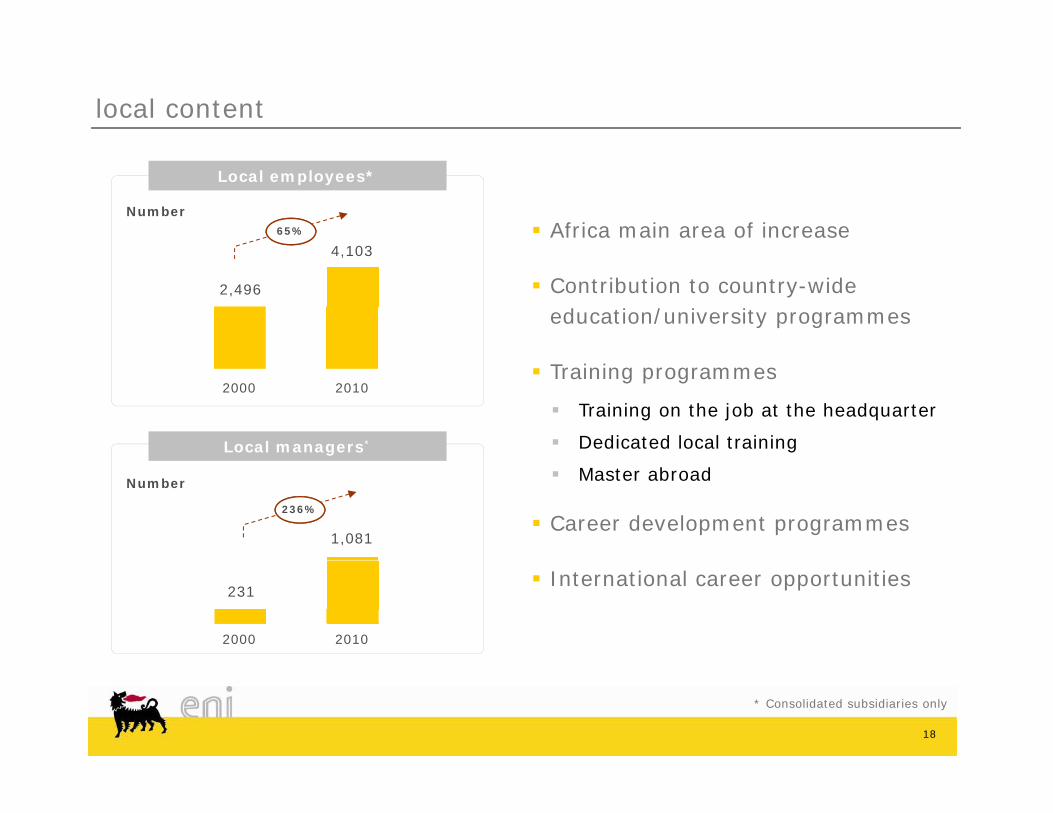
local content
Local employees*
Number
Africa main area of increase4 103
65%
Contribution to country-wide education/university programmes
2,496
4,103
Local managers*
Training programmes
Training on the job at the headquarter
Dedicated local training
2000 2010
Number Master abroad
Career development programmes1,081
236%
International career opportunities 231
2000 2010
18
* Consolidated subsidiaries only
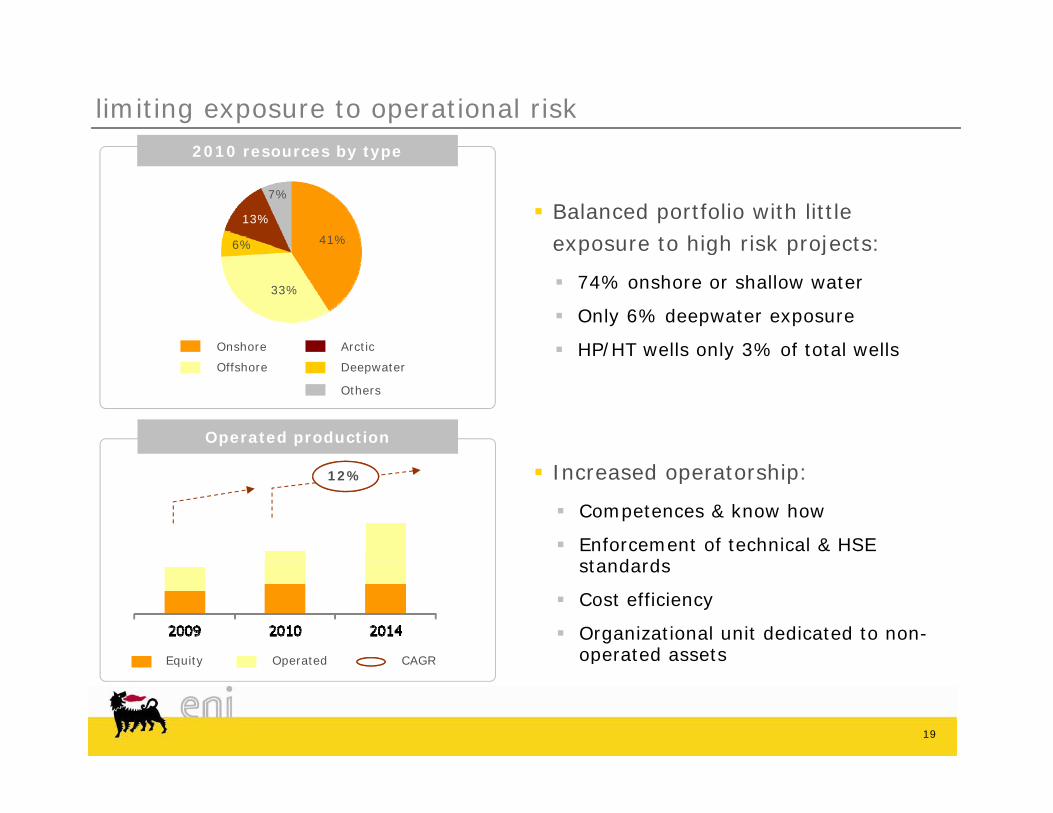
2010 resources by type
limiting exposure to operational risk2010 resources by type
Balanced portfolio with little exposure to high risk projects:41%6%
13%
7%
p g p j
74% onshore or shallow water
Only 6% deepwater exposure
HP/HT wells only 3% of total wellsOnshore Arctic
33%
HP/HT wells only 3% of total wells
Operated production
Others
Offshore Deepwater
12% Increased operatorship:
Competences & know how
Enforcement of technical & HSE t d dstandards
Cost efficiency
Organizational unit dedicated to non-operated assetsOperated Equity CAGR
19
pOperated Equity CAGR
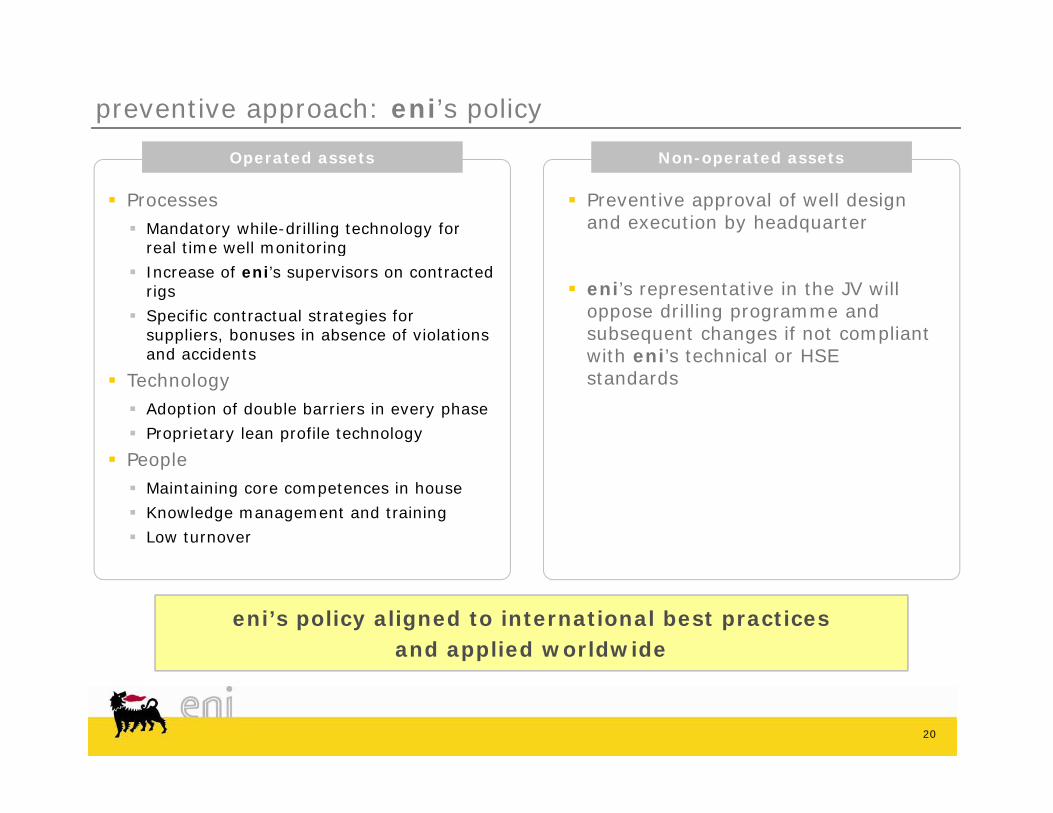
preventive approach: eni’s policy
Preventive approval of well design and execution by headquarter
Operated assets
Processes Mandatory while-drilling technology for
real time well monitoring
Non-operated assets
eni’s representative in the JV will oppose drilling programme and subsequent changes if not compliant with eni’s technical or HSE
real time well monitoring
Increase of eni’s supervisors on contracted rigs
Specific contractual strategies for suppliers, bonuses in absence of violations and accidents with eni s technical or HSE
standardsand accidents
Technology Adoption of double barriers in every phase
Proprietary lean profile technology
People People Maintaining core competences in house
Knowledge management and training
Low turnover
eni’s policy aligned to international best practicesand applied worldwide
20
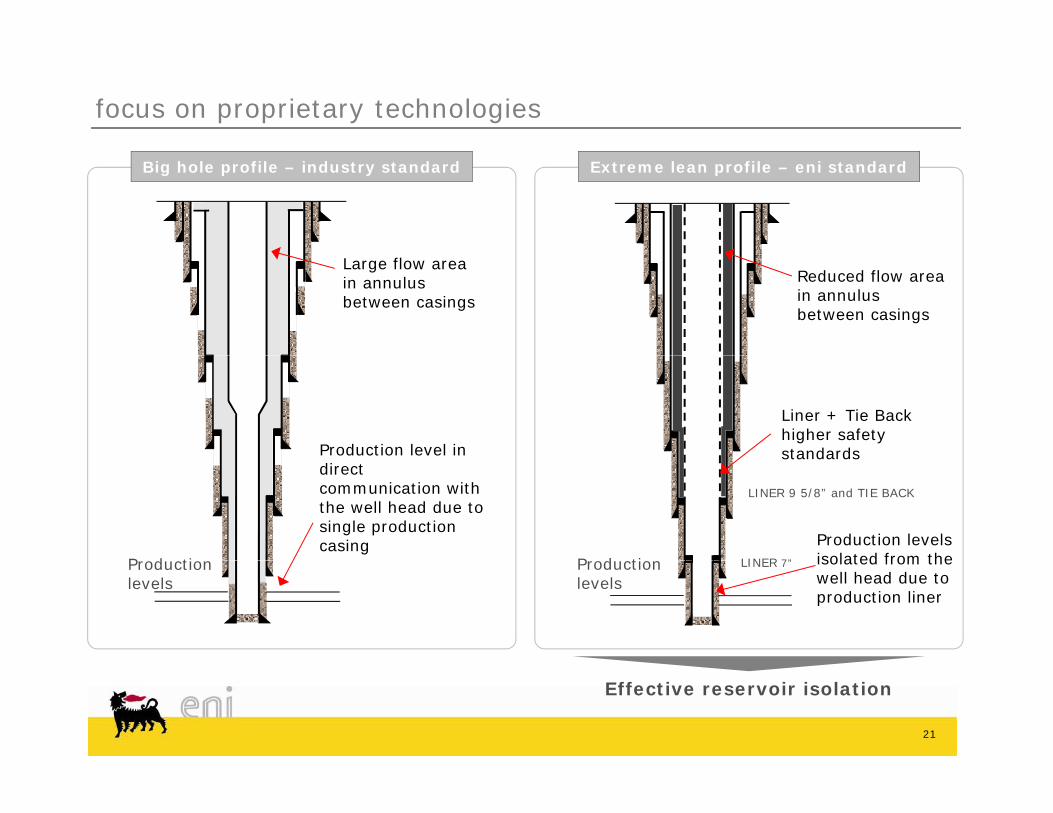
focus on proprietary technologies
Big hole profile – industry standard Extreme lean profile – eni standard
Large flow area in annulus between casings
Reduced flow area in annulus between casings
Production level in
Liner + Tie Back higher safety standards
P d ti
direct communication with the well head due to single production casing
LINER 7”
LINER 9 5/8” and TIE BACK
Production levels isolated from the
standards
P d ti Production levels
LINER 7” isolated from the well head due to production liner
Production levels
21
Effective reservoir isolation
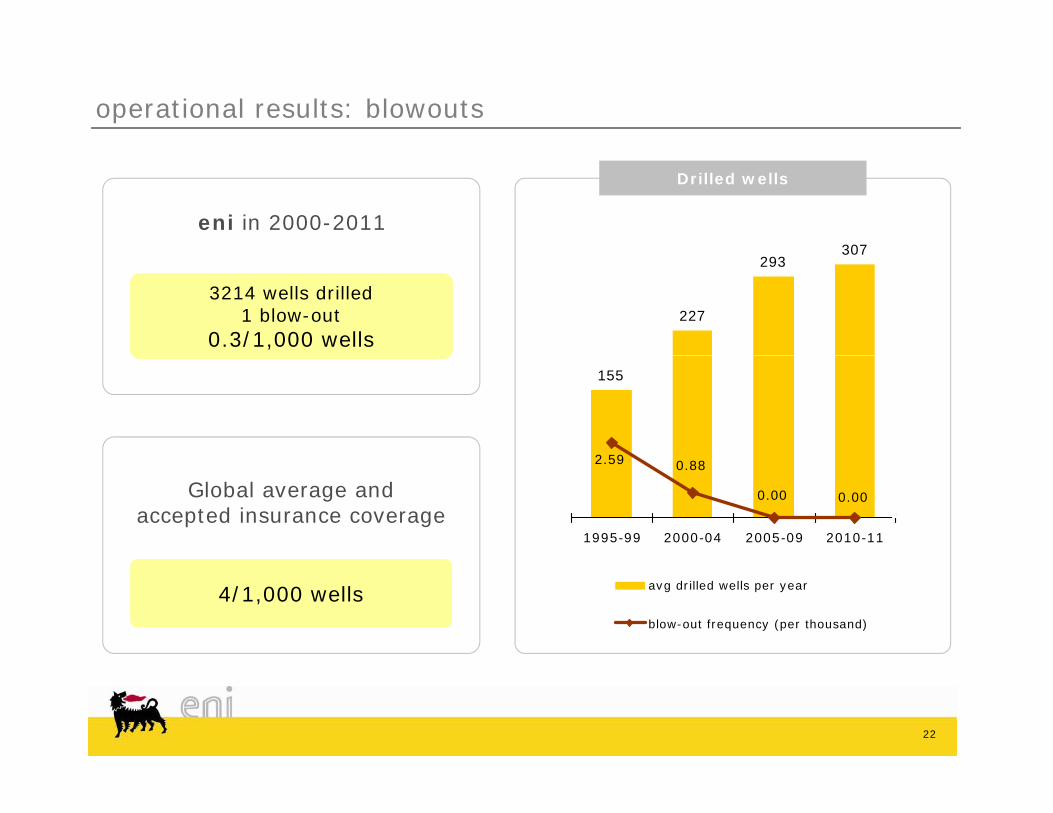
operational results: blowouts
eni in 2000-2011
Drilled wells
307
3214 wells drilled1 blow-out
0.3/1,000 wells
3214 wells drilled1 blow-out
0.3/1,000 wells227
293307
155
2 59
1995-99 2000-04 2005-09 2010-11
Global average and accepted insurance coverage
2.59 0.88
0.00 0.00
avg drilled wells per year
blow-out frequency (per thousand)
4/1,000 wells4/1,000 wells
22
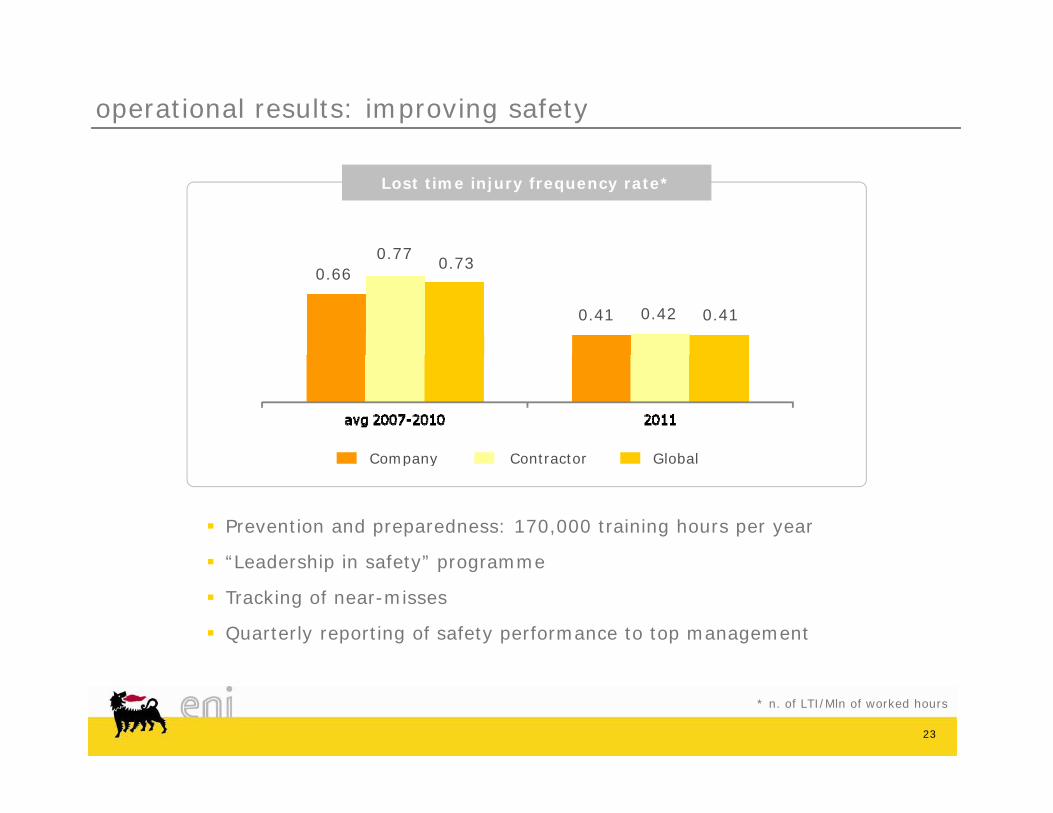
operational results: improving safety
Lost time injury frequency rate*
0 77
0.41 0.42 0.41
0.660.77
0.73
Company Contractor Global
Prevention and preparedness: 170,000 training hours per year
“Leadership in safety” programme
Company Contractor Global
Leadership in safety programme
Tracking of near-misses
Quarterly reporting of safety performance to top management
23
* n. of LTI/Mln of worked hours

operational results: low opex and efficient field management
OPEX*
10
10
Low depletion rate
8
9
8
9
6
7
7.0
6
7
4
55.4
5.7
4
5
2010 2011 2012 2013 2014
33
07-09 08-10 11-14E
Benchmark group**eni start-up production optimization
producing fields
24
* RDS n.a.** XOM, CVX, COP, BP, RDS, TOT, eni. Company data and Wood Mackenzie
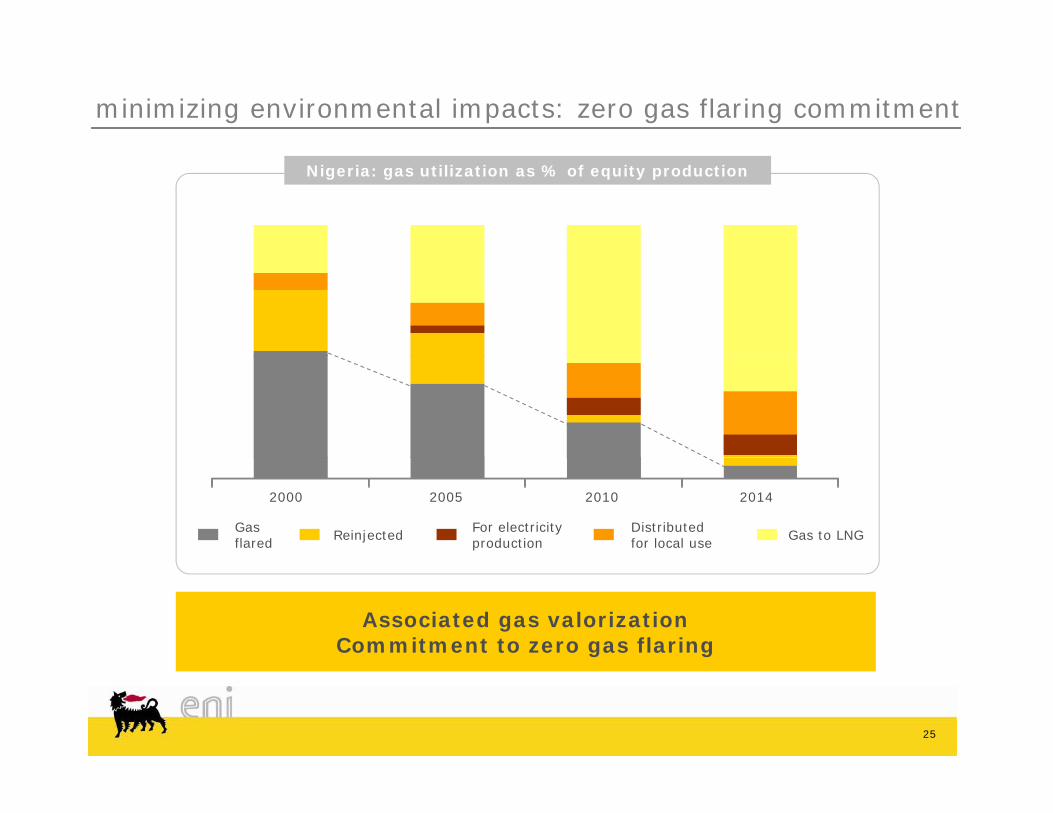
minimizing environmental impacts: zero gas flaring commitment
Nigeria: gas utilization as % of equity production
Gas flared Reinjected For electricity
productionDistributed for local use Gas to LNG
2000 2005 2010 2014
Associated gas valorizationCommitment to zero gas flaring
25

minimizing environmental impacts: water usage optimization
Re-injected water vs. total water produced
42% 41% 41%
40 41
59 60 59
35%33%
Re-injected production water
% of re-injected oil-linked water
2007 2008 2009 2010 2011 Jan-Oct
Water reinjection target: 62% of the total waterproduced by 2014
26
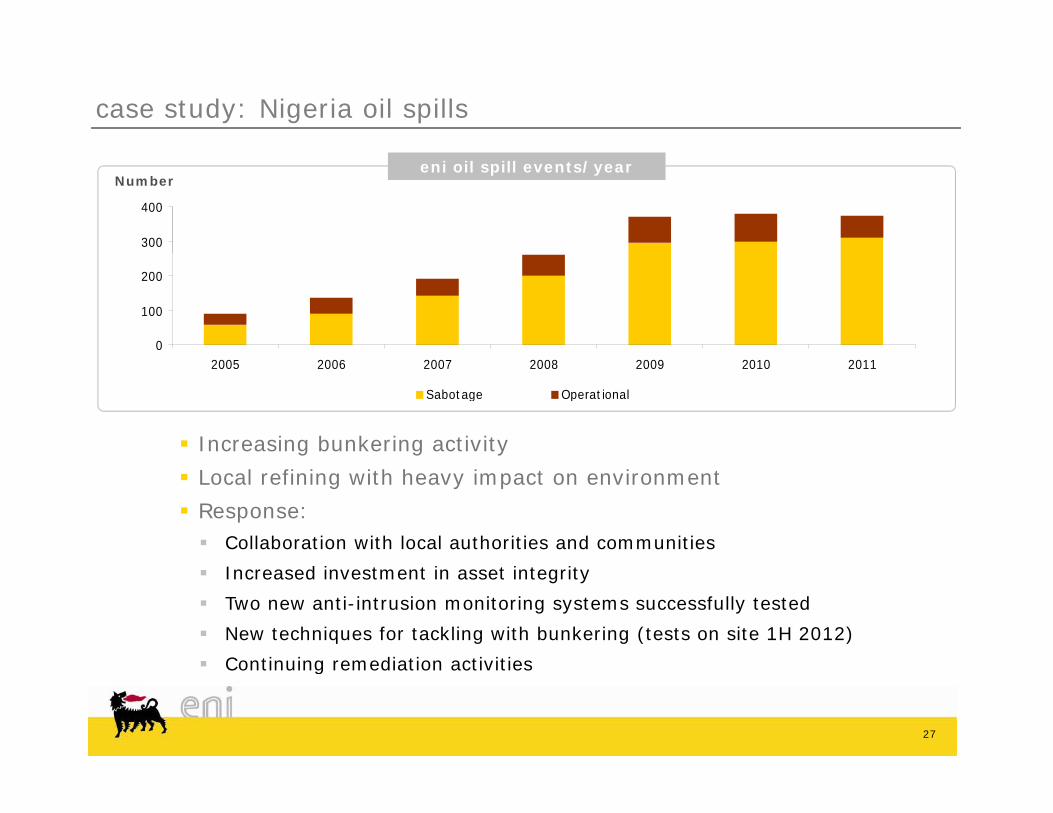
case study: Nigeria oil spills
300
400
eni oil spill events/yearNumber
0
100
200
Increasing bunkering activity
2005 2006 2007 2008 2009 2010 2011
Sabotage Operational
Local refining with heavy impact on environment
Response: Collaboration with local authorities and communities
Increased investment in asset integrity
Two new anti-intrusion monitoring systems successfully tested
New techniques for tackling with bunkering (tests on site 1H 2012)
Continuing remediation activities
27
Continuing remediation activities
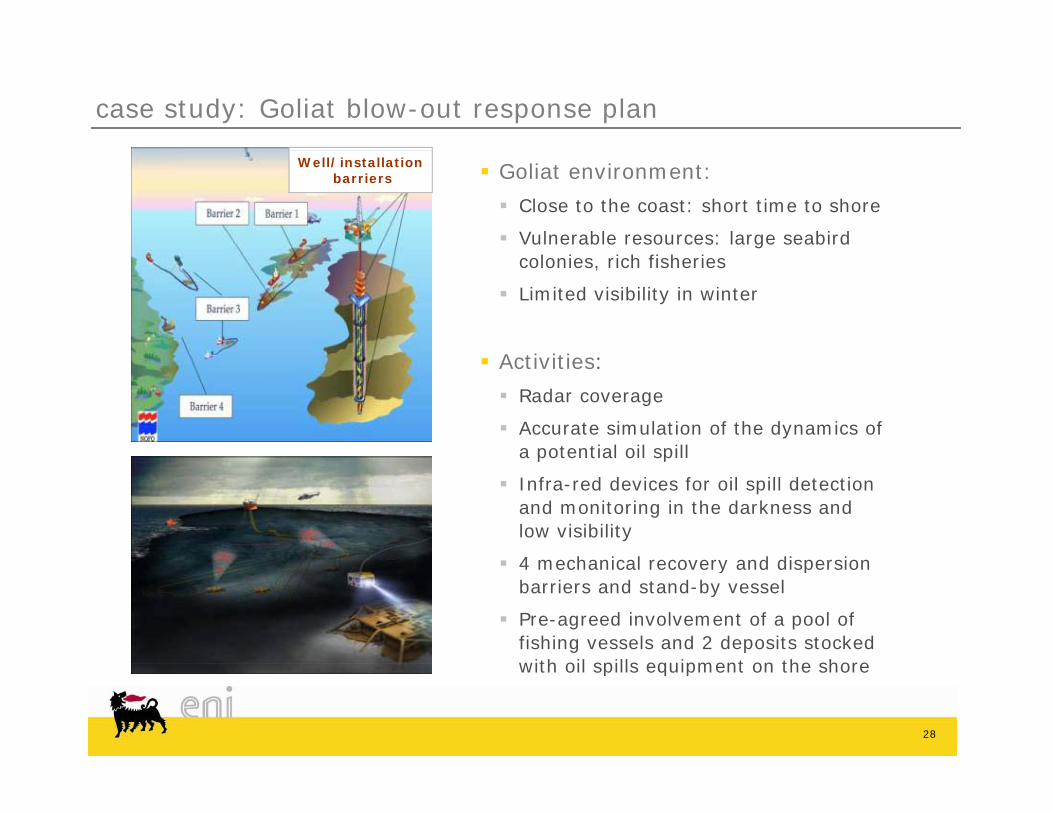
case study: Goliat blow-out response plan
Well/installationbarriers Goliat environment:
Close to the coast: short time to shore
Vulnerable resources: large seabird colonies, rich fisheries
Limited visibility in winter
A ti iti Activities:
Radar coverage
Accurate simulation of the dynamics of a potential oil spilla pote t a o sp
Infra-red devices for oil spill detection and monitoring in the darkness and low visibility
4 mechanical recovery and dispersion 4 mechanical recovery and dispersion barriers and stand-by vessel
Pre-agreed involvement of a pool of fishing vessels and 2 deposits stocked with oil spills equipment on the shore
28
with oil spills equipment on the shore
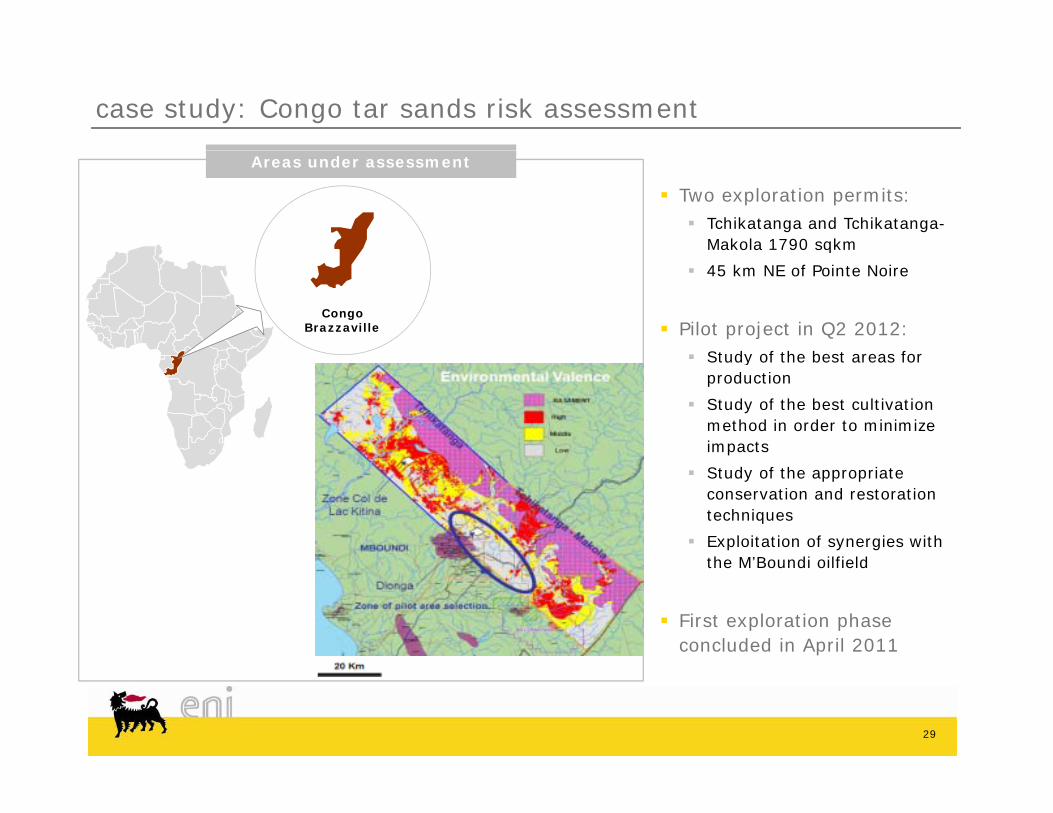
case study: Congo tar sands risk assessment
Two exploration permits: Tchikatanga and Tchikatanga-
Makola 1790 sqkm
Areas under assessment
q
45 km NE of Pointe Noire
Pilot project in Q2 2012: Study of the best areas for
CongoBrazzaville
Study of the best areas for production
Study of the best cultivation method in order to minimize impacts
Study of the appropriate conservation and restoration techniques
Exploitation of synergies with the M’Boundi oilfieldthe M Boundi oilfield
First exploration phase concluded in April 2011
29
eni’s strategy for the future: continuous improvement
Consistent focus on conventional assets and geographical diversification
Consolidation of community relations
Increased operatorship as a tool to contain risks
Continuous development of competences and technologies
Proactive attitude in implementing HSE throughout our operations
30
closing remarksclosing remarks
Paolo Scaroni, CEO,
eni.com

eni’s sustainability approach: the benefits
Access to resources Strategic partnerships
C ti l Exposure to growing gas market Maximising efficiency Synergic unconventional
Talent att action/ etention
Creating long-term growth opportunities
Talent attraction/retention
P li i l Political Financial Operational Environmental
Managing andmitigating risks Environmental
Geological Reputational
g g
32
Back up Back up
eni.com
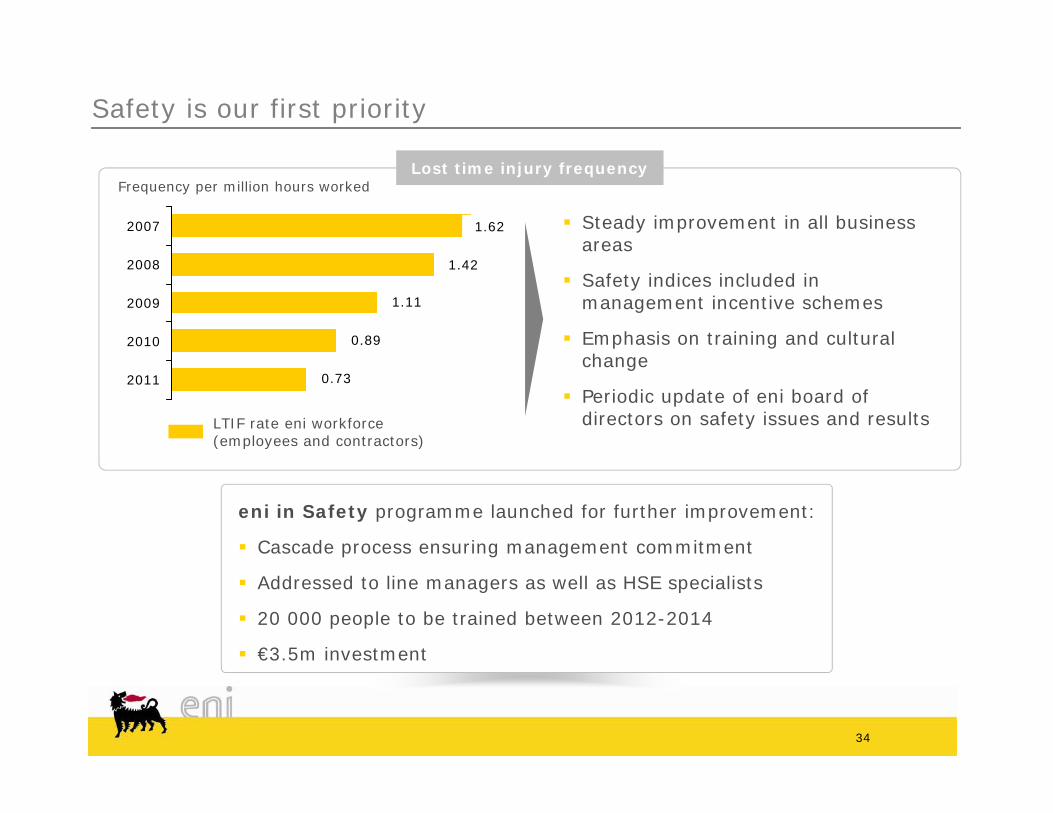
Safety is our first priority
1,62007
Lost time injury frequency
Steady improvement in all business areas
1.62
Frequency per million hours worked
0,9
1,1
1,4
2009
2008
2010
Safety indices included in management incentive schemes
Emphasis on training and cultural h
1.42
1.11
0.89
0,72011
LTIF rate eni workforce (employees and contractors)
change
Periodic update of eni board of directors on safety issues and results
0.73
eni in Safety programme launched for further improvement:
Cascade process ensuring management commitment
Addressed to line managers as well as HSE specialists
20 000 people to be trained between 2012-2014
€3.5m investment
34
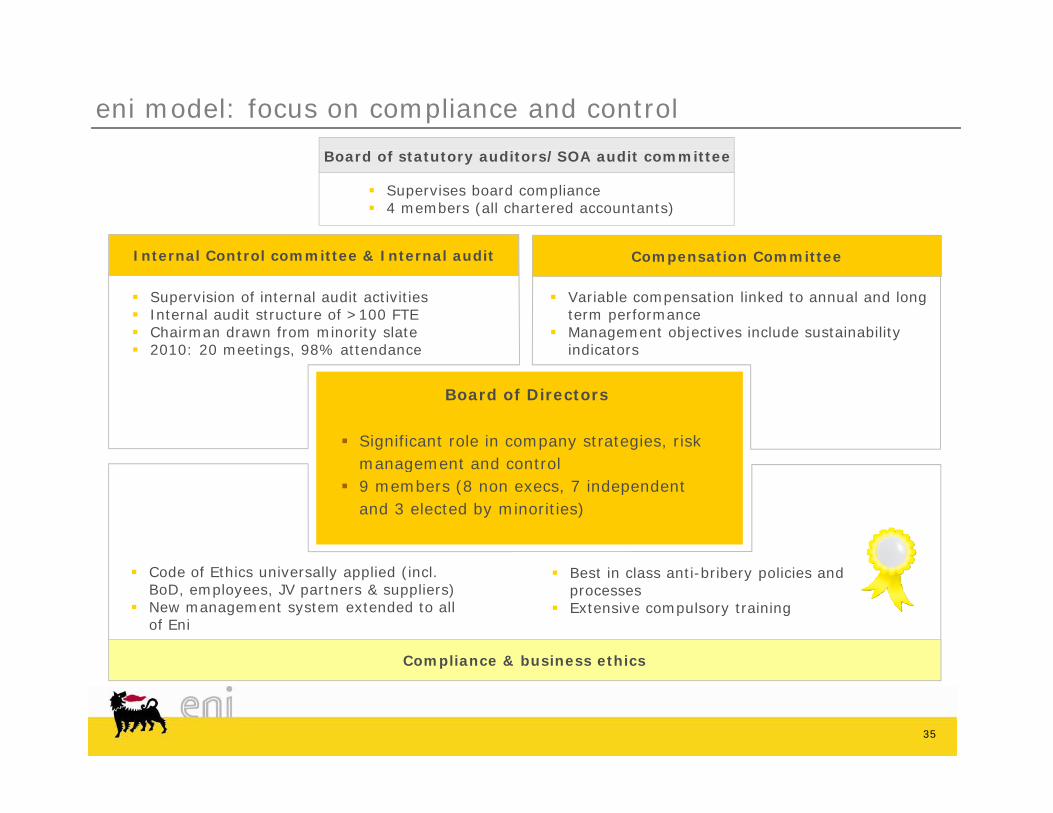
eni model: focus on compliance and control
Internal Control committee & Internal audit
Board of statutory auditors/SOA audit committee
Supervises board compliance 4 members (all chartered accountants)
C ti C ittInternal Control committee & Internal audit
Supervision of internal audit activities Internal audit structure of >100 FTE Chairman drawn from minority slate 2010: 20 meetings, 98% attendance
Variable compensation linked to annual and long term performance
Management objectives include sustainability indicators
Compensation Committee
g ,
Significant role in company strategies, risk t d t l
Board of Directors
management and control 9 members (8 non execs, 7 independent
and 3 elected by minorities)
Compliance & business ethics
Code of Ethics universally applied (incl. BoD, employees, JV partners & suppliers)
New management system extended to all of Eni
Best in class anti-bribery policies and processes
Extensive compulsory training
35
Compliance & business ethics