estimation of strong ground motions of the 9 august … · 2.5 km2 similar to the 2014 gokceada...
TRANSCRIPT

4. Uluslararası Deprem Mühendisliği ve Sismoloji Konferansı
11-13 Ekim 2017 – ANADOLU ÜNİVERSİTESİ – ESKİŞEHİR
1
Estimation of Strong Ground Motions of
the 9 August 1912 Murefte Earthquake (NW Turkey)
Ozlem KARAGOZ 1
, Kosuke CHIMOTO2 ,Hiroaki YAMANAKA
3 , Oguz OZEL
4 ,
Seckin Ozgur CITAK 5
1 Res.Asst. Dr.,Department of Geophysical Engineering, Canakkale Onsekiz Mart University, Canakkale, Turkey
Department of Environmental Science and Technology, Tokyo Institute of Technology, Interdisciplinary
Graduate School of Science and Engineering, Tokyo, Japan 2 Asst. Prof. Dr., Department of Environmental Science and Technology, Tokyo Institute of Technology,
Interdisciplinary Graduate School of Science and Engineering, Tokyo, Japan 3 Prof. Dr., Department of Environmental Science and Technology, Tokyo Institute of Technology,
Interdisciplinary Graduate School of Science and Engineering, Tokyo, Japan 4 Prof. Dr., Department of Geophysical Engineering, Istanbul University, Istanbul, Turkey
5 Dr. Researcher, Earthquake and Tsunami Forecasting System Research Group R&D Center for Earthquake
and Tsunami (CEAT), Japan Agency for Marine-Earth Science and Technology (JAMSTEC), Tokyo, Japan
Email: [email protected]; [email protected]
ABSTRACT:
The 9 August 1912 Murefte earthquake (Mw 7.3) occurred on the Ganos Fault in the North Anatolian Fault Zone
in the western Marmara Region (NW Turkey). The maximum intensity was X in the Medvedev-Sponheuer-
Karnik (MSK-1981) scale around the Ganos Fault. The 1912 Murefte earthquake was simulated by using 1D
velocity structures to determine the characteristic source model and to understand the near-fault ground motions.
The 1D deep velocity structures, especially shallower than 4-5 km, beneath the engineering bedrock with S-wave
velocity of 0.78 km/s at different azimuthal directions were determined by tuning and comparing the observed
group-velocity dispersion curves of Rayleigh and Love waves from the 2014 Gokceada main shock (Mw 6.9) in
the region (Karagoz et al., 2017). The characterized source model of the 1912 Murefte earthquake was defined
using previous studies. Two source models with two and three asperities on the ruptured fault area were
examined. The 1D simulation for the characterized source models were performed using the 1D velocity
structure at the strong motion sites. The PGV values of the surface ground motions were used to calculate
intensities by using the PGV-intensity relationship for Turkey to validate the models by comparing with
observed ones. The characteristic source model with three asperities is much appropriate for the 1912 Murefte
earthquake because the intensity differences are minimum at the sites. The estimated near-fault strong ground
motions indicate that characteristic of the spectral accelerations and velocities change according to the site
location respect to the location of fault and asperities.
KEY WORDS: 1912 Murefte earthquake, discrete wave number method, 1D simulation, 1D velocity structure,
strong ground motion.

4. Uluslararası Deprem Mühendisliği ve Sismoloji Konferansı
11-13 Ekim 2017 – ANADOLU ÜNİVERSİTESİ – ESKİŞEHİR
2
1. INTRODUCTION
The 9 August 1912 Murefte earthquake (Mw 7.3) occurred on the Ganos Fault in the NAFZ in the western
Marmara Region in Figure 1 (Altunel et al. 2004). A strong aftershock on 13 September 1912 (Mw 6.8) also
occurred near Saros Bay (Aksoy et al. 2010). The earthquake killed 2,800 and injured 7,000 people while about
12,600 houses were totally destroyed (Ambraseys and Finkel, 1987). The number of houses beyond repair was
12,100 and about 15,400 houses were seriously damaged. The large public buildings, mosques and churches
were destroyed in Gazikoy, Hoskoy, Murefte, Sarkoy.
Ambraseys and Finkel (1987) indicated that very high damage (intensity IX) was confined within a zone about
20 km wide and 100 km long, extending from SW of Tekirdag to Saros Bay (Figure 1). The maximum intensity
of the mainshock was X in the Medvedev-Sponheuer-Karnik (MSK-1981) scale around the Ganos Fault. The
intensity for Tekirdag and Canakkale cities was between IX and VIII. The rupture length of the mainshock is
uncertain. Previous studies suggested a wide range of rupture length from 56 to 150 km (Ambraseys and Jackson
2000; Altinok et al. 2003; Le Pichon et al. 2003; Altunel et al. 2004; Armijo et al. 2005; Aksoy et al. 2010). The
rupture was clearly observed on the land with a length of 45-50 km and extended in the Saros Bay in west and
the Marmara Sea in east (Figure 2). The ruptured part in the sea area is not clear. While Ambraseys and Jackson
(2000) calculated the total rupture length as 84 km using the seismic moment of the mainshock, Altınok et al.
(2003) found 56 km ruptured fault segment and its 15 km-part was in the Marmara Sea according to the field and
multibeam data. However, Aksoy et al. (2010) proposed that the rupture (120±30 km) extended to the center of
the Marmara Sea due to the results of the recent submarine studies (Figure 2). Coulomb stress change analyses
by Cakir et al. (2003) supports that the rupture should not be extent to the central Marmara and stopped south of
Tekirdag.
Figure 1. Isoseismal map and damage ratios (0-9) of the 1912 Murefte earthquake (digitized from Ambraseys and Finkel
1987). Red stars show the epicenters of the 1912 Murefte and 2014 Gokceada earthquakes. The background and asperity
areas of the mainshocks are shown with thick black and red lines, respectively. The selected AFAD stations and
microtremor array sites are shown with red triangles and yellow circles, respectively.
There were several displacement measurements along the Ganos Fault. Ambraseys and Finkel (1987) indicate a
right-lateral strike slip displacement up to 3 m. However, the most recent studies of Aksoy et al. (2010)

4. Uluslararası Deprem Mühendisliği ve Sismoloji Konferansı
11-13 Ekim 2017 – ANADOLU ÜNİVERSİTESİ – ESKİŞEHİR
3
combining with previous field data showed that the average slip was 2.5 m (maximum 5.4-5.5 m). They were
identified two sub-segments on the Ganos Fault from detail geological and paleoseismological field survey:
Yenikoy in west and Guzelkoy in east in Figure 2. The average slips on the Yenikoy and Guzelkoy segments
were 4.5 and 5 m, respectively. They observed step-over with only one slip measurement (~4 m) in the Kavak
village where the Ganos Fault enters the Saros Bay. Therefore, they mentioned another possible sub-segment as
called the Saros segment in the west that might be the location of the strong aftershock (Mw 6.8).
Figure 2. The 90 km ruptured-fault (black line) of the 1912 Murefte earthquake used in 1D simulation (top). The intensity
contours are shown with black lines. The sub-segments of the Ganos Fault determined from previous field studies are shown
utilizing Aksoy et al. (2010) (bottom). Possible asperity (ASP) areas used in the 1D simulation are labeled on the map and
their possible lengths are given. The red star shows the mainshock epicenter with focal mechanism solution. The sites that
have microtremor (MT) array observations are shown with yellow circles. The sites without MT observations are shown
with black squares.
In this study, the 1912 Murefte earthquake ground motions were simulated using the validated 1D velocity
structure. The two and three asperity source models were tested to find out a proper source model for the
mainshock. The PGV values of the synthetics at the seven AFAD stations were used to calculate intensities. The
calculated intensities were compared with the observations to decide the best source model. Finally, ground
motions were estimated in serious-damaged near-fault area.
2. DETERMINATION OF CHARACTERIZED SOURCE MODEL
Irikura and Miyake (2011) gave a recipe to characterize the source models of future earthquakes by combination
of outer, inner and extra fault parameters. The outer fault parameters of the 1912 Murefte earthquake (fault area,
seismic moment, strike, dip, and rake) were determined by using previous studies while the inner fault

4. Uluslararası Deprem Mühendisliği ve Sismoloji Konferansı
11-13 Ekim 2017 – ANADOLU ÜNİVERSİTESİ – ESKİŞEHİR
4
parameters (number of asperity and area, slip heterogeneity, average slip, effective stress drop) were estimated
by following the recipe utilizing previous studies. The extra fault parameters such as rupture starting point and
velocity, pattern of rupture propagation were defined to characterize the rupture nucleation and termination.
2.1 Outer Fault Parameters
The first step of the source definition was to identify the rupture length of the mainshock. The Guzelkoy,
Yenikoy and Saros segments of the Ganos Fault observed in the field surveys with maximum slip measurements
by Aksoy et al. (2010) are shown in Figure 2. The empirical equations given by Wells and Coopersmith (1994)
were used to estimate the fault length. The empirical relationships give 71 and 90 km surface and subsurface
rupture length, respectively, for a moment magnitude 7.3. Using the approach by Ohta et al. (1987), the
measured distance between the two ends of the intensity IX of the 1912 Murefte earthquake along the fault strike
is about 90 km (Figure 2) that is in agreement with the previous field surveys. The calculated subsurface length
(90±14 km) using the empirical equation of Wells and Coopersmith (1994) is also in good agreement with the
fault length measured from the intensity contour of IX along the strike. The width of the ruptured area (W) was
chosen 20 km according to the step-1 (L ≥ Wmax) in the recipe of Irikura and Miyake (2011) because the
rupture length is larger than the width of the seismogenic zone (Wmax=20 km by Karabulut et al. 2006).
The Ganos Fault trace observed on the surface indicates that the strike is 68° (Aksoy et al. 2010). Due to lack of
fault plane solution on the Ganos Fault, the dip and rake angles were used 90° and 180° for the right-lateral
strike-slip faulting (Figure 2). The background (BG) area was divided into 36 x 8 sub-faults with the size of 2.5 x
2.5 km2 similar to the 2014 Gokceada earthquake (Karagoz et al., 2017). Although the mainshock ruptured the
surface, the depth of the top of the BG was taken 4 km from the surface considering low-velocity sedimentary
layers in near-surface.
2.2 Inner Fault Parameters
The previous field surveys for slip distribution on the land given by Aksoy et al (2010) were used to define the
asperity areas because there is no information about slip distribution on the fault surface for this earthquake.
According to the defined fault segments on the Ganos Fault in Figure 2, two different source models were
generated. The Model A and Model B contains two and three asperities (ASP), respectively. The BG area
parameters were common in both models. The asperities of the Model A were located at the Guzelkoy (ASP-1)
and Yenikoy (ASP-2) sub-segments (Figure 2). The contour of intensity IX extends to southwest, therefore, one
more asperity was added for Model B. The third asperity was located in the Saros Bay to understand its effect on
the intensity values. The depths of the top of the asperities were 6.5 km utilizing the 2014 Gokceada earthquake
source model (Karagoz et al., 2017). We tried to keep the calculated slip values as close as the observed slip
measurements along the surface fault rupture by Aksoy (2010). The ratio of the area of the ASP to the BG was
also taken into account to be 22% and their average displacement ratio (Da/D) are 1.9-2.0 that is similar to the
ratio given by Dalguer et al. (2008) and the recipe of Irikura and Miyake (2011).
3. METHOD
An appropriate 1D velocity structure and a characterized source model (CSM) are necessary inputs for the
numerical 1D simulation. The 1D deep velocity structures, especially shallower than 4-5 km, beneath the
engineering bedrock with S-wave velocity of 0.78 km/s at different azimuthal directions were determined by
tuning and comparing the observed group-velocity dispersion curves of Rayleigh and Love waves from the 2014
Gokceada earthquake (Mw 6.9) in the region (Karagoz et al., 2017). The source parameters of the mainshock
were estimated in following ways based on previous studies about the 1912 Murefte earthquake and the strong
motion simulation recipe by Irikura and Miyake (2011). The Discrete Wave Number Method (Bouchon and Aki,
1977; Bouchon 1979, 1981) was used to obtain the response of the 1D deep velocity models.
4. Uluslararası Deprem Mühendisliği ve Sismoloji Konferansı
11-13 Ekim 2017 – ANADOLU ÜNİVERSİTESİ – ESKİŞEHİR
5
The S-wave velocity structures of shallow sedimentary layers down to the engineering bedrock were explored by
applying short-period microtremor array measurements on the different geological units in Tekirdag and
surrounding area by Karagoz et al. (2015). 1D linear amplifications of the shallow soil models were used to
estimate the surface motions from the engineering bedrock motions at the seven AFAD stations. The engineering
bedrock motions were filtered between 0.1 and 10 Hz, and their amplitude spectra were divided by two to omit
free-stress effect for input waves to the shallow soil models. Then, they were multiplied by the 1D site
amplification in the frequency domain. Finally, the inverse fast Fourier transform was applied to obtain the
surface motion in the time domain.
4. RESULTS
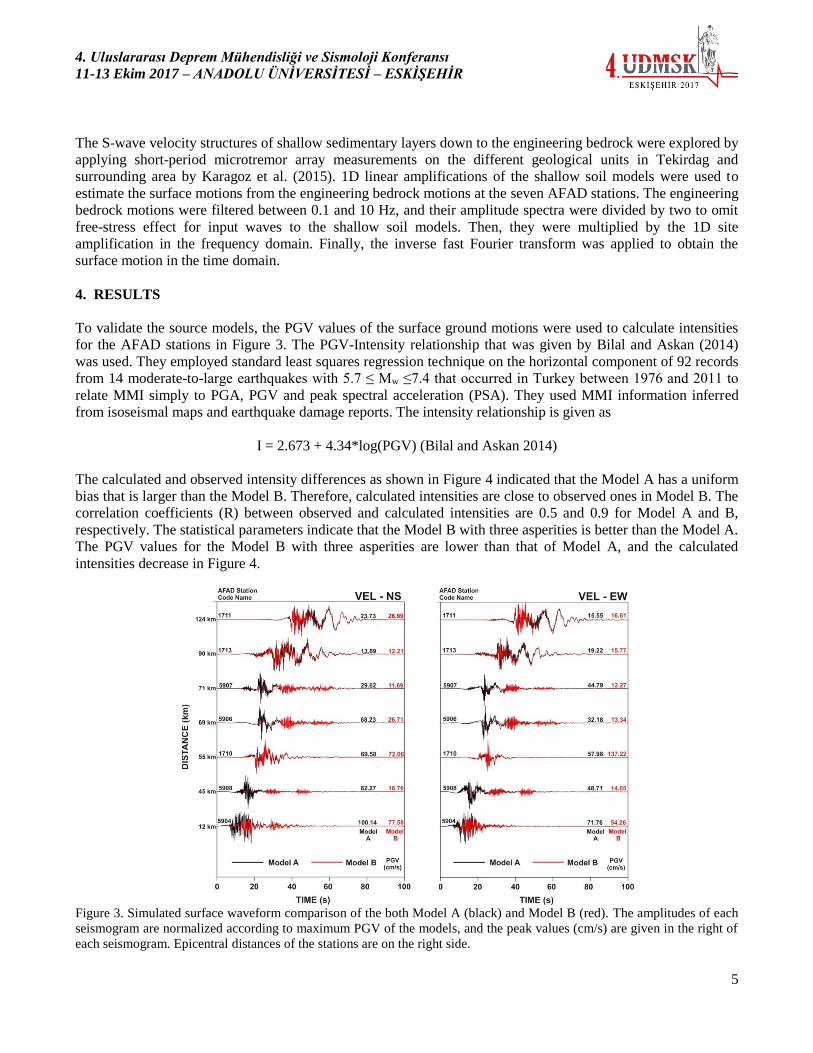
To validate the source models, the PGV values of the surface ground motions were used to calculate intensities
for the AFAD stations in Figure 3. The PGV-Intensity relationship that was given by Bilal and Askan (2014)
was used. They employed standard least squares regression technique on the horizontal component of 92 records
from 14 moderate-to-large earthquakes with 5.7 ≤ Mw ≤7.4 that occurred in Turkey between 1976 and 2011 to
relate MMI simply to PGA, PGV and peak spectral acceleration (PSA). They used MMI information inferred
from isoseismal maps and earthquake damage reports. The intensity relationship is given as
I = 2.673 + 4.34*log(PGV) (Bilal and Askan 2014)
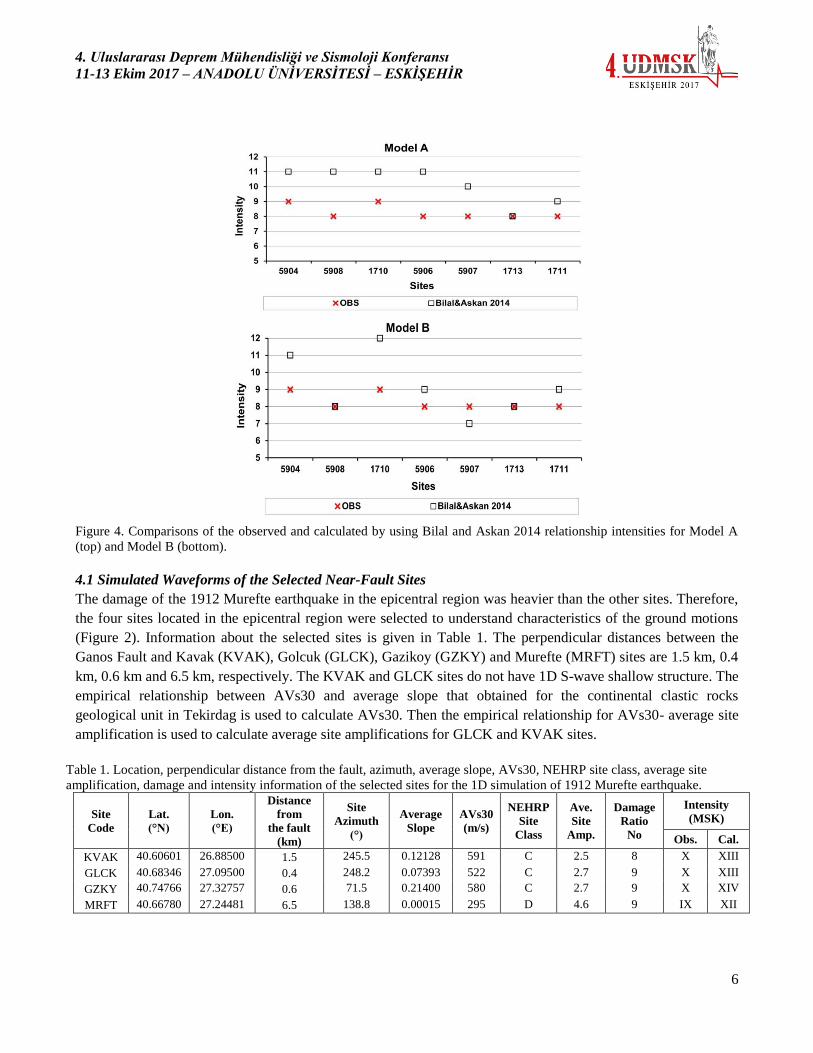
The calculated and observed intensity differences as shown in Figure 4 indicated that the Model A has a uniform
bias that is larger than the Model B. Therefore, calculated intensities are close to observed ones in Model B. The
correlation coefficients (R) between observed and calculated intensities are 0.5 and 0.9 for Model A and B,
respectively. The statistical parameters indicate that the Model B with three asperities is better than the Model A.
The PGV values for the Model B with three asperities are lower than that of Model A, and the calculated
intensities decrease in Figure 4.
Figure 3. Simulated surface waveform comparison of the both Model A (black) and Model B (red). The amplitudes of each
seismogram are normalized according to maximum PGV of the models, and the peak values (cm/s) are given in the right of
each seismogram. Epicentral distances of the stations are on the right side.
4. Uluslararası Deprem Mühendisliği ve Sismoloji Konferansı
11-13 Ekim 2017 – ANADOLU ÜNİVERSİTESİ – ESKİŞEHİR
6
Figure 4. Comparisons of the observed and calculated by using Bilal and Askan 2014 relationship intensities for Model A
(top) and Model B (bottom).
4.1 Simulated Waveforms of the Selected Near-Fault Sites
The damage of the 1912 Murefte earthquake in the epicentral region was heavier than the other sites. Therefore,
the four sites located in the epicentral region were selected to understand characteristics of the ground motions
(Figure 2). Information about the selected sites is given in Table 1. The perpendicular distances between the
Ganos Fault and Kavak (KVAK), Golcuk (GLCK), Gazikoy (GZKY) and Murefte (MRFT) sites are 1.5 km, 0.4
km, 0.6 km and 6.5 km, respectively. The KVAK and GLCK sites do not have 1D S-wave shallow structure. The
empirical relationship between AVs30 and average slope that obtained for the continental clastic rocks
geological unit in Tekirdag is used to calculate AVs30. Then the empirical relationship for AVs30- average site
amplification is used to calculate average site amplifications for GLCK and KVAK sites.
Table 1. Location, perpendicular distance from the fault, azimuth, average slope, AVs30, NEHRP site class, average site
amplification, damage and intensity information of the selected sites for the 1D simulation of 1912 Murefte earthquake.
Site
Code
Lat.
(°N)
Lon.
(°E)
Distance
from
the fault
(km)
Site
Azimuth
(°)
Average
Slope
AVs30
(m/s)
NEHRP
Site
Class
Ave.
Site
Amp.
Damage
Ratio
No
Intensity
(MSK)
Obs. Cal.
KVAK 40.60601 26.88500 1.5 245.5 0.12128 591 C 2.5 8 X XIII
GLCK 40.68346 27.09500 0.4 248.2 0.07393 522 C 2.7 9 X XIII
GZKY 40.74766 27.32757 0.6 71.5 0.21400 580 C 2.7 9 X XIV
MRFT 40.66780 27.24481 6.5 138.8 0.00015 295 D 4.6 9 IX XII
4. Uluslararası Deprem Mühendisliği ve Sismoloji Konferansı
11-13 Ekim 2017 – ANADOLU ÜNİVERSİTESİ – ESKİŞEHİR
7
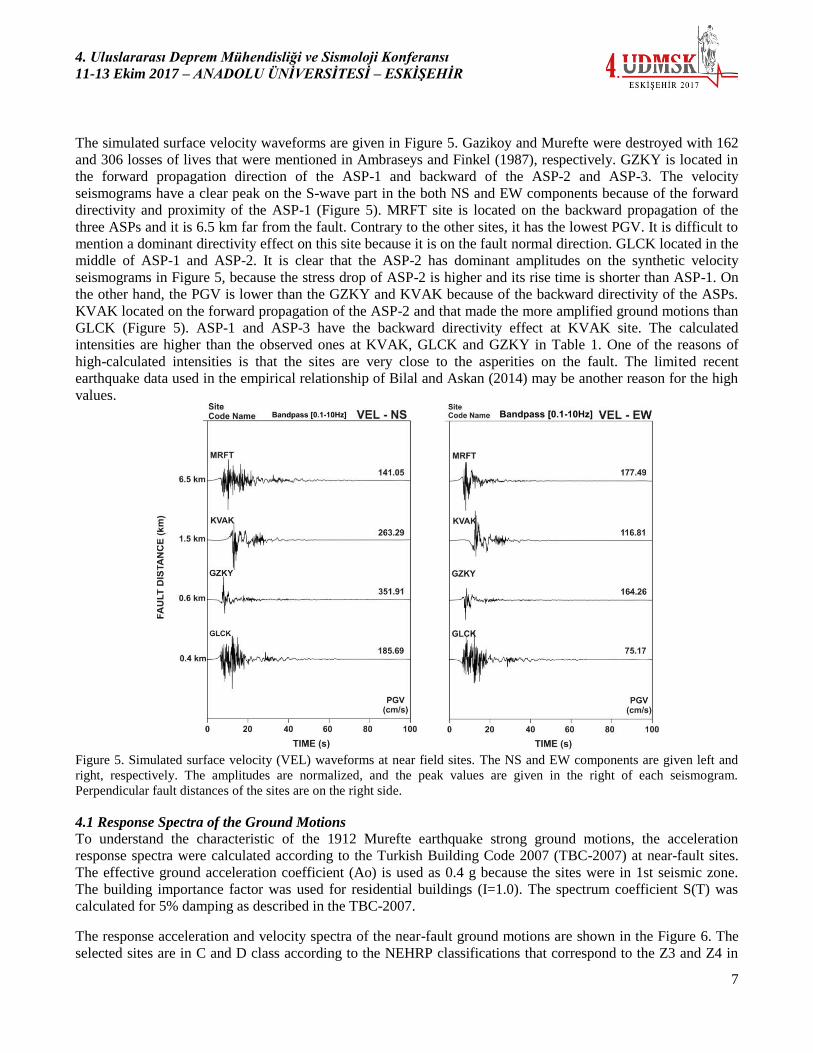
The simulated surface velocity waveforms are given in Figure 5. Gazikoy and Murefte were destroyed with 162
and 306 losses of lives that were mentioned in Ambraseys and Finkel (1987), respectively. GZKY is located in
the forward propagation direction of the ASP-1 and backward of the ASP-2 and ASP-3. The velocity
seismograms have a clear peak on the S-wave part in the both NS and EW components because of the forward
directivity and proximity of the ASP-1 (Figure 5). MRFT site is located on the backward propagation of the
three ASPs and it is 6.5 km far from the fault. Contrary to the other sites, it has the lowest PGV. It is difficult to
mention a dominant directivity effect on this site because it is on the fault normal direction. GLCK located in the
middle of ASP-1 and ASP-2. It is clear that the ASP-2 has dominant amplitudes on the synthetic velocity
seismograms in Figure 5, because the stress drop of ASP-2 is higher and its rise time is shorter than ASP-1. On
the other hand, the PGV is lower than the GZKY and KVAK because of the backward directivity of the ASPs.
KVAK located on the forward propagation of the ASP-2 and that made the more amplified ground motions than
GLCK (Figure 5). ASP-1 and ASP-3 have the backward directivity effect at KVAK site. The calculated
intensities are higher than the observed ones at KVAK, GLCK and GZKY in Table 1. One of the reasons of
high-calculated intensities is that the sites are very close to the asperities on the fault. The limited recent
earthquake data used in the empirical relationship of Bilal and Askan (2014) may be another reason for the high
values.
Figure 5. Simulated surface velocity (VEL) waveforms at near field sites. The NS and EW components are given left and
right, respectively. The amplitudes are normalized, and the peak values are given in the right of each seismogram.
Perpendicular fault distances of the sites are on the right side.
4.1 Response Spectra of the Ground Motions
To understand the characteristic of the 1912 Murefte earthquake strong ground motions, the acceleration
response spectra were calculated according to the Turkish Building Code 2007 (TBC-2007) at near-fault sites.
The effective ground acceleration coefficient (Ao) is used as 0.4 g because the sites were in 1st seismic zone.
The building importance factor was used for residential buildings (I=1.0). The spectrum coefficient S(T) was
calculated for 5% damping as described in the TBC-2007.
The response acceleration and velocity spectra of the near-fault ground motions are shown in the Figure 6. The
selected sites are in C and D class according to the NEHRP classifications that correspond to the Z3 and Z4 in

4. Uluslararası Deprem Mühendisliği ve Sismoloji Konferansı
11-13 Ekim 2017 – ANADOLU ÜNİVERSİTESİ – ESKİŞEHİR
8
TBC-2007. The spectral acceleration of the NS components of the selected sites is higher than the design
requirements between 0.1 and 3 s for the Z4 class defined in the TBC-2007. For the EW component, the upper
limit of this period range is about 1 s. The spectral accelerations of the all sites at low periods (0.15-0.60 s) are
also higher than the requirements of the TBC-2007 for Z2 and Z3 type of soil. GZKY shows high spectral
acceleration amplitude on the NS component, especially at low periods (high frequencies), due to the forward
propagation effect of the ASP-1. However, MRFT shows the lowest values for the same component while
highest spectra on EW component for the period range of 0.3 – 1 s. The results indicate that the location of the
sites respect to the fault and location of asperities are important on the spectral acceleration characteristics of the
ground motions.
Figure 6. Response acceleration and velocity spectra for the near-fault sites are given in (a) and (b) for both NS and EW components. The response acceleration design spectra according to the TBC-2007 are calculated for four different site class (Z1-4).
The response velocity spectra indicate higher amplitudes at GZKY (Figure 6b). GZKY that located almost on the
Ganos fault have higher spectral velocity than MRFT on NS component, while MRFT has high amplitudes over
the period of 0.3 s on the EW component (on the intermediate periods). On the other hand, MRFT has peak
spectral velocity at about 0.3 s and 0.3-0.6 s on the NS and EW components, respectively, due to high shallow
soil amplification factor of 4.6 at the predominant period of 0.38 s (2.6 Hz).
5. CONCLUSION S
The characteristic model with three asperities is much appropriate for the 1912 Murefte earthquake. The
damage of the 1912 Murefte earthquake in the epicentral region was heavier than the other sites. Therefore, the
four sites located in the epicentral region were selected to understand characteristics of the ground motions. The
results indicate that spectral acceleration characteristic change according to the site location respect to the
location of fault and asperities. The amplitudes of the spectra of the near-fault sites are higher than the limits of
the TBC-2007. The intermediate periods (0.5-1 s) of the ground motions are important to estimate the lateral
forces for the bridges and tall buildings. Therefore, further analyses may be useful for the planned Canakkale
1915 Bridge in Gelibolu (Canakkale) where is about 15 km far from the Ganos Fault Segment of the NAFZ.

4. Uluslararası Deprem Mühendisliği ve Sismoloji Konferansı
11-13 Ekim 2017 – ANADOLU ÜNİVERSİTESİ – ESKİŞEHİR
9
REFERENCES
Aksoy ME, Meghraoui M, Vallee M, Çakır Z (2010) Rupture characteristics of the A.D. 1912 Murefte (Ganos)
earthquake segment of the North Anatolian fault (Western Turkey). Geology 38:991-994.
Altınok Y, Alpar B, Yaltırak C (2003) Sarköy - Mürefte 1912 Earthquake's Tsunami, extension of the associated
faulting in the Marmara Sea, Turkey. J of Seismol 7:329-346.
Altunel E, Meghraoui M, Akyüz H S, Dikbas A (2004) Characteristics of the 1912 co-seismic rupture along the
North Anatolian Fault Zone (Turkey): implications for the expected Marmara earthquake.Terra Nova 16:198-
204.
Ambraseys N, Jackson J (2000) Seismicity of the Sea of Marmara (Turkey) since 1500. Geophys J Int 141:F1–6.
Ambraseys NN, Finkel CF (1987) The Saros-Marmara earthquake of 9 August 1912. Earthq Eng Struct D
15:189-211.
Ambraseys NN, Finkel CF (1995) The Seismicity of Turkey and Adjacent Areas - A Historical Review, 1500–
1800. M. S. Eren Publications and Books, Istanbul.
Armijo R, Pondard N, Meyer B, Uçarkus G, Lepinay B M, Malavieille J, Dominguez S, Gustcher M A, Schmidt
S, Beck C, Çagatay N, Çakir Z, Imren C, Eris K, Natalin B, Özalaybey S, Tolun L, Lefevre I, Seeber L,
Gasperini L, Rangin C, Emre O, Sarikavak K (2005) Submarine fault scarps in the Sea of Marmara pull- apart
(North Anatolian Fault): Implications for seismic hazard in Istanbul. Geochem Geophy Geosy 6:Q06009.
Bilal M, Askan A (2014) Relationships between Felt Intensity and Recorded Ground-Motion Parameters for
Turkey. Bull Seismol Soc Am 104:484-496.
Bilal M, Askan A (2014) Relationships between Felt Intensity and Recorded Ground-Motion Parameters for
Turkey. Bull Seismol Soc Am 104:484-496.
Bouchon M (1979) Discrete Wavenumber Representation of Elastic Wave Fields in Three-space Dimensions.J
Geophys Res 84; 3609–3614.
Bouchon M (1981) A Simple Method to Calculate Green’s Functions in Elastic Layered Media. Bull Seismol
Soc Am 71: 959–971.
Bouchon M., Aki K. (1977) Discrete Wave number Representation of Seismic Source Wave Fields. Bull
Seismol Soc Am 67:259–277.
Cakır Z, Barka A, Chabalier J B, Armijo R, Meyer B (2003) Kinematics of the November 12, 1999 (Mw=7.2)
Düzce Earthquake Deduced from SAR Interferometry. Turk J Earth Sci 12: 105-118.
Dalguer LA, Miyake H, Irikura K (2004) Characterization of dynamic asperity source models for simulating
strong ground motions. Proceedings of the 13th World Conference on Earthquake Engineering, No 3286.
Irikura K, Miyake H (2011) Recipe for predicting strong ground motion from crustal earthquake scenarios. Pure
Appl Geophys 168:85–104. doi:10.1007/s00024-010-0150-9.
Karabulut H, Roumelioti Z, Benetatos, C, Komec Mutlu A, Ozalaybey S, Aktar M, Kiratzi A (2006) A source
study of the 6 July 2003 (Mw 5.7) earthquake sequence in the Gulf of Saros (Northern Aegean Sea):
Seismological evidence for the western continuation of the Ganos fault. Tectonophysics 412:195-216
Karagoz O, Chimoto K, Citak S, Ozel O, Yamanaka H, Hatayama K (2015) Estimation of shallow S-wave
velocity structure and site response characteristics by microtremor array measurements in Tekirdag region,
NW Turkey. Earth Planets Space 67:176. doi: 10.1186/s40623-015-0320-1.
Karagoz O., Kosuke C., Yamanaka H., Ozel O., Citak S. Broadband Ground-Motion Simulation of the 24 May
2014 Gokceada (North Aegean Sea) Earthquake (Mw 6.9) in NW Turkey Considering Local Soil Effects.
Bulletin of Earthquake Engineering (revised 2017June).
Le Pichon X, Rangin N, Chamot-Rooke C, Sengör AMC (2003) The North Anatolian fault in the Sea of
Marmara. J Geophys Res 108:2179-2179.
Ohta Y, Ohashi H, Ergünay, Tabban A (1987) Seismic Intensity and its Applications to Engineering: A Study in
Turkey. In Strong Ground Motion Seismology, eds Erdik M O and Toksoz M N, p: 385-401.
TBC (2007) Specification for Buildings to be Built in Seismic Zones (Turkish Earthquake Building Code) 2007,
The Official Gazette of Turkey, 6 March 2007, No: 26454.