evolutionary computing strategies for gene selection
TRANSCRIPT

International Journal of Computer Trends and Technology (IJCTT) – volume 4 Issue 6–June 2013
ISSN: 2231-2803 http://www.ijcttjournal.org Page 1852
Evolutionary Computing Strategies for Gene Selection
Meena Moharana1, Kaberi Das2, Debahuti Mishra3 1, 2, 3 Institute of Technical Education and Research,SOA University
Bhubaneswar, Odisha, India
Abstract— Recently evolutionary optimization techniques put a greater impact on the ongoing research field over microarray gene expression dataset. Finding the gene subset of microarray data is a big issue which will help in reducing the time complexity as well as gives relevant chromosome subset that helps in solving many classical as well as NP-hard problem. In this research, an efficient clustering technique has been used to finds the chromosome subset. Here two clustering technique i.e k-means clustering and hierarchical clustering techniques are used to have the clusters upon which two evolutionary algorithm i.e an efficient genetic algorithm (GA) and memetic algorithm (MA) has been applied. This produces the result in terms of new offspring for next generation and check whether the produced gene subset is best suited for next generation or not. The accuracy can be measured for the subset of gene expression data. Keywords—clustering, k-means clustering, hierarchical clustering, evolutionary algorithm.
I. INTRODUCTION The clustering methods have greater impact on evolutionary optimization techniques. The aim of clustering method is to divide the dataset into groups known as cluster. Clustering analysis has been widely used in the analysis of gene expression data. The role of cluster analysis in gene research is as follows: first, similar gene expression patterns may hold the same function. Thus, the function of genes can be predicted using gene with known functions in the same clustering category [1-2]; second, genes with similar expression patterns are likely in the same cellular process. Therefore, clustering result can help the study of regulation and control mechanism of gene regulatory network [3].
Clustering technique has been grouped in to three categories named as hierarchical clustering; partitioned clustering and density based clustering (DBCSAN). Hierarchical clustering algorithm is the most familiar method for biologist. The hierarchical [4] method takes each object as distinct cluster and puts the closet object together into one cluster. Partitions clustering technique constructs various partitions and evaluate them based upon some criterion. k-means clustering, k -medoied clustering are of portioned based clustering technique. Among them k-means clustering technique is a popular clustering technique. It needs to provide
clustering category in advance [1-5]. DBCSAN is the clustering technique, which partition the data in order to reduce the search space of the neighbourhoods. It detects arbitrary shaped clusters as dense region of objects in the data space which are separate by low density region [6].
Clustering evolution is the change in the inherited characteristics of biological populations over successive generations. Evolutionary process gives rise to diversity at every level of biological organization, including species, individual organisms and molecules such as DNA and protein [7]. Charle Darwin and Aferred Wallace were the 1st to formulate a scientific argument for the theory of evolution by means of natural selection. In 1920s and 1930s a modern evolutionary synthesis connected natural selection, mutation theory ad Mendelian inheritance in to unified theory that applied to any branch of biology [7].
At the turn of 20th century pioneers in the field of population generation of evolution on to a robust statistical philosophy. The false contradiction between Darwin’s theory genetic mutation and Mendelian inheritance was thus reconciled. There are the different types of evolutionary algorithms presents for the application in engineering field as well in the field of bio-medical studies. Genetic algorithm (GA), first developed by Holland [8] is biologically inspired and embodies many mechanisms minimizing natural evolution.GA is an evolutionary optimizer that takes a sample of possible solution (individual) and employs mutation , crossover and selection as the primary operators for optimization[9]. Memetic Algorithm (MA), are inspired by Dawkin’s [10] nation of a meme. A meme is a cultural gene and in contrast to genes, memes are usually adapted by the people who transmit the before they are passed to the next generation [11]. MA takes all the possible samples and employs global search, crossover, mutation, local search over the dataset to get best gene subset. MAs are known to exploit the correlation structure of the fitness landscape of combinatorial optimization problem [11-12].
II. BACKGROUND STUDY
The problem of finding a relevant gene subset from any microarray dataset is a critical issue. Cuizhen et al. [13] applied an improved k-means clustering method to GA for chromosomes encoding and randomly choose initial clustering centres to form chromosome among samples. Though, the
International Journal of Computer Trends and Technology (IJCTT) – volume 4 Issue 6–June 2013
ISSN: 2231-2803 http://www.ijcttjournal.org Page 1853
cluster centre number i.e. k is hard to determine, the cluster centre can be taken randomly. Pingping sun et al. [14], used the k-means clustering to predict the protein-protein interactions. The k-means clustering was improved to make it more effective in the analysis of protein phylogentic profile, which focuses on the improvement of k-means clustering and enhance the accuracy of prediction of protein structure. Md. Kamrul Islam and Madhu chetty [15] combined the clustering technique with MA to improve the protein structure prediction through a novel initial population and tried to avoid the processing of unnecessary individuals in the population dataset. The efficiency of meme generation technique and meme replacement technique had been discussed through proposed clustered MA. Williom A. Greene [16] proposed hierarchical algorithm which is based on distance between data elements and creates centroid, when it apply on evolutionary concept i.e. GA give better result the clusters on microarray data give more accurate cluster depending upon the centre of cluster. Satish Gajawada and Durga Toshriwal [17] applied the hierarchical clustering on GA to enhance the accuracy of classification technique. They have combinely use the clustering technique and classification technique for the diagnosis of diabetic dieses. By the use of both the technique misclassified instances has been removed which leads to better accuracy in terms of classification of data element. Wai-HoA et al. [18] suggested that clustering the large dataset having the number of attribute and instances can be reduced in terms of dimension. It gives the smaller subset of original one which is having only the meaningful data and the subset helps in selecting and grouping the relevant genes with other inter dependent genes.
III. PRELIMINARY CONCEPTS A) Hierarchical Clustering
Hierarchical clustering gives the output in a tree like or hierarchical manner. The elements or object of the data set represents as an individual or distinct cluster and put the object on the basis of distance in to the clusters. It follows some rules while clustering. If below data is deleted then copy the cluster index of below gene to the above gene else vice versa. In this paper, we have clustered the gene expression microarray data set by hierarchical clustering. First, the distance between one object to the other has been calculated and according to the distance measure, the clusters have been formed. Here, the Euclidian distance measure method used to calculate the distance of each object to other to form the clusters. If Ai and Aj are two genes and i, j ∈ {1, 2,…, p} and i≠j, then the Euclidian distance between Ai and Aj is shown in equation (1). Euclidian distance:
퐷(퐴푖,퐴푗) = ∑ (푊푖푘 − 푊푗푘) ² (1)
Hierarchical clustering requires a measure of similarity between groups of data points like distance measure. The main
motto behind the use of hierarchical clustering to build a binary tree of the microarray data that successively merges the similar groups of points based upon distance measure.
B) k-means Clustering
It is one of the partition based clustering technique. The k-means clustering is a fast and efficient clustering method with a strong local search capability. It depends upon the initial cluster k and cluster centres c, the k can be determined through prior knowledge. In k-means algorithm, first, the k can be initialized randomly and the distance has been calculated then the centroid has been taken randomly in initial state and the smallest distance to the centroid can be measured by each gene. Accordingly on the basis of distance, new cluster groups have been created. And all the steps have been repeated till there no further change in group found out. Due to the efficient local search capability, this technique has been used combinely in GA and MA. It helps in finding the local optimum subset of relevant gene. At each iteration, the new centroid as bar center is found out. After the new centroid, a new binding has to be done between the same data point and nearest new centroid. This loop has been carried out till no new group formed. The output will be a set of k clusters that minimizes the sum of the dissimilarities of all objects to their nearest centroid. It helps in finding best possible subset from the gene expression microarray data set.
C. Evolutionary Techniques I. Genetic Algorithm (GA)
GA is an evolutionary technique based on Darwinian evolution theory. GA was 1st proposed by Holland (1975). With the help of GA, we got an optimal solution subset of microarray gene expression data set within a tractable time period. Our model deals with finding the gene subset selection by applying meta heuristic GA. We have combined the clustering technique with the genetic operators to deal with data.GA carry the concept of evolution technique which help in giving the gene subset. Different evolutionary genetic operators are selection, crossover, mutation and termination criterion. As an optimization technique GA simultaneously examines and manipulates a set possible solution. During each iteration of the algorithm, the process of selection, reproduction, and mutation each take place in order to produce the new offspring for the next generation. There are the GA operators as discussed below:
Initial Population:
The initial population indicates to the gene expression microarray data set i.e GA begins with the randomly selected gene sequence for selecting the population. May the whole dataset or a subset of the data set is taken as initial population.

International Journal of Computer Trends and Technology (IJCTT) – volume 4 Issue 6–June 2013
ISSN: 2231-2803 http://www.ijcttjournal.org Page 1854
GA uses the current population of strings to create a new population for next generation iteratively.
Crossover:
It is a generic operator that combines the two randomly selected gene i.e mate1 and mate2 to produce new offspring. This new offspring carried out to the next generation as parent gene. Likewise the each pair of chromosome produce 2n no of offspring and n denotes the no of parents. The cross_rate is randomly initialized. It is between 0.1 to 0.9 and the value has been taken randomly at the time of initialization.
Mutation:
Initially mute_rate has been initialized. It is also randomly taken in between 0.1 to 0.9. In mutation some bit of characters are interchange at mating pole. The exchange of some character or some information taking place between the parental chromosome and produce some extra variant feature in the upcoming offspring which are carried out to next generation. In mutation the exchange of information takes place at mating pole.
Termination Criterion:
Termination is the criterion by which the genetic algorithm decides whether to continue the searching or stop the searching. At each of the iteration termination criterion is checked and designed according to the problem domain after each generation to see whether the stopping condition is satisfied or not.
Pseudocode of GA
1. Set pop_size,max_gen,gen=0 2. Set cross_rate,mute_rate 3. Initialize the population 4. While max_gen >=gen 5. Evaluate fit_fun
for (i=1:pop_size) select(mate1,mate2) child=crossover(mate1,mate2) //child is taken to the next generation
if (rand(0,1)<=mute_rate) child=mutation(child1,child2) end for add child to new generation Gen=gen+1 end while while termination condition satisfy return the best chromosome subset end
II. Memetic Algorithm:
MA was first introduced by Mascato (1989) in his technical report. MAs are based on the Darwinian evolutionary concept theory which is a meta-heuristics evolutionary technique. That means the algorithm maintain a population of solution for the problem statement i.e. a pool comprising several solutions simultaneously which is known as individuals. As it can be seen, each generation consists of the updating of a population of individuals, hopefully leading to better and better solutions for the problem being tackled. There are three main components in this generational step: selection, reproduction, and replacement. The component (selection) is responsible (jointly with the replacement stage) for the com-petition aspects of individuals in the population. Using the information provided by an ad hoc guiding function (fitness function in the EA terminology), the goodness of individuals in pop is evaluated; subsequently, a sample of individuals is selected for reproduction according to this goodness measure. This selection can be done in a variety of ways. The most popular techniques are fitness-proportionate methods (the probability of selecting an individual for breeding is proportional to its fitness), rank-based methods (the probability of selecting an individual depends on its position after ranking the whole population), and tournament-based methods (individuals are selected on the basis of a direct competition within small sub-groups of individuals).
Pseudocode of MA
1. Initialize population 2. Set pop_size,max_gen,gen=0 3. Set cross_rate,mute_rate 4. Evaluate gene subset 5. While (stopping criteria not met) do 6. Select individuals for variation 7. Crossover 8. Mutation 9. Local search 10. Evaluate accuracy of gene subset 11. Select new population 12. do 13. end
In MA an extra variant has been added i.e hill climbing local search [19] which after mutation, search again to find most relevant genes and improves the quality of gene subset that would be considered as parent chromosome subset for next generation.
Pseudocode of hill climbing local search:
While (termination condition is not satisfied) do
New subset solution ← neighbors(best solution) If new subset solution is better than actual solution
then
International Journal of Computer Trends and Technology (IJCTT) – volume 4 Issue 6–June 2013
ISSN: 2231-2803 http://www.ijcttjournal.org Page 1855
Best solution ← actual solution End if
End while
IV. SCHEMATIC REPRESENTATION OF MODEL
Proposed model consists of normalization of dataset. Through min-max normalization data became normalized between the ranges of [0-1] or [-1,+1]. Then it undergoes for feature reduction. After reducing the data two clustering techniques are to be applied. Then two evolutionary algorithms i.e. GA and MA have been applied. It would give result in terms of gene subsets. Finally, result is compared and check which evolutionary algorithm gives best gene subset on which clustering technique.
Fig. 1 Proposed model
V. EXPERIMENTAL EVALUATION AND RESULT ANALYSIS
For the evaluation of the proposed work we have taken two bench marked dataset from UCI [20] repository whose description are given in table 1. All the experiment has been carried out on Intel core i3 processor, 2.3 GHZ, 32 bit 1GB RAM, 1GB disk space for MATLAB, 3-4 GB for ideal installation and evaluated using MATLAB 2010 upon two data set . Our experimental work consists of following steps:
TABLE I DESCRIPTION OF DATASET
Data set used Dimension Breast-cancer 98X25 Leukaemia 72X256
Step1: Normalization of datasets: Dataset has multivariate characteristics and the attributes have real characteristics. The value of data set D has been mapped within a small range to get D’ with one minimum value and one maximum value of the data set by applying the min-max normalization formula given in equation (2).
푣’ =
푣 −푚푖푛푚푎푥 −푚푖푛_퐴
(푛푒푤_푚푎푥 − 푛푒푤_푚푖푛 )
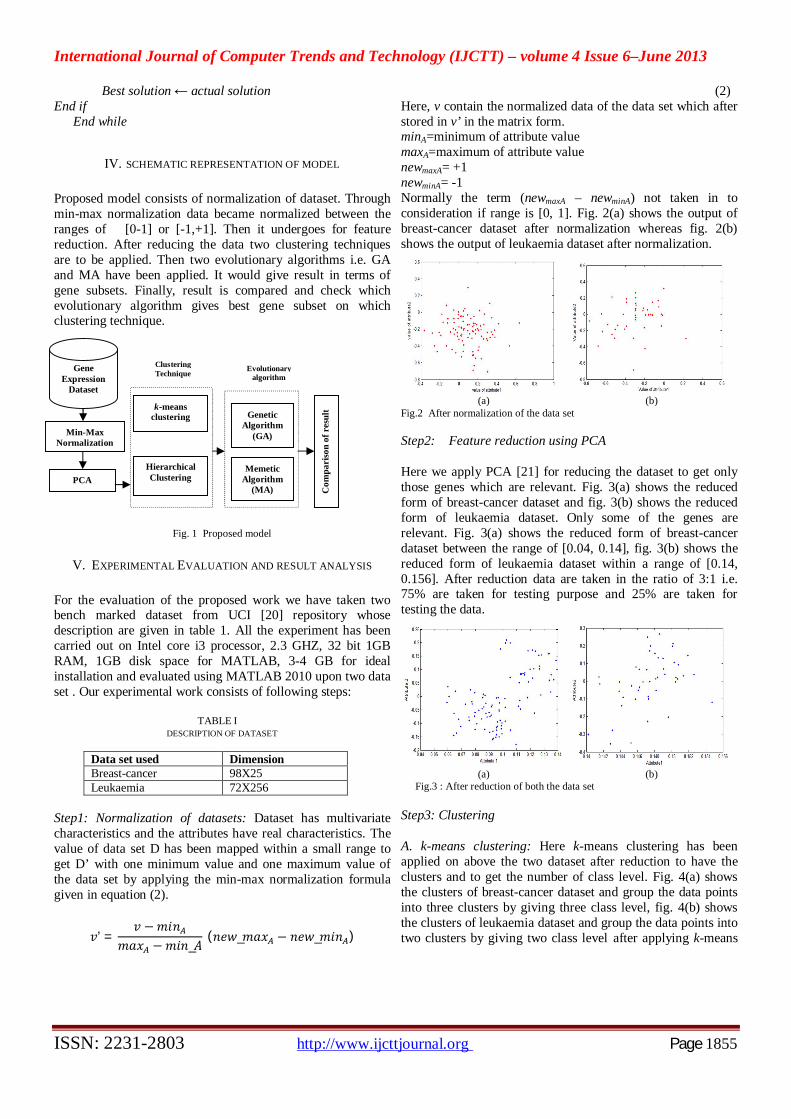
(2) Here, v contain the normalized data of the data set which after stored in v’ in the matrix form. minA=minimum of attribute value maxA=maximum of attribute value newmaxA= +1 newminA= -1 Normally the term (newmaxA – newminA) not taken in to consideration if range is [0, 1]. Fig. 2(a) shows the output of breast-cancer dataset after normalization whereas fig. 2(b) shows the output of leukaemia dataset after normalization.
(a) (b)
Fig.2 After normalization of the data set
Step2: Feature reduction using PCA
Here we apply PCA [21] for reducing the dataset to get only those genes which are relevant. Fig. 3(a) shows the reduced form of breast-cancer dataset and fig. 3(b) shows the reduced form of leukaemia dataset. Only some of the genes are relevant. Fig. 3(a) shows the reduced form of breast-cancer dataset between the range of [0.04, 0.14], fig. 3(b) shows the reduced form of leukaemia dataset within a range of [0.14, 0.156]. After reduction data are taken in the ratio of 3:1 i.e. 75% are taken for testing purpose and 25% are taken for testing the data.
(a) (b)
Fig.3 : After reduction of both the data set
Step3: Clustering
A. k-means clustering: Here k-means clustering has been applied on above the two dataset after reduction to have the clusters and to get the number of class level. Fig. 4(a) shows the clusters of breast-cancer dataset and group the data points into three clusters by giving three class level, fig. 4(b) shows the clusters of leukaemia dataset and group the data points into two clusters by giving two class level after applying k-means
Min-Max Normalization
PCA
k-means clustering
Hierarchical Clustering
Memetic Algorithm
(MA)
Genetic Algorithm
(GA)
Clustering Technique Evolutionary
algorithm
Gene
Expression Dataset
Com
pari
son
of r
esul
t
International Journal of Computer Trends and Technology (IJCTT) – volume 4 Issue 6–June 2013
ISSN: 2231-2803 http://www.ijcttjournal.org Page 1856
clustering technique. The cluster has been found out based on the euclidian distance along with centre c which here is taken randomly so that we separate each data and arrange in different clusters.
(a) (b)
Fig. 4 Figure showing the clusters of both the dataset after applying k-means clustering
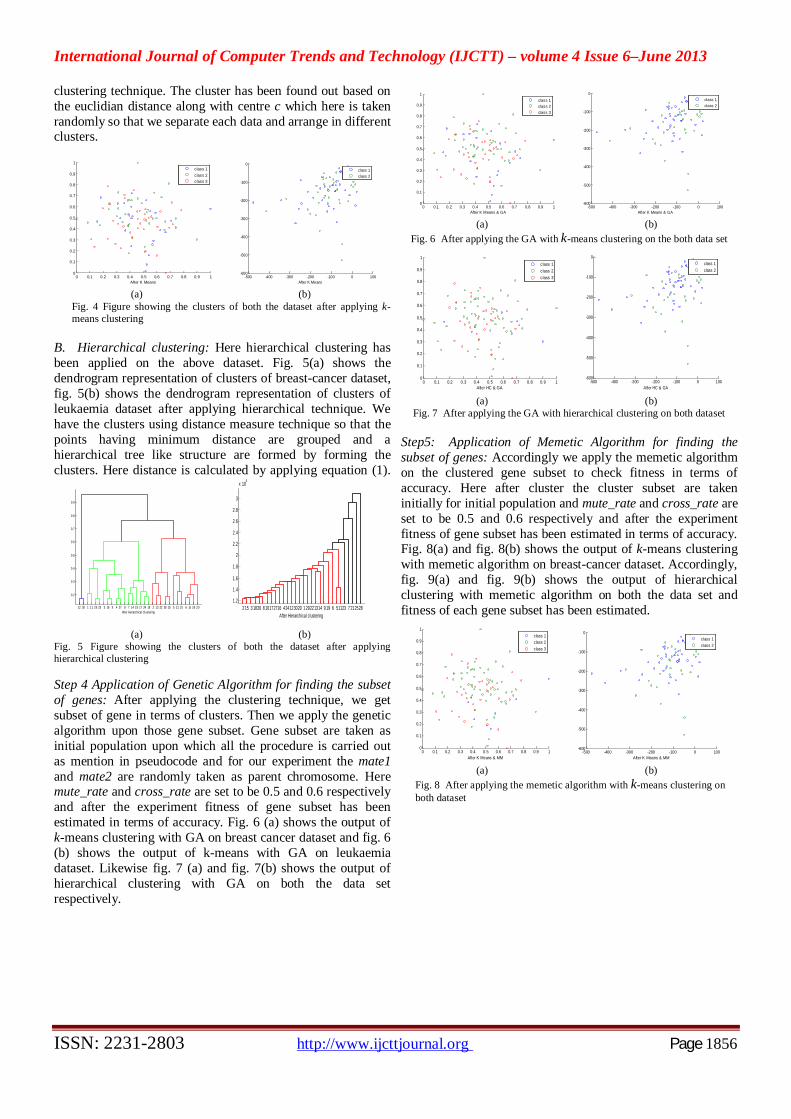
B. Hierarchical clustering: Here hierarchical clustering has been applied on the above dataset. Fig. 5(a) shows the dendrogram representation of clusters of breast-cancer dataset, fig. 5(b) shows the dendrogram representation of clusters of leukaemia dataset after applying hierarchical technique. We have the clusters using distance measure technique so that the points having minimum distance are grouped and a hierarchical tree like structure are formed by forming the clusters. Here distance is calculated by applying equation (1).
(a) (b)
Fig. 5 Figure showing the clusters of both the dataset after applying hierarchical clustering Step 4 Application of Genetic Algorithm for finding the subset of genes: After applying the clustering technique, we get subset of gene in terms of clusters. Then we apply the genetic algorithm upon those gene subset. Gene subset are taken as initial population upon which all the procedure is carried out as mention in pseudocode and for our experiment the mate1 and mate2 are randomly taken as parent chromosome. Here mute_rate and cross_rate are set to be 0.5 and 0.6 respectively and after the experiment fitness of gene subset has been estimated in terms of accuracy. Fig. 6 (a) shows the output of k-means clustering with GA on breast cancer dataset and fig. 6 (b) shows the output of k-means with GA on leukaemia dataset. Likewise fig. 7 (a) and fig. 7(b) shows the output of hierarchical clustering with GA on both the data set respectively.
(a) (b)
Fig. 6 After applying the GA with k-means clustering on the both data set
(a) (b) Fig. 7 After applying the GA with hierarchical clustering on both dataset
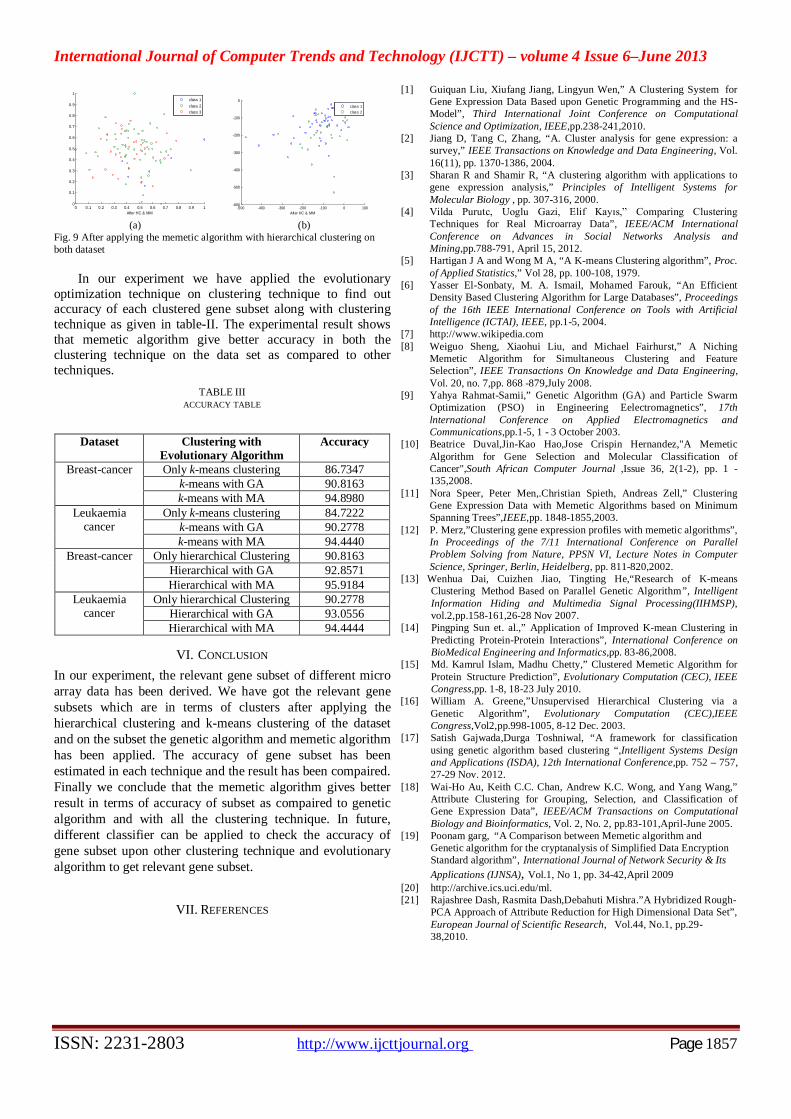
Step5: Application of Memetic Algorithm for finding the subset of genes: Accordingly we apply the memetic algorithm on the clustered gene subset to check fitness in terms of accuracy. Here after cluster the cluster subset are taken initially for initial population and mute_rate and cross_rate are set to be 0.5 and 0.6 respectively and after the experiment fitness of gene subset has been estimated in terms of accuracy. Fig. 8(a) and fig. 8(b) shows the output of k-means clustering with memetic algorithm on breast-cancer dataset. Accordingly, fig. 9(a) and fig. 9(b) shows the output of hierarchical clustering with memetic algorithm on both the data set and fitness of each gene subset has been estimated.
(a) (b) Fig. 8 After applying the memetic algorithm with k-means clustering on both dataset
0 0.1 0.2 0.3 0.4 0.5 0.6 0.7 0.8 0.9 10
0.1
0.2
0.3
0.4
0.5
0.6
0.7
0.8
0.9
1
After K Means
class 1class 2class 3
-500 -400 -300 -200 -100 0 100-600
-500
-400
-300
-200
-100
0
After K Means
class 1class 2
12 30 1 11 29 23 3 16 9 4 27 8 7 14 18 17 24 19 2 13 22 28 25 5 21 10 6 15 26 20
0.2
0.3
0.4
0.5
0.6
0.7
0.8
0.9
After Heirarchical Clustering
2 15 3 1826 8 10172716 424123020 1 29221314 9 19 6 51123 7 2125281.2
1.4
1.6
1.8
2
2.2
2.4
2.6
2.8
3
x 104
After Hierarchical clustering
0 0.1 0.2 0.3 0.4 0.5 0.6 0.7 0.8 0.9 10
0.1
0.2
0.3
0.4
0.5
0.6
0.7
0.8
0.9
1
After K Means & GA
class 1class 2class 3
-500 -400 -300 -200 -100 0 100-600
-500
-400
-300
-200
-100
0
After K Means & GA
class 1class 2
0 0.1 0.2 0.3 0.4 0.5 0.6 0.7 0.8 0.9 10
0.1
0.2
0.3
0.4
0.5
0.6
0.7
0.8
0.9
1
After HC & GA
class 1class 2class 3
-500 -400 -300 -200 -100 0 100-600
-500
-400
-300
-200
-100
0
After HC & GA
class 1class 2
0 0.1 0.2 0.3 0.4 0.5 0.6 0.7 0.8 0.9 10
0.1
0.2
0.3
0.4
0.5
0.6
0.7
0.8
0.9
1
After K Means & MM
class 1class 2class 3
-500 -400 -300 -200 -100 0 100-600
-500
-400
-300
-200
-100
0
After K Means & MM
class 1class 2
International Journal of Computer Trends and Technology (IJCTT) – volume 4 Issue 6–June 2013
ISSN: 2231-2803 http://www.ijcttjournal.org Page 1857
(a) (b)
Fig. 9 After applying the memetic algorithm with hierarchical clustering on both dataset In our experiment we have applied the evolutionary optimization technique on clustering technique to find out accuracy of each clustered gene subset along with clustering technique as given in table-II. The experimental result shows that memetic algorithm give better accuracy in both the clustering technique on the data set as compared to other techniques.
TABLE III ACCURACY TABLE
Dataset Clustering with
Evolutionary Algorithm Accuracy
Breast-cancer Only k-means clustering 86.7347 k-means with GA 90.8163 k-means with MA 94.8980
Leukaemia cancer
Only k-means clustering 84.7222 k-means with GA 90.2778 k-means with MA 94.4440
Breast-cancer Only hierarchical Clustering 90.8163 Hierarchical with GA 92.8571 Hierarchical with MA 95.9184
Leukaemia cancer
Only hierarchical Clustering 90.2778 Hierarchical with GA 93.0556 Hierarchical with MA 94.4444
VI. CONCLUSION In our experiment, the relevant gene subset of different micro array data has been derived. We have got the relevant gene subsets which are in terms of clusters after applying the hierarchical clustering and k-means clustering of the dataset and on the subset the genetic algorithm and memetic algorithm has been applied. The accuracy of gene subset has been estimated in each technique and the result has been compaired. Finally we conclude that the memetic algorithm gives better result in terms of accuracy of subset as compaired to genetic algorithm and with all the clustering technique. In future, different classifier can be applied to check the accuracy of gene subset upon other clustering technique and evolutionary algorithm to get relevant gene subset.
VII. REFERENCES
[1] Guiquan Liu, Xiufang Jiang, Lingyun Wen,” A Clustering System for Gene Expression Data Based upon Genetic Programming and the HS-Model”, Third International Joint Conference on Computational Science and Optimization, IEEE,pp.238-241,2010.
[2] Jiang D, Tang C, Zhang, “A. Cluster analysis for gene expression: a survey,” IEEE Transactions on Knowledge and Data Engineering, Vol. 16(11), pp. 1370-1386, 2004.
[3] Sharan R and Shamir R, “A clustering algorithm with applications to gene expression analysis,” Principles of Intelligent Systems for Molecular Biology , pp. 307-316, 2000.
[4] Vilda Purutc, Uoglu Gazi, Elif Kayıs,” Comparing Clustering Techniques for Real Microarray Data”, IEEE/ACM International Conference on Advances in Social Networks Analysis and Mining,pp.788-791, April 15, 2012.
[5] Hartigan J A and Wong M A, “A K-means Clustering algorithm”, Proc. of Applied Statistics,” Vol 28, pp. 100-108, 1979.
[6] Yasser El-Sonbaty, M. A. Ismail, Mohamed Farouk, “An Efficient Density Based Clustering Algorithm for Large Databases”, Proceedings of the 16th IEEE International Conference on Tools with Artificial Intelligence (ICTAI), IEEE, pp.1-5, 2004.
[7] http://www.wikipedia.com [8] Weiguo Sheng, Xiaohui Liu, and Michael Fairhurst,” A Niching
Memetic Algorithm for Simultaneous Clustering and Feature Selection”, IEEE Transactions On Knowledge and Data Engineering, Vol. 20, no. 7,pp. 868 -879,July 2008.
[9] Yahya Rahmat-Samii,” Genetic Algorithm (GA) and Particle Swarm Optimization (PSO) in Engineering Eelectromagnetics”, 17th lnternational Conference on Applied Electromagnetics and Communications,pp.1-5, 1 - 3 October 2003.
[10] Beatrice Duval,Jin-Kao Hao,Jose Crispin Hernandez,"A Memetic Algorithm for Gene Selection and Molecular Classification of Cancer",South African Computer Journal ,Issue 36, 2(1-2), pp. 1 - 135,2008.
[11] Nora Speer, Peter Men,.Christian Spieth, Andreas Zell,” Clustering Gene Expression Data with Memetic Algorithms based on Minimum Spanning Trees”,IEEE,pp. 1848-1855,2003.
[12] P. Merz,”Clustering gene expression profiles with memetic algorithms”, In Proceedings of the 7/11 International Conference on Parallel Problem Solving from Nature, PPSN VI, Lecture Notes in Computer Science, Springer, Berlin, Heidelberg, pp. 811-820,2002.
[13] Wenhua Dai, Cuizhen Jiao, Tingting He,“Research of K-means Clustering Method Based on Parallel Genetic Algorithm”, Intelligent Information Hiding and Multimedia Signal Processing(IIHMSP), vol.2,pp.158-161,26-28 Nov 2007.
[14] Pingping Sun et. al.,” Application of Improved K-mean Clustering in Predicting Protein-Protein Interactions”, International Conference on BioMedical Engineering and Informatics,pp. 83-86,2008.
[15] Md. Kamrul Islam, Madhu Chetty,” Clustered Memetic Algorithm for Protein Structure Prediction”, Evolutionary Computation (CEC), IEEE Congress,pp. 1-8, 18-23 July 2010.
[16] William A. Greene,”Unsupervised Hierarchical Clustering via a Genetic Algorithm”, Evolutionary Computation (CEC),IEEE Congress,Vol2,pp.998-1005, 8-12 Dec. 2003.
[17] Satish Gajwada,Durga Toshniwal, “A framework for classification using genetic algorithm based clustering “,Intelligent Systems Design and Applications (ISDA), 12th International Conference,pp. 752 – 757, 27-29 Nov. 2012.
[18] Wai-Ho Au, Keith C.C. Chan, Andrew K.C. Wong, and Yang Wang,” Attribute Clustering for Grouping, Selection, and Classification of Gene Expression Data”, IEEE/ACM Transactions on Computational Biology and Bioinformatics, Vol. 2, No. 2, pp.83-101,April-June 2005.
[19] Poonam garg, “A Comparison between Memetic algorithm and Genetic algorithm for the cryptanalysis of Simplified Data Encryption Standard algorithm”, International Journal of Network Security & Its Applications (IJNSA), Vol.1, No 1, pp. 34-42,April 2009
[20] http://archive.ics.uci.edu/ml. [21] Rajashree Dash, Rasmita Dash,Debahuti Mishra.”A Hybridized Rough-
PCA Approach of Attribute Reduction for High Dimensional Data Set”, European Journal of Scientific Research, Vol.44, No.1, pp.29-38,2010.
0 0.1 0.2 0.3 0.4 0.5 0.6 0.7 0.8 0.9 10
0.1
0.2
0.3
0.4
0.5
0.6
0.7
0.8
0.9
1
After HC & MM
class 1class 2class 3
-500 -400 -300 -200 -100 0 100-600
-500
-400
-300
-200
-100
0
After HC & MM
c lass 1class 2