fahid malik
TRANSCRIPT

8/6/2019 fahid malik
http://slidepdf.com/reader/full/fahid-malik 1/20
Diabetes – the condition
• What is it?
• How is it caused?
• Who gets it?• Risk factors

8/6/2019 fahid malik
http://slidepdf.com/reader/full/fahid-malik 2/20
What is diabetes?
• A condition in which the amount of glucose
(sugar) in the blood is too high because the body
cannot use it properly
• This happens because the body does not produce
or properly use insulin, which is needed to convert
sugar and starchy foods from the diet into energy
needed for daily life
8/6/2019 fahid malik
http://slidepdf.com/reader/full/fahid-malik 3/20
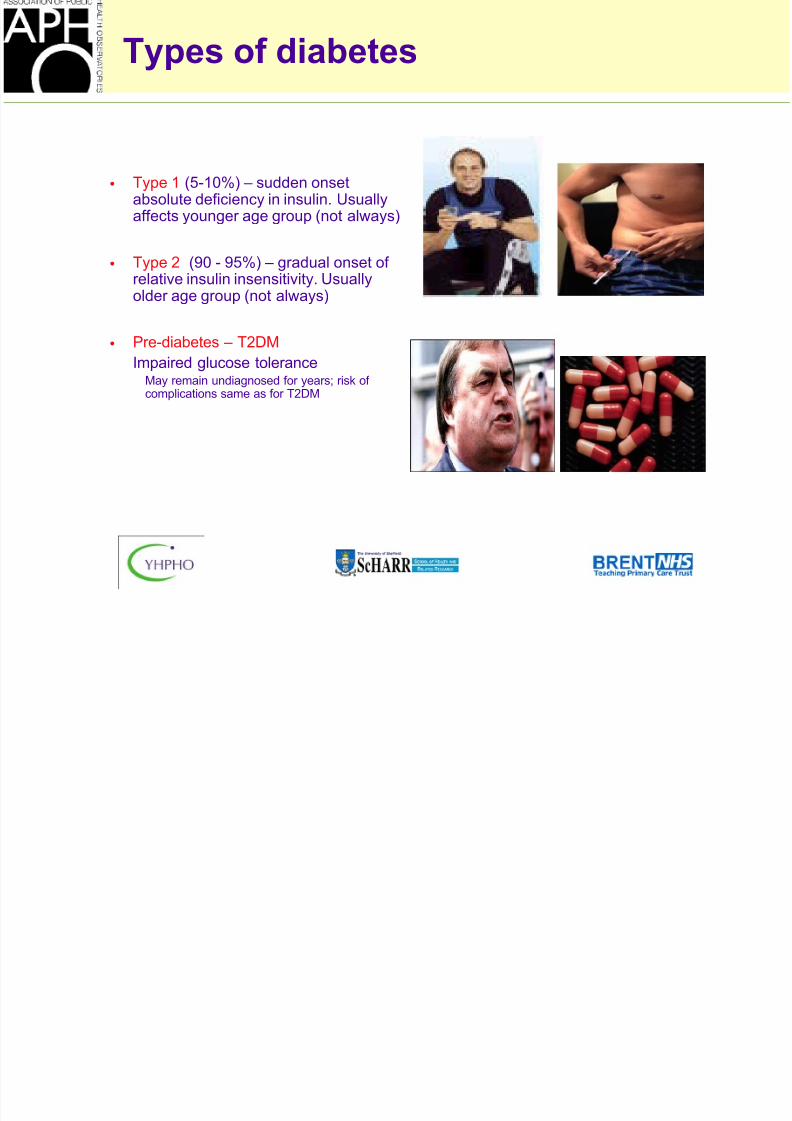
Types of diabetes
• Type 1 (5-10%) – sudden onsetabsolute deficiency in insulin. Usuallyaffects younger age group (not always)
• Type 2 (90 - 95%) – gradual onset of
relative insulin insensitivity. Usuallyolder age group (not always)
• Pre-diabetes – T2DM
Impaired glucose toleranceMay remain undiagnosed for years; risk of complications same as for T2DM
8/6/2019 fahid malik
http://slidepdf.com/reader/full/fahid-malik 4/20
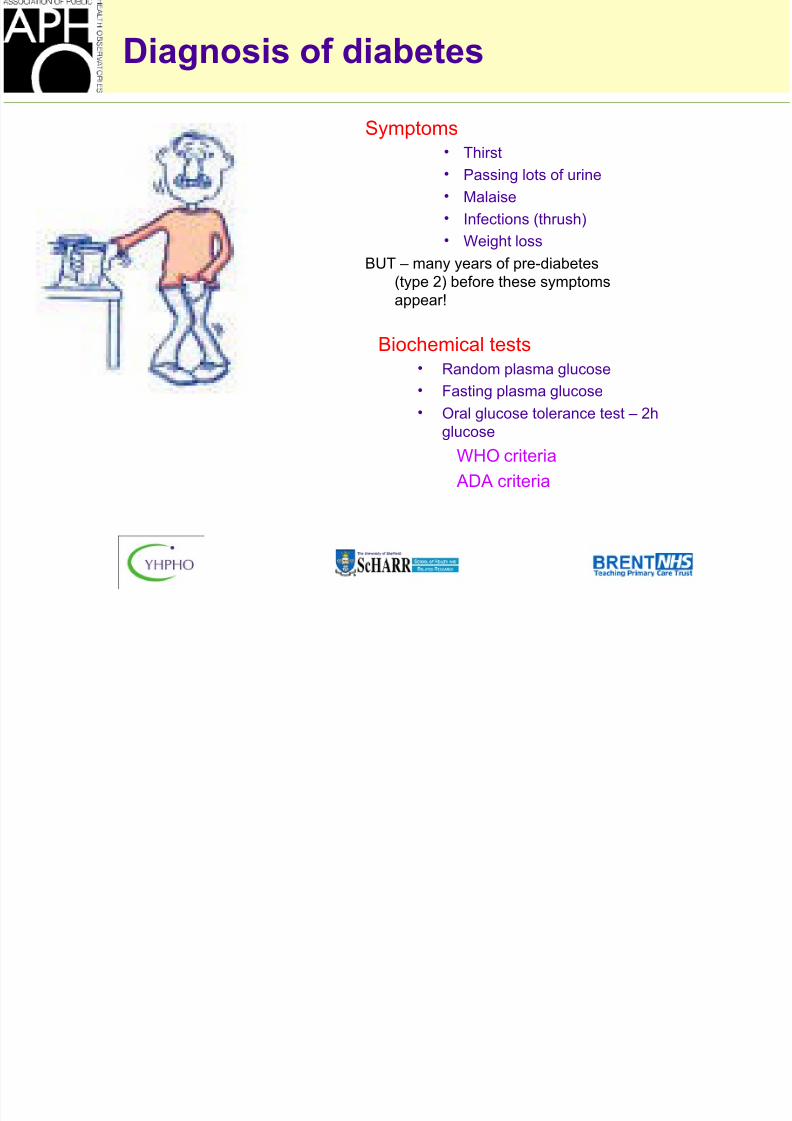
Diagnosis of diabetes
Symptoms• Thirst
• Passing lots of urine
• Malaise
• Infections (thrush)
• Weight loss
BUT – many years of pre-diabetes
(type 2) before these symptomsappear!
Biochemical tests • Random plasma glucose
• Fasting plasma glucose
• Oral glucose tolerance test – 2hglucose
WHO criteria
ADA criteria
8/6/2019 fahid malik
http://slidepdf.com/reader/full/fahid-malik 5/20
Why is diabetes so important?
The burden to patients, carers, NHS
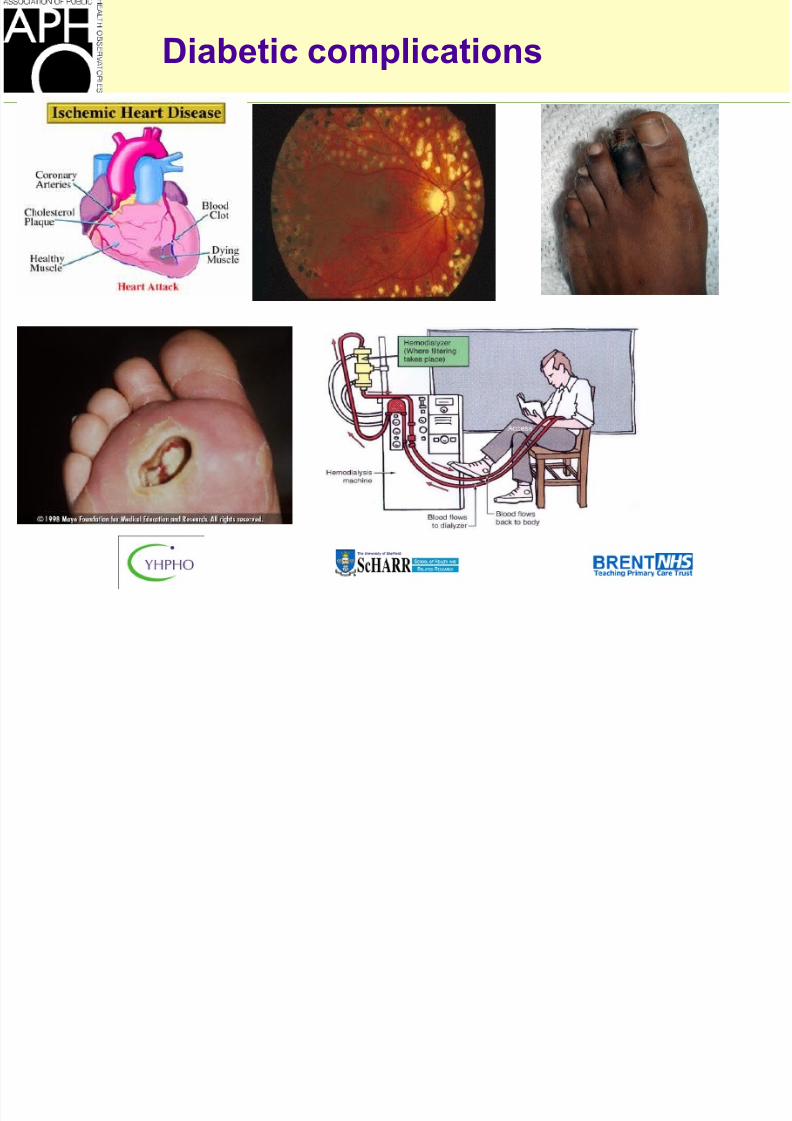
– Complications• Cardiovascular
• Eyes
• Renal - Hypertension, renal failure• Feet
• Skin, infections, sexual, psycho-sexual, depression
• Quality of life
• Premature mortality
– Cost
DIABETES NSF
8/6/2019 fahid malik
http://slidepdf.com/reader/full/fahid-malik 6/20
Diabetic complications
8/6/2019 fahid malik
http://slidepdf.com/reader/full/fahid-malik 7/20
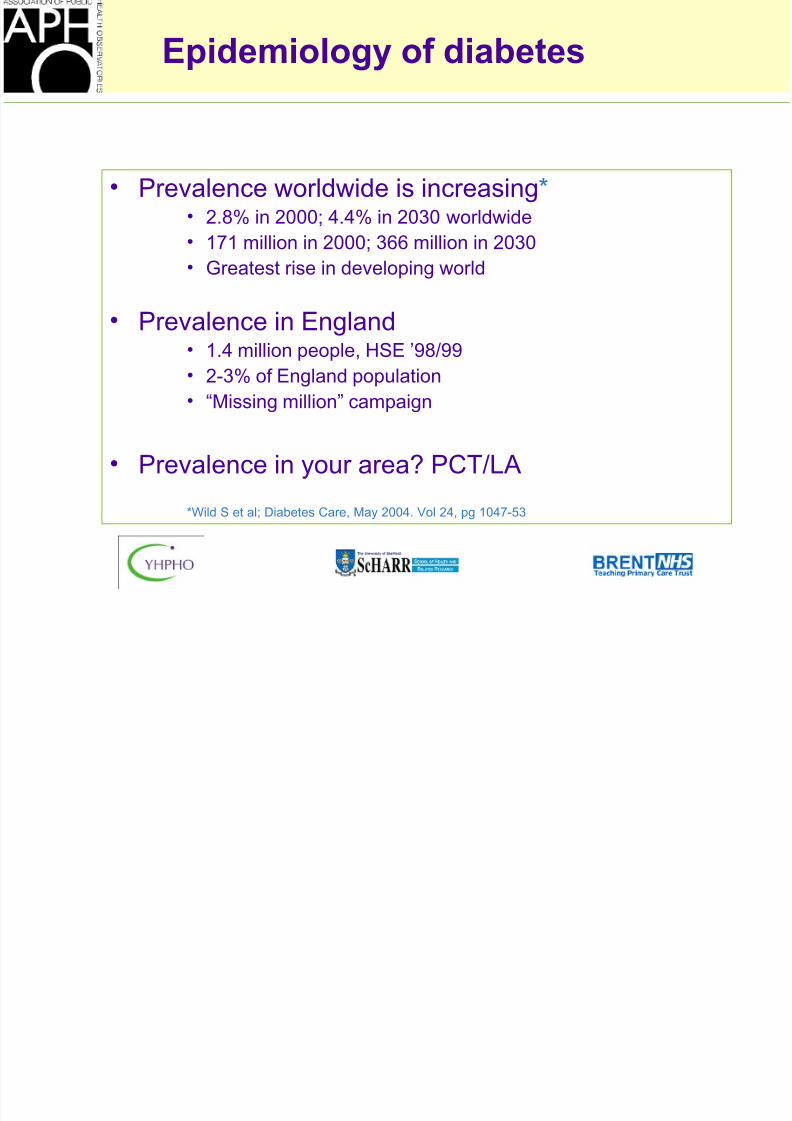
Epidemiology of diabetes
• Prevalence worldwide is increasing*• 2.8% in 2000; 4.4% in 2030 worldwide
• 171 million in 2000; 366 million in 2030
• Greatest rise in developing world
• Prevalence in England• 1.4 million people, HSE ’98/99
• 2-3% of England population
• “Missing million” campaign
• Prevalence in your area? PCT/LA
*Wild S et al; Diabetes Care, May 2004. Vol 24, pg 1047-53
8/6/2019 fahid malik
http://slidepdf.com/reader/full/fahid-malik 8/20
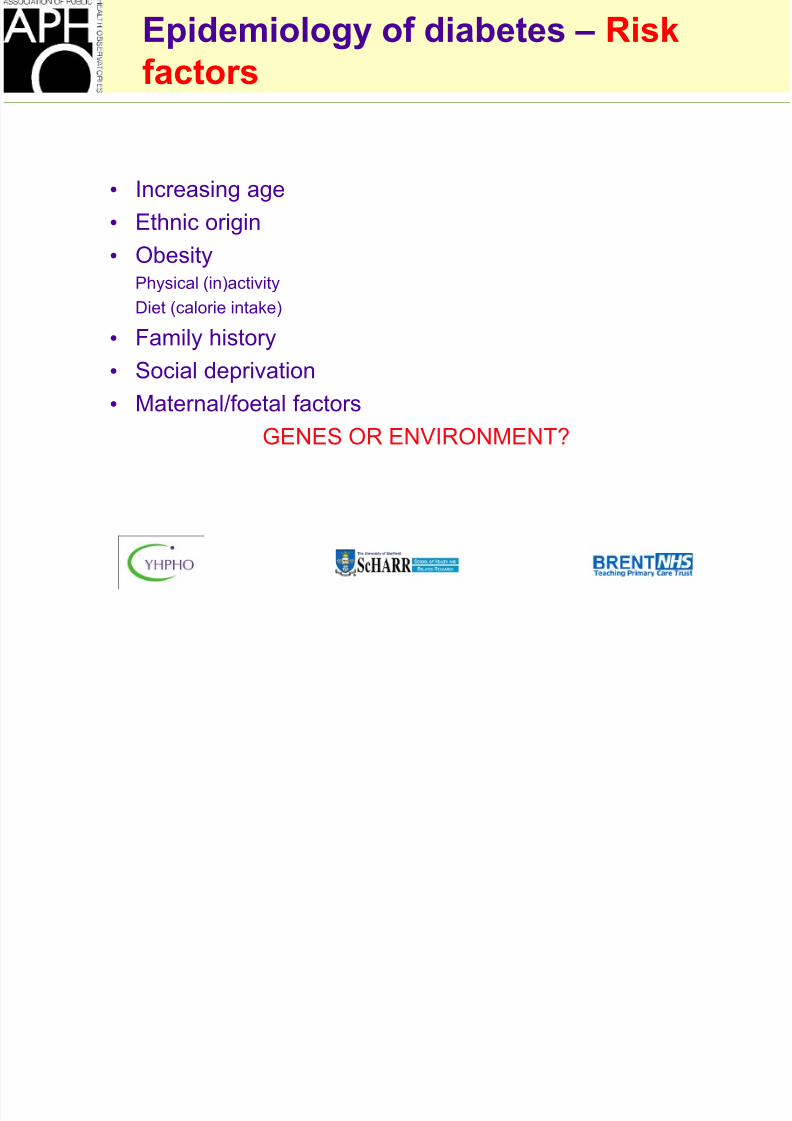
Epidemiology of diabetes – Risk
factors
• Increasing age
• Ethnic origin
• ObesityPhysical (in)activity
Diet (calorie intake)
• Family history
• Social deprivation
• Maternal/foetal factorsGENES OR ENVIRONMENT?
8/6/2019 fahid malik
http://slidepdf.com/reader/full/fahid-malik 9/20
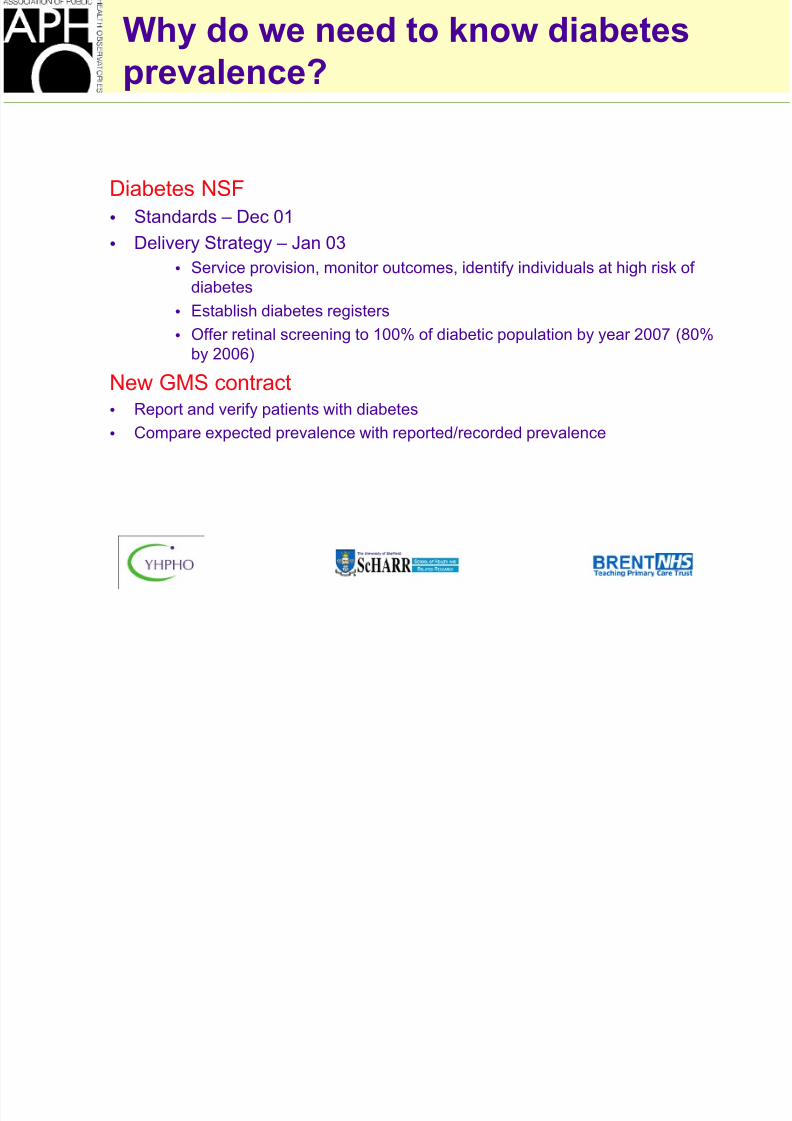
Why do we need to know diabetes
prevalence?
Diabetes NSF
• Standards – Dec 01
• Delivery Strategy – Jan 03
•Service provision, monitor outcomes, identify individuals at high risk of
diabetes
• Establish diabetes registers
• Offer retinal screening to 100% of diabetic population by year 2007 (80%
by 2006)
New GMS contract
• Report and verify patients with diabetes• Compare expected prevalence with reported/recorded prevalence
8/6/2019 fahid malik
http://slidepdf.com/reader/full/fahid-malik 10/20
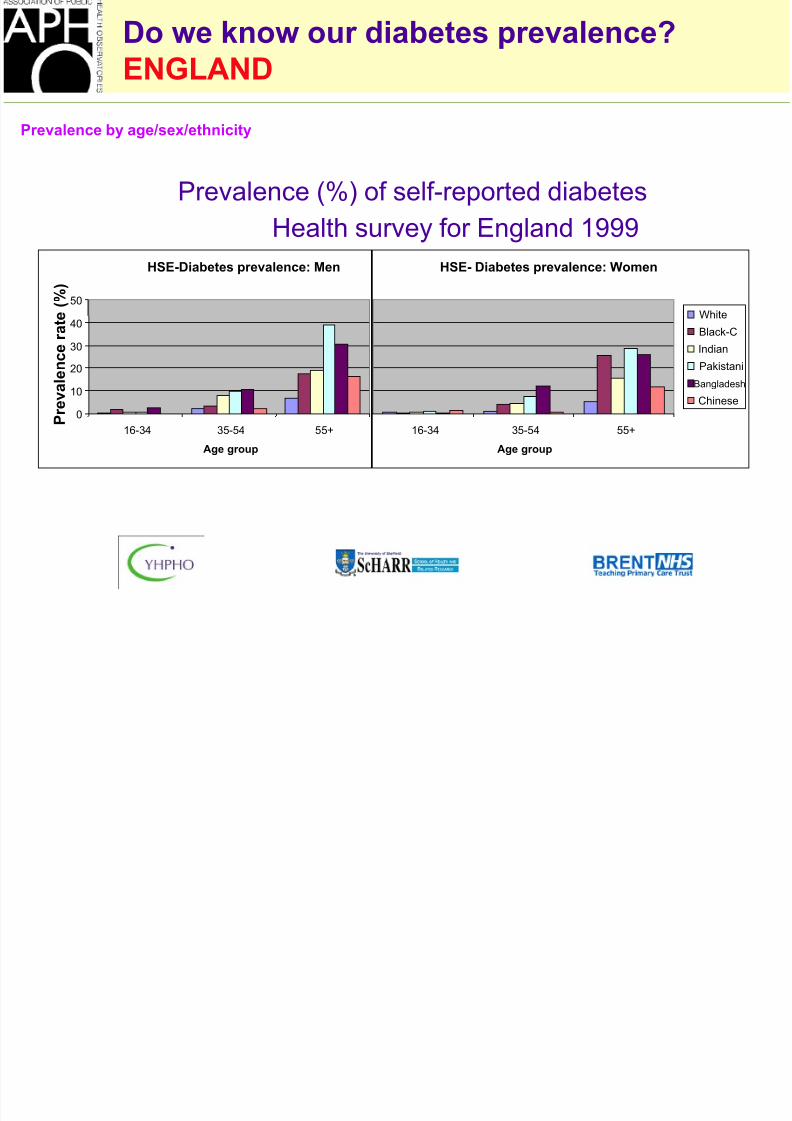
Do we know our diabetes prevalence?
ENGLAND
Prevalence (%) of self-reported diabetes
Health survey for England 1999
HSE-Diabetes prevalence: Men
0
10
20
30
40
50
16-34 35-54 55+
Age group
Prevalen
cerate(%)
HSE- Diabetes prevalence: Women
16-34 35-54 55+
Age group
White
Black-C
Indian
Pakistani
Bangladesh
Chinese
Prevalence by age/sex/ethnicity

8/6/2019 fahid malik
http://slidepdf.com/reader/full/fahid-malik 11/20
Do we know our diabetes
prevalence?
What is the prevalence
• In a health sector (StHA level)?• In a PCT?
• In a ward?
• In a practice?
• In a geographic area – eg London?
8/6/2019 fahid malik
http://slidepdf.com/reader/full/fahid-malik 12/20
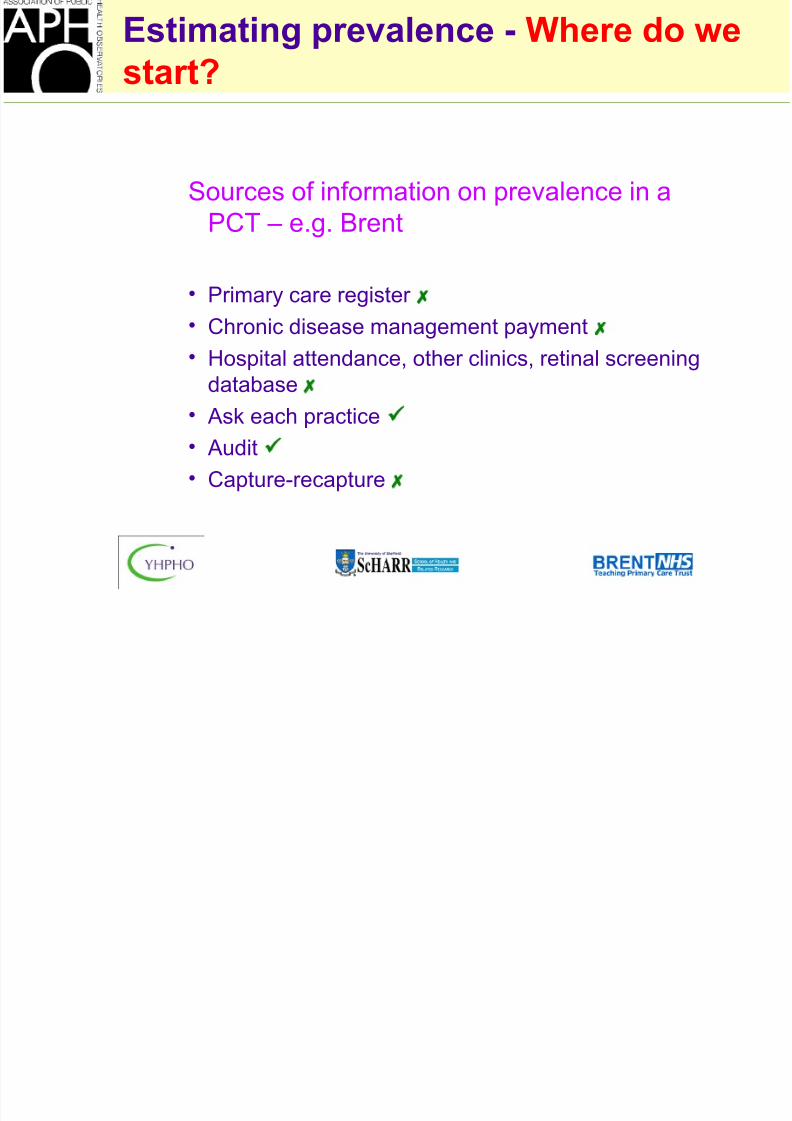
Estimating prevalence - Where do we
start?
Sources of information on prevalence in a
PCT – e.g. Brent
• Primary care register
• Chronic disease management payment
• Hospital attendance, other clinics, retinal screening
database
• Ask each practice • Audit
• Capture-recapture
8/6/2019 fahid malik
http://slidepdf.com/reader/full/fahid-malik 13/20
Epidemiological prevalence
modelling - principles
•National surveys/databases – Known diabetes
eg: HSE’99, GPRD (Key health statistics), MSGP-4, Oxford & Poole, DARTS, others
•Research studies – known and undiagnosed disease
Apply reference prevalence rates by age, sex, ethnicgroup to local population (by age, sex, ethnic group)

8/6/2019 fahid malik
http://slidepdf.com/reader/full/fahid-malik 14/20
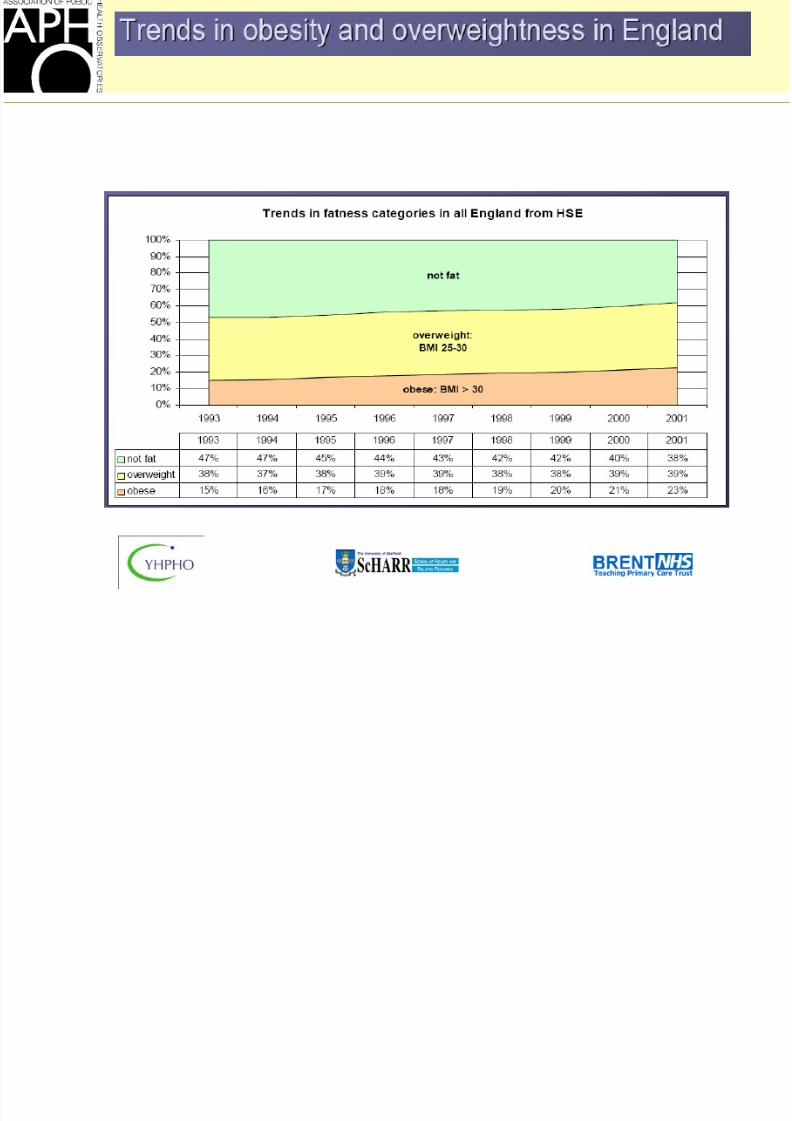
Obesity – what is it?
• Body mass index = BMI• An index derived by the formula [Weight in kg / (height)2 in
metres]
• Not very good for defining fat levels in an individual, but very
good for monitoring trends over time, and across populations –
thus a very important public health statistic
WHO definitions
Normal weight BMI<25 kg/m2
Overweight BMI 25 – 30 kg/m2
Obese BMI >30 kg/m2
8/6/2019 fahid malik
http://slidepdf.com/reader/full/fahid-malik 15/20
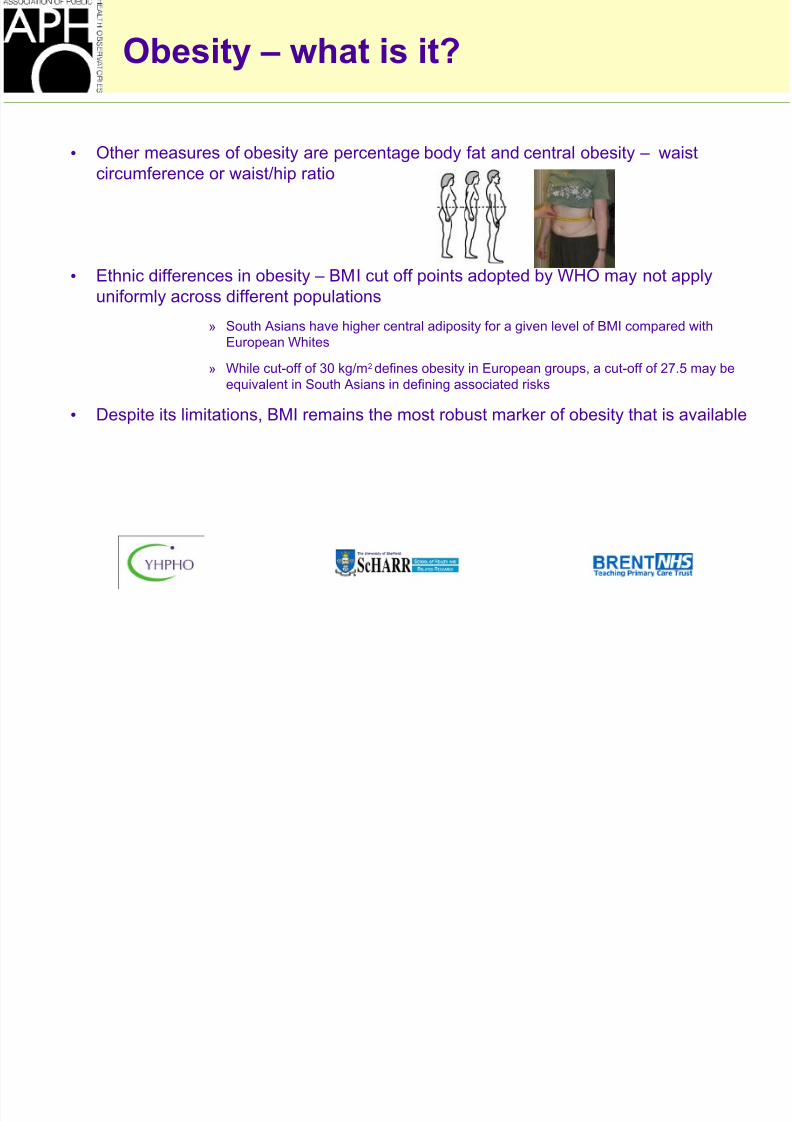
Obesity – what is it?
• Other measures of obesity are percentage body fat and central obesity – waist
circumference or waist/hip ratio
• Ethnic differences in obesity – BMI cut off points adopted by WHO may not applyuniformly across different populations
» South Asians have higher central adiposity for a given level of BMI compared with
European Whites
» While cut-off of 30 kg/m2 defines obesity in European groups, a cut-off of 27.5 may be
equivalent in South Asians in defining associated risks
• Despite its limitations, BMI remains the most robust marker of obesity that is available
8/6/2019 fahid malik
http://slidepdf.com/reader/full/fahid-malik 16/20
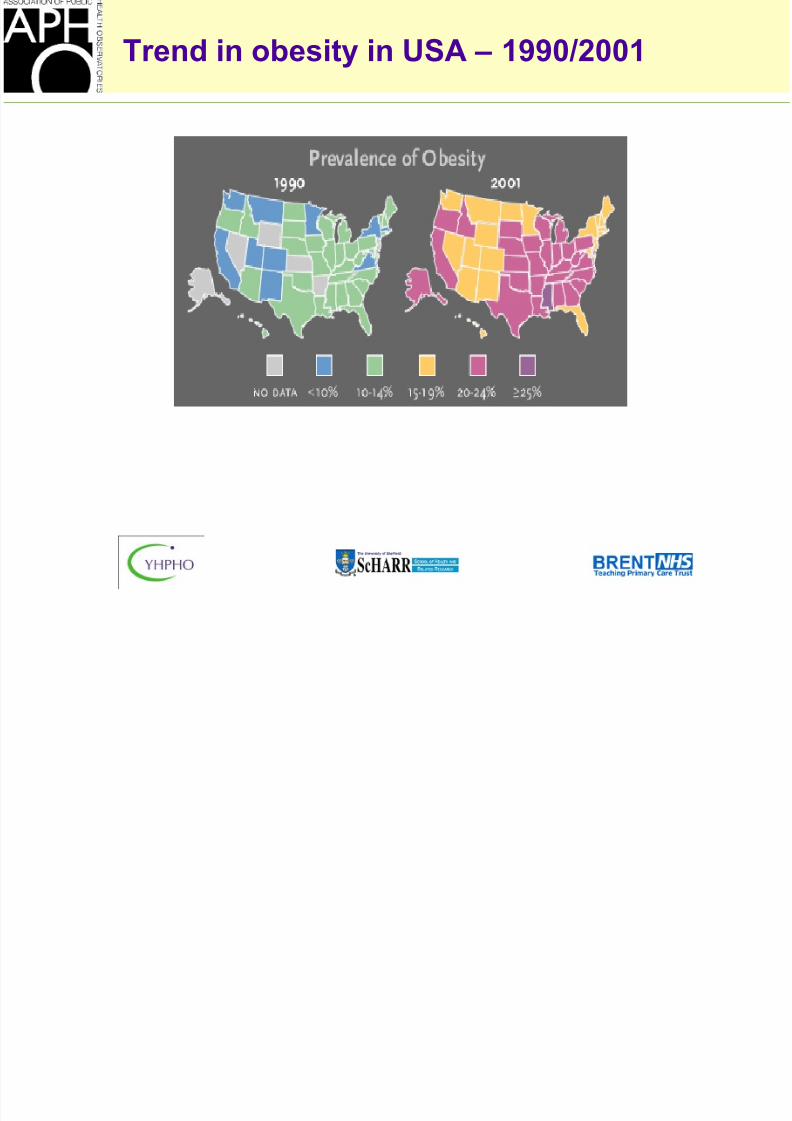
Trend in obesity in USA – 1990/2001
8/6/2019 fahid malik
http://slidepdf.com/reader/full/fahid-malik 17/20
8/6/2019 fahid malik
http://slidepdf.com/reader/full/fahid-malik 18/20
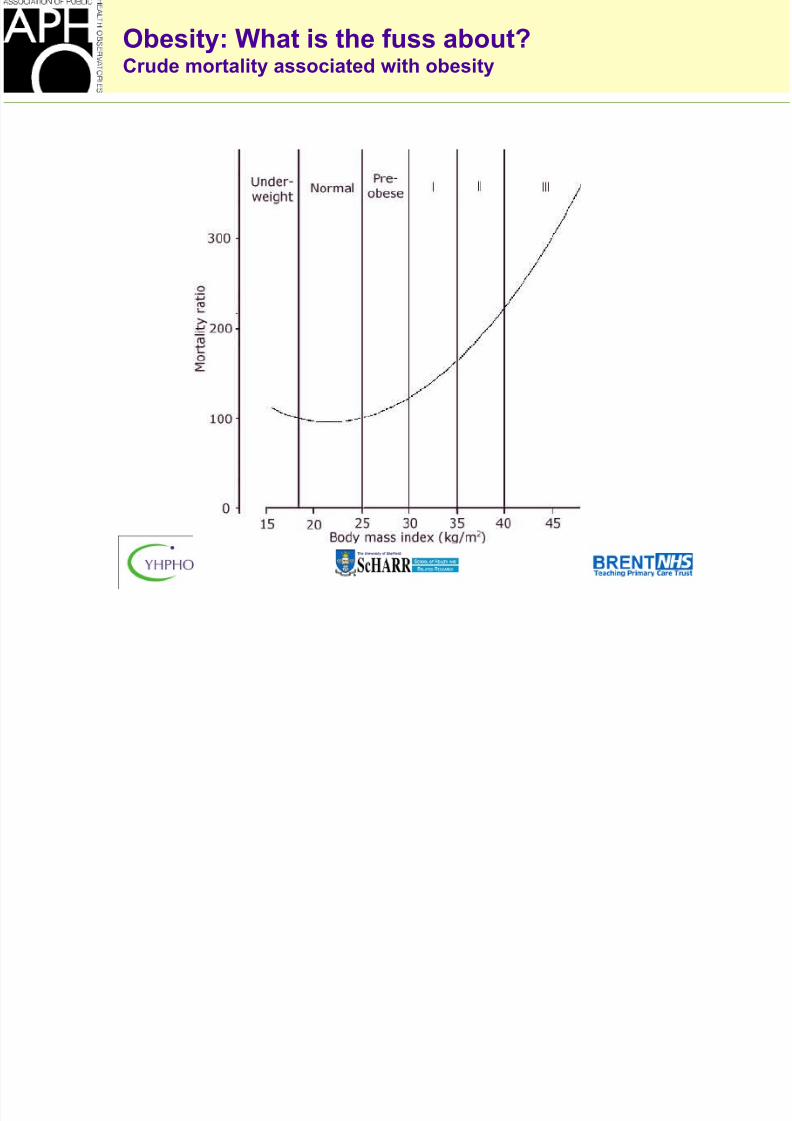
Obesity: What is the fuss about?Crude mortality associated with obesity
8/6/2019 fahid malik
http://slidepdf.com/reader/full/fahid-malik 19/20
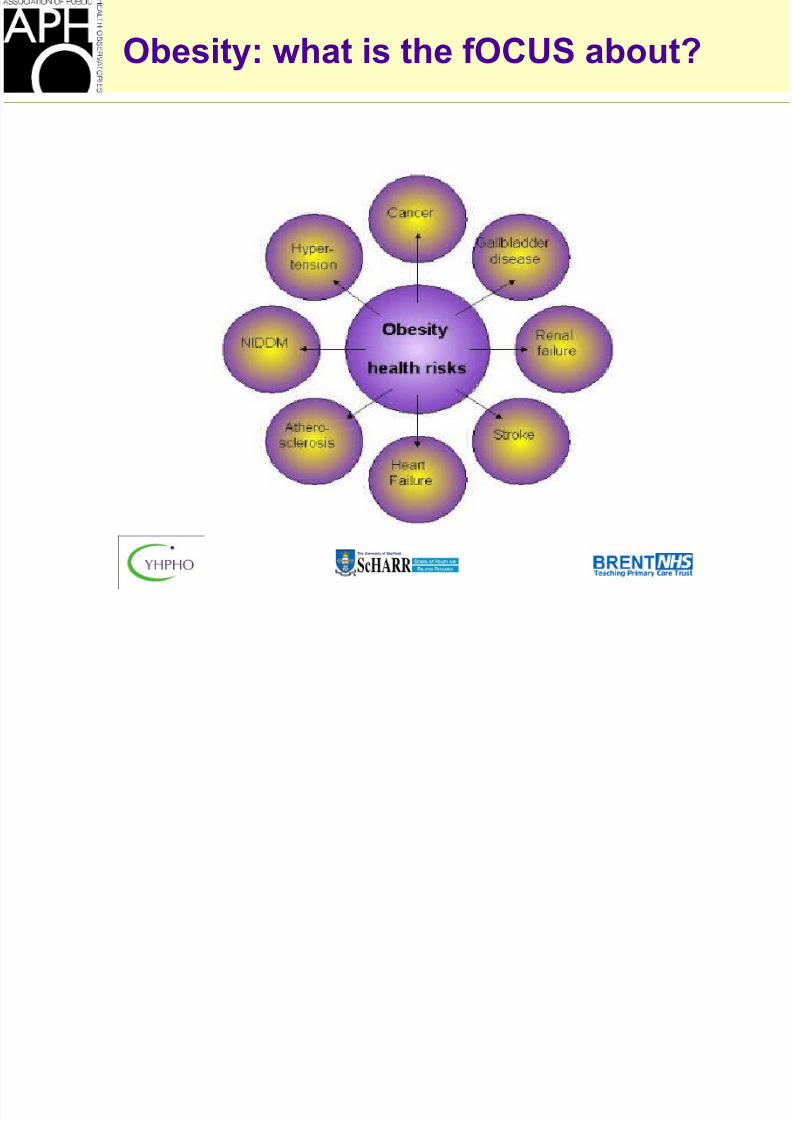
Obesity: what is the fOCUS about?

8/6/2019 fahid malik
http://slidepdf.com/reader/full/fahid-malik 20/20
Public Health message
•
Obesity prevalence is increasing
•
Diabetes prevalence is increasing