fatigue and fracture - freeit.free.frfreeit.free.fr/bridge engineering handbook/7434-ch53.pdf ·...
TRANSCRIPT

Dexter, R.J. and Fisher, W.F. “Fatigue and Fracture” Bridge Engineering Handbook. Ed. Wai-Fah Chen and Lian Duan Boca Raton: CRC Press, 2000
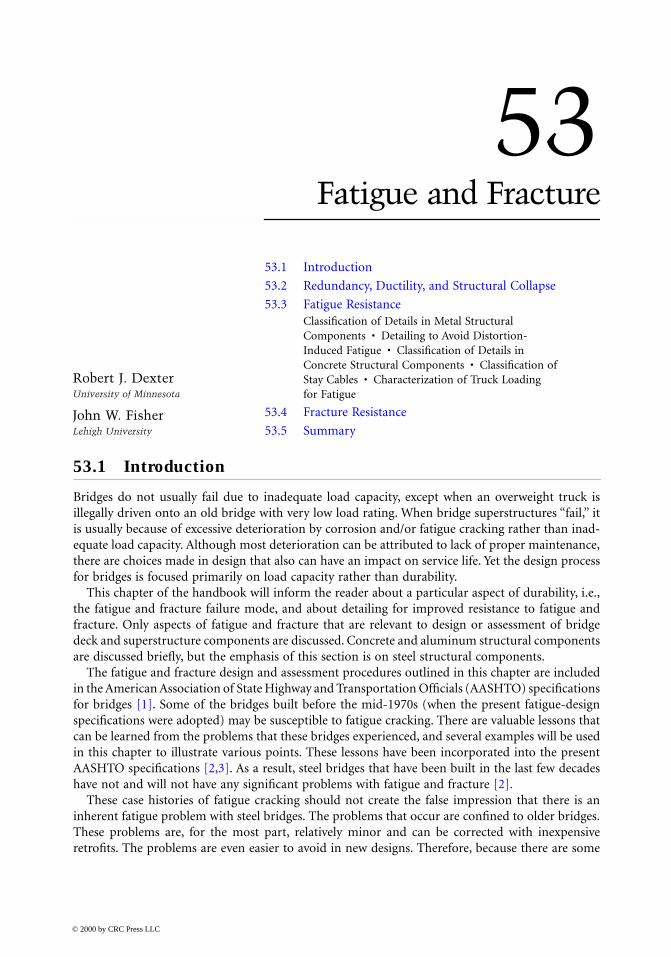
53Fatigue and Fracture
53.1 Introduction
53.2 Redundancy, Ductility, and Structural Collapse
53.3 Fatigue Resistance Classification of Details in Metal Structural Components • Detailing to Avoid Distortion-Induced Fatigue • Classification of Details in Concrete Structural Components • Classification of Stay Cables • Characterization of Truck Loading for Fatigue
53.4 Fracture Resistance
53.5 Summary
53.1 Introduction
Bridges do not usually fail due to inadequate load capacity, except when an overweight truck isillegally driven onto an old bridge with very low load rating. When bridge superstructures “fail,” itis usually because of excessive deterioration by corrosion and/or fatigue cracking rather than inad-equate load capacity. Although most deterioration can be attributed to lack of proper maintenance,there are choices made in design that also can have an impact on service life. Yet the design processfor bridges is focused primarily on load capacity rather than durability.
This chapter of the handbook will inform the reader about a particular aspect of durability, i.e.,the fatigue and fracture failure mode, and about detailing for improved resistance to fatigue andfracture. Only aspects of fatigue and fracture that are relevant to design or assessment of bridgedeck and superstructure components are discussed. Concrete and aluminum structural componentsare discussed briefly, but the emphasis of this section is on steel structural components.
The fatigue and fracture design and assessment procedures outlined in this chapter are includedin the American Association of State Highway and Transportation Officials (AASHTO) specificationsfor bridges [1]. Some of the bridges built before the mid-1970s (when the present fatigue-designspecifications were adopted) may be susceptible to fatigue cracking. There are valuable lessons thatcan be learned from the problems that these bridges experienced, and several examples will be usedin this chapter to illustrate various points. These lessons have been incorporated into the presentAASHTO specifications [2,3]. As a result, steel bridges that have been built in the last few decadeshave not and will not have any significant problems with fatigue and fracture [2].
These case histories of fatigue cracking should not create the false impression that there is aninherent fatigue problem with steel bridges. The problems that occur are confined to older bridges.These problems are, for the most part, relatively minor and can be corrected with inexpensiveretrofits. The problems are even easier to avoid in new designs. Therefore, because there are some
Robert J. DexterUniversity of Minnesota
John W. FisherLehigh University
© 2000 by CRC Press LLC
fatigue problems with older bridges, one should not get the impression that there are ongoingfatigue problems with modern bridges designed by the present fatigue-design specifications.
Detailing rules are perhaps the most important part of the fatigue and fracture design andassessment procedures. The detailing rules are intended to avoid notches and other stress concen-trations. These detailing rules are useful for the avoidance of brittle fracture as well as fatigue.Because of the detailing rules, modern steel bridges are detailed in a way that appears much cleanerthan those built before the 1970s. There are fewer connections and attachments in modern bridges,and the connections use more fatigue-resistant details such as high-strength bolted joints.
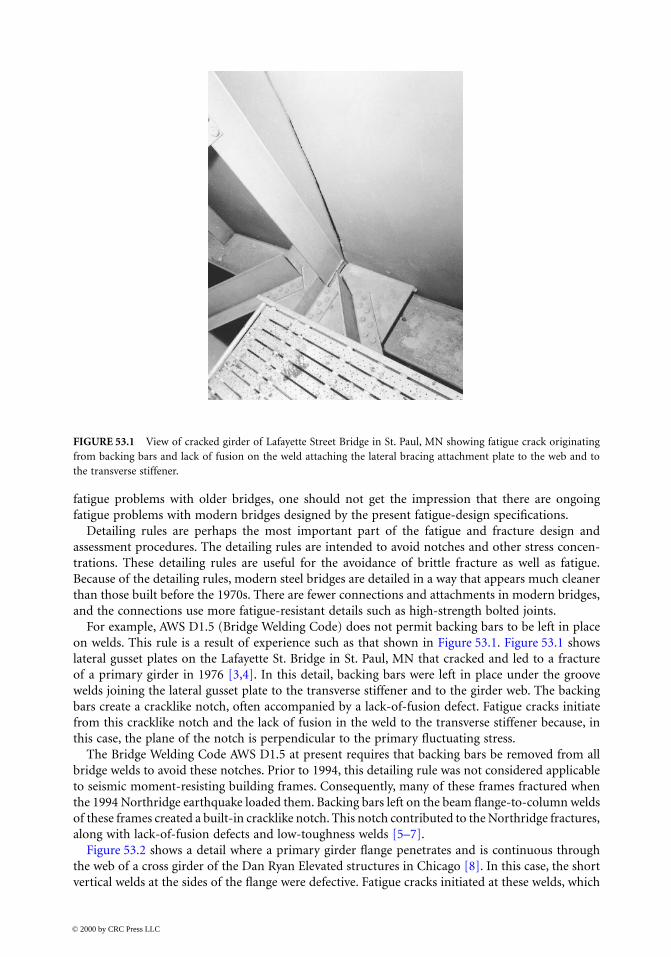
For example, AWS D1.5 (Bridge Welding Code) does not permit backing bars to be left in placeon welds. This rule is a result of experience such as that shown in Figure 53.1. Figure 53.1 showslateral gusset plates on the Lafayette St. Bridge in St. Paul, MN that cracked and led to a fractureof a primary girder in 1976 [3,4]. In this detail, backing bars were left in place under the groovewelds joining the lateral gusset plate to the transverse stiffener and to the girder web. The backingbars create a cracklike notch, often accompanied by a lack-of-fusion defect. Fatigue cracks initiatefrom this cracklike notch and the lack of fusion in the weld to the transverse stiffener because, inthis case, the plane of the notch is perpendicular to the primary fluctuating stress.
The Bridge Welding Code AWS D1.5 at present requires that backing bars be removed from allbridge welds to avoid these notches. Prior to 1994, this detailing rule was not considered applicableto seismic moment-resisting building frames. Consequently, many of these frames fractured whenthe 1994 Northridge earthquake loaded them. Backing bars left on the beam flange-to-column weldsof these frames created a built-in cracklike notch. This notch contributed to the Northridge fractures,along with lack-of-fusion defects and low-toughness welds [5–7].
Figure 53.2 shows a detail where a primary girder flange penetrates and is continuous throughthe web of a cross girder of the Dan Ryan Elevated structures in Chicago [8]. In this case, the shortvertical welds at the sides of the flange were defective. Fatigue cracks initiated at these welds, which
FIGURE 53.1 View of cracked girder of Lafayette Street Bridge in St. Paul, MN showing fatigue crack originatingfrom backing bars and lack of fusion on the weld attaching the lateral bracing attachment plate to the web and tothe transverse stiffener.
© 2000 by CRC Press LLC

led to fracture of the cross girder. It is unlikely that good welds could have been made for this detail.A better alternative would have been to have cope holes at the ends of the flange. Note that inFigures 53.1 and 53.2, the fractures did not lead to structural collapse. The reason for this reservetolerance to large cracks will be discussed in Section 53.2.
In bridges, there are usually a large number of cycles of significant live load, and fatigue willalmost always precede fracture. Therefore, controlling fatigue is practically more important thancontrolling fracture. The civil engineering approach for fatigue is explained in Section 53.3. Thefatigue life (N) of particular details is determined by the nominal stress range (S) from S–N curves.The nominal stress S–N curves are the lower-bound curves to a large number of full-scale fatiguetest data. The full-scale tests empirically take into account a number of variables with great uncer-tainty, e.g., residual stress, weld profile, environment, and discontinuities in the material frommanufacturing. Consequently, the variability of fatigue life data at a particular stress range istypically about a factor of 10.
Usually, the only measures taken in design that are primarily intended to assure fracture resistanceare to specify materials with minimum specified toughness values, such as a Charpy V-Notch (CVN)test requirement. As explained in Section 53.4, toughness is specified so that the structure is resistantto brittle fracture despite manufacturing defects, fatigue cracks, and/or unanticipated loading. Thesematerial specifications are less important for bridges than the S–N curves and detailing rules, however.
Steel structures have exhibited unmatched ductility and integrity when subjected to seismicloading. Modern steel bridges in the United States which are designed to resist fatigue and fracturefrom truck loading have not exhibited fractures in earthquakes. It would appear that the modernbridge design procedures which consider fatigue and fracture from truck loading are also adequateto assure resistance to brittle fracture under seismic loading. Although rare, fractures of bridgestructural elements have occurred during earthquakes outside the United States. For example, brittlefractures occurred on several types of steel bridge piers during the 1995 Hyogo-ken Nanbu earth-quake in Japan [9].
FIGURE 53.2 View of cracked cross girder of Dan Ryan elevated structure in Chicago showing cracking originatingfrom short vertical welds which are impossible to make without lack of fusion defects.
© 2000 by CRC Press LLC

These fatigue and fracture design and assessment procedures for bridges are also applicable tomany other types of cyclically loaded structures which use similar welded and bolted details, e.g.,cranes, buildings, chimneys, transmission towers, sign, signal, and luminaire support structures,etc. In fact, these procedures are similar to those in the American Welding Society AWS D1.1,“Structural Welding Code — Steel” [10], which is applicable to a broad range of welded structures.
This “civil engineering” approach to fatigue and fracture could also be applied to large weldedand bolted details in structures outside the traditional domain of civil engineering, including ships,offshore structures, mobile cranes, and heavy vehicle frames. However, the civil engineeringapproach to fatigue presented here is different from traditional mechanical engineering approaches.The mechanical engineering approaches are well suited to smooth machined parts and other appli-cations where a major portion of the fatigue life of a part is consumed in forming an initial crack.In the mechanical engineering approaches, the fatigue strength is proportional to the ultimate tensilestrength of the steel. The experimental data show this is not true for welded details, as discussedbelow.
53.2 Redundancy, Ductility, and Structural Collapse
Fatigue is considered a serviceability limit state for bridges because the fatigue cracks and fracturesthat have occurred have mostly not been significant from the standpoint of structural integrity.Redundancy and ductility of steel bridges have prevented catastrophic collapse. Only in certain trulynonredundant structural systems can fatigue cracking lead to structural collapse.
The I-79 Bridge at Neville Island in Pittsburgh is an example of the robustness of even so-calledfracture critical or nonredundant two-girder bridges. In 1977, one of the girders developed a fatiguecrack in the tension flange at the location of a fabrication repair of an electroslag weld splice [3].As shown in Figure 53.3, the crack completely fractured the bottom flange and propagated up theweb of this critical girder. A tugboat captain happened to look up and notice the crack extendingas he passed under the bridge.
Although two-girder bridges are considered nonredundant, other elements of the bridge, partic-ularly the deck, are usually able to carry the loads and prevent collapse as in the case of the I-79bridge. Today, because of the penalties in design and fabrication for nonredundant or fracture-critical members, simple and low-cost two-girder bridges are seldom built. Note that the large cracks
FIGURE 53.3 View of cracked girder of I-79 Bridge at Neville Island in Pittsburgh as an example of a bridge thatis sufficiently redundant to avoid collapse despite a fracture of the tension flange and the web.
© 2000 by CRC Press LLC
shown in the bridges in Figures 53.1 and 53.2 also did not lead to structural collapse. Unfortunately,this built-in redundancy shown by these structures is difficult to predict and is not explicitlyrecognized in design.
The beneficial effects of redundancy on fatigue and fracture are best explained in terms of theboundary conditions on the structural members. The truck loads and wind loads on bridges areessentially “fixed-load” or “load-control” boundary conditions. On a local scale, however, mostindividual members and connections in redundant structures are essentially under “displacement-control” boundary conditions. In other words, because of the stiffness of the surrounding structure,the ends of the member have to deform in a way that is compatible with nearby members. A crackedmember in parallel with other similar but uncracked members will experience a decreasing loadrange and nominal stress range as the stiffness of the cracked member decreases. This behaviorunder displacement control is referred to as load shedding and it can slow down the rate of fatiguecrack propagation.
If a fatigue crack forms in one element of a bolted or riveted built-up structural member, thecrack cannot propagate directly into neighboring elements. Usually, a riveted member will not failuntil additional cracks form in one or more additional elements. Therefore, riveted built-up struc-tural members are inherently redundant. Once a fatigue crack forms, it can propagate directly intoall elements of a continuous welded member and cause failure at service loads. Welded structuresare not inferior to bolted or riveted structures; they require more attention to design, detailing, andquality.
Ductility is required in order for redundancy to be completely effective. As the net section of acracking bridge member decreases, the plastic moment capacity of the member decreases. If amember is sufficiently ductile, it can tolerate a crack so large that the applied moment exceeds theplastic moment for the net section and a mechanism will form in the member [11–13]. If themember can then deform to several times the yield rotation, the load will be shed to the deck andother members.
Minimum levels of fracture toughness are necessary to achieve ductility, but are not sufficient.The fracture toughness assures that brittle fracture does not occur before general yielding of thenet cross section. However, net section yielding is not very ductile unless the yielding can spreadto the gross section, which requires strain hardening in the stress–strain relationship of the steel,or a reasonably low yield-to-tensile ratio [12–14].
53.3 Fatigue Resistance
Low-cycle fatigue is a possible failure mode for structural members or connections which are cycledinto the inelastic region for a small number of cycles (less that 1000) [15,16]. For example, bridgepier structures may be subjected to low-cycle fatigue in an earthquake [9]. Brittle fractures occurredin Japan in steel piers that underwent large plastic strain cycles during the 1995 Hyogo-ken Nanbuearthquake in Japan [9]. However, in order to focus on the more common phenomenon of high-cycle fatigue, low-cycle fatigue is not discussed further in this section.
Truck traffic is the primary cause of high-cycle fatigue of bridges. Wind loads may also be afatigue design consideration in bridges. Wind-induced vibration has caused numerous fatigueproblems in sign, signal, and luminaire support structures [17].
Although cracks can form in structures cycled in compression, they arrest and are not structurallysignificant. Therefore, only members or connections for which the stress cycle is at least partiallyin tension need to be assessed.
In most bridges, the ratio of the fatigue design truck load to the strength design load is largeenough that fatigue may control the design of much of the structure. In long-span bridges, the loadon much of the superstructure is dominated by the dead load, with the fluctuating live-load partrelatively small. These members will not be sensitive to fatigue. However, the deck, stringers, andfloor beams of bridges are subjected to primarily live load and therefore will be controlled by fatigue.
© 2000 by CRC Press LLC

Fortunately, the deck, stringers, and floor beams are secondary members which, if they failed, wouldnot lead to structural collapse.
When information about a specific crack is available, a fracture mechanics crack growth rateanalysis should be used to calculate remaining life [23–25]. However, in the design stage, withoutspecific initial crack size data, the fracture mechanics approach is not any more accurate than theS–N curve approach [25]. Therefore, the fracture mechanics crack growth analysis will not bediscussed further.
Welded and bolted details for bridges and buildings are designed based on the nominal stressrange rather than the local “concentrated” stress at the weld detail. The nominal stress is usuallyobtained from standard design equations for bending and axial stress and does not include theeffect of stress concentrations of welds and attachments. Since fatigue is typically only a serviceabilityproblem, fatigue design is carried out using service loads as discussed in Section 53.3.5. Usually, thenominal stress in the members can be easily calculated without excessive error. However, the properdefinition of the nominal stresses may become a problem in regions of high stress gradients [26,27].
It is standard practice in fatigue design of welded structures to separate the weld details intocategories having similar fatigue resistance in terms of the nominal stress. Each category of welddetails has an associated S–N curve. The S–N curves for steel in the AASHTO [1], AISC [28],ANSI/AWS [10], and American Railway Engineers Association (AREA) provisions are shown inFigure 53.4. S–N curves are presented for seven categories of weld details — A through E′, in orderof decreasing fatigue strength. These S–N curves are based on a lower bound to a large number offull-scale fatigue test data with a 97.5% survival limit.
The slope of the regression line fit to the test data for welded details is typically in the range 2.9to 3.1 [20,21]. Therefore, in the AISC and AASHTO codes as well as in Eurocode 3 [29], the slopeshave been standardized at 3.0. The effect of the welds and other stress concentrations are reflectedin the ordinate of the S–N curves for the various detail categories.
Figure 53.4 shows the fatigue threshold or constant amplitude fatigue limits (CAFL) for eachcategory as horizontal dashed lines. When constant-amplitude tests are performed at stress rangesbelow the CAFL, noticeable cracking does not occur. The number of cycles associated with theCAFL is whatever number of cycles corresponds to that stress range on the S–N curve for thatcategory or class of detail. The CAFL occurs at an increasing number of cycles for lower fatigue
FIGURE 53.4 The lower-bound S–N curves for the seven prinary fatigue categories from the AASHTO, AREA,AWS, and AISC specifications. The dotted lines are the CAFL and indicate the detail category.
© 2000 by CRC Press LLC
categories or classes. Sometimes, different details, which share a common S–N curve (or category)in the finite-life regime, have different CAFL.
Typically, small-scale specimen tests will result in longer apparent fatigue lives. Therefore, theS–N curve must be based on tests of full-size structural components such as girders. Testing on full-scale welded members has indicated that the primary effect of constant-amplitude loading can beaccounted for in the live-load stress range; i.e., the mean stress is not significant [18–21]. The reasonthat the dead load has little effect on the lower bound of the results is that, locally, there are veryhigh residual stresses from welding. Mean stress may be important for some details that are notwelded, such as anchor bolts [17,22]. In order to be conservative for nonwelded details, in whichthere may be a significant effect of the mean stress, the fatigue test data should be generated underloading with a high tensile mean stress.
The strength and type of steel have only a negligible effect on the fatigue resistance expected fora particular detail [18–21]. The welding process also does not typically have an effect on the fatigueresistance [18–21]. The independence of the fatigue resistance from the type of steel greatly simplifiesthe development of design rules for fatigue since it eliminates the need to generate data for everytype of steel.
The full-scale fatigue experiments have been carried out in moist air and therefore reflect somedegree of environmental effect or corrosion fatigue. Full-scale fatigue experiments in seawater donot show significantly lower fatigue lives [30], provided that corrosion is not so severe that it causespitting. The fatigue lives seem to be more significantly influenced by the stress concentration at thetoe of welds and the initial discontinuities. Therefore, these lower-bound S–N curves can be usedfor design of bridges in any natural environmental exposure, even near salt spray. However, pittingfrom severe corrosion may become a fatigue-critical condition and should not be allowed [31,32].
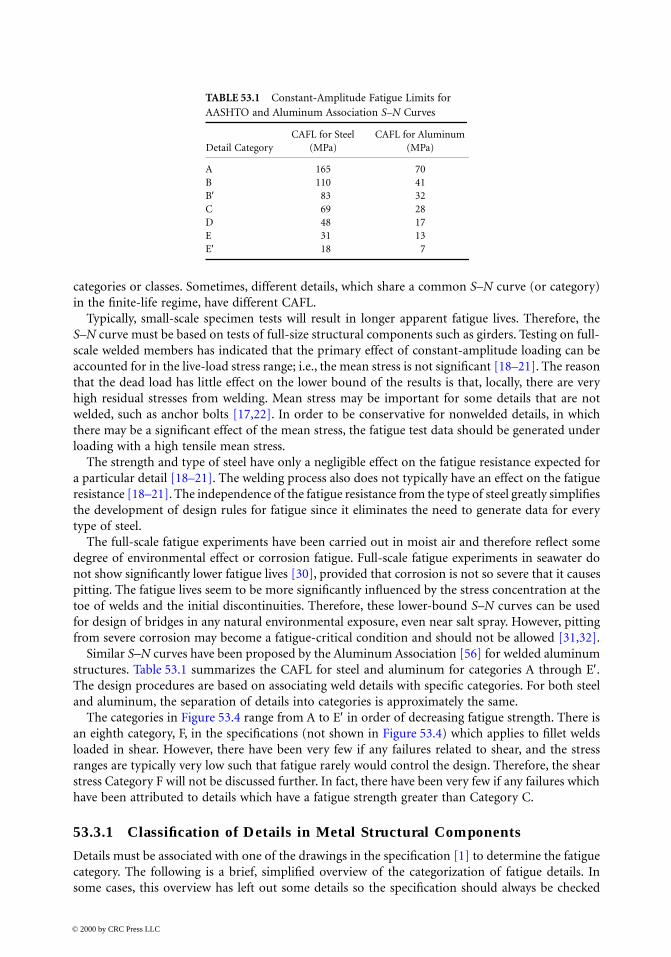
Similar S–N curves have been proposed by the Aluminum Association [56] for welded aluminumstructures. Table 53.1 summarizes the CAFL for steel and aluminum for categories A through E′.The design procedures are based on associating weld details with specific categories. For both steeland aluminum, the separation of details into categories is approximately the same.
The categories in Figure 53.4 range from A to E′ in order of decreasing fatigue strength. There isan eighth category, F, in the specifications (not shown in Figure 53.4) which applies to fillet weldsloaded in shear. However, there have been very few if any failures related to shear, and the stressranges are typically very low such that fatigue rarely would control the design. Therefore, the shearstress Category F will not be discussed further. In fact, there have been very few if any failures whichhave been attributed to details which have a fatigue strength greater than Category C.
53.3.1 Classification of Details in Metal Structural Components
Details must be associated with one of the drawings in the specification [1] to determine the fatiguecategory. The following is a brief, simplified overview of the categorization of fatigue details. Insome cases, this overview has left out some details so the specification should always be checked
TABLE 53.1 Constant-Amplitude Fatigue Limits for AASHTO and Aluminum Association S–N Curves
Detail CategoryCAFL for Steel
(MPa) CAFL for Aluminum
(MPa)
A 165 70B 110 41B′ 83 32C 69 28D 48 17E 31 13E′ 18 7
© 2000 by CRC Press LLC

for the appropriate detail categorization. The AISC specification [28] has a somewhat better pre-sentation of the sketches and explanation of the detail categorization than the AASHTO specifica-tions. Also, several reports have been published which show a large number of illustrations of detailsand their categories [33,34]. In addition, the Eurocode 3 [29] and the British Standard 7608 [35]have more detailed illustrations for their categorization than does the AISC or AASHTO specifica-tions. A book by Maddox [36] discusses categorization of many details in accordance with BS 7608,from which roughly equivalent AISC categories can be inferred.
Small holes are considered Category D details. Therefore, riveted and mechanically fastened joints(other than high-strength bolted joints) loaded in shear are evaluated as Category D in terms ofthe net section nominal stress. Properly tensioned high-strength bolted joints loaded in shear maybe classified as Category B. Pin plates and eyebars are designed as Category E details in terms ofthe stress on the net section.
Welded joints are considered longitudinal if the axis of the weld is parallel to the primary stressrange. Continuous longitudinal welds are Category B or B′ details. However, the terminations oflongitudinal fillet welds are more severe (Category E). (The termination of full-penetration groovelongitudinal welds requires a ground transition radius but gives greater fatigue strength, dependingon the radius.) If longitudinal welds must be terminated, it is better to terminate at a location wherethe stress ranges are less severe.
Attachments normal to flanges or plates that do not carry significant load are rated Category Cif less than 51 mm long in the direction of the primary stress range, D if between 51 and 101 mmlong, and E if greater than 101 mm long. (The 101 mm limit may be smaller for plate thinner than9 mm). If there is not at least 10-mm edge distance, then Category E applies for an attachment ofany length. The Category E′, slightly worse than Category E, applies if the attachment plates or theflanges exceed 25 mm in thickness.
Transverse stiffeners are treated as short attachments (Category C). Transverse stiffeners that areused for cross-bracing or diaphragms are also treated as Category C details with respect to the stressin the main member. In most cases, the stress range in the stiffener from the diaphragm loads isnot considered, because these loads are typically unpredictable. However, the detailing of attachmentplates is critical to avoid distortion-induced fatigue, as discussed in Section 53.3.2.
In most other types of load-carrying attachments, there is interaction between the stress rangein the transverse load-carrying attachment and the stress range in the main member. In practice,each of these stress ranges is checked separately. The attachment is evaluated with respect to thestress range in the main member, and then it is separately evaluated with respect to the transversestress range. The combined multiaxial effect of the two stress ranges is taken into account by adecrease in the fatigue strength; i.e., most load-carrying attachments are considered Category Edetails.
The fatigue strength of longitudinal attachments can be increased if the ends are given a radiusand the fillet or groove weld ends are ground smooth. For example, a longitudinal attachment (load-bearing or not) with a transition radius greater than 50 mm can be considered Category D. If thetransition radius of a groove-welded longitudinal attachment is increased to greater than 152 mm(with the groove-weld ends ground smooth), the detail (load bearing or not) can be consideredCategory C.
53.3.2 Detailing to Avoid Distortion-Induced Fatigue
It is clear from the type of cracks that occur in bridges that a significant proportion of the crackingis due to distortion that results from such secondary loading [37]. The solution to the problem offatigue cracking due to secondary loading usually relies on the qualitative art of good detailing [38].Often, the best solution to distortion cracking problems may be to stiffen the structure. Typically,the better connections are more rigid.
© 2000 by CRC Press LLC

One of the most overlooked secondary loading problems occurs at the interface of structureswith different flexural rigidities and curvatures [39,40]. Figure 53.5 shows a typical crack at thefloor beam flange cope in the Throg’s Neck Bridge in New York. One of the closed trapezoidal ribsof an orthotropic steel deck is visible in Figure 53.5. The orthotropic deck was added to the structureto replace a deteriorating deck by bolting onto the floor beams. However, the superstructure hascurvature that is incompatible with the stiff deck. The difference in curvature manifests as out-of-plane rotation of the flange of the floor beam. The crack is caused by out-of-plane bending of thefloor beam web at the location of the cope, which has many built-in discontinuities due to the flamecutting.
Another example of secondary loading from out-of-plane distortion may occur at attachmentplates for transverse bracing or for a floor beam. These attachment plates, which may have distor-tion-induced out-of-plane loads, should be welded directly to both flanges as well as the web. Inolder bridges, it was common practice not to weld transverse stiffeners and attachment plates tothe tension flange of welded I-girders and box girders. The practice of not allowing transverse filletwelds on the tension flange is not necessary and is due to unwarranted concern about brittle fractureof the tension flange [37,38]. Unfortunately, this practice is not harmless, because numerous fatiguecracks have occurred due to distortion in the “web gap,” i.e., the narrow gap between the terminationof the attachment plate fillet welds and the flange [37,38]. Figure 53.6 shows an example of a crackthat formed along the fillet weld that attaches a diaphragm connection plate to the web of a boxgirder.
In most cases, these web-gap-cracking problems can be solved by rigidly attaching the attachmentplate to the tension flange. To retrofit existing bridges, a very thick T or angle may be high-strength-bolted in to join the attachment plate to the tension flange [38]. The cracked detail shown inFigure 53.6 was retrofit this way. In other cases a better solution is to make the detail more flexible.This flexibility can be accomplished by increasing the size of the gap, allowing the distortion to takeplace over a greater length so that lower stresses are created.
The flexibility approach is used to prevent cracking at the terminations of transverse stiffenersthat are not welded to the bottom flange. If there is a narrow web gap between the end of a transversestiffener and the bottom flange, cracking can occur due to distortion of the web gap from inertial
FIGURE 53.5 View of floor beam of Throgg’s Neck Bridge in New York showing crack in the cope that has beenrepaired by drilling a stop hole. The crack is caused by incompatibility between the curvature of the superstructureand the orthotropic steel deck that is bolted onto the floor beams.
© 2000 by CRC Press LLC

loading during handling and shipping. To prevent this type of cracking, the gap between the flangeand the end of the stiffener should be between four and six times the thickness of the web [38].
Another example where the best details are more flexible is connection angles for “simply sup-ported” beams. Despite our assumptions, such simple connections transmit up to 40% of thetheoretical fixed-end moment, even though they are designed to transmit only shear forces. Thisunintentional end moment may crack the connection angles. The cracked connection angle shownin Figure 53.7 was from the stringer to floor beam connection on a bridge that formerly was onI-94 over the St. Croix River (it was recently replaced).
FIGURE 53.6 View of crack in the fillet weld joining the diaphragm connection plate to the web of a box sectionin the Washington Metro elevated structures. The crack is caused by distortion in the small gap between the bottomof the attachment plate and the box girder flange.
FIGURE 53.7 Connection angle from stringer to floor beam connection of a bridge over the St. Croix River onI-94 that cracked because it was too stiff.
© 2000 by CRC Press LLC
For a given load, the moment in the connection decreases significantly as the rotational stiffnessof the connection decreases. The increased flexibility of connection angles allows the limited amountof end rotation to take place with reduced bending stresses. A criterion has been developed for thedesign of these angles to provide sufficient flexibility [41]. The criterion states that the anglethickness (t) must be
t < 12 (g2/L) (53.1)
where (g) is the gauge and L is the span length. For example, using S.I. units, for connection angleswith a gauge of 76 mm and a beam span of 7000 mm, the angle thickness should be just less than10 mm. To solve a connection-angle-cracking problem in service, the topmost rivet or bolt may beremoved and replaced with a loose bolt to ensure the shear capacity. For loose bolts, steps arerequired to ensure that the nuts do not back off.
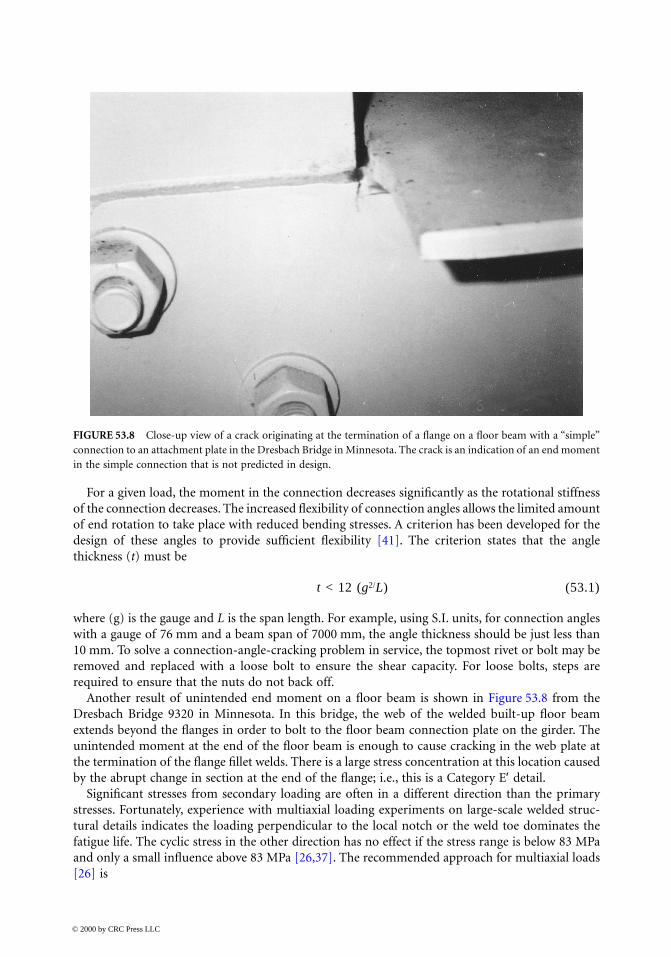
Another result of unintended end moment on a floor beam is shown in Figure 53.8 from theDresbach Bridge 9320 in Minnesota. In this bridge, the web of the welded built-up floor beamextends beyond the flanges in order to bolt to the floor beam connection plate on the girder. Theunintended moment at the end of the floor beam is enough to cause cracking in the web plate atthe termination of the flange fillet welds. There is a large stress concentration at this location causedby the abrupt change in section at the end of the flange; i.e., this is a Category E′ detail.
Significant stresses from secondary loading are often in a different direction than the primarystresses. Fortunately, experience with multiaxial loading experiments on large-scale welded struc-tural details indicates the loading perpendicular to the local notch or the weld toe dominates thefatigue life. The cyclic stress in the other direction has no effect if the stress range is below 83 MPaand only a small influence above 83 MPa [26,37]. The recommended approach for multiaxial loads[26] is
FIGURE 53.8 Close-up view of a crack originating at the termination of a flange on a floor beam with a “simple”connection to an attachment plate in the Dresbach Bridge in Minnesota. The crack is an indication of an end momentin the simple connection that is not predicted in design.
© 2000 by CRC Press LLC

1. To decide which loading (primary or secondary) dominates the fatigue cracking problem(typically the loading perpendicular to the weld axis or perpendicular to where cracks havepreviously occurred in similar details); and,
2. To perform the fatigue analysis using the stress range in this direction (i.e., ignore the stressesin the orthogonal directions).
53.3.3 Classification of Details in Concrete Structural Components
Concrete structures are typically less sensitive to fatigue than welded steel and aluminum structures.However, fatigue may govern the design when impact loading is involved, such as pavement, bridgedecks, and rail ties. Also, as the age of concrete girders in service increases, and as the applied stressranges increase with increasing strength of concrete, the concern for fatigue in concrete structuralmembers has also increased.
According to ACI Committee Report 215R-74 in the Manual of Standard Practice [42], the fatiguestrength of plain concrete at 10 million cycles is approximately 55% of the ultimate strength.However, even if failure does not occur, repeated loading may contribute to premature cracking ofthe concrete, such as inclined cracking in prestressed beams. This cracking can then lead to localizedcorrosion and fatigue of the reinforcement [43].
The fatigue strength of straight, unwelded reinforcing bars and prestressing strand can bedescribed (in terms of the categories for steel details described above) with the Category B S–Ncurve. ACI Committee 215 suggests that members be designed to limit the stress range in thereinforcing bar to 138 MPa for high levels of minimum stress (possibly increasing to 161 MPa forless minimum stress). Fatigue tests show that previously bent bars had only about half the fatiguestrength of straight bars, and failures have occurred down to 113 MPa [44]. Committee 215 rec-ommends that half of the stress range for straight bars be used, i.e., 69 MPa for the worst-caseminimum stress. Equating this recommendation to the S–N curves for steel details, bent reinforce-ment may be treated as a Category D detail.
Provided the quality is good, butt welds in straight reinforcing bars do not significantly lowerthe fatigue strength. However, tack welds reduce the fatigue strength of straight bars about 33%,with failures occurring as low as 138 MPa. Fatigue failures have been reported in welded wire fabricand bar mats [45].
If prestressed members are designed with sufficient precompression that the section remainsuncracked, there is not likely to be any problem with fatigue. This is because the entire section isresisting the load ranges and the stress range in the prestessing strand is minimal. Similarly, forunbonded prestessed members, the stress ranges will be very small. However, there is reason to beconcerned for bonded prestressing at cracked sections because the stress range increases locally. Theconcern for cracked sections is even greater if corrosion is involved. The pitting from corrosiveattack can dramatically lower the fatigue strength of reinforcement [43].
Although the fatigue strength of prestressing strand in air is about equal to Category B, whenthe anchorages are tested as well, the fatigue strength of the system is as low as half the fatiguestrength of the wire alone (i.e., about Category E). When actual beams are tested, the situation isvery complex, but it is clear that much lower fatigue strength can be obtained [46,47]. Committee215 has recommended the following for prestressed beams:
1. The stress range in prestressed reinforcement, determined from an analysis considering thesection to be cracked, is not to exceed 6% of the tensile strength of the reinforcement (thisis approximately equivalent to Category C).
2. Without specific experimental data, the fatigue strength of unbonded reinforcement and theiranchorages is to be taken as half of the fatigue strength of the prestressing steel. (This isapproximately equivalent to Category E.) Lesser values are to be used at anchorages withmultiple elements.
© 2000 by CRC Press LLC
53.3.4 Classification of Stay Cables
The Post-Tensioning Institute has issued “Recommendations for Stay Cable Design and Testing”[48]. The PTI recommends that uncoupled bar stay cables are Category B details, while coupled(glued) bar stay cables are Category D. The fatigue strengths of stay cables are verified throughfatigue testing. Two types of tests are performed: (1) fatigue testing of the strand, and (2) testingof relatively short lengths of the assembled cable with anchorages. The recommended test of thesystem is 2 million cycles at a stress range (158 MPa) which is 35 MPa greater than the fatigueallowable for Category B at 2 million cycles. This test should pass with less than 2% wire breaks. Asubsequent proof test must achieve 95% of the actual ultimate tensile strength of the tendons.
53.3.5 Characterization of Truck Loading for Fatigue
An actual service load history is likely to consist of cycles with a variety of different load ranges,i.e., variable-amplitude loading. However, the S–N curves that are the basis of the fatigue designprovisions are based on constant-amplitude loading. A procedure is shown below to convert variablestress ranges to an equivalent constant-amplitude stress range with the same number of cycles. Thisprocedure is based on the damage summation rule jointly credited to Palmgren and Miner (referredto as Miner’s rule) [49]. If the slope of the S–N curve is equal to 3, then the relative damage ofstress ranges is proportional to the cube of the stress range. Therefore, the effective stress range(SRe) is equal to the cube root of the mean cube (rmc) of the stress ranges, i.e.,
SRe = [(ni /Ntotal) Si3] 1/3 (53.2)
where ni is the number of stress ranges of magnitude Si and Ntotal is the total number of stress ranges.The fatigue design truck in the LRFD version of the AASHTO bridge design specification and in
the present 16th edition of the Standard Specifications is a three-axle HS20 truck. The front axlehas a weight of 36 kN and the rear two axles each have a weight of 142 kN. It is very important tonote that the single rear axles of the HS20 fatigue truck are actually intended to represent pairs oftandem axles [50,51]. This simplification eases design of main members by decreasing the numberof axles (loads) which must be considered. Representation as a single axle is reasonable for designof bridge main members, since the close spacing of tandem axles (about 1.2 m) effectively generatesonly one stress cycle.
This simplified three-axle truck is not appropriate for the design of deck elements and even somefloor beams. Each axle of the tandem axle groups creates a unique stress cycle in a deck element.When the entire distribution of trucks is considered, this results in approximately 4.5 axles or cyclesof loading on average for every truck. However, the LRFD code does not clearly indicate that thisshould be taken into account in the fatigue design of these elements. If the HS20 tandem axle loadis split, the effective axle load is 71 kN for each axle.
The HS20 truck is used in strength calculations with a load factor greater than 1.0. However,there is a load factor of 0.75 for fatigue in the LRFD specification, which implies that the actualfatigue design truck is an HS15, i.e., an axle load of 107 kN (really a pair of tandem 53 kN axles).Thus, the intent of the AASHTO LRFD Specifications is to use an HS15 loading for fatigue. Theload factor was invented so that an additional and possibly confusing design truck would not haveto be defined.
The use of an HS15 truck as representative of the rmc of the variable series of trucks is based onextensive weigh-in-motion (WIM) data and was recommended in NCHRP Report 299 “FatigueEvaluation Procedures for Steel Bridges” [50]. A constant axle spacing of 30 ft was found to bestapproximate the axle spacing of typical four and five axle trucks responsible for most fatigue damageto bridges. This HS15 truck is supposed to represent the effective or rmc gross vehicle weight for adistribution of future trucks.
© 2000 by CRC Press LLC
In the AASHTO LRFD specification, the effective stress range is computed from this effectiveload, and the effective stress range is compared with an allowable stress range. The allowable stressrange is obtained from the constant-amplitude S–N curve, using the same number of cycles as thenumber of variable cycles used to compute the rmc stress range.
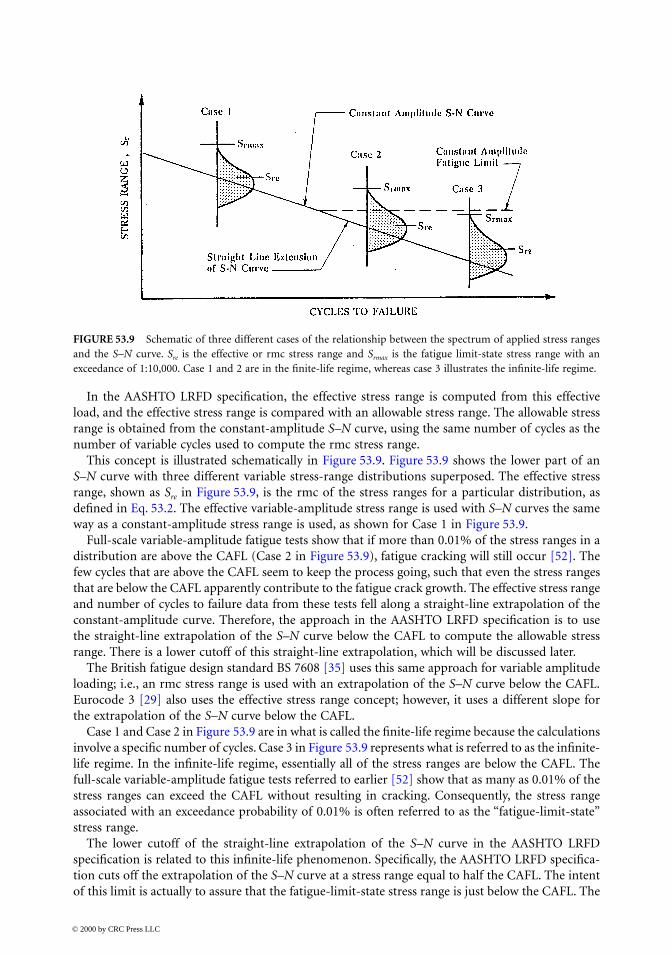
This concept is illustrated schematically in Figure 53.9. Figure 53.9 shows the lower part of anS–N curve with three different variable stress-range distributions superposed. The effective stressrange, shown as Sre in Figure 53.9, is the rmc of the stress ranges for a particular distribution, asdefined in Eq. 53.2. The effective variable-amplitude stress range is used with S–N curves the sameway as a constant-amplitude stress range is used, as shown for Case 1 in Figure 53.9.
Full-scale variable-amplitude fatigue tests show that if more than 0.01% of the stress ranges in adistribution are above the CAFL (Case 2 in Figure 53.9), fatigue cracking will still occur [52]. Thefew cycles that are above the CAFL seem to keep the process going, such that even the stress rangesthat are below the CAFL apparently contribute to the fatigue crack growth. The effective stress rangeand number of cycles to failure data from these tests fell along a straight-line extrapolation of theconstant-amplitude curve. Therefore, the approach in the AASHTO LRFD specification is to usethe straight-line extrapolation of the S–N curve below the CAFL to compute the allowable stressrange. There is a lower cutoff of this straight-line extrapolation, which will be discussed later.
The British fatigue design standard BS 7608 [35] uses this same approach for variable amplitudeloading; i.e., an rmc stress range is used with an extrapolation of the S–N curve below the CAFL.Eurocode 3 [29] also uses the effective stress range concept; however, it uses a different slope forthe extrapolation of the S–N curve below the CAFL.
Case 1 and Case 2 in Figure 53.9 are in what is called the finite-life regime because the calculationsinvolve a specific number of cycles. Case 3 in Figure 53.9 represents what is referred to as the infinite-life regime. In the infinite-life regime, essentially all of the stress ranges are below the CAFL. Thefull-scale variable-amplitude fatigue tests referred to earlier [52] show that as many as 0.01% of thestress ranges can exceed the CAFL without resulting in cracking. Consequently, the stress rangeassociated with an exceedance probability of 0.01% is often referred to as the “fatigue-limit-state”stress range.
The lower cutoff of the straight-line extrapolation of the S–N curve in the AASHTO LRFDspecification is related to this infinite-life phenomenon. Specifically, the AASHTO LRFD specifica-tion cuts off the extrapolation of the S–N curve at a stress range equal to half the CAFL. The intentof this limit is actually to assure that the fatigue-limit-state stress range is just below the CAFL. The
FIGURE 53.9 Schematic of three different cases of the relationship between the spectrum of applied stress rangesand the S–N curve. Sre is the effective or rmc stress range and Srmax is the fatigue limit-state stress range with anexceedance of 1:10,000. Case 1 and 2 are in the finite-life regime, whereas case 3 illustrates the infinite-life regime.
© 2000 by CRC Press LLC

AASHTO LRFD procedure assumes that there is a fixed relationship between the rmc or effectivestress range and the limit-state stress range, specifically that the effective stress range is equal to halfthe limit-state stress range.
Depending on the type of details, the infinite-life regime begins at about 35 million cycles. Whendesigning for a number of cycles larger than this limit, it is no longer important to quantify theprecise number of cycles. Any design where the rmc stress range is less than half the CAFL, or wherethe fatigue-limit-state stress range is less than the CAFL, should theoretically result in essentiallyinfinite life.
The ratio of the fatigue-limit-state stress range to the effective stress range is assumed to be thesame as the ratio of the fatigue-limit-state load range to the effective load range, although this is onlyan approximation at best. Therefore, the fatigue-limit-state load range is defined as having a probabilityof exceedance over the lifetime of the structure of 0.01%. A structure with millions of cycles is likelyto see load ranges exceeding this magnitude hundreds of times, therefore, the fatigue-limit-state loadrange is not as large as the extreme loads used to check ultimate strength. The fatigue-limit-state loadrange is assumed to be about twice the effective rmc load range in the LRFD specification.
Recall that the HS20 loading with a load factor of 0.75, i.e., an HS15 loading, was defined as theeffective load in the AASHTO LRFD Specification. Therefore, the LRFD Specifications implies thatthe fatigue-limit-state truck would be HS30. The designer computes a stress range using the HS20truck with a load factor of 0.75. By assuring that this computed stress range is less than half theCAFL, the AASHTO LRFD specification is supposed to assure that the stress ranges from randomvariable traffic will not exceed the CAFL more than 0.01% of the time.
The ratio of the effective gross vehicle weight (GVW) to the GVW of the fatigue-limit-state truckin the measured spectrum is referred to in the literature as the “alpha factor” [25]. (This unfortunatechoice of nomenclature should not be confused with another alpha factor related to the ratio of theactual stress ranges in the bridge to computed stress ranges.) The LRFD Specifications imply thatalpha equals 0.5.
The alpha factor of 0.5 implied by the LRFD Specifications is not consistent with the findings ofNCHRP Report 299 [50] and the Guide Specification for Fatigue Design of Steel Bridges [53], whichimply the alpha factor should be closer to 0.33. With alpha of 0.33, the fatigue-limit-state truck isabout three times heavier than the effective fatigue truck, or about HS45. This finding was basedon a reliability analysis, comparison with the original AASHTO fatigue limit check, review ofnationwide WIM data, and a study of alpha factors from measured stress histograms.
According to the statistics of the GVW histograms [50], this HS45 fatigue-limit-state truck hasonly a 0.023% probability (about 1 in 5000) of exceedance, which is almost consistent with therecommendation from NCHRP 354 that the fatigue-limit-state stress range has an exceedance ofless than 1:10,000. If the alpha of 0.33 is correct, the stress range produced by the fatigue truckshould be compared to ⅓ the CAFL rather than ½. The HS30 fatigue-limit-state truck implied bythe AASHTO LRFD provisions clearly has a much higher probability of exceedance.
The apparent inconsistency in the exceedance level of the fatigue-limit-state truck weight wasintentional and was a result of “calibrating” the LRFD bridge specifications to give fatigue designrequirements which are similar to those of preceding specifications. The theoretically low exceedancelevel of the fatigue-limit-state truck weight implied by the LRFD code was used because it was feltthat other aspects of the design process are overconservative, such as the assumptions in thestructural analysis [54]. The Guide Specification for Fatigue Design of Steel Bridges [53] apparentlyresulted in overly conservative estimates of fatigue life when compared with observed field behavior.As a result, the LRFD Specification was “calibrated” to match existing field experience.
Measured axle load data [51,55] show axle loads which substantially exceed the 107 kN fatigue-limit-state axle load (half of the tandem axle load from the HS30 truck) implied by the AASHTOLRFD Specifications. The shape of the axle load spectra is essentially the same as the GVW spectra;i.e., the alpha factor is about 0.33. This alpha factor would suggest the fatigue-limit-state axle loadwith an exceedance level of about 1:10,000 would be approximately 160 kN. In fact, measured axle
© 2000 by CRC Press LLC
load data [55] show axle loads exceeding 160 kN in some cases. The appropriate axle load to usein general design specifications is very uncertain, however, because the measured axle load spectraare very site specific in this extreme tail of the distributions and the data are very sparse.
Aside from the fatigue-limit-state axle load or GVW, the rest of the loading spectrum does notmatter when using the infinite-life approach. Also, the precise number of cycles does not have tobe forecast. Rather, it is only necessary to establish that the total number of cycles exceeds thenumber of cycles associated with the CAFL. Therefore, it is not necessary to know precisely theexpected life of the deck and future traffic volumes. Thus, despite the uncertainty in the appropriatevalue for the fatigue-limit-state axle load, the infinite-life approach is considerably simpler thantrying to account for the cumulative damage of the whole distribution of future axle loads, whichis even more uncertain.
The infinite-life approach relies upon the CAFL as the parameter determining the fatigue resis-tance. The emphasis in fatigue testing of details should therefore be on defining the CAFL. Unfor-tunately, there is a need for additional testing to define these CAFL better. Many of the CAFL valuesin Table 53.1 were based on judgment rather than specific test data at stress ranges down near theCAFL. Additional research should be performed to investigate the validity of many of the CAFL.
Clearly, most structures carry enough truck traffic to justify an infinite-life fatigue designapproach, especially for the deck elements. For example, assuming 25-year life and a Category Cdetail it can be shown that the maximum permissible ADTT is about 850 trucks/day if the numberof cycles associated with half the CAFL is just slightly exceeded in a deck element. In most cases,designing for infinite fatigue life rather than designing for a finite number of cycles adds little cost.This infinite-life approach has also recently been applied in developing AASHTO fatigue designspecifications for wind-loaded sign, signal, and luminaire support structures [17] and modularbridge expansion joints [57–59].
In the fatigue design of bridge deck elements according to the AASHTO LRFD specifications, thefatigue design stress range is obtained from a static analysis where the wheel loads (half the axleloads) are applied in patches. The load patches in the LRFD Specifications are calculated in a mannerwhich differs from the calculation in the Standard Specifications. However, in both methods, thepatches increase in size as the load increases, which results in an applied pressure on continuousdeck surfaces which is approximately the same as typical truck tire pressures (700 kPa). In theAASHTO LRFD Specifications, the patch has a fixed width of 508 mm and a tire pressure of 860kPa. The patch increases in length as the load increases. At present, the LRFD specifications are notclear as to how load factors are to be used in calculating the patch size. It is not conservative to usethe strength load factors in calculating the patch size, since this tends to spread the load over agreater area. Ideally, the patches for the fatigue loading should be calculated on the basis of thelimit-state HS30 loading, although it would be conservative to use either the HS20 or factored HS15loading.
53.4 Fracture Resistance
As explained previously, it is considered more important to focus on the prevention of fatigue cracksin bridges than to focus on the resistance to fracture. However, for structural components whichare not subjected to significant cyclic loading, fracture could still possibly occur without prior fatiguecrack growth. The primary tension chords of long-span truss would be one example. Usually, thiswould occur as the loads are applied for the first time during construction.
Unlike fatigue, fracture behavior depends strongly on the type and strength level of the steel orfiller metal. In general, fracture toughness has been found to decrease with increasing yield strengthof a material, suggesting an inverse relationship between the two properties. In practice, however,fracture toughness is more complex than implied by this simple relationship since steels with similarstrength levels can have widely varying levels of fracture toughness.
© 2000 by CRC Press LLC
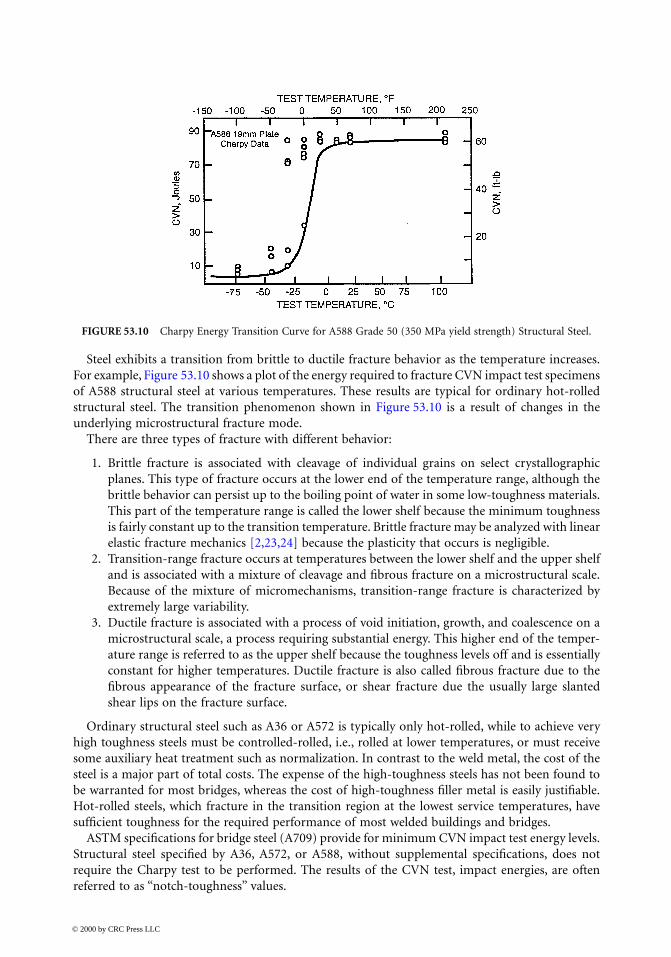
Steel exhibits a transition from brittle to ductile fracture behavior as the temperature increases.For example, Figure 53.10 shows a plot of the energy required to fracture CVN impact test specimensof A588 structural steel at various temperatures. These results are typical for ordinary hot-rolledstructural steel. The transition phenomenon shown in Figure 53.10 is a result of changes in theunderlying microstructural fracture mode.
There are three types of fracture with different behavior:
1. Brittle fracture is associated with cleavage of individual grains on select crystallographicplanes. This type of fracture occurs at the lower end of the temperature range, although thebrittle behavior can persist up to the boiling point of water in some low-toughness materials.This part of the temperature range is called the lower shelf because the minimum toughnessis fairly constant up to the transition temperature. Brittle fracture may be analyzed with linearelastic fracture mechanics [2,23,24] because the plasticity that occurs is negligible.
2. Transition-range fracture occurs at temperatures between the lower shelf and the upper shelfand is associated with a mixture of cleavage and fibrous fracture on a microstructural scale.Because of the mixture of micromechanisms, transition-range fracture is characterized byextremely large variability.
3. Ductile fracture is associated with a process of void initiation, growth, and coalescence on amicrostructural scale, a process requiring substantial energy. This higher end of the temper-ature range is referred to as the upper shelf because the toughness levels off and is essentiallyconstant for higher temperatures. Ductile fracture is also called fibrous fracture due to thefibrous appearance of the fracture surface, or shear fracture due the usually large slantedshear lips on the fracture surface.
Ordinary structural steel such as A36 or A572 is typically only hot-rolled, while to achieve veryhigh toughness steels must be controlled-rolled, i.e., rolled at lower temperatures, or must receivesome auxiliary heat treatment such as normalization. In contrast to the weld metal, the cost of thesteel is a major part of total costs. The expense of the high-toughness steels has not been found tobe warranted for most bridges, whereas the cost of high-toughness filler metal is easily justifiable.Hot-rolled steels, which fracture in the transition region at the lowest service temperatures, havesufficient toughness for the required performance of most welded buildings and bridges.
ASTM specifications for bridge steel (A709) provide for minimum CVN impact test energy levels.Structural steel specified by A36, A572, or A588, without supplemental specifications, does notrequire the Charpy test to be performed. The results of the CVN test, impact energies, are oftenreferred to as “notch-toughness” values.
FIGURE 53.10 Charpy Energy Transition Curve for A588 Grade 50 (350 MPa yield strength) Structural Steel.
© 2000 by CRC Press LLC

The CVN specification works by assuring that the transition from brittle to ductile fracture occursat some temperature less than service temperature. This requirement ensures that brittle fracturewill not occur as long as large cracks do not develop. Because the Charpy test is relatively easy toperform, it will likely continue to be the measure of toughness used in steel specifications. Often34 J (25 ft-lbs), 27 J (20 ft-lbs), or 20 J (15 ft-lbs) are specified at a particular temperature. Theintent of specifying any of these numbers is the same, i.e., to make sure that the transition startsbelow this temperature.
Some Charpy toughness requirements for steel and weld metal for bridges are compared inTable 53.2. This table is simplified and does not include all the requirements.
Note that the bridge steel specifications require a CVN at a temperature that is 38°C greater thanthe minimum service temperature. This “temperature shift” accounts for the effect of strain rates,which are lower in the service loading of bridges (on the order of 10–3) than in the Charpy test(greater than 101) [23]. It is possible to measure the toughness using a Charpy specimen loaded ata strain rate characteristic of bridges, called an intermediate strain rate, although the test is moredifficult and the results are more variable. When the CVN energies from an intermediate strain rateare plotted as a function of temperature, the transition occurs at a temperature about 38°C lowerfor materials with yield strength up to 450 MPa.
As shown in Table 53.2, the AWS D1.5 Bridge Welding Code specifications for weld metal tough-ness are more demanding than the specifications for base metal. The extra margin of fracturetoughness in the weld metal is reasonable because the weld metal is always the location of discon-tinuities and high tensile residual stresses. Because the cost of filler metal is relatively small incomparison with the overall cost of materials, it is usually worth the cost to get high-toughnessfiller metal.
The minimum CVN requirements are usually sufficient to assure damage tolerance, i.e., to allowcracks to grow quite long before fracture occurs. Fatigue cracks grow at an exponentially increasingrate; therefore, most of the fatigue life transpires while the crack is very small. Additional fracturetoughness, greater than the minimum specified values, will allow the crack to grow to a larger sizebefore sudden fracture occurs. However, the crack is growing so rapidly at the end of life that theadditional toughness may increase the life only insignificantly. Therefore, specification of toughnesslevels exceeding these minimum levels is usually not worth the increased cost of the materials.
The fractures of steel connections that occurred in the Northridge earthquake of 1994 is anexample of what can happen if there are no filler metal toughness specifications. At that time, therewere no requirements for weld metal toughness in AWS D1.1 for buildings, even for seismic weldedsteel moment frames (WSMF). This lack of requirements was rationalized because typically theweld deposits are higher toughness than the base metal. However, this is not always the case; e.g.,the self-shielded flux-cored arc welds (FCAW-S) used in many of the WSMF that fractured in theNorthridge earthquake were reported to be very low toughness [5–7].
TABLE 53.2 Minimum Charpy Impact Test Requirements for Bridges and Buildings
Minimum Service Temperature
Material –18°C, J@°C –34°C, J@°C –51°C, J@°C
Steel: nonfracture-critical membersa,b 20@21 20@4 20@–12
Steel: fracture-critical membersa,b 34@21 34@4 34@–12
Weld metal for nonfracture criticala 27@–18 27@–18 27@–29
Weld metal for fracture criticala,b 34@–29 for all service temperatures
a These requirements are for welded steel with minimum specified yield strength up to350 MPa up to 38 mm thick. Fracture-critical members are defined as those which iffractured would result in collapse of the bridge.
b The requirements pertain only to members subjected to tension or tension due tobending.
© 2000 by CRC Press LLC

ASTM A673 has specifications for the frequency of Charpy testing. The H frequency requires aset of three CVN specimens to be tested from one location for each heat or about 50 tons. Thesetests can be taken from a plate with thickness up to 9 mm different from the product thickness ifit is rolled from the same heat. The P frequency requires a set of three specimens to be tested fromone end of every plate, or from one shape in every 15 tons of that shape. For bridge steel, theAASHTO specifications require CVN tests at the H frequency as a minimum. For fracture-criticalmembers, the guide specifications require CVN testing at the P frequency. In the AISC specifications,CVN tests are required at the P frequency for thick plates and jumbo sections. A special test locationin the core of the jumbo section is specified, as well as the requirement that the section tested beproduced from the top of the ingot.
Even the P testing frequency may be insufficient for as-rolled structural steel. In a recent reportfor NCHRP [60], CVN data were obtained from various locations on bridge steel plates. The datashow that because of extreme variability in CVN across as-rolled plates, it would be possible to misspotentially brittle areas of plates if only one location per plate is sampled. For plates that were givena normalizing heat treatment, the excessive variability was eliminated.
Quantitative means for predicting brittle fracture are available, i.e., fracture mechanics[2,6,11–13,23,24,61]. These quantitative fracture calculations are typically not performed in design,but are often used in service to assess a particular defect. There is at best only about plus or minus30% accuracy in these fracture predictions, however. Several factors contributing to this lack ofaccuracy include (1) variability of material properties; (2) changes in apparent toughness valueswith changes in test specimen size and geometry; (3) differences in toughness and strength of theweld zone; (4) complex residual stresses; (5) high gradients of stress in the vicinity of the crack dueto stress concentrations; and (6) the behavior of cracks in complex structures of welded intersectingplates.
53.5 Summary
1. Structural elements where the live load is a large percentage of the total load are potentiallysusceptible to fatigue. Many factors in fabrication can increase the potential for fatigueincluding notches, misalignment, and other geometric discontinuities, thermal cutting, weldjoint design (particularly backing bars), residual stress, nondestructive evaluation and welddefects, intersecting welds, and inadequate weld access holes. The fatigue design proceduresin the AASHTO Specifications are based on control of the stress range and knowledge of thefatigue strength of the various details. Using these specifications, it is possible to identify andavoid details which are expected to have low fatigue strength.
2. The simplified fatigue design method for infinite life is justified because of the uncertaintyin predicting the future loading on a structure. The infinite-life fatigue design philosophyrequires that essentially all the stress ranges are less than the CAFL. One advantage of thisapproach for structures with complex stress histories is that it is not necessary to predictaccurately the entire future stress range distribution. The fatigue design procedure simplyrequires a knowledge of the stress range with an exceedance level of 1:10,000. The infinite-life approach relies upon the CAFL as the parameter determining the fatigue resistance. Theemphasis in fatigue testing of details should therefore be on defining the CAFL. Additionalresearch should be performed to investigate the validity of many of the CAFL in the presentspecification.
3. Welded connections and thermal-cut holes, copes, blocks, or cuts are potentially susceptibleto brittle fracture. Many interrelated design variables can increase the potential for brittlefracture including lack of redundancy, large forces and moments with dynamic loading rates,thick members, geometric discontinuities, and high constraint of the connections. Low tem-perature can be a factor for exposed structures. The factors mentioned above that influence
© 2000 by CRC Press LLC

the potential for fatigue have a similar effect on the potential for fracture. In addition, coldwork, flame straightening, weld heat input, and weld sequence can also affect the potentialfor fracture. The AASHTO Specifications require a minimum CVN “notch toughness” at aspecified temperature for the base metal and the weld metal of members loaded in tensionor tension due to bending. Almost two decades of experience with these bridge specificationshave proved that they are successful in significantly reducing the number of brittle fractures.
References
1. “AASHTO, LRFD Bridge Design Specifications, American Association of State Highway Transpor-tation Officials, Washington, D.C., 1994.
2. Fisher, J. W., The evolution of fatigue resistant steel bridges, in 1997 Distinguished Lectureship,Transportation Research Board, 76th Annual Meeting, Washington, D.C., Jan. 12–16, 1997, PaperNo. 971520: 1–22.
3. Fisher, J. W., Fatigue and Fracture in Steel Bridges, John Wiley & Sons, New York, 1984.4. Fisher, J. W., Pense, A. W., and Roberts, R., Evaluation of fracture of Lafayette Street Bridge, J.
Struct. Div. ASCE, 103(ST7), 1977.5. Kaufmann, E. J., Fisher, J. W., Di Julio, R. M., Jr., and Gross, J. L., Failure Analysis of Welded Steel
Moment Frames Damaged in the Northridge Earthquake, NISTIR 5944, National Institute ofStandards and Technology, Gaithersburg, MD, January 1997.
6. Fisher, J. W., Dexter, R. J. and Kaufmann, E. J., Fracture mechanics of welded structural steelconnections, in Background Reports: Metallurgy, Fracture Mechanics, Welding, Moment Connec-tions, and Frame Systems Behavior, Report No. SAC 95-09, FEMA-288, March 1997.
7. Kaufmann, E. J., Xue, M., Lu, L.-W., and Fisher, J. W., Achieving ductile behavior of momentconnections, Mod. Steel Constr., 36(1), 30–39, January 1996; see also, Xue, M., Kaufmann, E. J.,Lu, L.-W., and Fisher, J. W., Achieving ductile behavior of moment connections — Part II, Mod.Steel Constr., 36(6), 38–42, June 1996.
8. Engineers Investigate Cracked El, Eng. News Rec., 200(3), January 19, 1979.9. Miki, C., Fractures in seismically loaded bridges, Prog. Struct. Eng. Mat., 1(1), 115–121, September
1997.10. ANSI/AWS D1.1, Structural Welding Code — Steel, American Welding Society, Miami, 1996.11. Dexter, R. J., Load-deformation behavior of cracked high-toughness steel members, in Proceedings
of the 14th International Conference on Offshore Mechanics and Arctic Engineering Conference(OMAE), 18–22 June 1995, Copenhagen Denmark, Salama et al., Eds., Vol. III, Materials Engineer-ing, AMSE, 1995, 87–91.
12. Dexter, R. J. and Gentilcore, M. L., Evaluation of Ductile Fracture Models for Ship StructuralDetails, Report SSC-393, Ship Structure Committee, Washington, D.C., 1997.
13. Dexter, R. J. and Gentilcore, M. L., Predicting extensive stable tearing in structural components,in Fatigue and Fracture Mechanics: 29th Volume, ASTM STP 1321, T. L. Panontin and S. D. Shep-pard, Eds., American Society for Testing and Materials, Philadelphia, 1998.
14. Dexter, R. J., Significance of strength undermatching of welds in structural behaviour, in Mis-Matching of Interfaces and Welds, K.-H. Schwalbe and M. Kocak, Eds., GKSS Research Center,Geesthacht, Germany, 1997, 55–73.
15. Castiglioni, C. A., Cumulative damage assessment in structural steel details, in IABSE Symposium,Extending the Lifespan of Structures, San Francisco, IABSE, 1995, 1061–1066.
16. Krawinkler, H. and Zohrei, M., Cumulative damage in steel structures subjected to earthquakeground motion, Comput. Struct., 16 (1–4), 531–541, 1983.
17. Kaczinski, M. R., Dexter, R. J., and Van Dien, J. P., Fatigue-Resistant Design of Cantilevered Signal,Sign, and Light Supports, NCHRP Report 412, National Cooperative Highway Research Pro-gram,Transportation Research Board, Washington, D.C., 1998
© 2000 by CRC Press LLC

18. Fisher, J. W., Frank, K. H., Hirt, M. A., and McNamee, B. M., Effect of Weldments on the FatigueStrength of Steel Beams, National Cooperative Highway Research Program (NCHRP) Report 102,Highway Research Board, Washington, D.C., 1970.
19. Fisher, J. W., Albrecht, P. A., Yen, B. T., Klingerman, D. J., and McNamee, B. M., Fatigue Strengthof Steel Beams with Welded Stiffeners and Attachments, National Cooperative Highway ResearchProgram (NCHRP) Report 147, Transportation Research Board, Washington, D.C., 1974.
20. Dexter, R. J., Fisher, J. W. and Beach, J. E., Fatigue behavior of welded HSLA-80 members, inProceedings, 12th International Conference on Offshore Mechanics and Arctic Engineering, Vol. III,Part A, Materials Engineering, ASME, New York, 1993, 493–502.
21. Keating, P. B. and Fisher, J. W., Evaluation of Fatigue Tests and Design Criteria on Welded Details,NCHRP Report 286, National Cooperative Highway Research Program, September 1986.
22. VanDien, J. P., Kaczinski, M. R., and Dexter, R. J., Fatigue testing of anchor bolts, in Building anInternational Community of Structural Engineers, Vol. 1, Proc. of Structures Congress XIV, Chicago,1996, 337–344.
23. Barsom, J. M. and Rolfe, S. T., Fracture and Fatigue Control in Structures, 2nd ed., Prentice-Hall,Englewood Cliffs, NJ, 1987.
24. Broek, D. Elementary Fracture Mechanics, 4th ed., Martinis Nijhoff Publishers, Dordrecht,Netherlands, 1987.
25. Kober, Dexter, R. J., Kaufmann, E. J., Yen, B. T., and Fisher, J. W., The effect of welding disconti-nuities on the variability of fatigue life, in Fracture Mechanics, Twenty-Fifth Volume, ASTM STP1220, F. Erdogan and Ronald J. Hartranft, Eds., American Society for Testing and Materials,Philadelphia, 1994.
26. Dexter, R. J., Tarquinio, J. E., and Fisher, J. W., An application of hot-spot stress fatigue analysis toattachments on flexible plate, in Proceedings of the 13th International Conference on Offshore Mechanicsand Arctic Engineering, American Society of Mechanical Engineers (ASME), New York, 1994.
27. Yagi, J., Machida, S., Tomita, Y., Matoba, M., and Kawasaki, T., Definition of Hot-Spot Stress inWelded Plate Type Structure for Fatigue Assessment, International Institute of Welding, IIW-XIII-1414-91, 1991.
28. AISC, Load and Resistance Factor Design Specification for Structural Steel Buildings, 2nd ed., Amer-ican Institute of Steel Construction (AISC), Chicago, 1993.
29. ENV 1993-1-1, Eurocode 3: Design of steel structures — Part 1.1: General rules and rules forbuildings, European Committee for Standardization (CEN), Brussels, April 1992.
30. Roberts, R. et al., Corrosion Fatigue of Bridge Steels, Vol. 1–3, Reports FHWA/RD-86/165, 166,and 167, Federal Highway Administration, Washington, D.C., May 1986.
31. Outt, J. M. M., Fisher, J. W., and Yen, B. T., Fatigue Strength of Weathered and Deteriorated RivetedMembers, Report DOT/OST/P-34/85/016, Department of Transportation, Federal HighwayAdministration, Washington, D.C., October 1984.
32. Albrecht, P. and Shabshab, C., Fatigue strength of weathered rolled beam made of A588 steel, J.Mater. Civil Eng. (ASCE), 6(3), 407–428, 1994.
33. Demers, C. and Fisher, J. W., Fatigue Cracking of Steel Bridge Structures, Vol. I: A Survey ofLocalized Cracking in Steel Bridges — 1981 to 1988, Report No. FHWA-RD-89-166; also, VolumeII, A Commentary and Guide for Design, Evaluation, and Investigating Cracking, Report No.FHWA-RD-89-167, FHWA, McLean, VA, March 1990.
34. Yen, B. T., Huang, T., Lai, L.-Y., and Fisher, J. W., Manual for Inspecting Bridges for Fatigue DamageConditions, Report No. FHWA-PA-89-022 + 85-02, Fritz Engineering Laboratory Report No. 511.1,Pennsylvania Department of Transportation, Harrisburg, PA., January 1990.
35. BS 7608, Code of Practice for Fatigue Design and Assessment of Steel Structures, British StandardsInstitute, London, 1994.
36. Maddox, S. J., Fatigue Strength of Welded Structures, 2nd ed., Abington Publishing, Cambridge,U.K., 1991.
© 2000 by CRC Press LLC
37. Fisher, J. W., Jian, J., Wagner, D. C., and Yen, B. T., Distortion-Induced Fatigue Cracking in SteelBridges, National Cooperative Highway Research Program (NCHRP) Report 336, TransportationResearch Board, Washington, D.C., 1990.
38. Fisher, J. W. and Keating, P. B., Distortion-induced fatigue cracking of bridge details with web gaps,J. Constr. Steel Res., 12, 215–228, 1989.
39. Fisher, J. W., Kaufmann, E. J., Koob, M. J., and White, G., Cracking, fracture assessment, and repairsof Green River Bridge, I-26, in Proc. of Fourth International Bridge Engineering Conference, SanFrancisco, Aug. 28–30, 1995, Vol 2, National Academy Press, Washington, D.C., 1995, 3–14.
40. Fisher, J. W., Yen, B. T., Kaufmann, E. J., Ma, Z. Z. and Fisher, T. A., Cracking evaluation and repairof cantilever bracket tie plates of Edison Bridge, in Proc. of Fourth International Bridge EngineeringConference, San Francisco, Aug. 28–30, 1995, Vol 2, National Academy Press, Washington, D.C.1995, 15–25.
41. Yen, B. T. et al., Fatigue behavior of stringer-floorbeam connections, in Proc. of the Eighth Inter-national Bridge Conference, Paper IBC-91-19, Engineers’ Society of Western Pennsylvania, 1991,149–155.
42. ACI Committee 215, Considerations for Design of Concrete Structures Subjected to Fatigue Load-ing, ACI 215R-74 (Revised 1992), ACI Manual of Standard Practice, Vol. 1, 1996.
43. Hahin, C., Effects of Corrosion and Fatigue on the Load-Carrying Capacity of Structural Steel andReinforcing Steel, Illinois Physical Research Report No. 108, Illinois Department of Transportation,Springfield, March 1994.
44. Pfister, J. F. and Hognestad, E., High strength bars as concrete reinforcement. Part 6, fatigue tests,J. PCA Res. Dev. Lab., 6(1), 65–84, 1964.
45. Sternberg, F., Performance of Continuously Reinforced Concrete Pavement, I-84 Southington,Connecticut State Highway Department, June 1969.
46. Rabbat, B. G. et al., Fatigue tests of pretensioned girders with blanketed and draped strands, J.Prestressed Concrete Inst., 24(4), 88–115, 1979.
47. Overnman, T. R., Breen, J. E., and Frank, K. H., Fatigue Behavior of Pretensioned Concrete Girders,Research Report 300-2F, Center for Transportation Research, The University of Texas at Austin,November 1984.
48. Ad hoc Committee on Cable-Stayed Bridges, Recommendations for Stay Cable Design and Testing,Post-Tensioning Institute, Phoenix, January 1986.
49. Miner, M. A., Cumulative damage in fatigue, J. Appl. Mech., 12, A-159, 1945.50. Moses, F., Schilling, C. G., and Raju, K. S., Fatigue Evaluation Procedures for Steel Bridges, NCHRP
Report 299, National Cooperative Highway Research Program, 1987.51. Schilling, C. G., Variable Amplitude Load Fatigue, Task A — Literature Review, Vol. I: — Traffic Loading
and Bridge Response, Publ. No. FHWA-RD-87-059, Federal Highway Administration, July 1990.52. Fisher, J. W., et al., Resistance of Welded Details under Variable Amplitude Long-Life Fatigue
Loading, National Cooperative Highway Research Program Report 354, Transportation ResearchBoard, Washington, D.C., 1993.
53. American Association of State Highway and Transportation Officials, Guide Specifications forFracture Critical Non-Redundant Steel Bridge Members, American Association of State Highwayand Transportation Officials, Washington, D.C., 1989 (with interims).
54. Dexter, R. J. and Fisher, J. W., The effect of unanticipated structural behavior on the fatiguereliability of existing bridge structures, in Structural Reliability in Bridge Engineering, D. M. Fran-gopol and G. Hearn, Eds., Proceedings of a Workshop, University of Colorado at Boulder, 2–4 Oct.1996, McGraw-Hill, New York, 1996, 90–100.
55. Nowak, A. S. and Laman, J. A., Monitoring Bridge Load Spectra, in IABSE Symposium, Extendingthe Lifespan of Structures, San Francisco, 1995.
56. Menzemer, C. C. and Fisher, J. W., Revisions to the Aluminum Association fatigue design specifi-cations, 6th Int. Conf. on Aluminum Weldments, April 3–5, 1995, Cleveland. Available from AWS,Miami, FL, 1995, 11–23.
© 2000 by CRC Press LLC
57. Dexter, R. J., Connor, R. J., and Kaczinski, M. R., Fatigue Design of Modular Bridge ExpansionJoints, NCHRP Report 402, National Cooperative Highway Research Program, TransportationResearch Board, Washington, D.C., 1997.
58. Dexter, R. J., Kaczinski, M. R., and Fisher, J. W., Fatigue testing of modular expansion joints forbridges, in IABSE Symposium, 1995, Extending the Lifespan of Structures, Vol. 73/2, San Francisco,1995, 1091–1096.
59. Kaczinski, M. R., Dexter, R. J., and Connor, R. J., Fatigue design and testing of modular bridgeexpansion joints, in Proceedings of the Fourth World Congress on Joint Sealing and Bearing Systemsfor Concrete Structures, Sacramento, September 1996.
60. Frank, K. H., et al., Notch Toughness Variability in Bridge Steel Plates, NCHRP Report 355,National Cooperative Highway Research Program, 1993.
61. PD 6493, Guidance on the Methods for Assessing the Acceptability of Flaws in Fusion WeldedStructures, PD 6493: 1991, British Standards Institution (BSI), London, 1991.
© 2000 by CRC Press LLC