feasibility of natural gas supply from russia to korea · 2020-04-04 · feasibility of natural gas...
TRANSCRIPT

- 77-
에너지경제연구 제10권 제 2호Korean Energy Economic ReviewVolume 10, Number 2, September 2011 : pp. 77~110
Feasibility of Natural Gas Supply from Russia to Korea
Ekaterina Zelenovskaya*1)
Abstract
In this paper author calculates the price of gas for the planned gas supply
project from Russia to Korea. That price includes: the gas production cost in
the prospective gas fields in Russian East regions, gas pipeline transportation
cost across Russia to the Pacific coast, and further gas transportation by gas
pipeline through the Korean Peninsula or transportation of gas by tankers as
liquefied natural gas (LNG), to the Korean consumers. It also includes
expected minimum return rates of investment (hurdle rates).
Our calculations show that the estimated prices of Russian gas in Korea in
2010 US constant dollar during the period of the possible contract from 2017
to 2041 could be as follow: for PNG (pipeline natural gas) 12.91 $/MBtu (468
$/1000m3), and for LNG 13.22 $/MBtu (479 $/1000m3), which is rather
competitive with the projected oil price between 18.37 and 25.79 $/MBtu or
106 and 150 $ per barrel of crude oil for the same period of time. This
suggests that supplying Russian natural gas to Korea is cost effective in
either PNG or LNG form.
Key Words : Gas supply cost, LNG, Gas pipeline, Energy cooperation,
Northeast Asia, Korea
Jel Codes : Q48, P48, L95
* Institute of Energy Systems and Climate Change (IECC) of Ajou University, San 5, Woncheon-dong, Yeongtong-gu, Suwon 443-749, Republic of Korea, [email protected]

에 지경제연구 ● 제10권 제2호
- 78-
1. Introduction
For substantial strengthening of climate policy actions and since fossil fuels
will remain the dominant sources of primary energy in the next decades, natural
gas, having the lowest carbon emissions content per unit of energy relative to coal
and oil, will play a key role in the energy policies worldwide [1]. The demand
for gas has consequently significantly increased, especially in the Asia Pacific
Region. China and India see the most rapid rates of gas share increase in their
primary energy mix. At the same time Korea, Japan, and Taiwan heavily rely on
liquefied natural gas (LNG) imports for their gas supplies from Malaysia, Brunei,
Indonesia, Australia and the Middle East. On the other hand, Russian Eastern
Siberia (RES) and Far East (RFE) regions (which are also part of the NEA) are
rich with natural gas, oil and coal and considerably closer to the NEA consumers
than the other gas producers. For instance, a possible onshore pipeline route from
Russian port Vladivostok to South Korean port Samchuck is about 980 km and
690 km offshore respectively, while the distances between Korea and its other
LNG suppliers are 4,140 km - from the closest producer- Brunei, and 13,800 km
- from the farthest supplier - Qatar.
Moreover, Korea has a growing gas industry that is heavily dependent on
imports and relies almost exclusively on importing gas in liquefied form. LNG
imports account for nearly all of the Korean gas supply. Due to the high
dependence on LNG imports from the Middle East producers (51% of the total
LNG import) and unexpected disruption of gas supply from Indonesia such as the
shutdown of the Arun LNG plant for several months [2], diversification of the
Korean gas import sources became a very important matter for Korea, and one of

Feasibility of Natural Gas Supply from Russia to Korea
- 79-
the preferable sources of alternative gas supply is Russia [3].
At the same time, Russia seeks to increase its presence in Asian markets [4],
but the high cost of development of Greenfield gas deposits in RES and RFE
regions and its associated long-distance transportation to the Asian gas markets
made the supply of Russian gas to Korea economically inefficient [3]. The
economics is becoming more favourable in the last decade because of the rapid
increasing in oil prices and correspondingly in the gas prices.1) This makes gas
production from the difficultly-accessible deposits in the RES and RFE regions
more practical and also very attractive for sustainable development of the Russian
Eastern part and for Northeast Asia as a whole.
This study developed the methodology for enabling the calculation of the
minimum prices of gas supply from the RES and RFE regions to Korea.
Specifically it determines the price of gas supply from the Chayanda oil and gas
condensate field (OGCF) in the Republic of Sakha (RES) together with the gas
from Sakhalin III gas fields offshore of Sakhalin Island (RFE), with gas
transportation by pipelines across Russia to the Pacific coast (port Vladivostok)
and further gas transportation from Vladivostok to South Korean consumers, by
tankers as LNG, or, alternatively, by a land pipeline through the Korean
Peninsula.
While there are several publications analysing the economic feasibility of
Russian gas supply to Korea [5-6], including feasibility studies conducted by
companies such as UKOS (Russia), BP (UK), Kogas (Korea) jointly with the
government of Sakha Republic (RES) that worked in eastern Russian gas projects,
the question of the Russian gas supply cost for Korea still remains open because
of two reasons. First, because the previous works examined the different sources
and therefore routes of gas supply to Korea [5] which are resulting in different
1) Since in all Korean long-term gas supply contracts the gas price is still linked to the oil price by the price formula.

에 지경제연구 ● 제10권 제2호
- 80-
level of final gas price. For example such as the gas supply from Kovykta field
near Irkutsk city (RES) by 4,100 km gas pipeline to northeast China and Korea
[5; 3]. Second, because the past studies were conducted under different economic
assumptions of the gas supply projects, such as different levels of taxation,
different field development schemes (production sharing agreements, concessions
etc), as well as for different inflation and discount rates. The previous studies also
employed the assessment of the economic feasibility of the project mostly by the
Net Present Value (NPV) criteria. This criterion, however, do not show to the
buyer the economic merit of the project. From the gas buyer point of view, the
project is feasible and desirable if the price of gas by the planning project is
equal or lower than the projected gas market price. In this connection, in this
study author employed the assessment of the economic feasibility of the project
by slight different methodology which allows calculating the minimum acceptable
price of gas at which the project could already proceed. Taking into account all
differences with the previous studies mentioned above, our study on the gas
supply from Cahyanda and Sakhalin III gas fields with its consequent
transportation to Pacific coast and then directly to Korea is unique in the
literature on Russian gas supply to Korea and important for assessing the
feasibility of the Russian-Korean gas supply project under the current economic
conditions.
To define the possible minimum price of Russian gas supplied to Korea:
DES.2) (Samchuck3)) we calculate the total price of gas supply which includes the
gas production cost in the prospective gas fields (Chayanda and Sakhalin III), gas
pipeline transportation cost across Russia to the Pacific coast, the gas
2) Delivered Ex Ship (named port) -where goods are delivered ex ship, the passing of risk does not occur until the ship has arrived at the named port of destination and the goods made available for unloading to the buyer. The seller pays the freight and insurance costs. Costs for unloading the goods and any duties, taxes, etc… are for the Buyer [15].
3) The marine port, planning LNG terminal at the North-East cost of the Republic of Korea.

Feasibility of Natural Gas Supply from Russia to Korea
- 81-
transportation cost from the Pacific coast by LNG tankers and alternatively by gas
pipeline through the Korean Peninsula (PNG transportation), as well as the
minimum rates of return by capital in each element of gas supply chain (gas
production, transportation, liquefaction).
To determine the optimal parameters (diameter and working pressure) of
trunk gas pipelines the author employed computational methods of fluid dynamics.
constituting thereby a bottom-up cost estimation to make pre-engineering estimates
of gas production, pipeline and LNG transportation costs. This analysis is
integrated with a cost-benefit and breakeven analysis of all gas supply related
projects, such as production, transportation, gas liquefaction projects.
2. Planning Russian-Korean natural gas supply project: general information
This section provides some general information about the possible Russian-
Korean natural gas supply project and its background.
2.1. Russian-Korean natural gas supply project: background
Korea’s interest in the Russian gas supply dates back to the late 1980’s.
Since that time, the Russian Eastern Siberia and Far East regions had been
considered as a potential base for gas supply to Korea. During the Soviet era and
the first decade after the breakup of the Soviet union in 1991, all gas export
projects to Asian markets have however failed to progress because of a mixture of
political, commercial and institutional obstacles [3]. Since 2002 the situation
changed fundamentally after the Russian Government started preparing the program

에 지경제연구 ● 제10권 제2호
- 82-
for a unified system of gas production, transmission and distribution in Eastern
Siberia and the Far East, taking into account the possibility of exports to China
and other Pacific-Asia countries (Eastern gas program [7]). The Russian gas
monopoly company JSC Gazprom was appointed by the Russian government as
the program execution coordinator. Russian-Korean negotiations about the gas
industry progressed since that time. On May 12, 2003 Gazprom and Korea’s
Kogas entered into a five-year Agreement of Cooperation which was extended for
another five-year term in 2008. The agreement embraces a wide spectrum of
issues including the study of possible ways to deliver Russian natural gas to
Korea. In November 2010 the parties entered into the next stage of negotiations
and signed a “road map” to export Russian gas to South Korea. According to the
document deliveries of natural gas will start in 2017, and the volumes of import
are planned to be as much as 10 billion cubic meters per year [4]. The duration
of the planned long-term contract is expected to be 25 years.
2.2. Details of the gas supply
The natural gas to Korea from Russia may be delivered in liquefied (as
LNG) or compressed (as CNG) form, by tankers or by a land pipeline (as PNG)
[4]. A possible route of the pipeline is through the Korean Peninsula.
According to the Eastern Gas Program, the sources of gas supply to Korea
would be the Sakhalin III gas field offshore of Sakhalin Island (RFE) and the
Chayanda oil and gas condensate field (OGCF) in the Republic of Sakha (RES).
According to this program, the transportation of gas will start from the Russian
fields to its Pacific coast as follows:
1. From the Sakhalin III gas fields by the recently constructed Sakhalin-
Khabarovsk-Vladivostok gas transportation system (GTS).

Feasibility of Natural Gas Supply from Russia to Korea
- 83-
2. From the Chayanda gas field, by a planned pipeline Yakutia-Khabarovsk
with subsequent integration into the Sakhalin-Khabarovsk-Vladivostok GTS.
In the Russian Pacific port Vladivostok, the gas would be pumped into the
planned Trans-Korean gas pipeline, or optionally, liquefied in the planned LNG
plant [8] and transported to Korea by tankers (Figure 1). The CNG transportation
which is also one of the options of international gas transportation to Korea is
not included in the scope of our study due to the lack of sufficient technical and
economical data on marine CNG transportation methodology and gas compression
plants.
Figure 1. The map of the possible project of gas supply from Russia to Korea.
As seen from the map, the physical infrastructure of the planned gas supply
system to Korea includes the following seven elements:

에 지경제연구 ● 제10권 제2호
- 84-
1. The Sakhalin III gas field;
2. The Chayanda OGCF;
3. The Sakhalin - Khabarovsk - Vladivostok GTS ;
4. The Yakutia - Khabarovsk gas pipeline ;
5. The liquefaction plant (optional);
6. Marine LNG transportation (optional);
7. Trans-Korean gas pipeline (optional).
A short description of each of these elements follows.
2.3. Description of the projects
The Sakhalin III project involves the development of the Kirinskoye gas field
(located 50 km offshore, at water depth around 150 m), which are the Ayashsky
and East Odoptinsky blocks of Sakhalin III field. Gas reserves and resources of
the Sakhalin III project are estimated at some 1.4 trillion cubic meters. The field
is scheduled to become operational in 2014 [9] and the annual gas production
from the field will be at the level of 28.6 billion cubic meters (bcm) [10].
The Chayanda OGCF in East Siberia in Sakha Repuplic (also known as
Republic of Yakutia) is the biggest gas field in the planned Yakutsk center of gas
production in Eastern Siberia.4) The Chayandinskoye field’s proved reserves consist
of 1.24 trillion cubic meters of gas and 68.4 million (M) tons of oil and gas
condensate [11]. Annual gas production from the field will be at the level of 31
bcm [12]. It is projected to start oil and gas production from the Chayandinskoye
field in 2014 and 2016, respectively.
The Sakhalin–Khabarovsk–Vladivostok pipeline is for the transport of
4) According to the [7] it is planned to establish four new gas production provinces in east Siberia, namely Krasnoyarsk, Irkutsk, Sakhalin, Yakutsk gas production centers.

Feasibility of Natural Gas Supply from Russia to Korea
- 85-
Sakhalin’s gas to the Vladivostok port and then to the customers in the Far East
countries. The total length of the Sakhalin–Khabarovsk–Vladivostok pipeline is
1,837 km. The maximal annual capacity is 31.7 bcm. The diameter of the pipeline
is 1,220 mm, and the maximum rated pressure is 9.8 megapascals (MPa).
The Yakutia–Khabarovsk pipeline will start from the Chayanda OGCF in
Yakutia. In Khabarovsk city, it will be connected with the Sakhalin-Khabarovsk-
Vladivostok GTS. Together, the pipelines will feed a planned LNG plant that will
produce LNG for export to NEA, or that will feed a Trans-Korean gas pipeline
(if built). The total length of the Yakutia–Khabarovsk pipeline will be about
2,800 kilometres and total length of pipeline from Yakytia to Pacific Ocean (port
Vladivostok) is 4,383 km. The maximum annual capacity is 31.7 bcm. The
diameter of the pipeline is 1,220 mm, and the maximum rated pressure is 9.8
MPa.
The LNG plant near Vladivostok will be built in the period 2015~2018, and
its capacity could be 10 M tons of LNG per year. Two 5 M ton LNG trains are
expected to be built. Such plans had been considered by the Board of Gazprom’s
Directors (as related to the development of gas processing and gas chemicals
industry in eastern Russia) in February 2011.
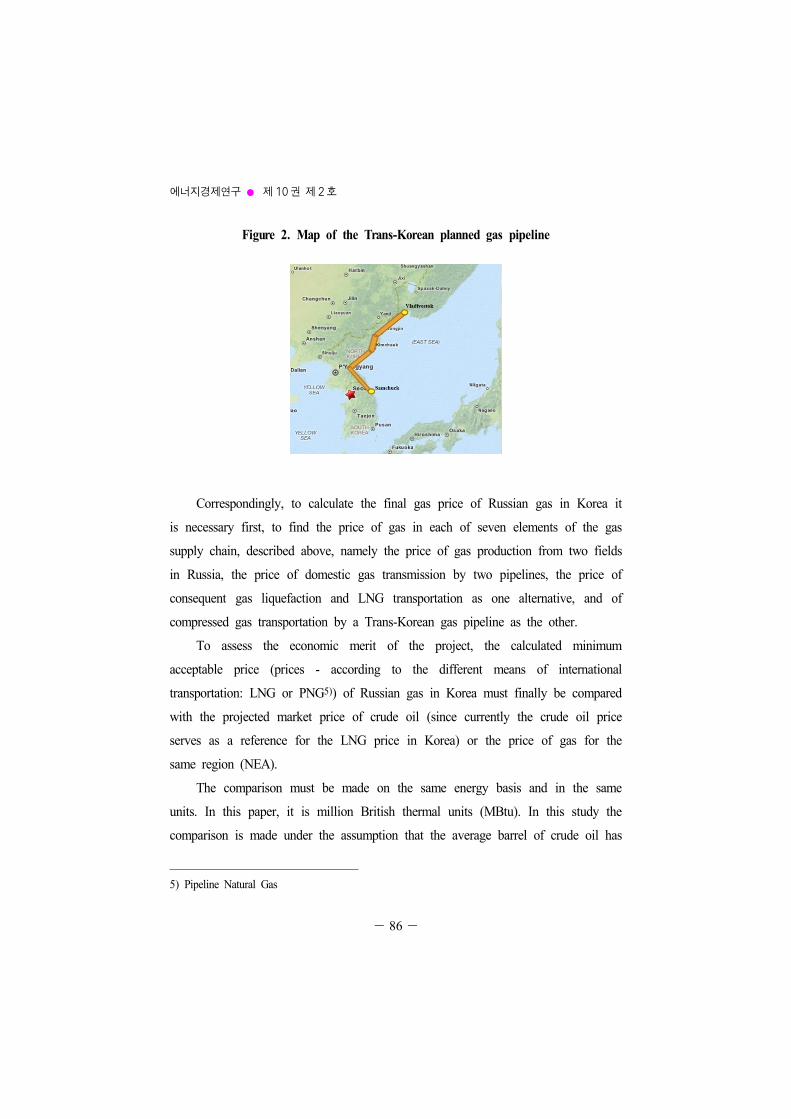
Until our study completion time there was no technical and economic
information on a planned Trans-Korean gas pipeline (Figure 2). Consequently, the
technical and economic parameters of planning this gas pipeline were determined
and calculated by the author for this study. In this analysis she determined that
for supplying 10 bcm of gas to Korea per year it is optimal to build the pipeline
with a 1,020 mm internal diameter and operation at 5.45 MPa maximum rated
pressure. The length of the pipeline from the Vladivostok port to the destination
point – Korean port Samchuck, is 980 km. In the optimization analysis it was
chosen to space the compressor stations 130 km apart, thus requiring 8 such
stations.
에 지경제연구 ● 제10권 제2호
- 86-
Figure 2. Map of the Trans-Korean planned gas pipeline
Correspondingly, to calculate the final gas price of Russian gas in Korea it
is necessary first, to find the price of gas in each of seven elements of the gas
supply chain, described above, namely the price of gas production from two fields
in Russia, the price of domestic gas transmission by two pipelines, the price of
consequent gas liquefaction and LNG transportation as one alternative, and of
compressed gas transportation by a Trans-Korean gas pipeline as the other.
To assess the economic merit of the project, the calculated minimum
acceptable price (prices - according to the different means of international
transportation: LNG or PNG5)) of Russian gas in Korea must finally be compared
with the projected market price of crude oil (since currently the crude oil price
serves as a reference for the LNG price in Korea) or the price of gas for the
same region (NEA).
The comparison must be made on the same energy basis and in the same
units. In this paper, it is million British thermal units (MBtu). In this study the
comparison is made under the assumption that the average barrel of crude oil has
5) Pipeline Natural Gas

Feasibility of Natural Gas Supply from Russia to Korea
- 87-
an energy content of 5.8 MBtu and the energy content of 1,000 m3 of gas is
36.235 MBtu as recommended by International Energy Agency (IEA) for natural
gas from Russia [13].
The future crude oil prices in 2010 United States dollars ($) for the period
of the contract from 2017 to 2041 obtained from the projections of the
IEA[1]while ignoring the effect of inflation6) and extrapolating the price trend up
to the end of the contract, are in the range from 18.37 and 25.79 $/MBtu or 107
$ to 150 $ per barrel of crude oil. This information will be used as the base for
comparison of the obtained gas prices with the projected oil price. We also
compared the obtained gas prices by the contract with the average gas price
projection. According to the IEA forecast on the gas prices in the different
regions, the market price of gas for Asia during the same period of time is
expected to be about 0.7 of the price of oil [1] in other words in the range of
12.86 and 18.05 $/MBtu.
3. Methodology
In this study the cost-plus pricing methodology for calculation of the possible
minimum price of Russian gas in Korea is described.
3.1. Cost-plus pricing methodology
Cost-plus pricing is a bottom-up approach in the sense that it starts by
6) The inflation rate is taken equal to 2.5% annually.

에 지경제연구 ● 제10권 제2호
- 88-
specifying production costs of gas, gas transmission costs, optionally cost of gas
liquefaction and marine gas transportation, adds a profit elements in each segment7)
of the gas chain, and arrives at a cost and profit based price at the delivery point
[13]. This method of pricing could help to determine the minimum price that the
seller can accept, which includes the sellers’ expenses for gas supply as well as
the value that the sellers place for their own efforts to participate in this gas
supply contract, i.e. the desired minimum rate of return on investment (hurdle
rate). In other words the price which allows the project to break even financially.
We will call this price a breakeven price (BEP) of gas and it is a key element
for the calculation of the minimum price of Russian gas in Korea.
3.2. Calculation of the BEP through the cost-benefit analysis
To calculate the BEP of gas in each element of gas supply chain first it is
necessary to conduct the cost-benefit analysis (CBA) of each element, precisely:
CBA of gas production projects, CBAs of liquefaction and transportation projects.
By CBA all benefits and costs related to the project (in money terms) then will
be adjusted for the time value of money, using the discount technique, so that all
flows of benefits and costs of project over time (which tend to occur at different
points in time) are expressed on a common basis in terms of their “present
value”.
The central tool of CBA and the convenient method for identification of the
break-even point (and consequently, the BEP) is the Net present value (NPV) of
the project cash flows.
7) The adding of the profit elements separately by the each element of the seller’s gas chain or aggregately to the total cost of gas supply depends on the physical structure of the seller’s company, e.g. whether its gas production and transportation segments working as a separated businesses each with each own financial accounting system or not.

Feasibility of Natural Gas Supply from Russia to Korea
- 89-
The formula for NPV is as follow:
(1)
Where:
- Analysis period, years.
- Benefit of the project in year n, M USD
- Cost of the project in year n, M USD
- Discount rate (the time value of cash flows)
Since the price of gas ( ) directly influences the benefits ( ) of the
project ((Eq. (2) below) and the investment and operational cost are essential
components of the total costs ()(Eq.(3)), they are integral parts of the NPV
(Eq. (4)).
× (2)
(3)
× (4)
Where:
, , , and are as in Eq. (1).
- Gas production/transmission/liquefaction rate in year n, bcm
- Unit price of gas in project in question, USD/1000 m3 of gas
- Investment expenditures in year n, M USD
- Operation and maintenance expenditures in year n, M USD

에 지경제연구 ● 제10권 제2호
- 90-
The calculation of NPV is to asses the total gain/loss from the project and
therefore to identify the break-even point of the project. If NPV of the planning
project under the chosen discount rate is less than zero (NPV<0) the project will
create financial losses to the investor and he would probably refuse to participate
in the project; if NPV = 0, the investor would be indifferent whether to
participate or not, because he will not see any profit or loss from the project. If,
however, NPV>0, the seller may be interested in participation because the
investment creates added value for him.
The situation when NPV=0 is very similar to the break-even point situation
by definition. When NPV=0 the total cost and benefit of the project are equal,
i.e. there is no net loss or gain, which is a necessary but still insufficient
condition for achieving the break-even point. The sufficient condition for achieving
the break-even point is NPV = 0 at a discount rate (r) equal to the minimum
expected rate of return by investor or hurdle rate (HR)8) (5).
×
(5)
Therefore from Eq. (5) the equation for the price (P) at a break-even point is:
(6)
8) In business and engineering, the minimum acceptable rate of return, or hurdle rate is the minimum rate of return on a project a manager or company is willing to accept before starting a project, given its risk and the opportunity cost of forgoing other projects.

Feasibility of Natural Gas Supply from Russia to Korea
- 91-
Where:
is break-even price which is equal to the P at a break-even point.
For calculation of the minimum price of Russian gas to Korea, the BEPs of
gas must be calculated for each of the seven component-projects described above,
then correspondent BEPs must be added together to come up with two final
prices of Russian gas, corresponding to the alternatives for international gas
transportation to Korea, namely as PNG and LNG.
3.3. Calculation of the cost-based price of Russian gas in
Korea
The prices of Russian gas delivered ex-ship to Korean port Samchuck
(DES_Samchuck (Korea)) consist of two essential parts. The first part is the price
of Russian gas delivered to Russian Pacific coast to port Vladivostok
(FCA_Vladivostok).9) This part is the same for both final PNG and LNG prices.
However, the second part of the prices varies and depends on the chosen mean of
international transportation, PNG or LNG, respectively.
To find the cost-based price of Russian gas at the Russian Pacific coast in
port Vladivostok (), after which the two different means of international gas
transportation could be applied, the BEPs of gas production and pipeline natural
gas (PNG) transportation across Russia must be summed together in the proportion
shown in Eq. (7):
×
×
(7)10)
9) FCA – Free Carrier (named places). The seller hands over the goods, cleared for export, into the custody of the first carrier (named by the buyer) at the named place. [15]
10) Since there is no any public information on the rate of gas which will come from Chayanda and Sakhalin III fields for supplying the natural gas to Rep. of Korea, the author decided to
에 지경제연구 ● 제10권 제2호
- 92-
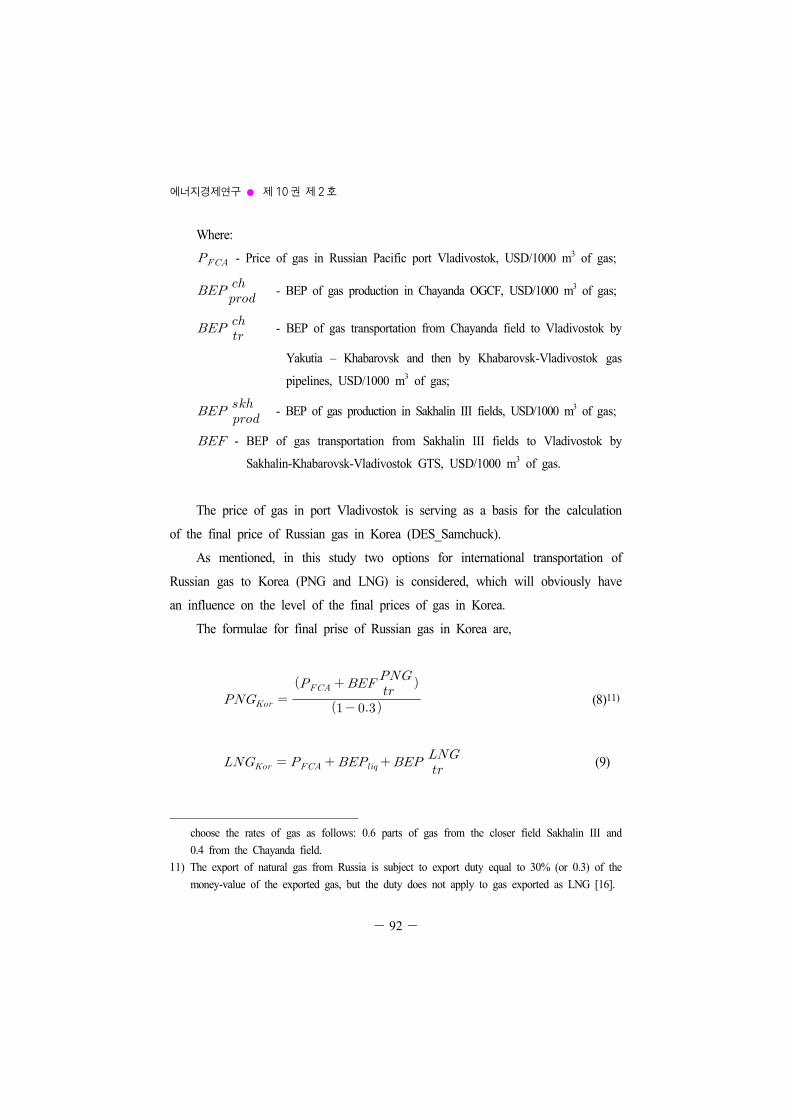
Where:
- Price of gas in Russian Pacific port Vladivostok, USD/1000 m3 of gas;
- BEP of gas production in Chayanda OGCF, USD/1000 m3 of gas;
- BEP of gas transportation from Chayanda field to Vladivostok by
Yakutia – Khabarovsk and then by Khabarovsk-Vladivostok gas
pipelines, USD/1000 m3 of gas;
- BEP of gas production in Sakhalin III fields, USD/1000 m3 of gas;
- BEP of gas transportation from Sakhalin III fields to Vladivostok by
Sakhalin-Khabarovsk-Vladivostok GTS, USD/1000 m3 of gas.
The price of gas in port Vladivostok is serving as a basis for the calculation
of the final price of Russian gas in Korea (DES_Samchuck).
As mentioned, in this study two options for international transportation of
Russian gas to Korea (PNG and LNG) is considered, which will obviously have
an influence on the level of the final prices of gas in Korea.
The formulae for final prise of Russian gas in Korea are,
(8)11)
(9)
choose the rates of gas as follows: 0.6 parts of gas from the closer field Sakhalin III and 0.4 from the Chayanda field.
11) The export of natural gas from Russia is subject to export duty equal to 30% (or 0.3) of the money-value of the exported gas, but the duty does not apply to gas exported as LNG [16].

Feasibility of Natural Gas Supply from Russia to Korea
- 93-
Where:
- is as in Eq. (7);
- BEP of PNG transportation by Trans-Korean gas pipeline;
- BEP of planning gas liquefaction project at Vladivostok;
- BEP of marine LNG transportation to Korea.
4. Data
The BEP calculation in each component project includes the following
elements: investment, operational cost, related taxes and minimum return rate
expected by seller (HR). It does not include here the R&D cost, environmental
impact studies cost, costs of impacts on public health and environmental damage,
costs of government subsidies, cost of rights of way for pipelines, transit fee, and
others possible costs.
For the calculation of the BEP by each of seven planning investment
component projects included in the gas supply plan, firstly we estimated the
investment and operation costs for each project.
The estimation of the investment cost was primarily based on open media
sources because most of the component projects for gas production and its
transportation to the Russian Pacific coast are already in the planning stage and
information on them is available to the public. However, the information on the
investment cost for a Trans Korean gas pipeline is not yet available because its
planning is still at an early stage. Author therefore used for this component the
capital cost estimation methodology at the pre-design stage for gas pipelines that
was developed in [17].

에 지경제연구 ● 제10권 제2호
- 94-
4.1. Cost estimation for CBA of the projects
In all component projects related to the gas supply to Korea the calculation
of the operational expenses (Ototal) include depreciation charges (D), other
operational & maintenance costs (O), and in some cases the cost of fuel gas (F).
Based on the different publications and opinions of the experts working in
the gas industry, the operational & maintenance cost (O) and volume of the fuel
gas (F) in our study are taken as the annual percentage rate of the total
investment12) or annual throughput, respectively.
The annual cost of fuel gas ( ) is calculated as (10)
× (10)
Where
- The BEP of gas in the project, prior to the project in question13),
- Fuel gas rate taken annually as a percentage of the total annual volume of
gas production/transportation/liquefaction;
All investments in this study are subject to value-added tax (VAT) and
income tax, whose rates in Russia at the time of this study were 18% and 20%,
respectively. Gas fields, LNG plants and LNG tankers in Russia are subject to
property tax whose rate is 2.2% of the value of assets minus the value-added tax.
Gas production is taxed by severance tax.14) From the January 1st, 2013, the
12) Precisely the O is taken annually as the percentage rate of the total sum of the investment minus the Value-added tax charge from this sum of the investment.
13) For example, if the cost of fuel gas is calculated for the Sakhalin-Khabarovsk-Vladivostok gas pipeline project, then it is equal to the BEP of gas production in the Sakhalin III gas field.

Feasibility of Natural Gas Supply from Russia to Korea
- 95-
severance tax rate will be 265 roubles15) per 1000 m3 of gas produced [18] (or
$8.73/1000 m3 in year 2014).The basic calculation of the BEP of gas production
will therefore be based on the rate of severance tax equal to $8.73/1000 m3 (for
the period from 2014). As it was already mentioned the export of natural gas
from Russia is subject to export duty. For PNG it is equal to 30% of the value
of the exported gas, and for LNG is 0%.
For calculation of BEP in the possible Russian-Korean gas supply contract
we took the standard HRs of seller separately by up- and middle- stream
segments of the gas chain. Since the gas seller in the planning contracts is the
Russian monopoly gas company Gazprom, in our CBA we will use the HR of
Gazprom in up- and middle-stream segments of gas chain, which is respectively
12% and 15%.16)
Most of the input data for CBA differs from project to project of our study,
but there are several common elements. The base year to which all cash flows in
the projects are converted is 2010. The Final year for all projects is 2041 because
the gas supply contract will probably end in that year: the duration of the gas
supply contract are expected to be 25 years.
Since almost all elements of the planned project will be constructed in
Russia (except the LNG tankers), the calculation of costs was firstly made in
current roubles (RUB). The costs in current RUB were then converted into
constant RUB, using the inflation rate indexes. The base inflation rate index used
in the study is the Producer Price Index (PPI) and the Core inflation index
published by The Central Bank of the Russian Federation (CBRF) [19]. The CBA
had been performed in current 2010 M United States Dollars. For this purpose,
14) Severance taxes are incurred when non-renewable natural resources are separated (or severed) from a taxing jurisdiction.
15) Russian Federation Currency (RUB).16) The exception is the project of LNG marine transportation, where the ROR is taken equal to
10% as in the world in average.

에 지경제연구 ● 제10권 제2호
- 96-
the values of costs in constant RUB had been transformed into the value in
constant USD, by using the official exchange rate of the RUB, published by
CBRF [20].
4.2. Input data for CBA
The input data for the 7 projects included in the cost-based prices calculation
vary from project to project and will be specified for each project in the
following tables.
Table 1. Input data for the CBA of the gas production from the Sakhalin III and Chayanda OGCF projects
Attributes Chayanda field Sakhalin III field
Year of the investment beginning17) 2012
Start of gas production 2016 2014
Analysis period (years) 30
Depreciation rate, Dr (%) 6.7 (100% / 15)
HR (%) 15
Maximum gas production rate (bcm/a) 3118) 28.619)
Total investment (M US$) 6,521 15,065
Annual operation cost20) (% ) 4
Annual Loss of gas (% of the annual production) 2
Taxes: VAT. Income, property and severance taxes as mentioned above.
17) In which the actual investment occurs.18) Production volume in the first years of Chayanda field development from 2016 to 2018
would be: 3.3; 13.9; 21.8 bcm/a respectively.19) Production volume in the first years (from 2014 to 2016) of Sakhalin fields development will

Feasibility of Natural Gas Supply from Russia to Korea
- 97-
AttributesFrom Yakutia
(Chayanda)From Sakhalin
Year of the investment beginning 2013 2009
Start of operation 2016 2012
Analysis period (years) 30
Depreciation periods (years):
Pipeline 25
Compressor stations 10
<continued>
The investment costs in the development of Chayanda and Sakhalin III
projects are expected to be about 6,521 B USD and 15,065 B USD, including
VAT respectively [21 - 22].
The higher investment cost in the Sakhalin III field in comparison with gas
production at the Chayanda field can be attributed to more severe conditions of
offshore gas production, which requires much larger investments than production
onshore. Investment in the development of the Chayanda and Sakhalin fields will
be committed consistently over 4 years (from 2012 till 2015) at the rate as
scheduled below:
Table 2. Investment schedule into gas fields development and production
Year of inv. 2012 2013 2014 2015
Share of total investment (%)
40 30 20 10
Table 3. The Input data for CBAs of the gas transportation from the Chayanda and Sakhalin III fields to Vladivostok
be 3.3; 13.9; 21.8 bcm/a respectively.20) Taken annually as a percentage of total investment.

에 지경제연구 ● 제10권 제2호
- 98-
AttributesFrom Yakutia
(Chayanda)From Sakhalin
HR (%) 12
Throughput (bcm/a) 31.0 28.6
Total investment (B US$) 26,185 11,684
Annual rate of fuel gas (% of the annual production throughput, for 1 station)
0.5
Annual operation cost (%)
Pipeline 1
Compressor stations 3,5
Taxes: VAT and income tax as mentioned above.
The investment cost into pipeline from Yakutia (Chayanda field) is given as
in [22].
The total investment cost of Sakhalin-Khabarovsk-Vladivostok GTS had been
estimated by the author based on [23 - 24] and with help of methodology for the
estimation of construction cost of trunk gas pipelines that was developed in [17].
It should be noticed that the throughput of pipelines that enable to supply
gas from Chayanda and Sakhalin III fields to the Russian Pacific coast and the
level of maximum gas production at the fields may vary significantly, since the
gas from the fields will also be used for supplying the gas consumers in the
Sakhalin Island and in the Republic of Sakha.
For both pipelines the following assumptions are made: the pipelines operate
at load level of 95% of transportation capacity during the entire project. This
assumption makes it possible to calculate the minimum price of gas transportation
that will recoup the investment and operation cost in the pipeline and provide
seller with the HR on his investment.

Feasibility of Natural Gas Supply from Russia to Korea
- 99-
The planned LNG plant near Vladivostok city will be built in the period of
2015~2018. Such plan had been considered by the Board of Gazprom’s Directors
(within issue of development of gas processing and gas chemicals industry in the
eastern Russia) on 1 October 2009 [25]. The parameters for the economic
modelling of the liquefied gas production on the planning plant are as follow.
Table 4. Economic parameters of the Vladivostok LNG plant
Parameters of LNG plant Value Unit
Investment cost 10,000 M USD
HR 12 %
Operation and maintenance 4% of the total investment,
annually
Depreciation period 20 Years
Rate of Fuel gas 7 % of the total throughput
Cost of raw gas 270 USD/1000 m3
Start of operation 2017 Year
Year of the investment beginning 2015 Year
Analysis period 30 Years
Taxes: VAT, property, Income as mentioned above
The experts from Gazprom [26] argued that investment costs in the
construction of the new onshore LNG plant are approximately the same as in the
Yamal LNG project, namely $1,000 per ton of LNG per year. In our economic
modelling we will consequently take a unit investment cost equal to $1,000/ton
LNG/a, then the total investment cost into a 10 M LNG plant will be
10×1,000=10,000 M USD.
In our study we assume that the LNG plant work at a load factor21) of
98%. The cost of fuel gas is equal to the cost of gas at the inlet of the plant.

에 지경제연구 ● 제10권 제2호
- 100-
The gas for liquefaction into the plant will come from the Sakhalin III and
Chaynda gas fields in the following proportions:
• 60% of gas for liquefaction from Sakhalin III
• 40% of gas for liquefaction from Chayanda OGCF.
The economic parameters for the economic modelling of the marine LNG
transportation to Korea are given in table 5.
Table 5. Input data for the CBA of the LNG transportation project
Data Value Unit
Investment year 2016
Start of operation 2017
Analysis period 26 Years
Depreciation period 20 Years
HR 1022) (%)
Volume of gas transported 10 Bcm/a
Total investment 441 M US$
Rate of fuel gas 6.687% of volume transported
annually
Cost of gas 433 $/1,000 m3
Cost of fuel oil 390 $/ton
Annual operation cost 4% of total investment
annually
Taxes: VAT, Income, Property taxes as explained above
21) Load factor is the degree of utilization of the maximum pipeline capacity in percent.22) Discount rate is taken by the world standards for the LNG transportation projects
Feasibility of Natural Gas Supply from Russia to Korea
- 101-
As the basis for calculating the volume of investments in the LNG tankers
which is necessary to carry the LNG from the plant to Korean consumers, we
took information on the average cost of LNG carriers of a similar size purchased
in Japan and Korea for LNG project Sakhalin-II in 2007. The total cost of three
tankers was 424 million dollars. Taking into account the inflation rate in Russia,
the total cost of the tankers in constant 2010 USD should be 441 M USD.
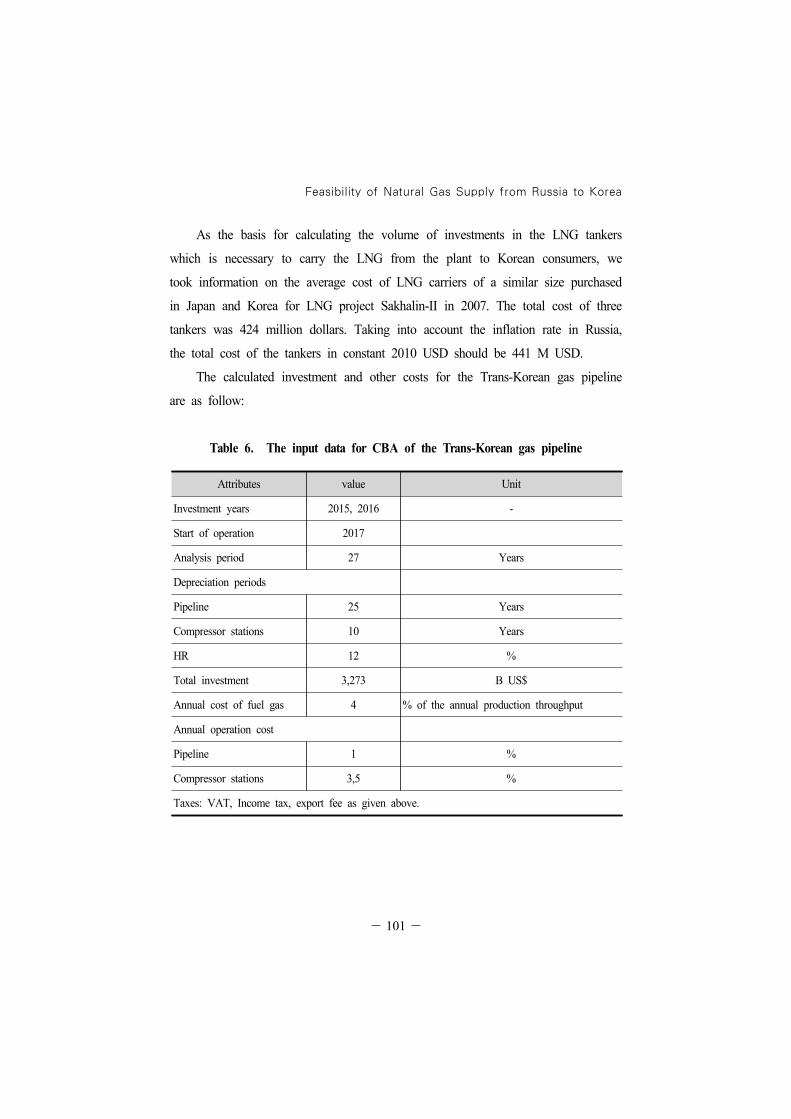
The calculated investment and other costs for the Trans-Korean gas pipeline
are as follow:
Table 6. The input data for CBA of the Trans-Korean gas pipeline
Attributes value Unit
Investment years 2015, 2016 -
Start of operation 2017
Analysis period 27 Years
Depreciation periods
Pipeline 25 Years
Compressor stations 10 Years
HR 12 %
Total investment 3,273 B US$
Annual cost of fuel gas 4 % of the annual production throughput
Annual operation cost
Pipeline 1 %
Compressor stations 3,5 %
Taxes: VAT, Income tax, export fee as given above.

에 지경제연구 ● 제10권 제2호
- 102-
There was no technical and economic information on the planned
Trans-Korea pipeline at the time of writing. Consequently, the technical and
economic parameters (including the investment costs) of the pipeline had been
selected and calculated using the methodology for determining the optimal
technical parameters of the pipeline based on the criterion of minimum BEP of
gas transportation proposed by author in [27].
The detailed information on the calculation of the investment costs and
economic modelling of the planning gas supply project could be also found in
[27].
The BEPs of gas obtained as the result of the consequent seven CBAs of
each projects will be described in the next section as well as the comparison of
the obtained prices with the projected prices of crude oil and gas.
5. Results of analyses and validation
As the result of the seven subsequent CBAs of related gas production and
transportation projects the following elements of the final prices of Russian gas in
Korea had been obtained.
5.1. Results
The obtained BEPs of gas production in the distinguished fields and BEPs of
transportation by pipelines, which are necessary for calculation of the price of gas
at the Russian Pacific coast ( by (7) are given as in Table 7.

Feasibility of Natural Gas Supply from Russia to Korea
- 103-
Table 7. BEP of Russian gas at the Russian pacific coast (PFCA), USD/1,000m3
BEP Chayanda field Sakhalin III field of gas production,
prod79.31 144.62
of gas transportation to Vladivostok,
254.08 90.73
Total: ( prod + ) 333 235
275
As seen from the Table 7 the cost of gas production in Chayanda and
Sakhalin III varies significantly. The price of gas is higher in Sakhalin III
offshore gas fields due to the much higher investment costs, which is necessary to
develop gas fields in the more severe conditions of offshore gas production than
onshore. The costs of gas transportation also vary more than two-fold mostly due
to the different distances between the specific fields and the Pacific coast; the
total route from Chayanda field to Vladivostok is about 4,383 km, while the
distance between Sakhalin III and Vladivostok is only about 1,890 km.
In Table 8 the BEPs of international gas transportation by pipeline
(
) and as LNG (
), which are necessary for calculating the
final prices of PNG and LNG by (8) and (9) are given.
Table 8 BEP of international gas transportation
BEP USD/1,000 m3
Trans-Korean pipeline (
) 52.8
Total by LNG, which is including: 204
- Liquefaction () 164
- LNG transportation (
) 40

에 지경제연구 ● 제10권 제2호
- 104-
Table 9 shows the results of calculation of the final minimum prices gas in
Korea by the project in USD per 1,000 m3 of gas and in USD per MBtu for the
further comparison purpose with the projected price of oil at the same energy
basis.
Table 9 Obtained cost-based prices of gas and its oil price equivalent.
Cost-base price USD/1,000 m3 $/MBtu Crude oil price parity, $/Bbl
468 12.91 75.03
479 13.22 76.88
As seen from the Table 9 the price of LNG and PNG or Russian gas in
Korea is practically the same: LNG is more expensive than PNG by less than 3%.
Finally the author compared the obtained prices with the oil and gas prices
projection given by IEA for the same period of time. The comparison is showed
in table 10.
Table 10. Comparison of the project gas prices with the price projections
Price USD/MBtu Percentage of the oil price
Oil price projection 130 $/bbl 22.31 100
Gas price projection 568 $/1,000 m3 15.62 70
Project PNG 468 $/1,000 m3 12.91 58
Project LNG 479 $/1,000 m3 13.22 59

Feasibility of Natural Gas Supply from Russia to Korea
- 105-
The projections of the IEA crude oil import prices in 2010 dollars by the
Current Policies Scenario assume the average price of oil for the period of the
contract at the level of $130/bbl and the ratio of gas prices (in the Asia Pacific
Region (APR)) is forecasted to be equal to around 0.7 of crude oil price [28].
5.2. Validation and error analysis
As written in section 4, the estimation of the investment cost, which is the
central and most important part of the calculations, was based on public data.
All the equations used in the calculations are commonly used for the
assessment of the economic feasibility of the investment projects.
All calculations were performed in the Microsoft Excel program and then
validated by manual calculation.
The comparison of the calculated investment costs with the actual costs for
the same projects available in the public sources showed a high degree of
accuracy of the obtained results. For example, for the gas pipeline Yakutia-
Khabarovsk the difference between the investment cost calculated in our study and
the officially-reported cost by the government of Republic of Sakha [12] is only 3%.
The comparison of the final gas prices of Russian gas for Korea as well as
its individual elements - BEPs of gas by each segment (production, transportation,
liquefaction) with the other cost/price indicators is almost impossible and even
useless for the following reasons: Cost indicators of the gas value-chain worldwide
may be included in information database of major consulting companies (for
example, WoodMackenzie, IHS CERA and others) but these indicators are the
intellectual property of these organizations and could be available only on a paid
basis. Moreover, databases and computational models that are generated by large
consultancies are the “black box” whose input is fed by a limited set of input data.
Some information is available, perhaps, only in the annual reports of individual

에 지경제연구 ● 제10권 제2호
- 106-
companies doing business in certain countries. Cost indicators for the gas
value-chain in Russia are a commercial secret of Gazprom Company and other
independent gas companies in Russia.
Finally, the use of the information on the cost of gas production, transportation
(by pipeline and tankers) and liquefaction in Russia and in the world as a whole
could not be useful for the error analysis because each project is unique with its
own internal characteristics (geological, climatic conditions, equipment and
technology, etc.) and conditions of sale (legal, economic, political and other
environments), which significantly affect the results of the CBA of the gas supply
projects including the gas price calculation. Also, each state has its own regulatory
and tax base, which also significantly affect performance.
5.3. Conclusions
As it is follow from the comparison of the PNG and LNG price by the
project, the total economic effect on the supply of PNG compared with the supply
of LNG could be: (479-468)×106= 110 M $/annum. However, under the existing
conditions of political instability on the Korean peninsula, which makes the gas
pipeline project through North Korea extremely risky, the potential economic losses
in the event of unforeseen hostile acts or overlap of gas supply could, reach
billions of dollars. Therefore, this economic benefit could be obtained only under
conditions of signing the additional agreements which will warranty the security of
the pipeline and the absence of the military actions in the Korean peninsula.
On the positive side, however, a joint project for pipeline construction
between Russia, North and South Korea can pull the conflicting parties together,
to develop economic and social ties between parts of the country that have the
same language and ethnicity but separated by political tensions, and thus help to
finally bring peace to the Korean peninsula, for which the residents of both

Feasibility of Natural Gas Supply from Russia to Korea
- 107-
Koreas have been waiting more than fifty years. Cooperation in the pipeline
construction through the Korean Peninsula can thus be an important opportunity to
bring together the peoples of North and South Korea, with benefits far greater
than just gas transportation.
Turning back to the assessment of the economic feasibility of the project, it
is necessary to say that the following conversion of the obtained prices of gas by
the energy parity on the basis of the oil price (Table 9) shows that the price of
PNG of 468 $/1,000 m3 and LNG of 479 $/1,000 m3 are already competitive
with oil price at the level of 75-77 $/bbl. Taking into account the level of world
oil prices at the time of writing this paper (April 2011) at around 110 $/bbl and
the projected increase of oil prices in the period of the contract being up to 130
$/bbl (Table 10), it is obvious that the possible prices of gas by this project is
much lower than the current and projected world oil prices. The project PNG and
LNG prices are lower than the oil price projection by 42% and 41%
correspondingly. Moreover, the comparison with the projected average gas prices
for APR given by IEA, showed that the project also has the economic advantage.
The project PNG and LNG prices are also lower than the IEA “Asian” gas price
projection by 17.6% & 15.7% correspondingly.
This facts lead to the conclusion that the proposed contract for gas supplies
from Russia to Korea has an economically good chance of success and could
provide Korea with additional gas supply at reasonable price, as well as provide
Russia with new gas consumers in the Asia-Pacific gas market. In this connection
we could rather say that the gas supply project from Russia to Korea is
economically feasible and could bring the additional benefits to all parties of the
contract such as financial benefits, social benefits and improvement of energy
security of the North-East Asian countries.
접수일(2011년 8월 31일), 수정일(2011년 9월 27일), 게재확정일(2011년 9월 30일)

에 지경제연구 ● 제10권 제2호
- 108-
◎ References ◎
[1] IEA. 2010. World Energy Outlook (WEO). Paris, France : OECD/IEA [2] Doh H. 2001. Shutdown of Indonesian Gas Fields and its Impact on Korean LNG S
upply. Korea Energy Economics Institute.[3] Stern J. et. al. 2008. Natural Gas in Asia. Oxford University.[4] Pronina L. and B. Lim. 2010. Medvedev Pursues Energy Deals, Foreign Investment
During Korea, Japan Trip. Bloomberg News. 9 November.[5] Lee E. 2003. Comparative Economic Analysis on East Russia's Major Gas Projects.
Korea Energy Economics Institute.[6] Yoon B. 2007. Prospects for energy cooperation between Russian Federation and
the Republic of Korea in natural gas supply field. Dissertation. Gubkin University of Oil and Gas. Moscow.
[7] Russian Federation Industry and Energy Ministry. 2007. Development Program for an integrated gas production, transportation and supply system in Eastern Siberia and the Far East, taking into account potential gas exports to China and other Asia-Pacific countries(The Eastern Gas Program). Russian Federation Industry and Energy Ministry.
[8] “Gas Will Be Delivered to Japan through Vladivostok”. Vladivostok Times. News. 24 June 2008. Available at http://vladivostoktimes.com/show/?id=26289&p=2
[9] Information about the Sakhalin III gas project: http://gazprom.ru/production/projects/deposits/sakhalin3/
[10] Gazprom wants to get without competition the Chayanda fields and sectors of the Sakhalin-III. Information and analytic center “Mineral”. 2007:http://www.mineral.ru/News/27772.html
[11] Information about the Chayanda gas field: http://www.gazprom.com/production/projects/deposits/chayandinskoye/
[12] On implementation of the basic directions of development of oil and gas industry in the Republic of Sakha (Yakutia) until 2020. Presentation, Ministry of Industry of the Republic of Sakha (Yakutia). November 27, 2009, Yakutsk.

Feasibility of Natural Gas Supply from Russia to Korea
- 109-
[13] IEA. 1995. The IEA Natural Gas Security Study. Paris, France : OECD/IEA .[14] David L. and Boldrin M. 2008. Against intellectual monopoly. Cambridge
University Press.[15] International Commercial terms (Incoterms) 2010. By the International Chamber
of Commerce (ICC), Publication No. 715, 2010 Edition.[16] Russian Federation Government Resolution of 19 August 2003 № 507 "On
approval of export customs duties on natural gas in a gaseous state to be exported from the Russian Federation outside the States - parties to the Agreement on customs union".
[17] Zelenovskaya E. and Kosarev. A. 2010. The Optimal Design for a Gas Pipeline Infrastructure that Minimizes the Unit Cost of Gas Transportation. Northeast Asia Energy Focus 7(4) : 33-43.
[18] Federal Law N 307-FZ “On Amendments to Article 342 and 361 the second part of the Tax Code of the Russian Federation”, dated 27 November 2010.
[19] Information on the main economic indicators of Russian Federation: http://www.cbr.ru/eng/statistics/default.aspx .
[20] The Central Bank of the Russian Federation. 2011. “Information on the exchange rate of foreign currencies against the ruble.” Available at: http://www.cbr.ru/eng/currency_base/daily.aspx?C_month=01&C_year=2011&date_req=01.01.2011
[21] Russian Energy Monthly: www.easternblocenergy.com [22] On implementation of the basic directions of development of oil and gas industry
in the Republic of Sakha (Yakutia) until 2020. Presentation, Ministry of Industry of the Republic of Sakha (Yakutia). November 27, 2009, Yakutsk. Retrieved from: http://www.sakha.gov.ru/node/45186
[23] Sakhalin-Khabarovsk-Vladivostok gas pipeline project: http://www.gazprom.com/production/projects/pipelines/shvg/
[24] Gazprom. 2009. Gazprom launches construction of Sakhalin – Khabarovsk – Vladivostok gas transmission system. 4 August.
[25] Television and Radio of Primorsky Krai, News. Available at: http://www.ptr-vlad.ru/news/crime/20388-novyjj-spg-zavod-gazproma-vo-vladivostoke-mozhet.html

에 지경제연구 ● 제10권 제2호
- 110-
[26] News Time online: http://www.vremya.ru/2010/138/8/259407.html [27] Zelenovskaya E. 2011. A study on the development of interregional gas pricing
mechanism. Doctoral dissertation. Republic of Korea: Ajou University.[28] IEA. 2010. World Energy Outlook (WEO). Paris, France : OECD/IEA. [29] The Customs Code of the Russian Federation. Available at:
http://www.customs.ru/tk_en/index.html [30] Russian Federation Law. On Customs Tariff. Available at:
http://base.consultant.ru/cons/cgi/online.cgi?req=doc;base=LAW;n=107705;fld=134;dst=4294967295;from=73132-0