feasibility of sri application in korea for reduction of irrigation requirements and non-point...
TRANSCRIPT

Feasibility of SRI Application in Korea
for Reduction of Irrigation Requirements
and Non-Point Source (NPS) Pollution
Paddy and Water Environment Engineering Society PAWEES
International Conference, Taipei, October 27, 2011
Joong-Dae Choi, Woon-Ji Park
Ki-Wook Park and Kyong-Jae Lim
Dept. of Regional Infrastructures Engineering, Kangwon National University (KNU)
Contents
Material and Methods
Results and Discussion
Contents
Background and Objective
Conclusions
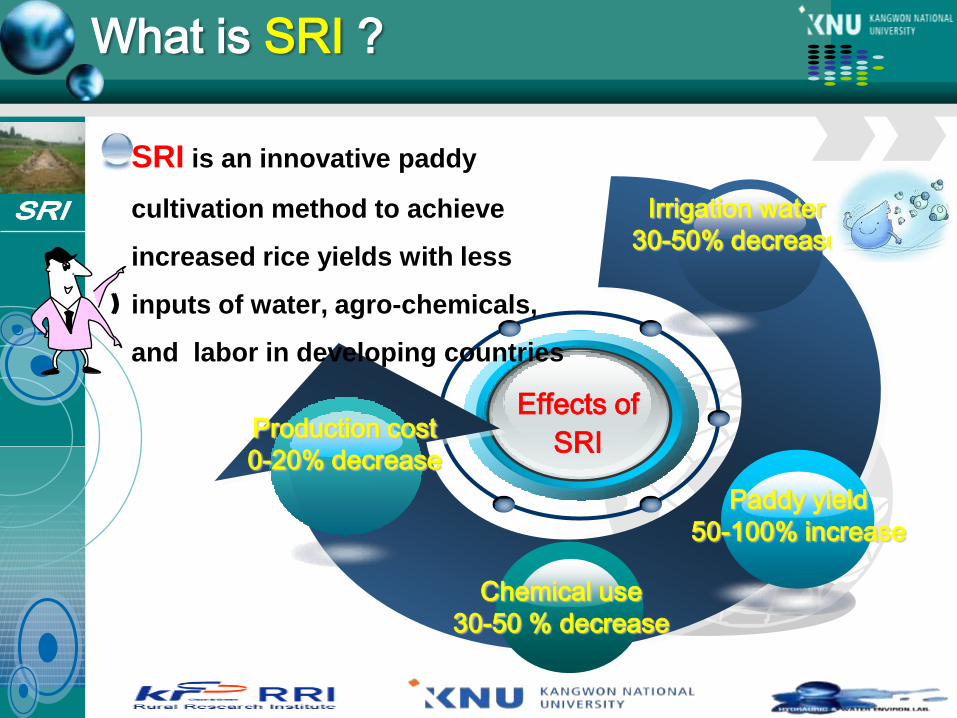
Effects of
SRI
Chemical use
30-50 % decrease
Irrigation water
30-50% decrease
Paddy yield
50-100% increase
Production cost
0-20% decrease
What is SRI ?
SRI is an innovative paddy
cultivation method to achieve
increased rice yields with less
inputs of water, agro-chemicals,
and labor in developing countries

Necessities and Justification
• SRI is currently practiced in over 40
countries in the world
• PWE issued a special issue on SRI in
March, 2011 as Vol. 9 (1) with 17 papers.
• Several papers on SRI were published in
Korea in 2009, 2010 and 2011 under the
guidance of Prof. Jin-Yong Choi of
Kyeongsang National University.
- Key words of the papers were: no-till
cropping, residue and cover crop effect,
planting density, and nutrient uptake.

Necessities and Justification
• Most SRI practices and research are
focused on rice yield, water saving, and
reduction in management and labor cost.
• However, effects of SRI on water saving
and its environmental impacts in Korea
have not been yet studied.
• It is very important to save irrigation
water and reduce NPS pollution in Korea
because Korea expects water shortage in
the near future and is pressed to improve
its water quality.

Necessities and Justification
• Rice is produced in about 60% of the
farm land in South Korea
• Agricultural water use is about 48% of
the total water consumption in South
Korea
• About 89% of agricultural water is
consumed in rice farming
• Water shortage is expected in Korea in
the near future

Necessities and Justification
• Water-saving crop cultivation is strongly
required in agricultural areas, especially
in rice farming
• Water quality improvement has always
been an important pending issue
• Pollution discharge from paddy fields is
required to be cut down as much as
possible because of their wide area.

Source of Agricultural Water
0
62
19
12
5 2Reservoir
Pumping
Stream Weir
Groundwater
Others

Water Use in Agriculture
Upland1,317
(9%)
Paddy
13.170 B m3
(89%)
Livestock288
(2%)
Reducing paddy water
use can give savings:
10% = 1.317 bill m3
20% = 2.634 bill m3
30% = 3.951 bill m3

Objectives
• To experimentally investigate the
feasibility of SRI rice farming in Korea
• To quantify the reduction of irrigation
water possible with SRI, and
• To analyze effect of SRI on reduction of
NPS pollution from paddy fields

3
1
4
5
6
7
8
2
Location of the experimental fields
(N) 37° 55′ 57″,
(E) 127° 46′ 59″
1,873 m2
Site
Area

Layout of conventional (CT) and SRI plots

Seed preparation and sowing
Seed disinfection by chemical solutionfor 24 hours
Conventional sowing 21-4-10
SRI sowing 21-4-2010
① Preparation ② Watering ③ Sowing
④ Soil cover ⑤ Smoothing ⑥ Plastic cover
① 200 port tray ② Soil 1 ③ Soil 2
④ 200 port ⑤ Sowing 1 ⑥ Sowing 2
⑦ Soil cover ⑧ Watering ⑨ Watering 2

Plots and watering pipe preparation
① Levee -1 ② Pipe layout ③ Flow meter
④ Water tank and pump ⑤ Electrical line ⑥ Watering
⑦ Fertilizer ⑧ Puddling ⑨ After puddling

Drain channel preparation
① Drain -1 ② Drain -2 ③ Drain -3
④ Drain -4 ⑤ Drain -5 ⑥ Drain -6
9/45
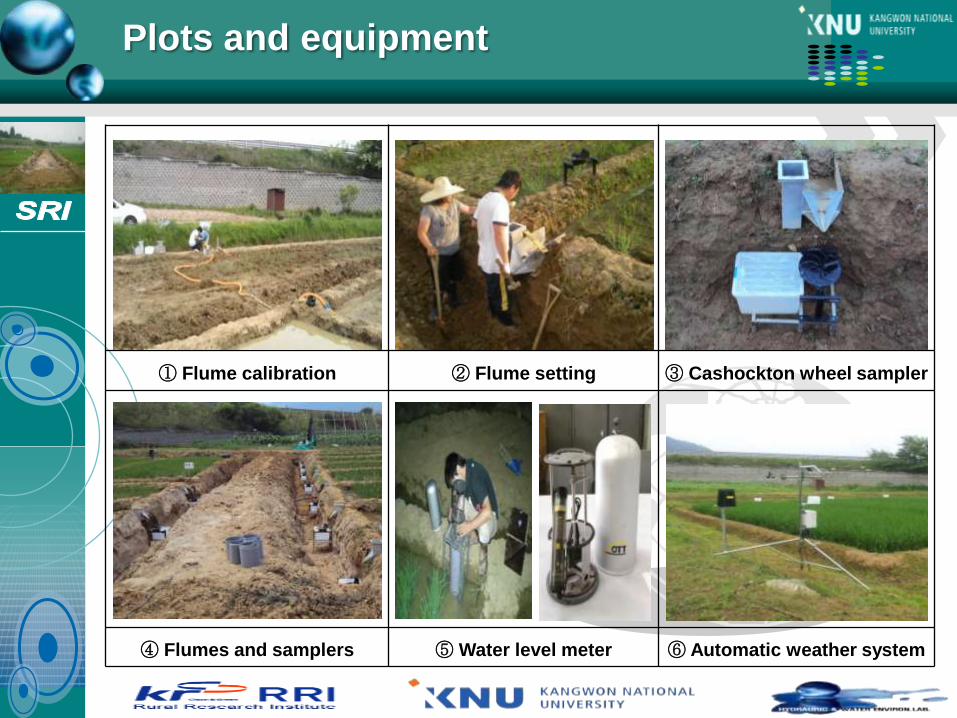
Plots and equipment
① Flume calibration ② Flume setting ③ Cashockton wheel sampler
④ Flumes and samplers ⑤ Water level meter ⑥ Automatic weather system

Infiltration and evapotranspiration
200 mm 300 mm
30
0 m
m
150 m
m
Infiltration ConsumptionInfiltration Consumption
ET

① SRI transplanting-1 ② SRI transplanting -2
③ SRI transplanting -3④ Conventional transplanting
by transplanting machine
Transplanting (May 21, 2010)
No. of seedling per hill
SRI = 1
Non-SRI = 3~5
Transplanting spacing
CT : 30x15 cm
SRI : 30x30 cm
SRI : 40x40 cm
SRI : 50x50 cm

Irrigation management
Stage DescriptionWater
depth (cm)
Transplanting
Root development
Tillering
End of tillering
Panicle initiation/
booting
Heading/flowering
Ripening
Draining
Shallow irrigation
Deep irrigation
Shallow irrigation
No irrigation for 5~10 days – 30~40
days before heading
AWD from 30 days before heading to
heading (3 days ponding, 2 days dry)
Medium irrigation
AWD (3 days ponding, 2 days dry)
Complete draining – 30-40 days after
heading
2~3
5~7
2~3
0
2~4
3~4
2~3
0
Standard management for conventional culture

Water management of SRI plots
AWD irrigation from transplanting until the end of tillering -- plots
irrigated to 1 cm depth, and then let to dry for 3~4 days
Soil condition : 0~2 cm cracks were allowed to develop on the soil
surface of the SRI plots
During panicle initiation stage, water depth of 1 cm maintained
After this, frequent rain ponded in the plots and then was drained
manually. Minimal irrigation was provided.

SRI variables evaluated
Amount of irrigation measured by flow meter
Runoff measured by flume
Rainfall by automatic rain gauge
Soil water content before spring farming work
Composite water sample collection by cashocton wheel sampler
Sample analysis to assess BOD, COD, T-N, T-P, SS concentration
No. of tillers and plant height
Soil analysis
Rice yield


Soil analysis
GroupParticle composition (%)
TextureSand Silt Clay
RDA (2008)
National average
34.8
(20∼50% )
45.4
(30∼60%)
20.2
(12∼25%)Loam
This study 49.4 35.8 14.8 Loam
Group pHOM
(g/kg)
Exchangeable cations (cmol/kg)
Ca Mg K
Optimum range 6.0-6.5 25-30 5.0-6.0 1.5-2.0 0.25-0.30
This study 6.1±0.2 25 4.6±0.2 1.7±0.3 0.28±0.1

Index StandardNational
average
This study
2010 (n=6) 2011 (n=8)
pH 6.0∼8.5 7.8 7.2 ± 0.1 7.5 ± 0.3
BOD (mg/L) ≤ 8 - 1.6 ± 1.1 2.3 ± 0.5
COD (mg/L) ≤ 8 4.5 4.9 ± 0.8 5.3 ± 1.2
SS (mg/L) ≤ 100 - 16.1 ± 3.3 12.9 ± 7.3
DO (mg/L) ≥ 2 9.4 8.4 ± 0.2 8.6 ± 0.4
T-N (mg/L) - 2.269 2.067 ± 0.1 1.946 ± 0.4
T-P (mg/L) - 0.055 0.084 ± 0.01 0.067 ± 0.01
Irrigation water quality

Development of seedlings
day
5 10 15 20 25 30 35
0
2
4
6
8
10
12
14
16
18
20
°üÆà
SRI
ÆÄ
Á¾
ÈÄ
¹¦
Å©±â
º¯È
(cm)
Transplant not later than 20
days after sowing
SRI CT
CT SRI
Pla
nt heig
ht
CT

CT Plot 1
CT Plot 2
30x15 cm spacing
4 5
8
11
15
17 19
21 23 22
18
27 29 33
44
52
58 61
74
91
0
10
20
30
40
50
60
70
80
90
100
0
10
20
30
40
50
2010.6.2 6.8 6.11 6.15 6.20 6.25 6.30 7.8 7.16 8.4
Plant height
(cm)
No. of Tiller
(Ea)
Date
No. of Tiller
Plant height
4 6
8
12
15 17
19
22 25 25
18
26 28
32
43
51 56 60
73
92
0
10
20
30
40
50
60
70
80
90
100
0
10
20
30
40
50
2010.6.2 6.8 6.11 6.15 6.20 6.25 6.30 7.8 7.16 8.4
Plant height
(cm)
No. of Tiller
(Ea)
Date
No. of Tiller
Plant height
No. of tillers and height of plants

SRI Plot 5
30 ×30 cmspacing
SRI Plot 6
5
10
13 15
17 18
20
21
26 26
22
29
34
41
47
54
62
73 78
97
0
10
20
30
40
50
60
70
80
90
100
0
10
20
30
40
50
2010.6.2 6.8 6.11 6.15 6.20 6.25 6.30 7.8 7.16 8.4
Plant height
(cm)
No. of Tiller
(Ea)
Date
No. of Tiller
Plant height
5
10 13
15 16 17
19
20 25 25
21
29 33
39
45
53
60
70
75
90
0
10
20
30
40
50
60
70
80
90
100
0
10
20
30
40
50
2010.6.2 6.8 6.11 6.15 6.20 6.25 6.30 7.8 7.16 8.4
Plant height
(cm)
No. of Tiller
(Ea)
Date
No. of Tiller
Plant height
No. of tillers and height of plants

SRI Plot 3
40 ×40 cmspacing
SRI Plot 4
5
8 11
16 18 18 20
22
27 28
21
28
34 39
46
55
62
74 78
98
0
10
20
30
40
50
60
70
80
90
100
0
10
20
30
40
50
2010.6.2 6.8 6.11 6.15 6.20 6.25 6.30 7.8 7.16 8.4
Plant height
(cm)
No. of Tiller
(Ea)
Date
No. of Tiller
Plant height
4
10 12
16 18
19 21
22
33 33
21
29 34
41
46 54
63
71
78
99
0
10
20
30
40
50
60
70
80
90
100
0
10
20
30
40
50
2010.6.2 6.8 6.11 6.15 6.20 6.25 6.30 7.8 7.16 8.4
Plant height
(cm)
No. of Tiller
(Ea)
Date
No. of Tiller
Plant height
No. of tillers and height of plants

No. of tillers and height of plants
SRI Plot 1
50 ×50 cmspacing
SRI Plot 2
4
7
11
16 17
19 20
22
35 35
22
29
35 41
47
56
61
75 78
103
0
10
20
30
40
50
60
70
80
90
100
0
10
20
30
40
50
2010.6.2 6.8 6.11 6.15 6.20 6.25 6.30 7.8 7.16 8.4
Plant height
(cm)
No. of Tiller
(Ea)
Date
No. of Tiller
Plant height
4
8
13
17 19 20 22
23
34 34
23
30 35
42
47
55
63
75 79
98
0
10
20
30
40
50
60
70
80
90
100
0
10
20
30
40
50
2010.6.2 6.8 6.11 6.15 6.20 6.25 6.30 7.8 7.16 8.4
Plant height
(cm)
No. of Tiller
(Ea)
Date
No. of Tiller
Plant height
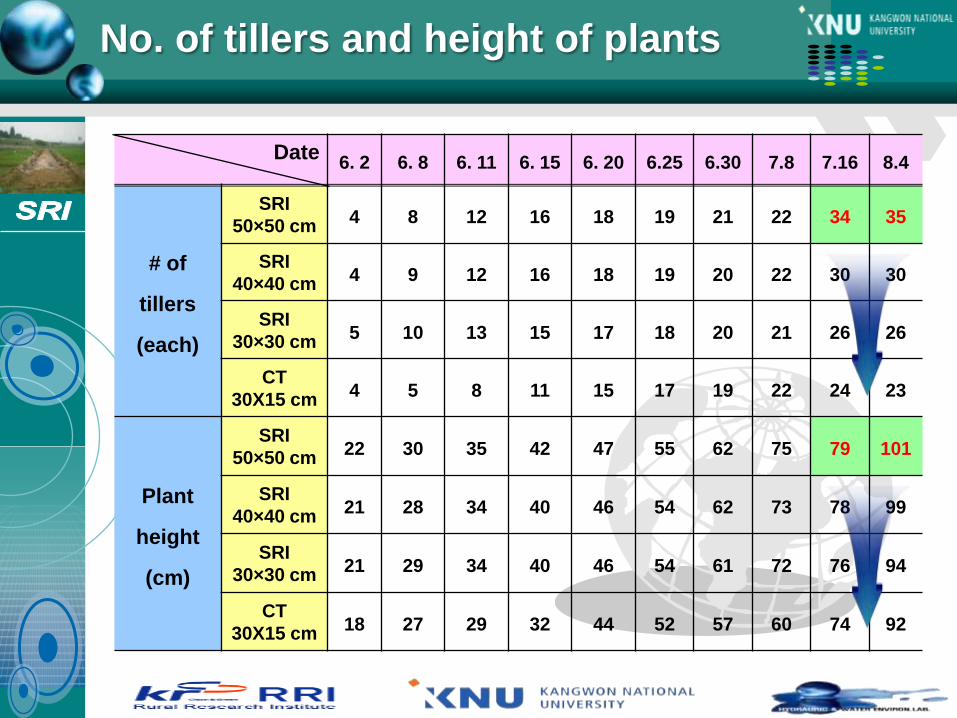
6. 2 6. 8 6. 11 6. 15 6. 20 6.25 6.30 7.8 7.16 8.4
# of
tillers
(each)
SRI
50×50 cm4 8 12 16 18 19 21 22 34 35
SRI
40×40 cm4 9 12 16 18 19 20 22 30 30
SRI
30×30 cm5 10 13 15 17 18 20 21 26 26
CT
30X15 cm4 5 8 11 15 17 19 22 24 23
Plant
height
(cm)
SRI
50×50 cm22 30 35 42 47 55 62 75 79 101
SRI
40×40 cm21 28 34 40 46 54 62 73 78 99
SRI
30×30 cm21 29 34 40 46 54 61 72 76 94
CT
30X15 cm18 27 29 32 44 52 57 60 74 92
Date
No. of tillers and height of plants

Comparison of lodging resistance (2010. 8. 15)
SRI plotsCT plots

Irrigation water use efficiency (IWUE)
IWUE = Rice yield (kg)/Irrigation(m3)
CT SRI
Irri
ga
tio
n (
mm
)
0
100
200
300
400
500
600
IWU
E (
kg
/m3)
0.8
1.0
1.2
1.4
1.6
1.8
2.0
Irrigation
IWUE
547.3
243.2
1.84
0.98
Conventional plots
547.3 mm
SRI plots
243.2 mm
Reduction of irrigation water: 55.6%
Water Use

Comparisons of rice yield (2010)
Treatment
Average
yield
(kg/10a)
Yield
ratio
to CT
(%)
No. of
hills
per plot
Yield
per
hill
(g)
SRI (50×50 cm) 408.4 76 232 93.6
SRI (40×40 cm) 441.3 82 385 65.3
SRI (30×30 cm) 490.3 92 644 43.4
CT (30×15 cm) 535.3 100 1,430 24.3

A means to increase yield
• Japonica rice variety does not
produce as many tillers as
Indica rice variety does.
• Therefore, transplanting 2 to 3
seedlings per hill may help to
increase SRI rice yield when
Japonica variety is planted.
40cm
40cm
7cm
Original SRI Modified SRI:
oblong with triangl
e

Comparisons of rice yield (2011)
Treatment
Average yield
(kg/10a)
Yield ratio to CT
(%)
Polished
rice
Head r
ice
Polished
rice
Head
rice
CT (30×15 cm) 540.5 430.5 100 100
No. of
seed- l
ings
per
hill
1SRI
(30×30 cm)611 532 113 124
2SRI
(30×30 cm)612 532.5 113 124
3SRI
(30×30 cm)647 573.5 120 133
1SRI
(40×40 cm)590 517.5 109 120
2SRI
(40×40 cm)591 505 109 117
3SRI
(40×40 cm)627 542 116 130
SRI CT

Treat-
mentSS CODCr CODMn BOD TN TP
CT
(mg/L)
159
±146a
30.1
±14.7a
10.7
±5.4a
3.0
±0.9a
4.4
±1.9a
0.56
±0.2a
SRI
(mg/L)
89.4
±90.1b
26.1
±13.2a
7.5
±3.7b
2.0
±1.5b
4.2
±2.0a
0.4
±0.2b
Comparisons of runoff water quality
Water quality differences among SRI plots were not
significant, thus respective concentrations were pooled and
averaged.

Treatment SS CODCr CODMn BOD T-N T-P
CT
(kg/ha)1,444 242.5 71.7 23.2 43.8 3.76
SRI
(kg/ha)874 199.5 47.0 12.96 36.9 2.92
Reduc-
tion (%)39.5 17.7 34.4 44.1 15.8 22.3
Comparisons of NPS pollution loads

Comparison of methane gas emission
CT SRI
kg
CH
4 /
ha
0
200
400
600
800
1000
840.1
237.6
72 %
TreatmentEmission (kg/ha) CO2 ton/ha
equivalentCH4 N2O
CT 840.1 0 17.6
SRI 237.6 0.074 5.0


Conclusion
s
• Rice plants in SRI plots were healthier and stronger
than those in CT plots.
• Number of tillers per hill was greater in SRI plots
than in CT plots.
• Rice yield from SRI plots was only 76~92% of that
from CT plots because of late transplanting and
mistakes in irrigation supply. Yield could probably
have been higher with better use of SRI methods.
• Irrigation water requirement of SRI and CT plots
was 243.2 and 547.3 mm, respectively, resulting in
55.6% reduction of irrigation water with SRI practice
.
• Measured pollution loads from SRI plots were: SS
874 kg/ha, CODCr 199.5 kg/ha, CODMn 47 kg/ha, BOD
13 kg/ha, TN 36.9 kg/ha, and TP 2.92 kg/ha. These
loads were 15.8-44.1% less than those from CT
plots.
• It is concluded that SRI could be successfully
adopted in Korea and could help reduce irrigation
requirements and NPS pollution discharge.
• It is also suggested that further studies to increase
rice sector productivity with SRI should be
continued. Direct-seeding and no-till practices are
also recommended for study with SRI methods to
reduce production costs.
41/45
Conclusions - continued


시험포 (4번) 7월 5일
현재 시험포 사진 (2011년)

SRI 시험포 (8번) 7월 5일
현재 시험포 사진 (2011년)

포트이앙기 견학 (2011.5.28, 여주 능서면 마래리)
• Mechanical transplanting of rice seedlings grown in pot
trays is practiced in many parts of Korea and Japan.
Mechanical transplanting may not be a problem for SRI
practice.
• Weeding may be a problem for organic farmers. But
common farmers may use herbicides to control weeds.