february 18, 2000 new delhi, india the world bank railways...
TRANSCRIPT
The World Bank
RAILWAY RESTRUCTURING EXPERIENCES
Louis S. ThompsonRailways AdviserThe World BankNew Delhi, India
February 18, 2000
The World Bank
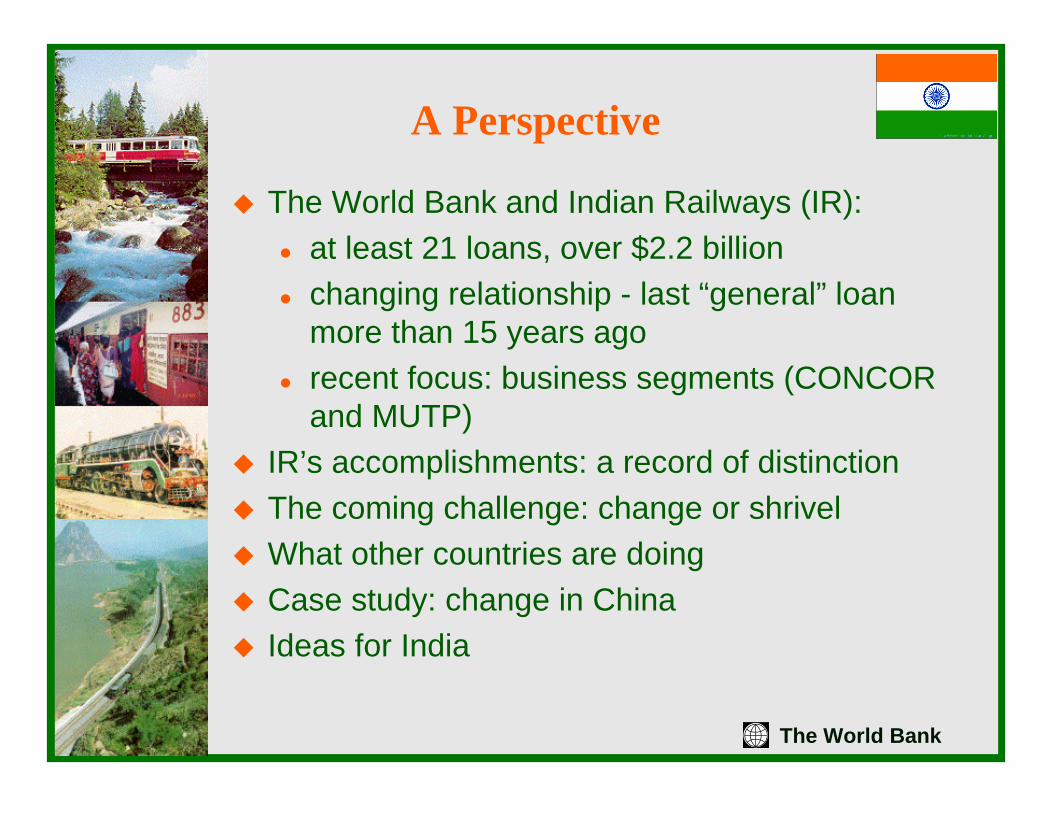
A Perspective
� The World Bank and Indian Railways (IR):� at least 21 loans, over $2.2 billion� changing relationship - last “general” loan
more than 15 years ago� recent focus: business segments (CONCOR
and MUTP)� IR’s accomplishments: a record of distinction� The coming challenge: change or shrivel� What other countries are doing� Case study: change in China� Ideas for India
The World Bank
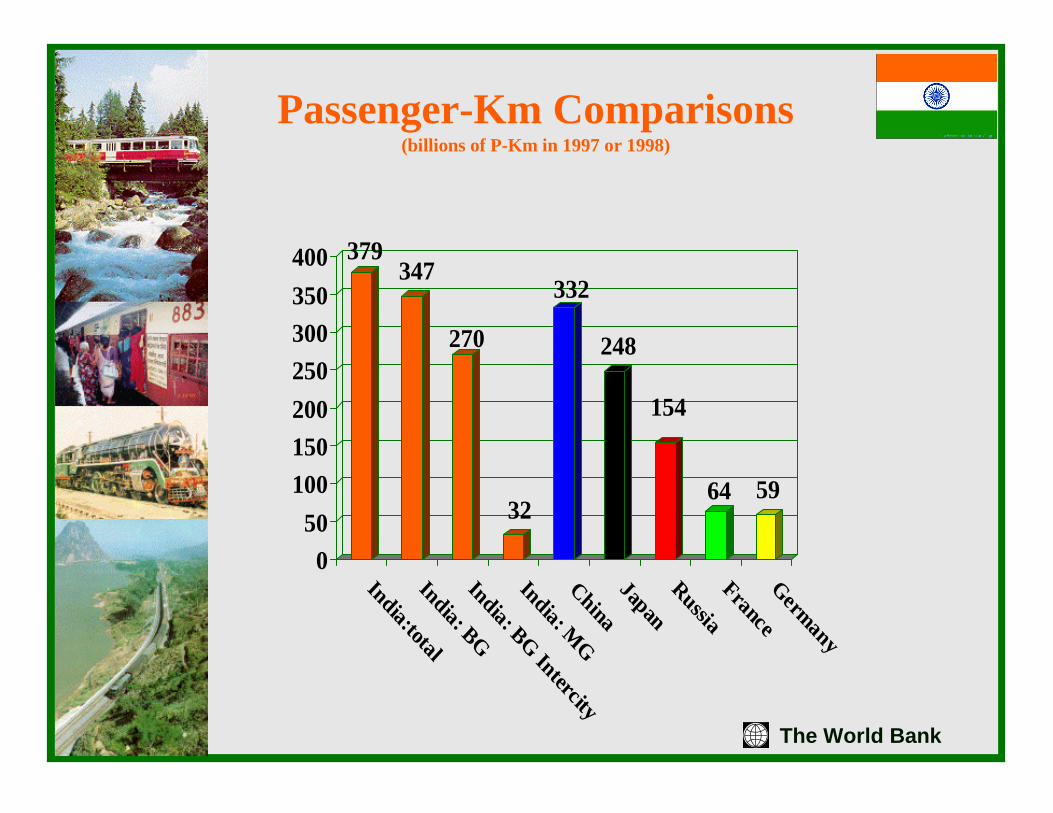
Passenger-Km Comparisons(billions of P-Km in 1997 or 1998)
379347
270
32
332
248
154
64 59
050
100150200250300350400
India:totalIndia: BGIndia: BG Intercity
India: MG
ChinaJapanRussiaFranceGermany
The World Bank
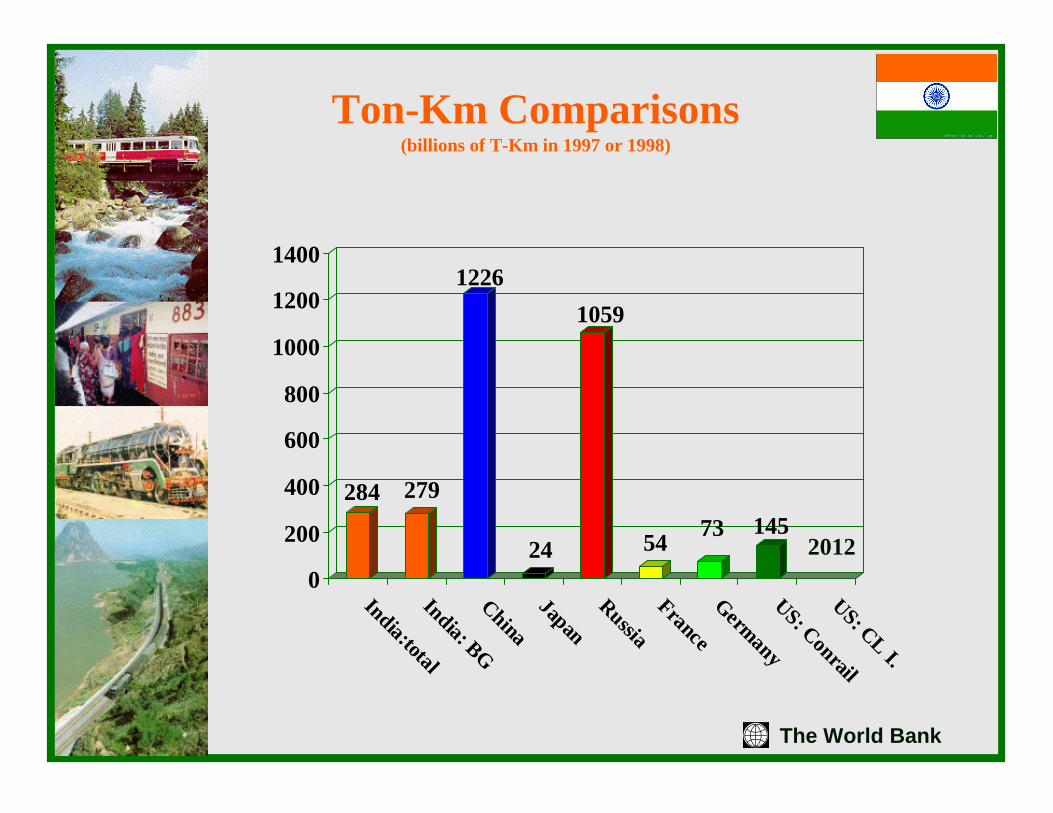
Ton-Km Comparisons(billions of T-Km in 1997 or 1998)
284 279
1226
24
1059
54 73 145
0
200
400
600
800
1000
1200
1400
India:totalIndia: BGChinaJapanRussiaFranceGermanyUS: ConrailUS: CL I.
2012
The World Bank
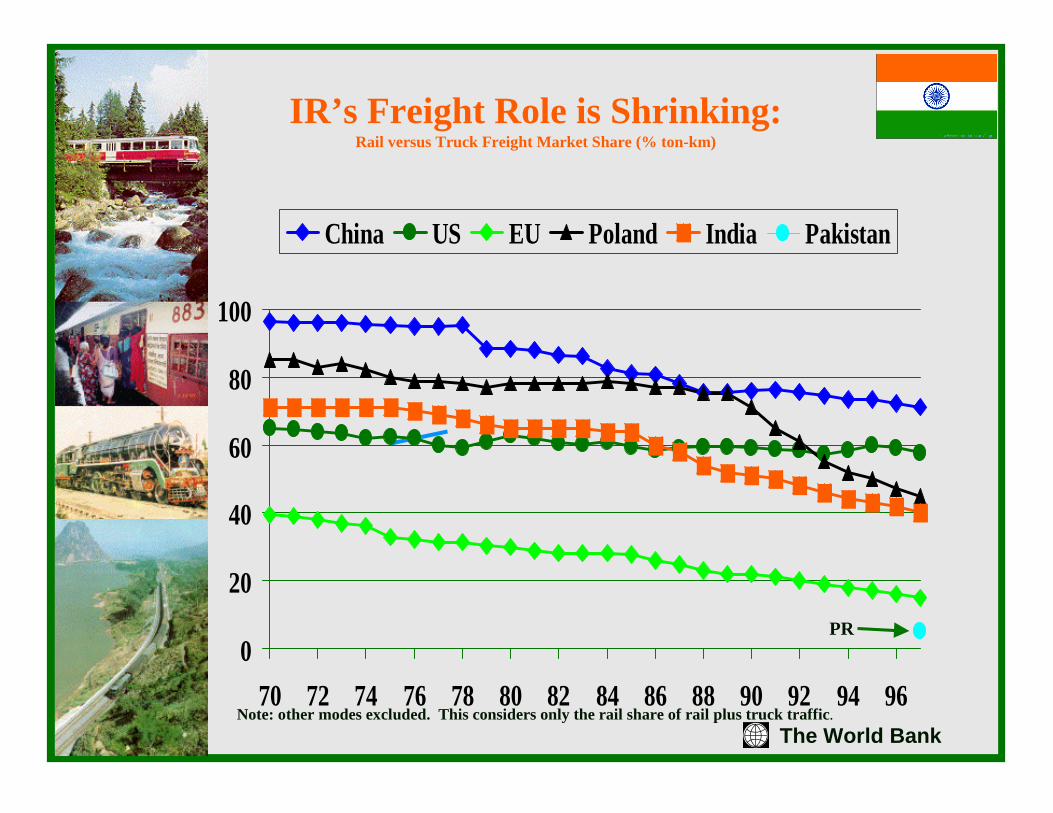
IR’s Freight Role is Shrinking:Rail versus Truck Freight Market Share (% ton-km)
0
20
40
60
80
100
70 72 74 76 78 80 82 84 86 88 90 92 94 96
China US EU Poland India Pakistan
Note: other modes excluded. This considers only the rail share of rail plus truck traffic.
PR
The World Bank
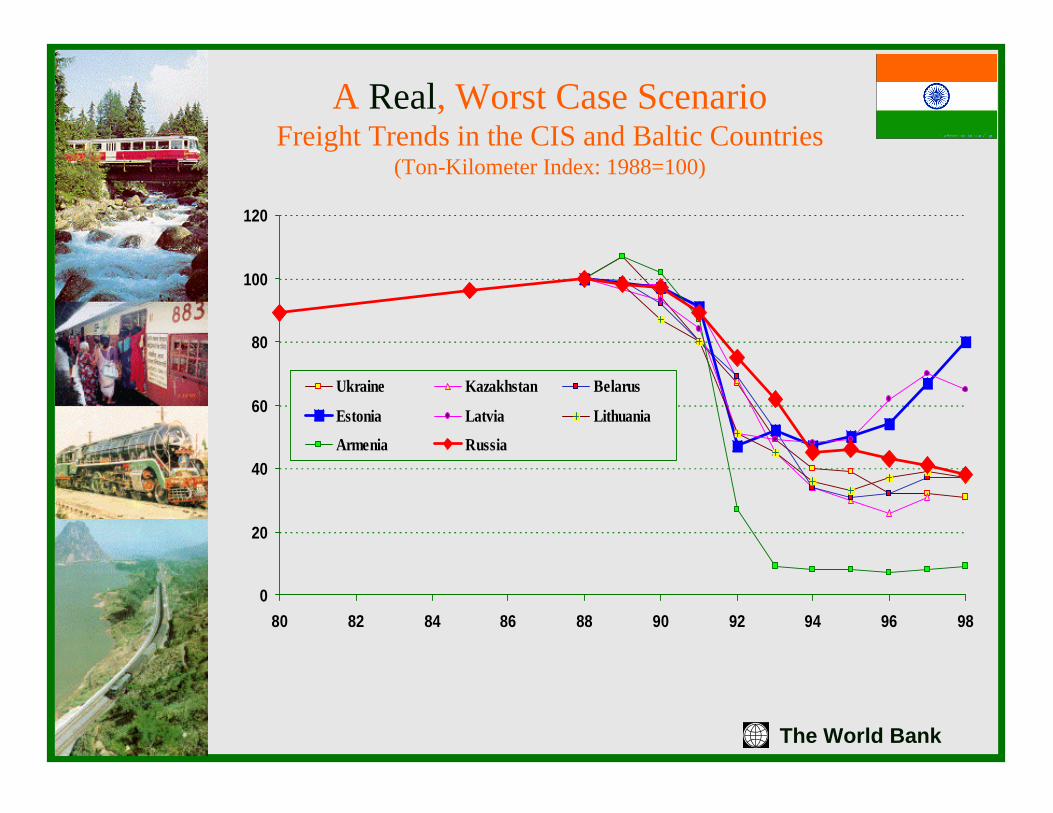
A Real, Worst Case ScenarioFreight Trends in the CIS and Baltic Countries
(Ton-Kilometer Index: 1988=100)
0
20
40
60
80
100
120
80 82 84 86 88 90 92 94 96 98
Ukraine Kazakhstan Belarus
Estonia Latvia Lithuania
Armenia Russia
The World Bank
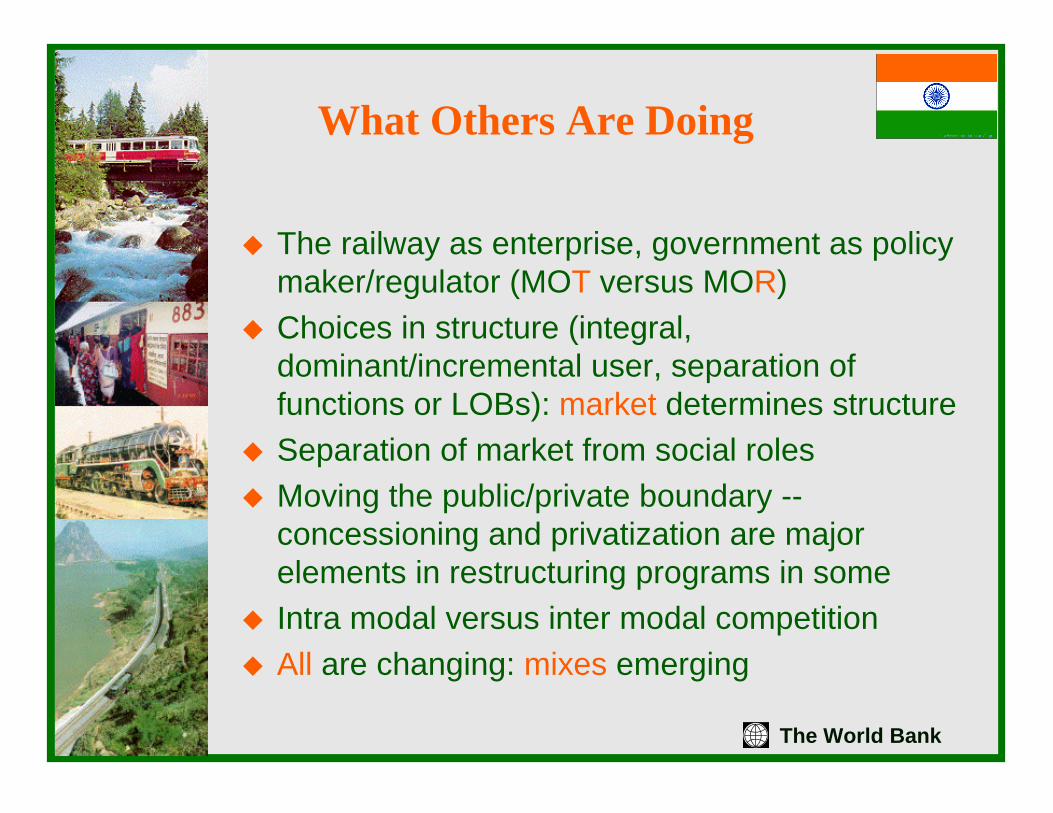
What Others Are Doing
� The railway as enterprise, government as policy maker/regulator (MOT versus MOR)
� Choices in structure (integral, dominant/incremental user, separation of functions or LOBs): market determines structure
� Separation of market from social roles� Moving the public/private boundary --
concessioning and privatization are major elements in restructuring programs in some
� Intra modal versus inter modal competition� All are changing: mixes emerging
The World Bank
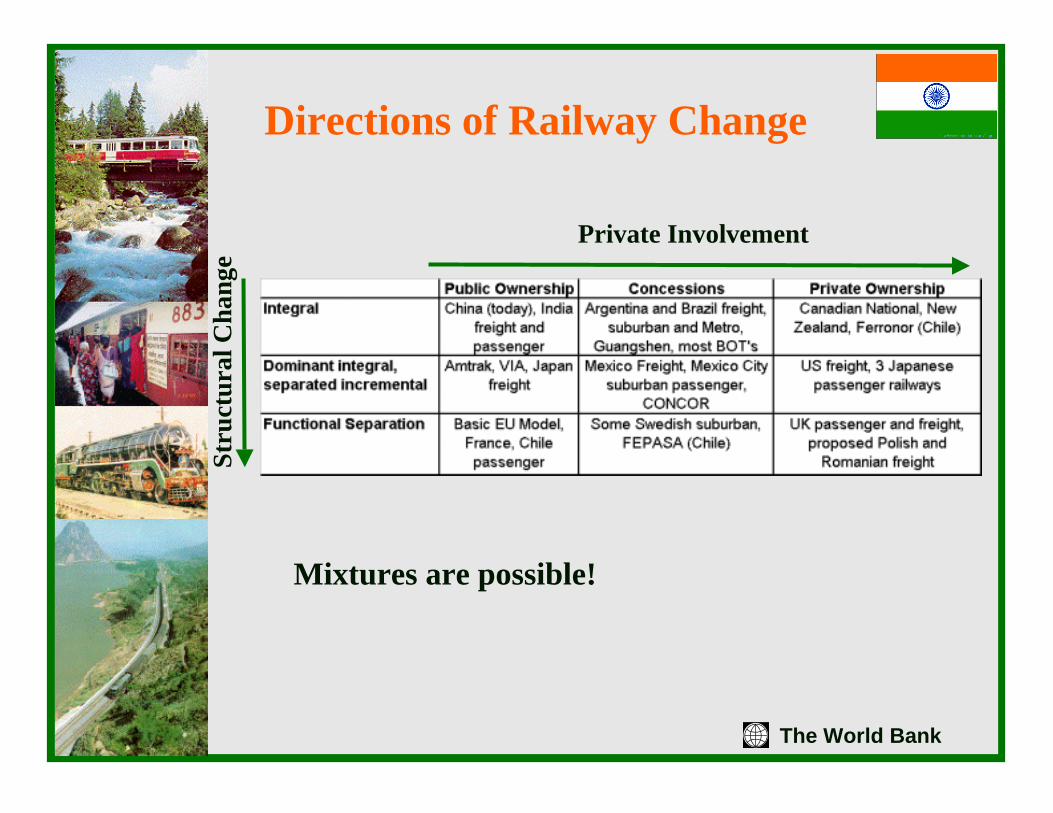
Directions of Railway Change
Private InvolvementSt
ruct
ural
Cha
nge
Mixtures are possible!
The World Bank
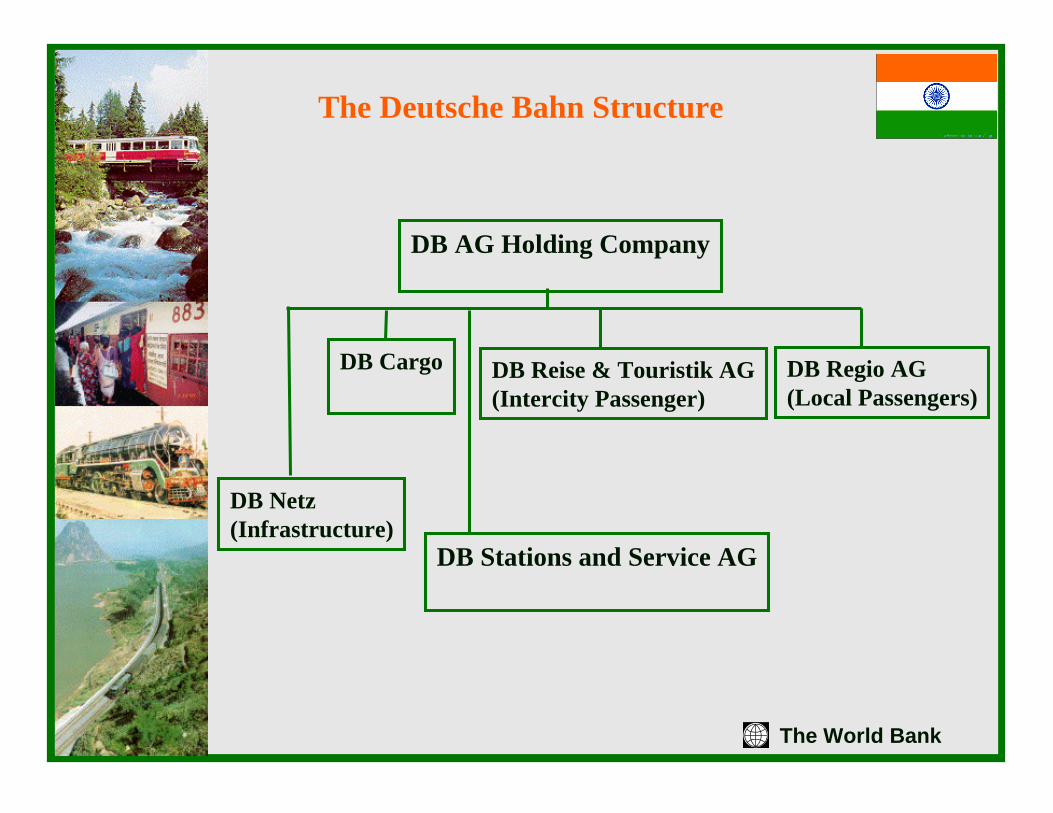
The Deutsche Bahn Structure
DB AG Holding Company
DB Netz(Infrastructure)
DB Stations and Service AG
DB Cargo DB Reise & Touristik AG(Intercity Passenger)
DB Regio AG(Local Passengers)
The World Bank
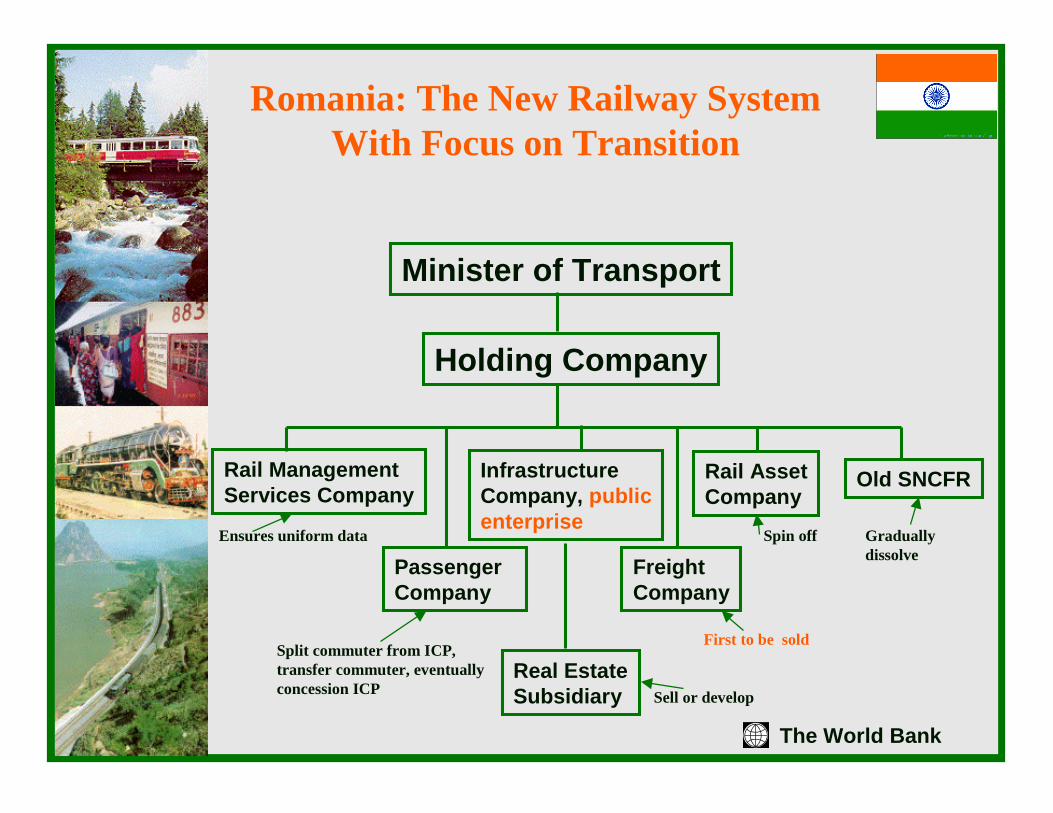
Romania: The New Railway SystemWith Focus on Transition
Minister of Transport
Holding Company
Rail ManagementServices Company
PassengerCompany
InfrastructureCompany, publicenterprise
Real EstateSubsidiary
FreightCompany
Rail AssetCompany
Old SNCFR
Graduallydissolve
First to be sold
Ensures uniform data
Split commuter from ICP,transfer commuter, eventuallyconcession ICP Sell or develop
Spin off
The World Bank
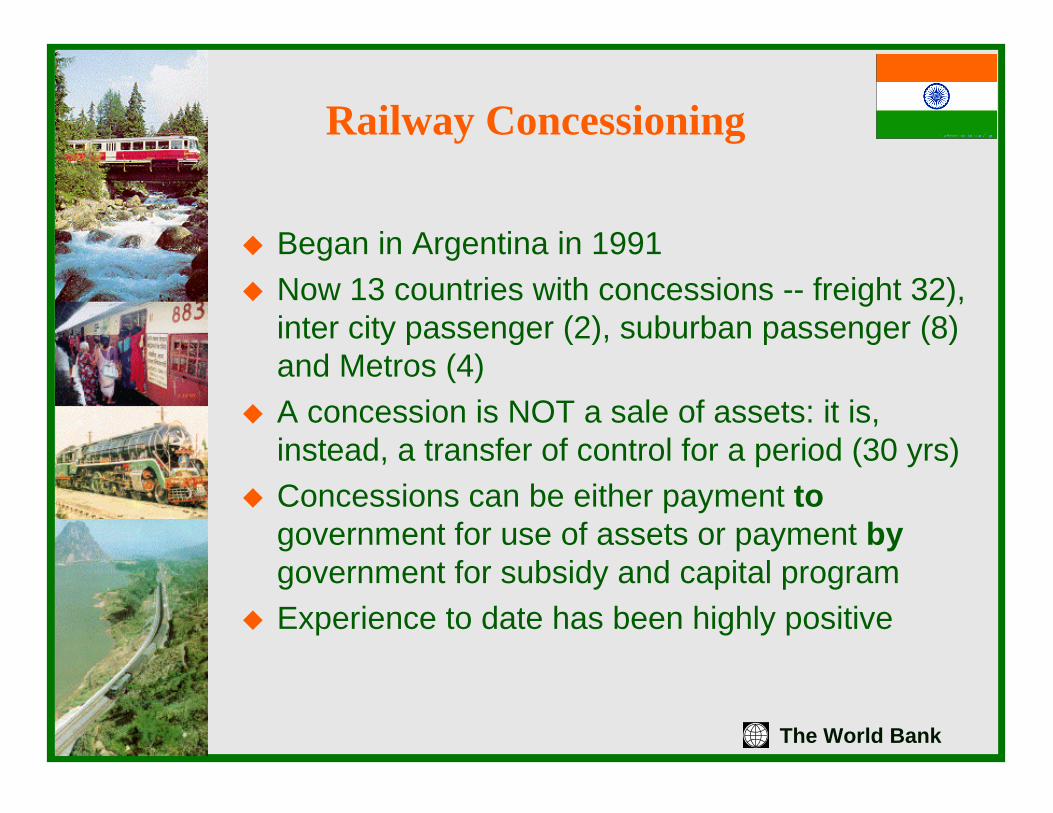
Railway Concessioning
� Began in Argentina in 1991� Now 13 countries with concessions -- freight 32),
inter city passenger (2), suburban passenger (8) and Metros (4)
� A concession is NOT a sale of assets: it is, instead, a transfer of control for a period (30 yrs)
� Concessions can be either payment togovernment for use of assets or payment by government for subsidy and capital program
� Experience to date has been highly positive
The World Bank
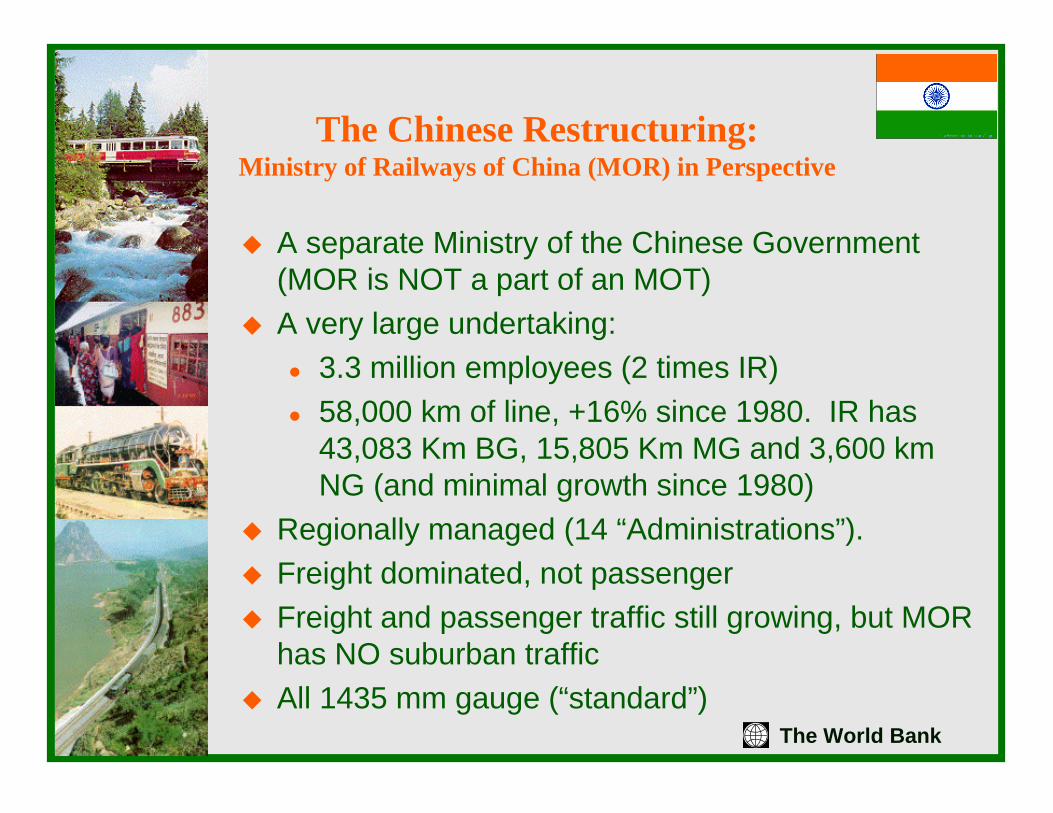
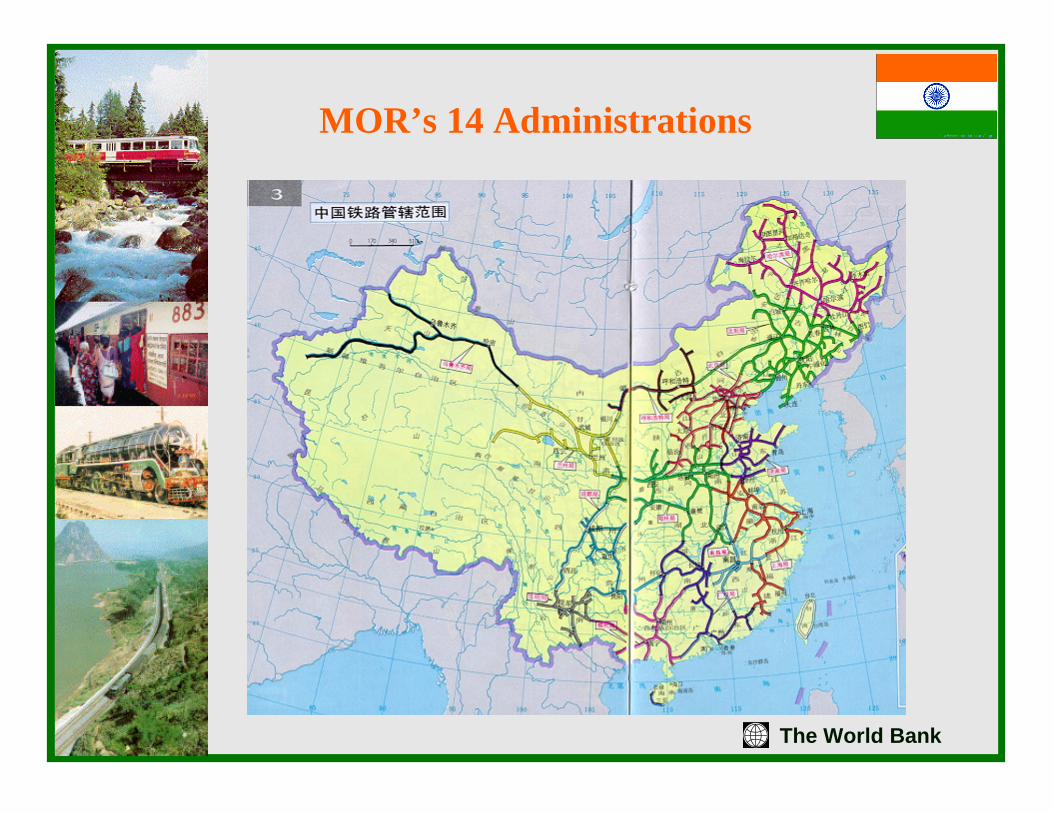
The Chinese Restructuring:Ministry of Railways of China (MOR) in Perspective
� A separate Ministry of the Chinese Government (MOR is NOT a part of an MOT)
� A very large undertaking:� 3.3 million employees (2 times IR)� 58,000 km of line, +16% since 1980. IR has
43,083 Km BG, 15,805 Km MG and 3,600 km NG (and minimal growth since 1980)
� Regionally managed (14 “Administrations”).� Freight dominated, not passenger� Freight and passenger traffic still growing, but MOR
has NO suburban traffic� All 1435 mm gauge (“standard”)
The World Bank
MOR’s 14 Administrations
The World Bank
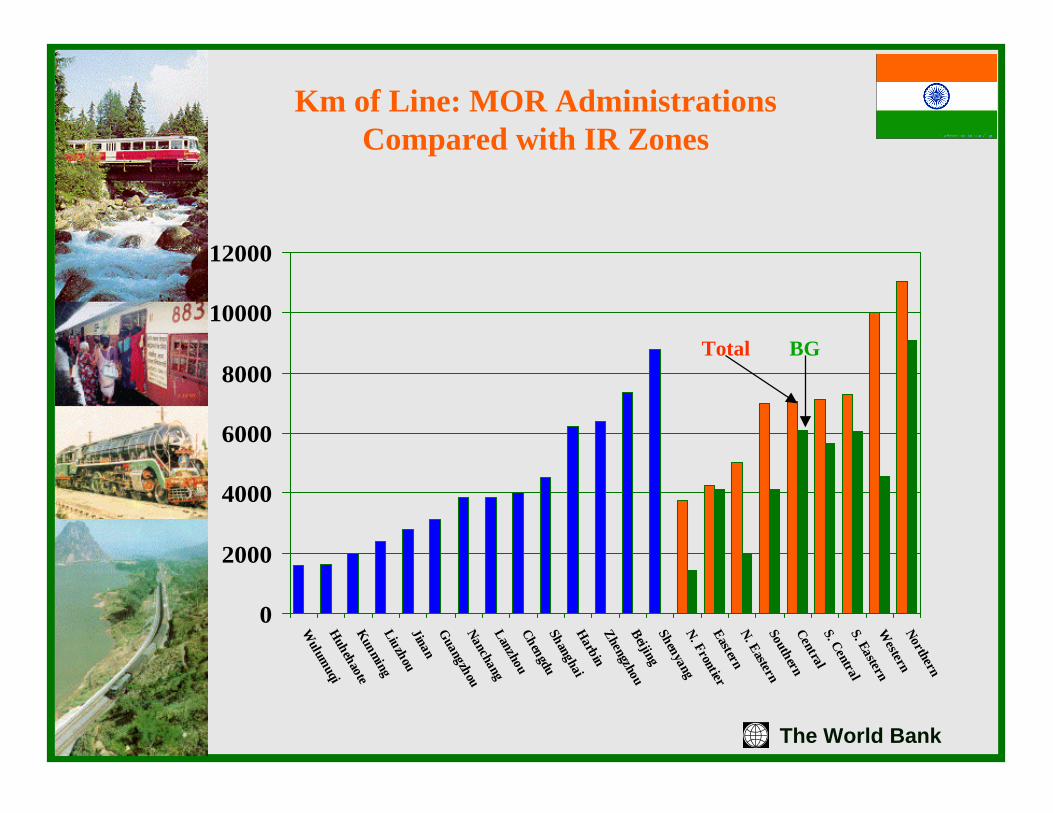
Km of Line: MOR Administrations Compared with IR Zones
0
2000
4000
6000
8000
10000
12000
Wulum
uqiHuhehaoteKunmingLiuzhouJinanGuangzhouNanchangLanzhouChengduShanghaiHarbinZhengzhouBeijingShenyangN. FrontierEasternN. EasternSouthernCentralS. CentralS. EasternW
esternNorthern
Total BG
The World Bank
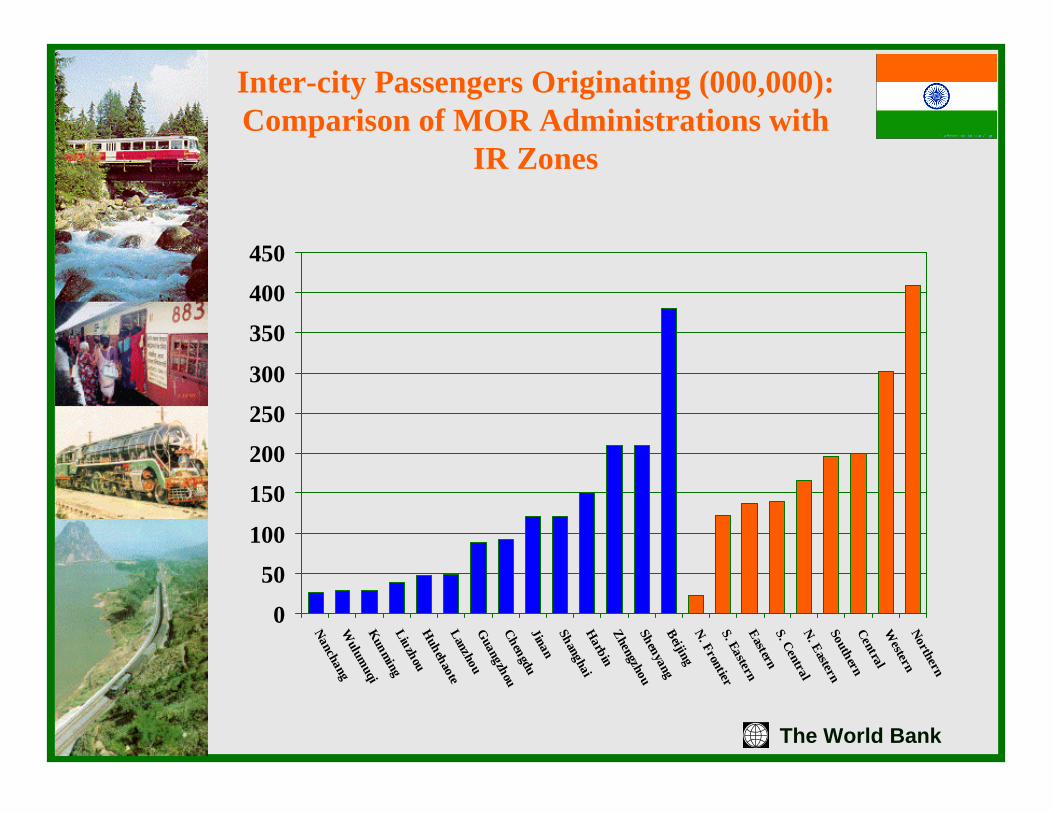
Inter-city Passengers Originating (000,000): Comparison of MOR Administrations with
IR Zones
0
50100
150200250300
350400450
NanchangW
ulumuqi
KunmingLiuzhouHuhehaoteLanzhouGuangzhouChengduJinanShanghaiHarbinZhengzhouShenyangBeijingN. FrontierS. EasternEasternS. CentralN. EasternSouthernCentralW
esternNorthern
The World Bank
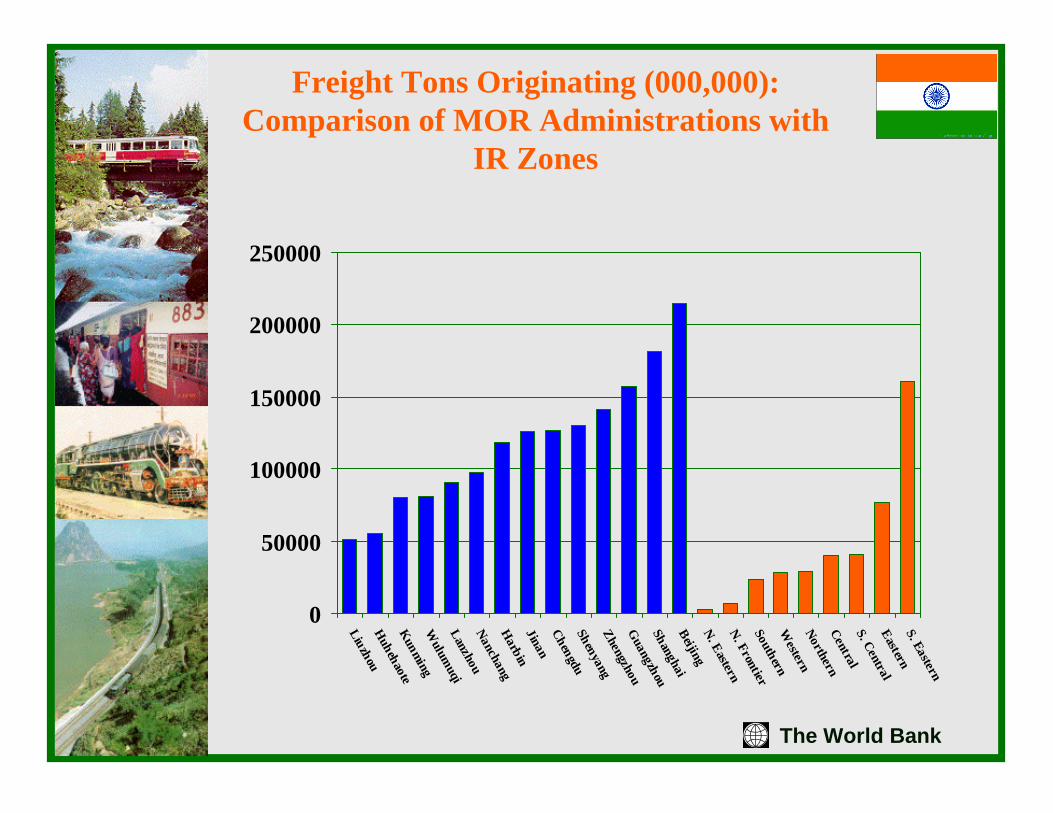
Freight Tons Originating (000,000): Comparison of MOR Administrations with
IR Zones
0
50000
100000
150000
200000
250000
LiuzhouHuhehaoteKunmingW
ulumuqi
LanzhouNanchangHarbinJinanChengduShenyangZhengzhouGuangzhouShanghaiBeijingN. EasternN. FrontierSouthernW
esternNorthernCentralS. CentralEasternS. Eastern
The World Bank
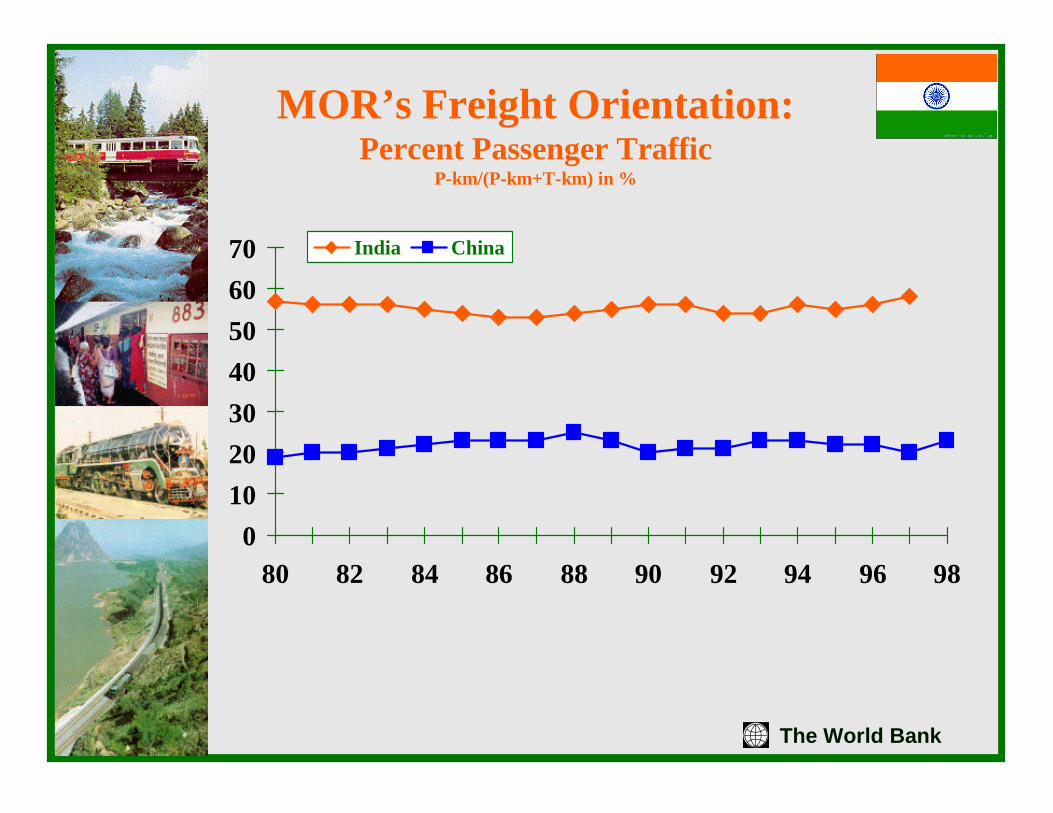
MOR’s Freight Orientation:Percent Passenger Traffic
P-km/(P-km+T-km) in %
010203040506070
80 82 84 86 88 90 92 94 96 98
India China
The World Bank
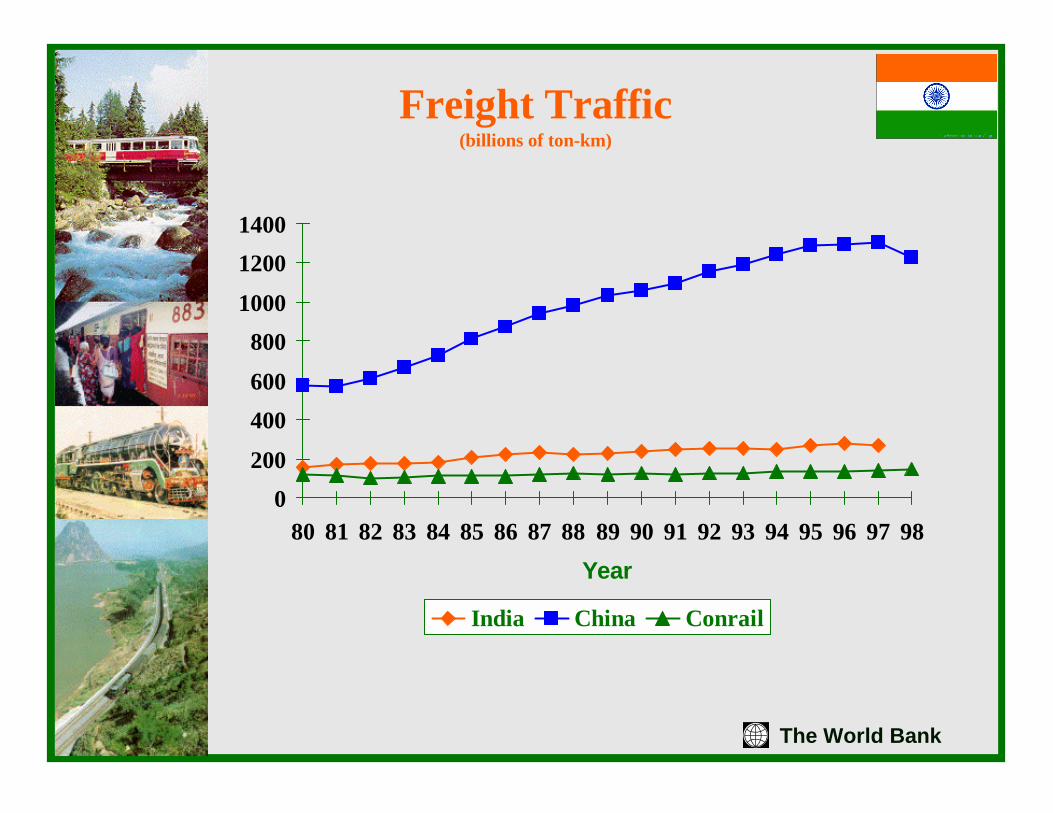
Freight Traffic(billions of ton-km)
0200
400600
8001000
12001400
80 81 82 83 84 85 86 87 88 89 90 91 92 93 94 95 96 97 98Year
India China Conrail
The World Bank
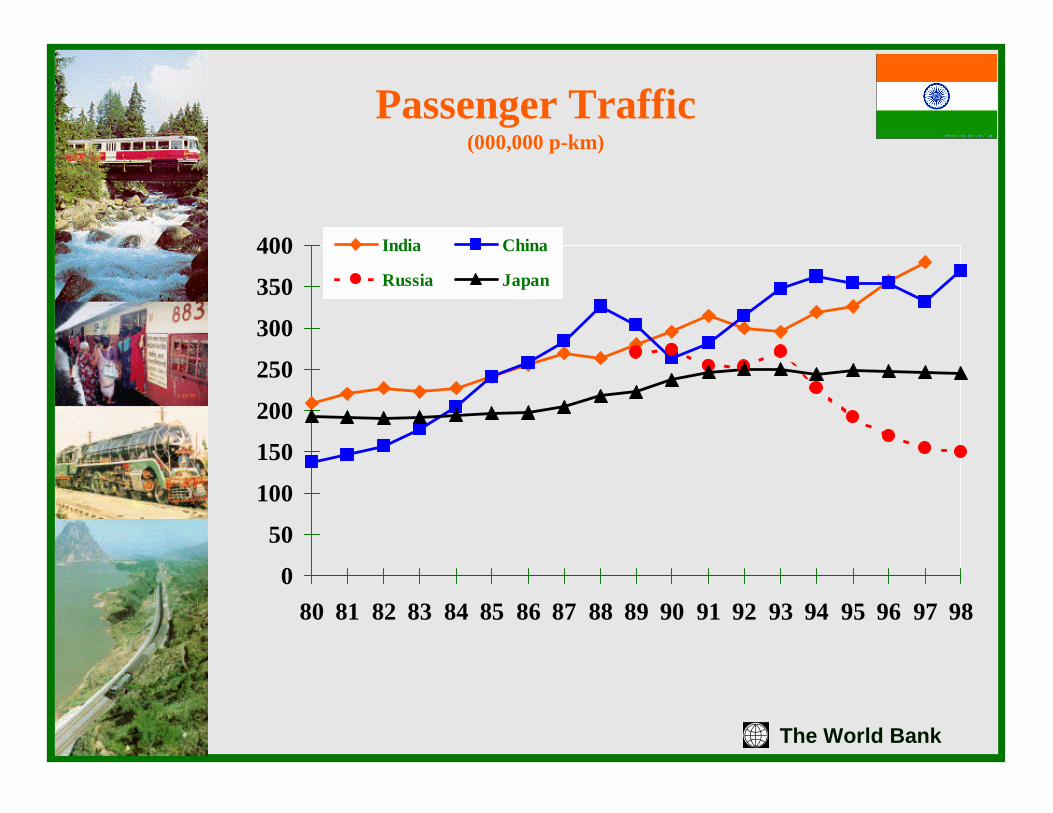
Passenger Traffic(000,000 p-km)
0
50
100
150
200
250
300
350
400
80 81 82 83 84 85 86 87 88 89 90 91 92 93 94 95 96 97 98
India China
Russia Japan
The World Bank
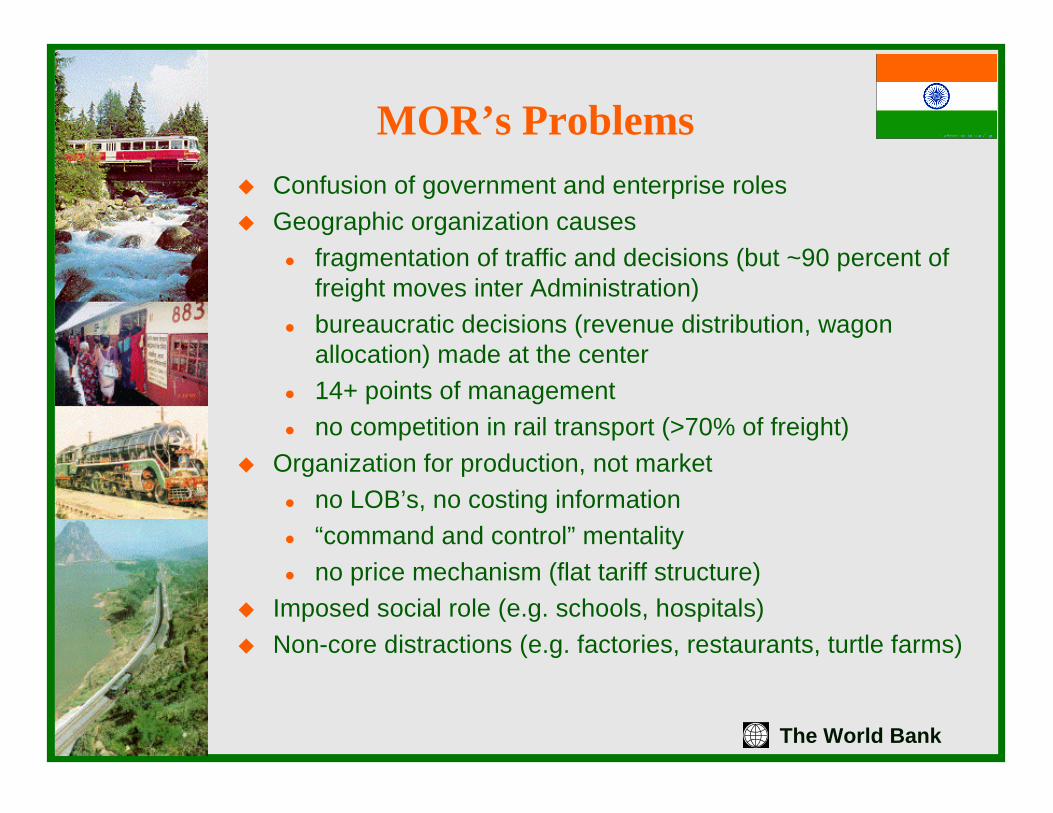
MOR’s Problems� Confusion of government and enterprise roles� Geographic organization causes
� fragmentation of traffic and decisions (but ~90 percent of freight moves inter Administration)
� bureaucratic decisions (revenue distribution, wagon allocation) made at the center
� 14+ points of management � no competition in rail transport (>70% of freight)
� Organization for production, not market� no LOB’s, no costing information� “command and control” mentality� no price mechanism (flat tariff structure)
� Imposed social role (e.g. schools, hospitals)� Non-core distractions (e.g. factories, restaurants, turtle farms)
The World Bank
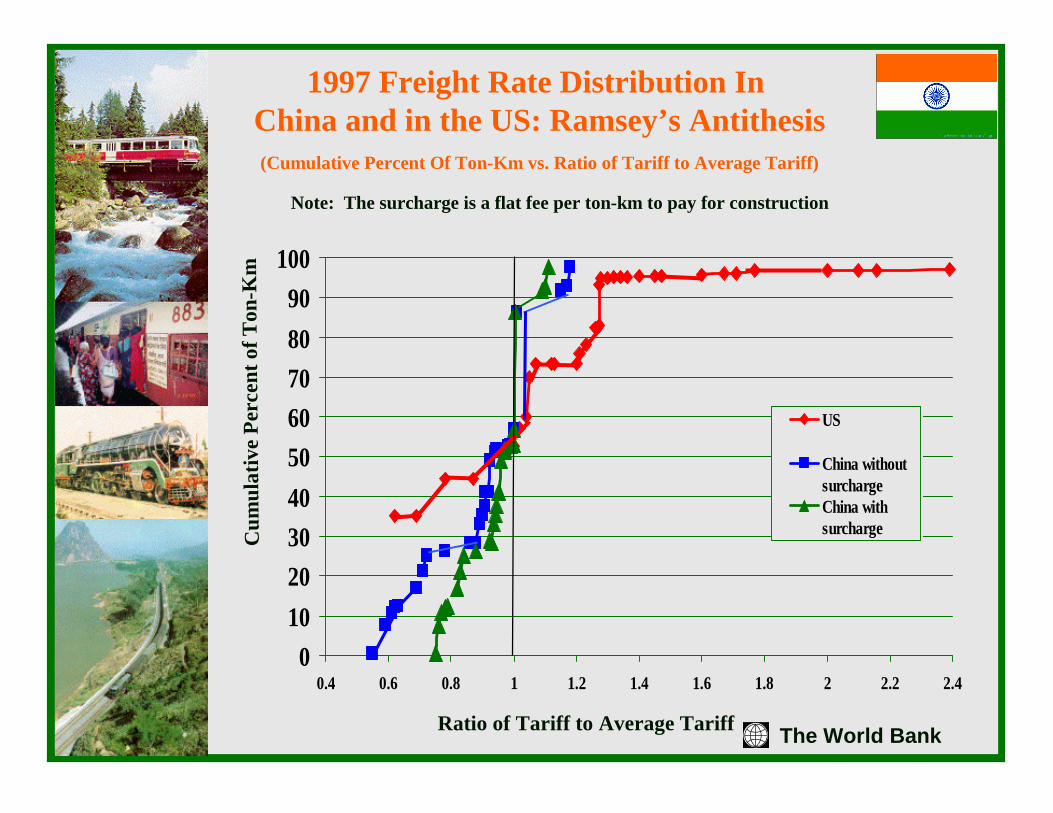
1997 Freight Rate Distribution InChina and in the US: Ramsey’s Antithesis(Cumulative Percent Of Ton-Km vs. Ratio of Tariff to Average Tariff)
0102030405060708090
100
0.4 0.6 0.8 1 1.2 1.4 1.6 1.8 2 2.2 2.4
US
China withoutsurchargeChina withsurcharge
Ratio of Tariff to Average Tariff
Cum
ulat
ive
Perc
ent o
f Ton
-Km
Note: The surcharge is a flat fee per ton-km to pay for construction
The World Bank
MOR’s Program of Restructuring:Guidelines
� Separate government from enterprise and reduce government (MOR from 1500 to 700)
� Restructure enterprise(s), and try to reduce the number of layers of management -- supported by modern information technology
� Adopt commercial approach
The World Bank
MOR’s Restructuring Program:Committed Actions
� Make non-core activities (manufacturing) “independent”� Transfer social activities to government (usually local)� Separate passenger businesses, (PTE’s) from the
remainder of the railway in each Administration (freight and infrastructure remain integral for now). Separation to be accounting at first, then institutional
� Install traffic costing models to clarify results� Make passenger services “profitable” or consider
discontinuance -- GM’s have personal contract to do so� Uneconomic branch lines separated and either:
� given to local agencies or agents� discontinued or PSO supported� possibly privatized or concessioned
The World Bank
MOR’s Restructuring Program:Future Decisions
� Restructure PTE’s as appropriate across Administration lines -- could entail mergers and/or creation of competition
� Accounting separation of Freight TE’s. Institutional separation to be decided later
� FTE institutional separation (called “up/down”), if it occurs, could then lead to cross boundary mergers and/or competition
� Specialized companies (container, oversize, dangerous) may also be formed
� Other “separations” such as rolling stock also to be studied� Probable outcome: slowly evolving mixture with each
service organized to fit its market
The World Bank
MOR’s Restructuring:Issues and Approaches
� Separation of enterprise and government -- establish an MOT, set up railways as enterprises, initially at Administration level
� Commercial approach -- Line Of Business (LOB) organizations at all levels -- freight, several passenger companies, related
� Rail enterprise structure -- choice of full separation (DB) versus freight integral and passenger separation (US freight/Amtrak) or fully integral models on Administration or national basis
� Market structure organization -- mergers of PTE’s and possibly FTE’s across Administration boundaries (infrastructure likely set up at Administration level, though other structures are possible)
� Competition -- could have parallel/competitive infrastructure, but more likely will be competitive trackage rights, if any competition desired
� Private sector involvement -- non-core and local lines may be sold (Guangshen), private equipment ownership probable, specialized operators possible, generalized privatization not on the horizon (if ever)
� Transition -- holding company as in DB or Romania
� Overall -- cautious, “experiment”-based approach, with many compromises and mixes (as always)
The World Bank
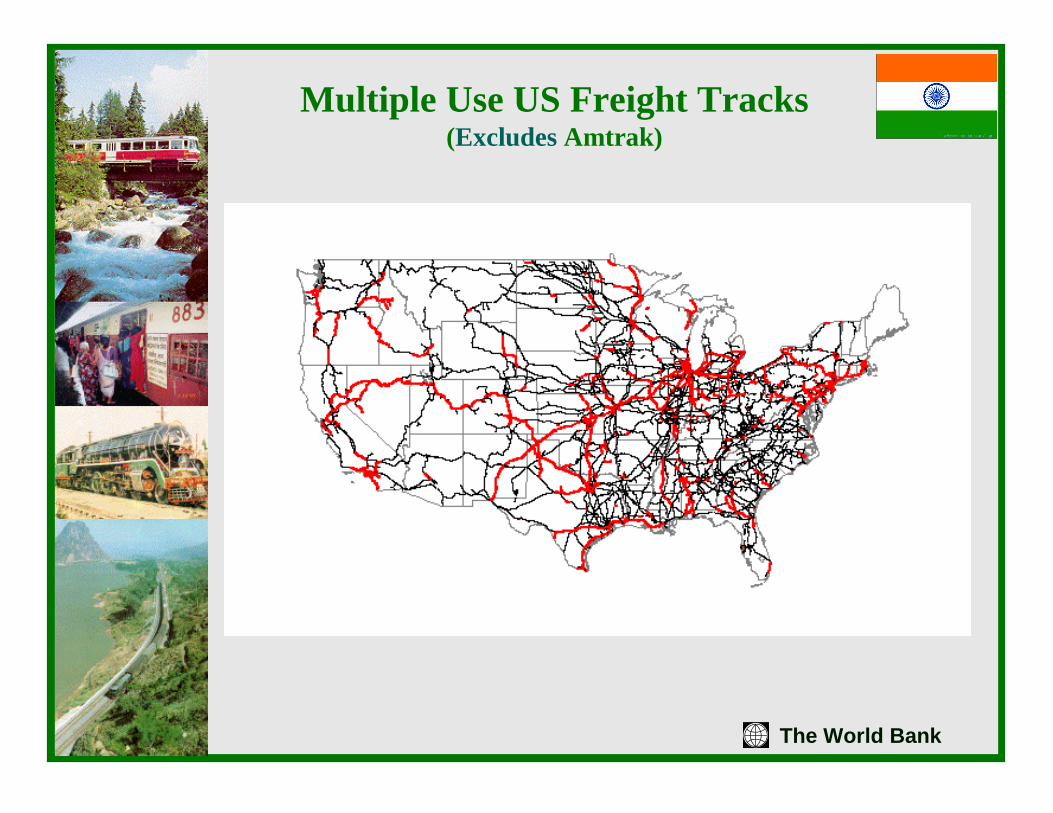
Multiple Use US Freight Tracks(Excludes Amtrak)
The World Bank
MOR Restructuring;Primary Tools for Evaluating Options
� TMIS -- traffic, routing operating and revenue data� Traffic costing models -- use basic data to
estimate cost and “contribution” of traffic on shipment, commodity, line segment and area basis
� PC-based network models -- for traffic flow analysis
� PC-based capacity and scheduling models -- to permit analysis of potential for enterprise structures
� PC-based financial planning models -- to permit rapid analysis of cost and revenue scenarios
The World Bank
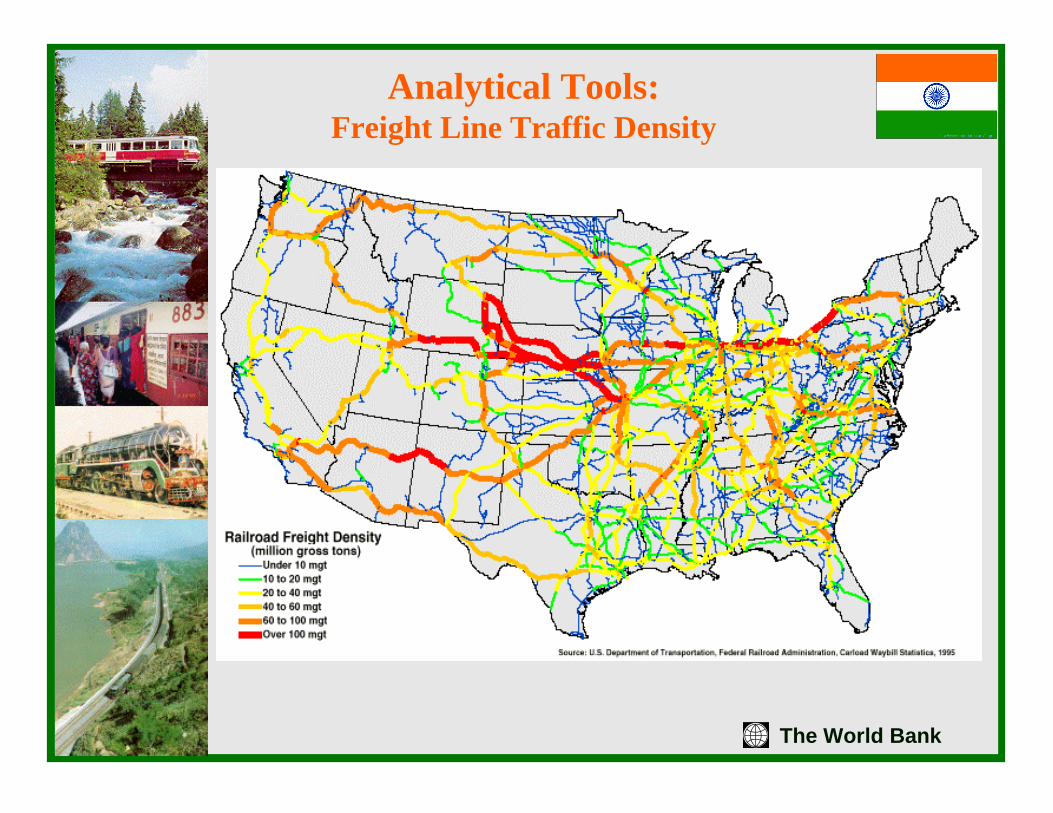
Analytical Tools:Freight Line Traffic Density
The World Bank
Restructuring IR:Initial Observations
� Similarities with China� regional structure, not market driven� mixture of government and enterprise, politics� imposed social functions, large non-core activities
� In some ways, India really is different� variations in Zonal characteristics � the gauge effect -- three railways� suburban operations (2000 trains daily)
� IR faces serious and near-term threats� the labor cost squeeze� high passenger traffic share and low fares� rapidly growing (WB financed!) competition
� No railway ever was restructured wholly from within -- retain outside involvement.
� What are INDIA’s objectives
The World Bank
Zonal Railways Are Different:Freight Ton-Km as Percent of Total Traffic
01020304050607080
N. EasternSouthernCentralW
esternN. FrontierNorthernEasternS. CentralS. Eastern
IR Average
The World Bank
The Gauge Effect:India’s Three Separate Railways
5.80 0.3
25.3
3.28.5
68.9
96.891.2
0102030405060708090
100
Narrow Gauge Meter Gauge Broad Gauge
% line-km% t-km% p-km
The World Bank
IR’s Suburban Activities(Passenger-Km in 000,000)
0
5
10
15
20
25
30
35
Mumbai Chennai Calcutta
Central
Western
Southern MG
Southern BG
Eastern
SouthEastern
2000 trains daily
The World Bank
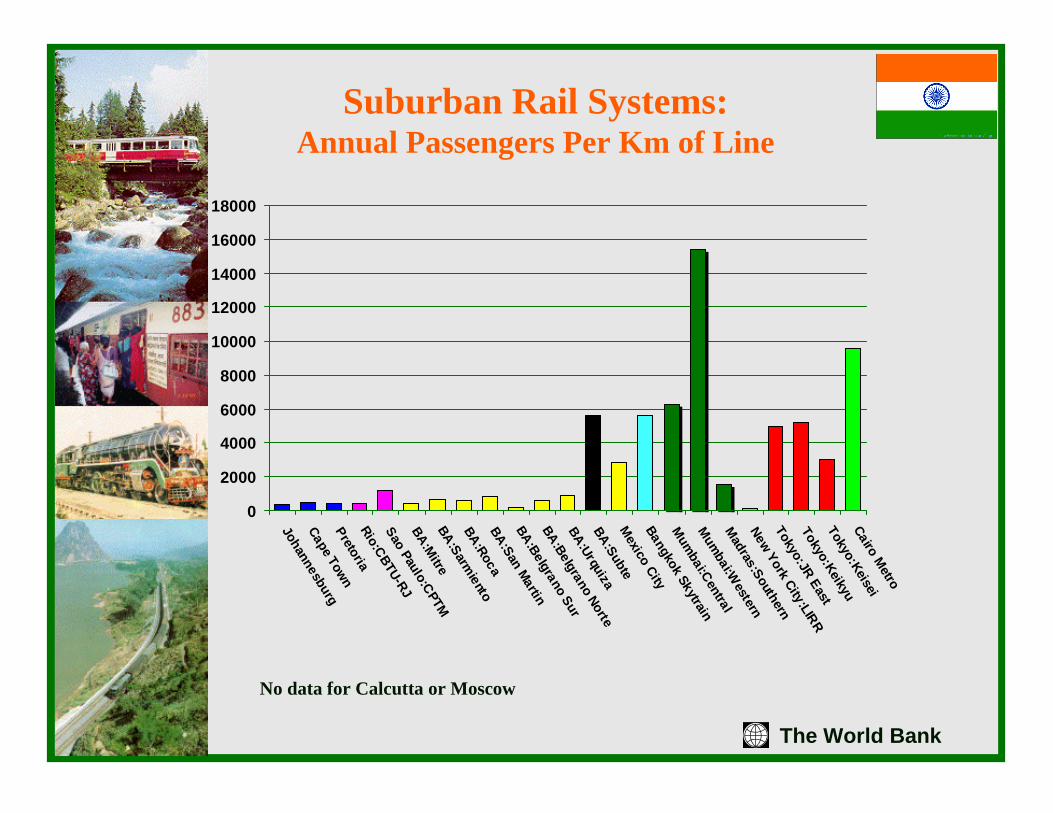
Suburban Rail Systems:Annual Passengers Per Km of Line
0
2000
4000
6000
8000
10000
12000
14000
16000
18000
JohannesburgCape TownPretoriaRio:CBTU-RJSao Paulo:CPTM
BA:MitreBA:Sarm
ientoBA:RocaBA:San MartinBA:Belgrano Sur
BA:Belgrano Norte
BA:UrquizaBA:SubteMexico CityBangkok Skytrain
Mumbai:Central
Mumbai:W
estern
Madras:Southern
New York City:LIRR
Tokyo:JR EastTokyo:KeikyuTokyo:KeiseiCairo Metro
No data for Calcutta or Moscow
The World Bank
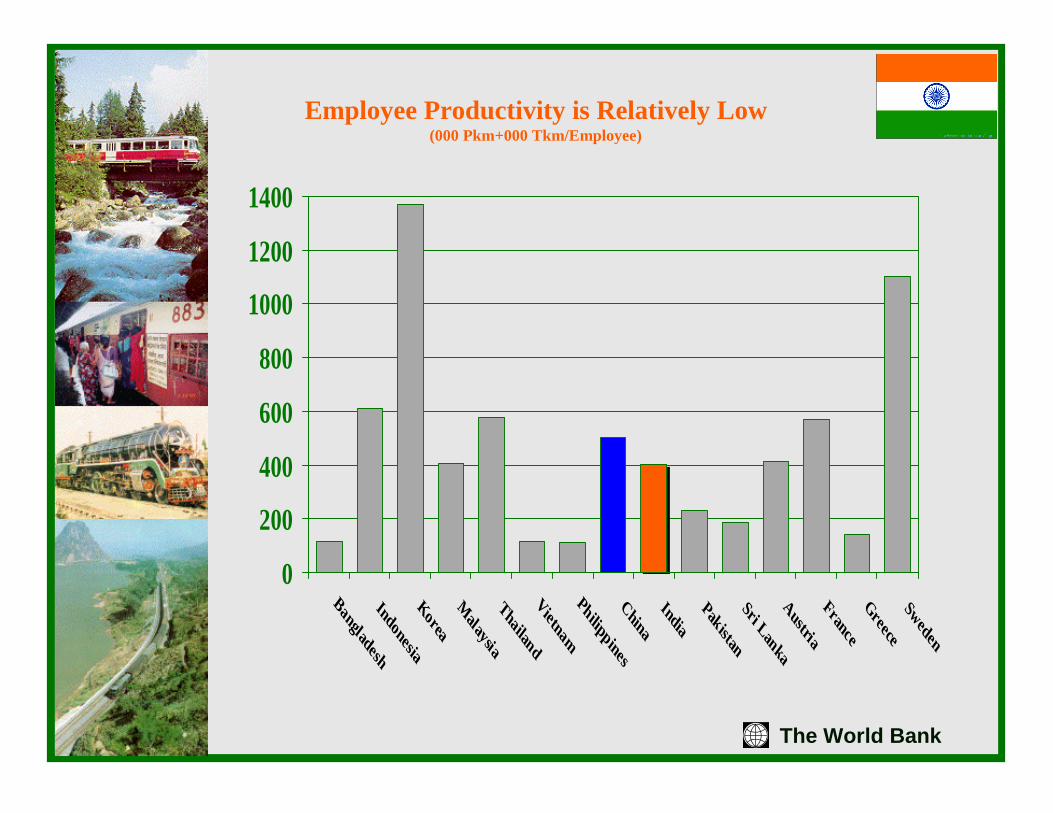
Employee Productivity is Relatively Low(000 Pkm+000 Tkm/Employee)
0
200
400
600
800
1000
1200
1400
Bangladesh Indonesia Korea M
alaysia ThailandVietnamPhilippines China India Pakistan Sri Lanka Austria France Greece Sweden
The World Bank
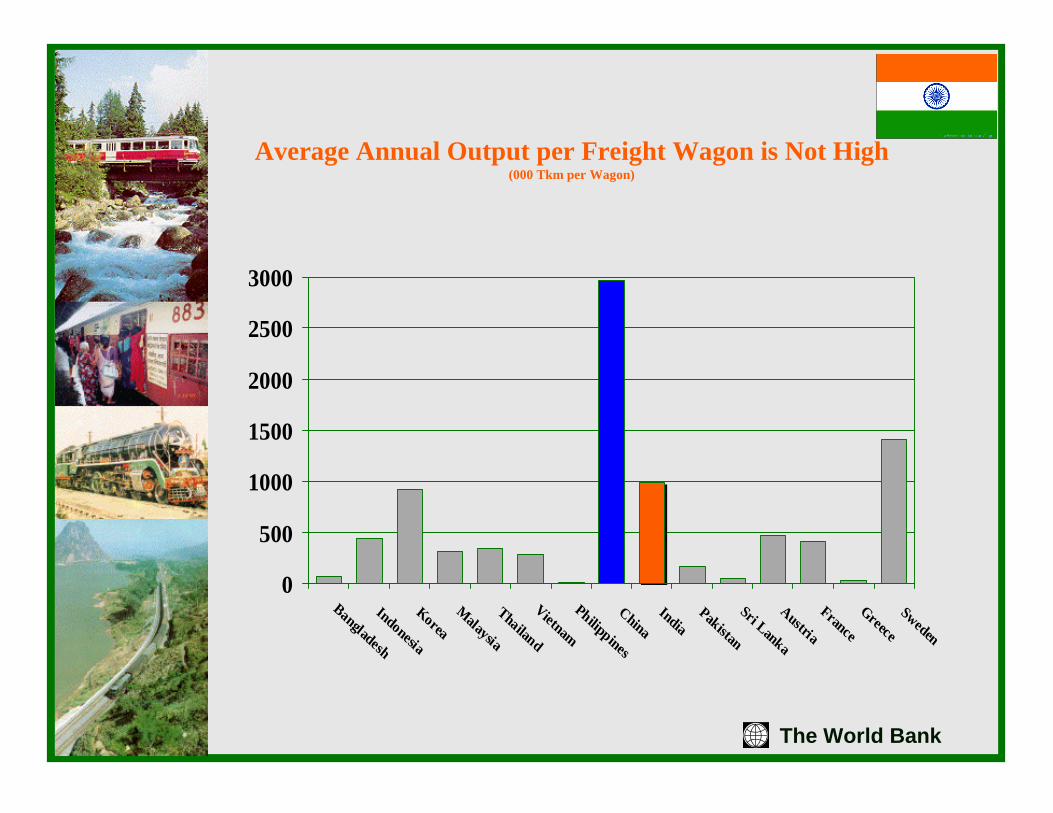
Average Annual Output per Freight Wagon is Not High(000 Tkm per Wagon)
0
500
1000
1500
2000
2500
3000
Bangladesh
Indonesia
Korea
Malaysia
Thailand
Vietnam
Philippines
China India
Pakistan
Sri Lanka
Austria
France
Greece
Sweden
The World Bank
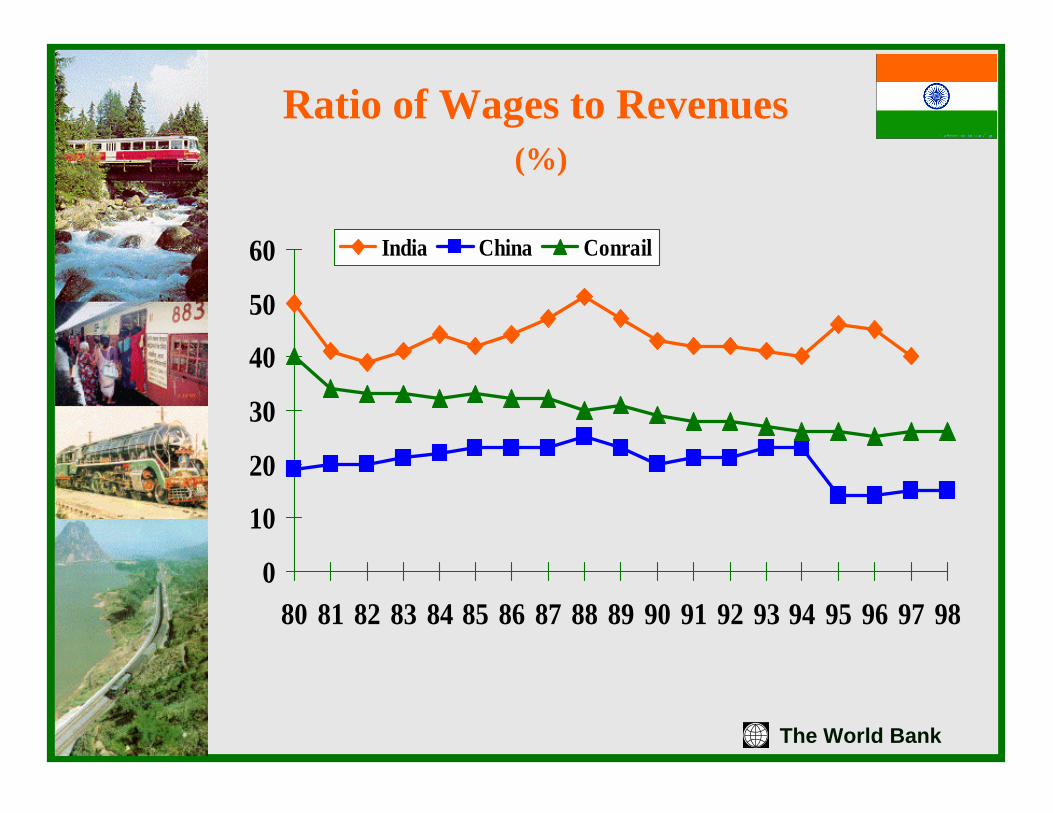
Ratio of Wages to Revenues(%)
0
10
20
30
40
50
60
80 81 82 83 84 85 86 87 88 89 90 91 92 93 94 95 96 97 98
India China Conrail
The World Bank
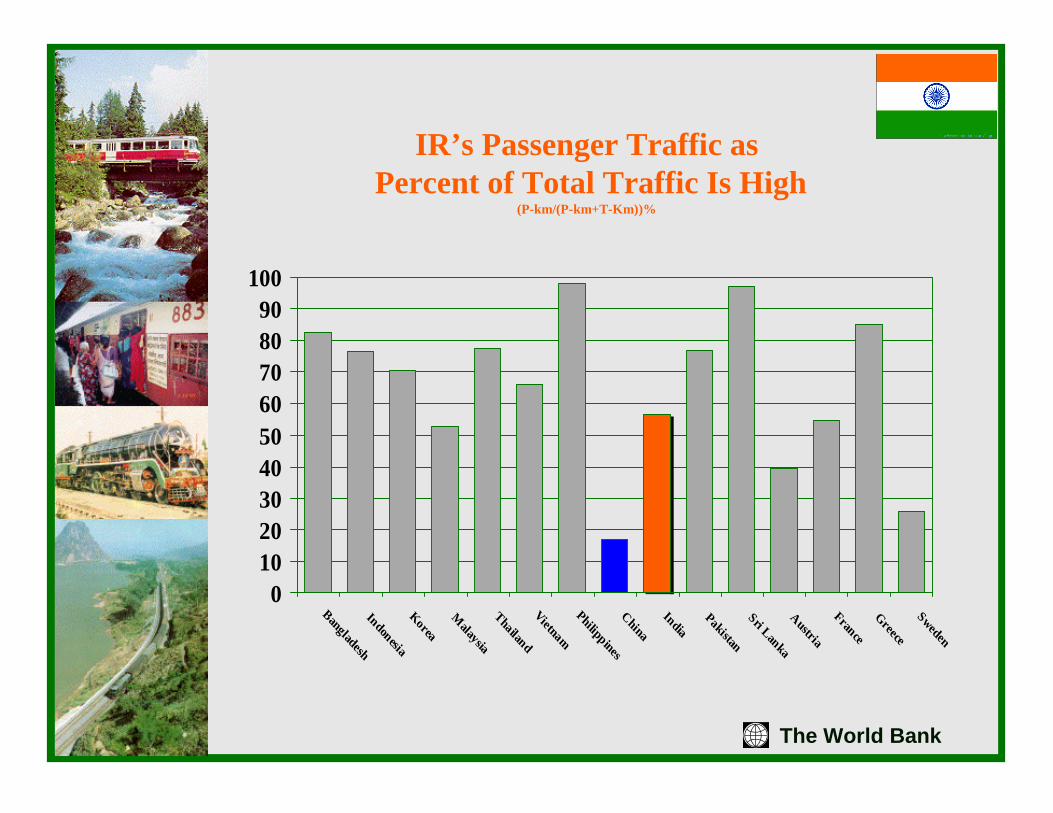
IR’s Passenger Traffic asPercent of Total Traffic Is High
(P-km/(P-km+T-Km))%
0102030405060708090
100Bangladesh Indonesia Korea
Malaysia
ThailandVietnamPhilippines China
India
Pakistan Sri Lanka Austria France Greece Sweden
The World Bank
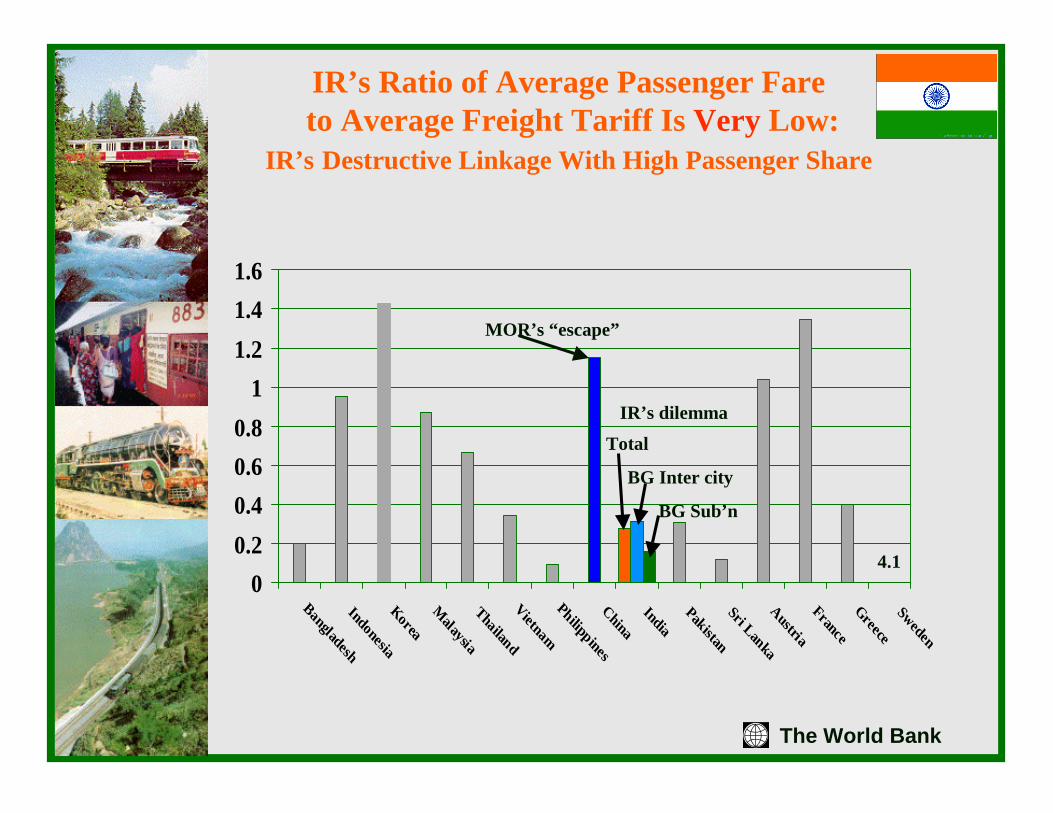
IR’s Ratio of Average Passenger Fareto Average Freight Tariff Is Very Low:
IR’s Destructive Linkage With High Passenger Share
00.20.40.60.8
11.21.41.6
Bangladesh Indonesia Korea M
alaysia ThailandVietnamPhilippines China India Pakistan Sri Lanka Austria France Greece Sweden
4.1
Total
BG Inter city
BG Sub’n
MOR’s “escape”
IR’s dilemma
The World Bank
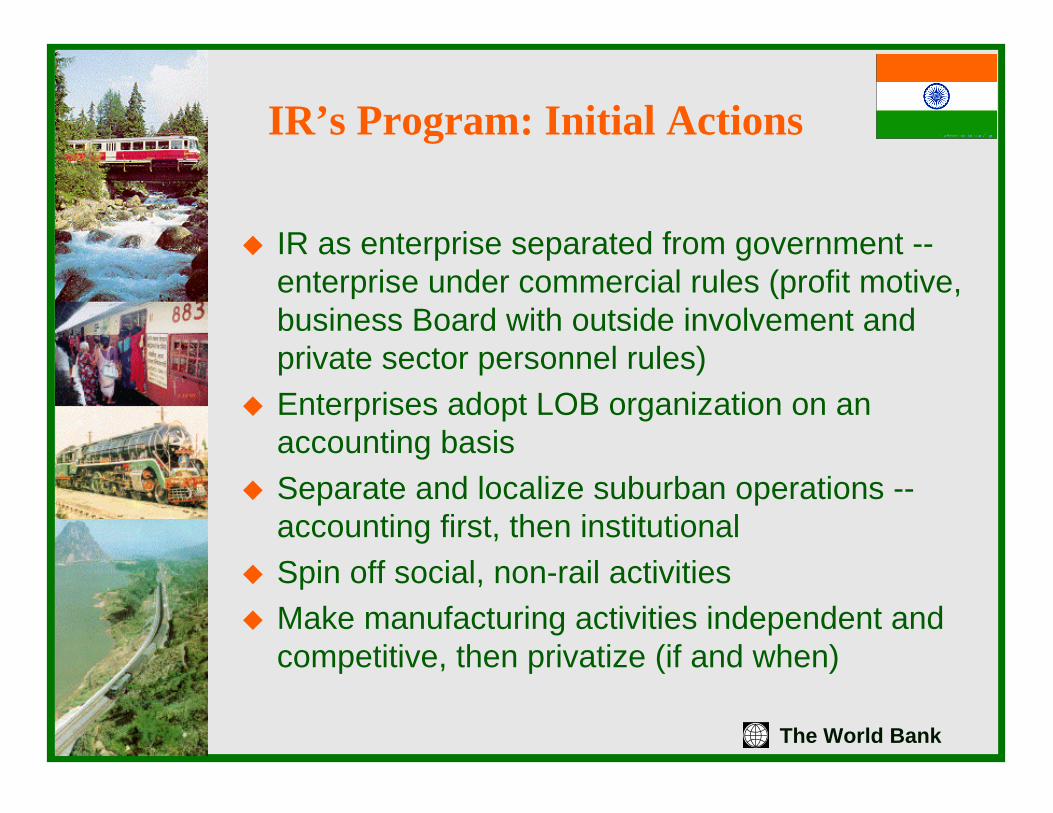
IR’s Program: Initial Actions
� IR as enterprise separated from government --enterprise under commercial rules (profit motive, business Board with outside involvement and private sector personnel rules)
� Enterprises adopt LOB organization on an accounting basis
� Separate and localize suburban operations --accounting first, then institutional
� Spin off social, non-rail activities� Make manufacturing activities independent and
competitive, then privatize (if and when)
The World Bank
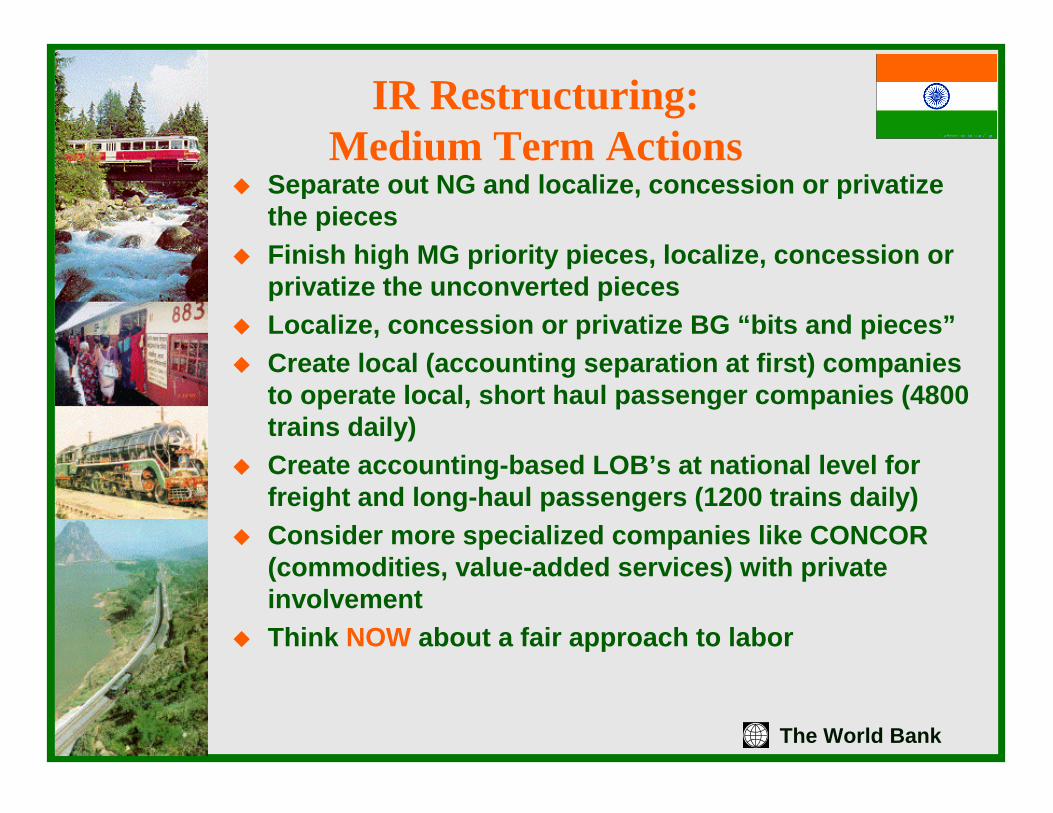
IR Restructuring:Medium Term Actions
� Separate out NG and localize, concession or privatize the pieces
� Finish high MG priority pieces, localize, concession or privatize the unconverted pieces
� Localize, concession or privatize BG “bits and pieces”� Create local (accounting separation at first) companies
to operate local, short haul passenger companies (4800 trains daily)
� Create accounting-based LOB’s at national level for freight and long-haul passengers (1200 trains daily)
� Consider more specialized companies like CONCOR (commodities, value-added services) with private involvement
� Think NOW about a fair approach to labor
The World Bank
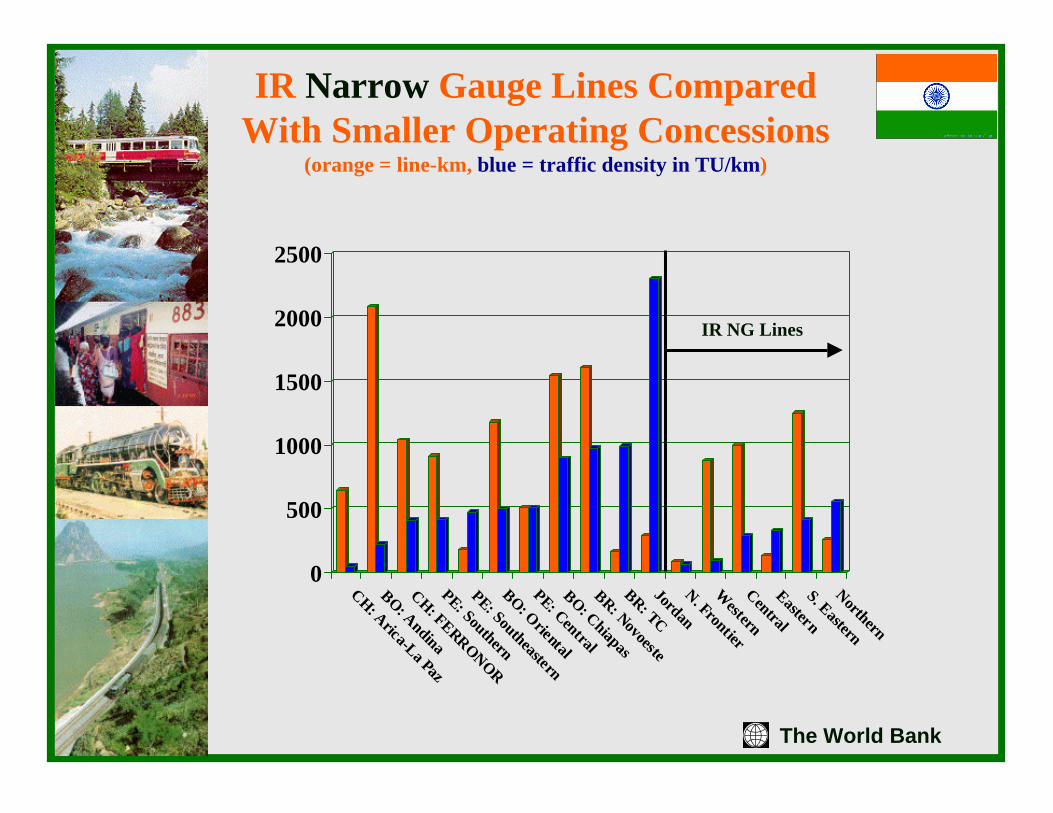
IR Narrow Gauge Lines Compared With Smaller Operating Concessions
(orange = line-km, blue = traffic density in TU/km)
0
500
1000
1500
2000
2500
CH: Arica-La Paz
BO: AndinaCH: FERRONOR
PE: Southern
PE: Southeastern
BO: Oriental
PE: CentralBO: Chiapas
BR: Novoeste
BR: TCJordanN. FrontierW
esternCentralEasternS. EasternNorthern
IR NG Lines
The World Bank
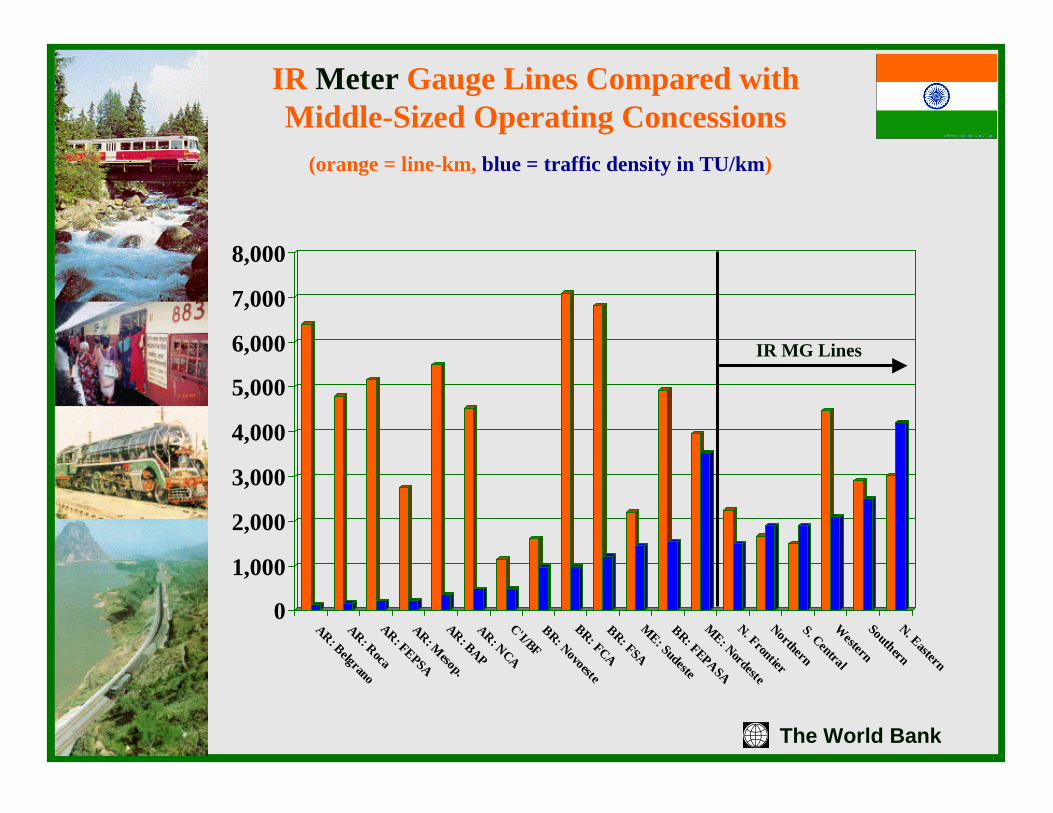
IR Meter Gauge Lines Compared with Middle-Sized Operating Concessions
(orange = line-km, blue = traffic density in TU/km)
0
1,000
2,000
3,000
4,000
5,000
6,000
7,000
8,000
AR: BelgranoAR: RocaAR: FEPSAAR: M
esop.AR: BAPAR: NCAC'I/BFBR: NovoesteBR: FCABR: FSAME: SudesteBR: FEPASAME: NordesteN. FrontierNorthernS. CentralW
esternSouthernN. Eastern
IR MG Lines
The World Bank
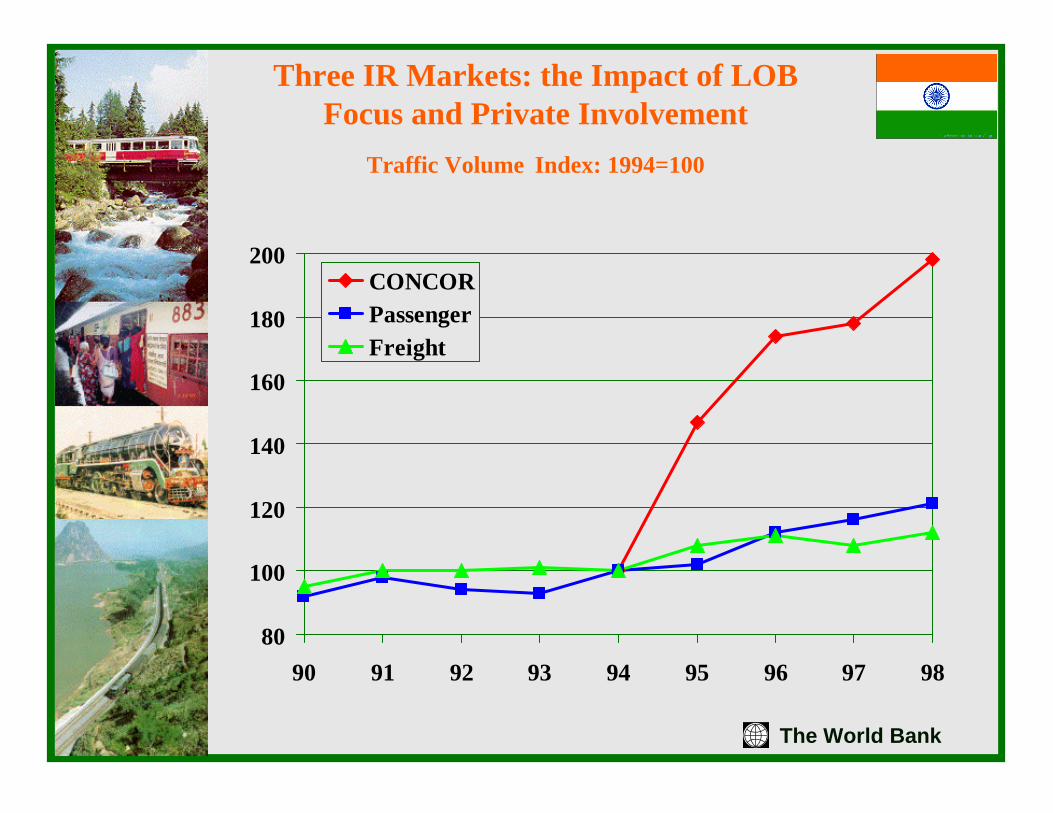
Three IR Markets: the Impact of LOB Focus and Private Involvement
Traffic Volume Index: 1994=100
80
100
120
140
160
180
200
90 91 92 93 94 95 96 97 98
CONCORPassengerFreight
The World Bank
Structural Options� Structure -- infrastructure (integral, dominant or separated)� Why separation of infrastructure?
� equal access for conflicting users� promote intra- rail competition� clarity of costs and benefits of various services� facilitate mixed solutions
� Why NOT separate� complex and costly -- transaction costs� potential conflicts and confusion
� Critical issues� access charges -- structure and levels?� scheduling and dispatching -- who and where?
� Indian potential -- consider dominant -- integral structure with infrastructure managed at regional level. Freight should be dominant, inter city passenger managed at both regional and national level. Transition important
The World Bank
Options for Competition
� Need detailed analysis of freight and passenger flows --use LRDSS -- identify major markets where competition could be sustained (the quadrilateral?)
� Choice initially based on maximum origin to destination service, then on competition in major markets -- in the US, 25 percent of tracks serve >50 percent of the rail freight market
� Analyze likely profitability of freight and passenger flows -- use costing models
� Use profitability analysis to support pricing changes, competition needs and PSO requests
� Infrastructure territory is not as important as freight enterprise and passenger enterprise structure -- and all three can be different
The World Bank
Options for Private Sector Role
� Private sector, per se, is neither panacea nor ideological objective -- nor objectionable
� Don’t privatize monopolies -- especially future suppliers -- restructure them first, along with railway services, and provide for regulation
� Consider specialized companies (like CONCOR) for private sector involvement
� Consider NG, MG or BG “short lines” for private sector operation (privatization or concessioning, passenger or freight) -- pick a few examples and try them
The World Bank
What Has the World Bank Done?
� Restructuring analyses, analytical tools and TA� Asset rehabilitation to support new structure� Labor transitions and retraining� Resettlement� Environmental cleanup� Changes in structure (suburban devolution,
creation of management and accounting systems)
� Risk guarantees� Transaction management� Investment in private operators