final report an assessment of ethnic market opportunities ... · an assessment of ethnic market...
TRANSCRIPT

Final Report
An Assessment of Ethnic Market Opportunities for Indiana Farm‐Raised Fish
Submitted by Kwamena K. Quagrainie1, Monique Fahie2, Kevin Hughes3, and Ai Xing4
1 Aquaculture Marketing Specialist, Department of Agricultural Economics, Purdue University 2 MS Student, Department of Agricultural Economics, Purdue University 3 BS Student, School of Electrical and Computer Engineering, Purdue University 4 BS Student, Department of Agricultural Economics, Purdue University
This study was funded by the Indiana Soybean Alliance
i
1
INTRODUCTION
The US imports about 83% of the seafood consumed, which are mainly processed seafood.
Indiana’s aquaculture industry is small and cannot compete with low‐priced imported processed
seafood products. The Indiana aquaculture industry accounts for only 0.3% of the $1.1 billion US
aquaculture industry. Indiana’s potential to increase aquaculture production lies with accessibility
to markets as well as niche opportunities. Indiana has the comparative advantage to produce fish
that can be sold live and fresh to ethnic markets. Such products can attract premiums. Ultimately,
developing the ethnic market would require increased Indiana fish production and the consequent
increased use of soy‐based fish feed. Opportunities therefore exist to explore and develop the
market for live and fresh fish. This market however, is not mainstream but limited to ethnic
groups.
The overall objective of this study was to examine the ethnic market in the region, particularly in
Indiana to assess seafood buying patterns and preferences. Ethnic markets are traditional outlets
for the sale of live and fresh fish that caters for Asian, African and Latin American fish consumers.
The populations of these ethnic groups are increasing rapidly in Indiana and yet ethnic retail
outlets that cater to this clientele have not been studied. Little is known about their seafood
purchasing patterns, habits and preferences. Most Asian grocers carry live fish, and customers
who demand live fish products are willing to pay a premium. As part of the growth strategy for
Indiana aquaculture, there was the need to study these ethnic markets to assess fish species
demanded, supply requirements, demand, prices, product promotion strategies, and other
marketing factors. The findings reported from the study are useful in identifying the species that
can be produced in Indiana to serve the live market, quantifying potential demand volume, and
assessing demand trends and factors affecting demand.
The specific objectives of the study were to:
1. examine wholesale seafood purchase practices of ethnic fish retailers
2. determine factors important to their seafood purchase
3. identify marketing opportunities and develop marketing strategies that will enable
effective servicing of ethnic fish markets
4. evaluate customer perceptions, preferences, and purchase patterns for fish
STUDY DESIGN AND METHODS
Two Purdue University undergraduate students were recruited to conduct the survey of both
managers and customers of ethnic markets. The stores visited were selected from city yellow page
books, internet searches, and industry contacts. The initial focus was on Indiana, and the search
yielded 46 Indiana stores. Each of these stores was then contacted by phone to enquire if they

2
sold live fish. Many responded in the negative, therefore the study area was expanded to the
neighboring states of Illinois, Kentucky and Ohio. The expanded search yielded over 300 stores.
After a few phone calls, it became clear that few stores sold live fish and these were located
primarily in ethnic communities in the cities. Twenty eight (28) stores that sold live fish were
visited and 16 managers were willing to participate in the survey. The stores visited were located
in these cities ‐ Indiana: Indianapolis, West Lafayette, Fort Wayne, and Evansville; Ohio: Columbus,
Fairfield, Cincinnati, and Cleveland; Illinois: Chicago.
The surveys were in‐person and conducted by the two Purdue University undergraduate students,
one of which is of Chinese origin. The presence of a Chinese enumerator assisted to address
cultural, communication and some personal interaction challenges. The surveys were conducted
from June‐August, and also in October 2008. In the course of surveying the managers, customers
were also surveyed. A total of 16 store managers and 461 customers were interviewed during the
period. The questionnaires are provided in Appendix 1 – Manager Questionnaire and Appendix II –
Customer Questionnaire.
RESULTS
General Observations:
Many things became evident during this 4‐month period of talking to fish buyers and sellers. First,
the live fish market is strong. Most of the customers purchasing live fish come from a broad
spectrum of economic background. Second, it appears culture plays an important role in the live
fish market. Customers come from diverse backgrounds, but majority of the customers are Asians.
Some customers appear to have been raised with purchasing live seafood, especially customers
from south Asia, while others appear to have traditional habits associated with purchasing live
seafood. It seemed that, consumers consider habits and traditions first before price when
purchasing live fish and some are willing to pay premiums for live fish. Third, most Asian
customers appear to make all their grocery purchases in the ethnic stores, which could be related
to the culture and language. In some areas such as Chicago’s China town, almost all Asian
customers used their native language to communicate with shop assistants. Rarely could one find
anyone communicating in English in those locations.
Finally, the market for live fish appears to be very competitive particularly in Chicago, as many
managers were unwilling to share much information about their activities. Overall, a large number
of fish species were observed in stores but the selection varied among the stores. Low valued fish
species are common in store locations that service Southeast Asian clientele. Stores that services
ethnic groups from the far‐East had a range of low to high value fish species. Some stores that did
not handle live fish sold dressed‐out fish, mainly from the wild or farmed fish processed in store.
Some of these managers expressed willingness to purchase fresh‐on‐ice fish.
Managers’ Results:
The raw data of responses to the manager survey is presented in Appendix III. Ninety‐four (94%)
percent of the managers surveyed indicated their store was not part of a chain, implying that they
were all independent store units. However, we found a store manager who also owned stores in
Cleveland, Columbus and Cincinnati, Ohio. A few managers in Chicago also owned 2 stores in the
Chicago area, and serviced different clientele. Most stores were quite new at selling live
fish/shellfish as more than half of them had less than 6 years experience. Specifically, 9 managers
indicated their store had at most 5 years experience selling live fish/shellfish, 5 managers from 6 –
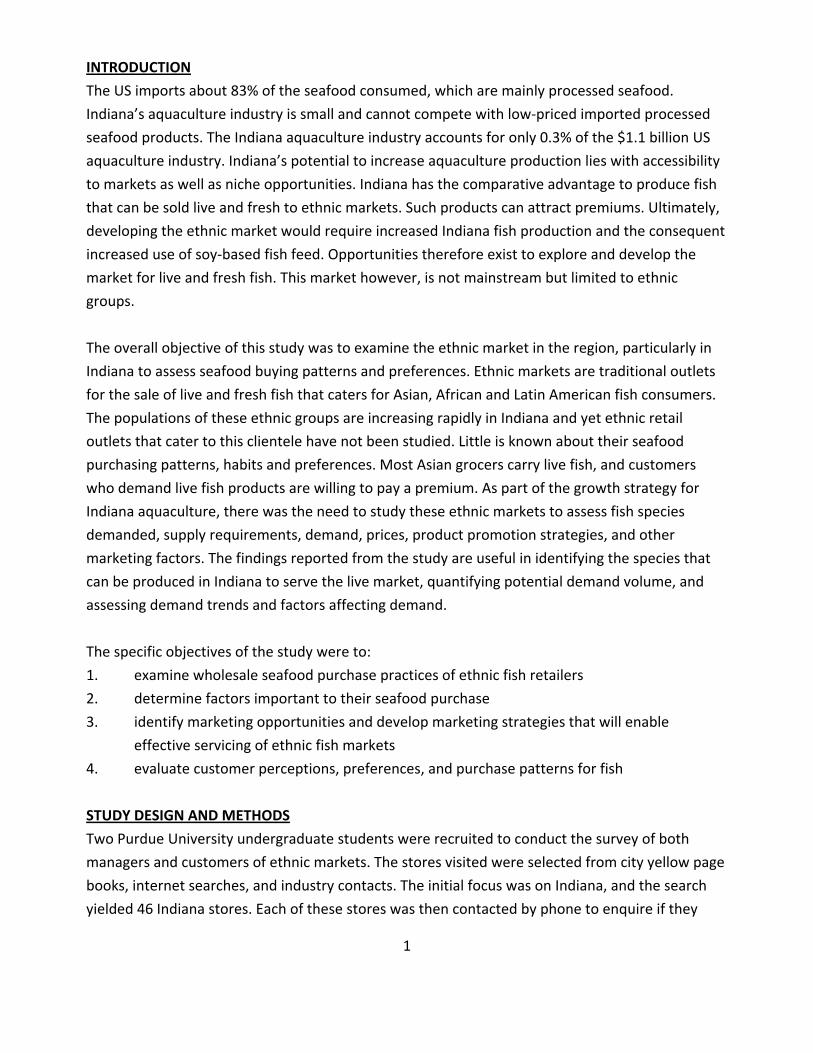
10 years and only 1 manager had over 10 years experience. Regarding species of fish and shellfish
sold, there was a variety of up to 20 fish/shellfish sold by the managers. Figure 1 shows that the
top fish/shellfish sold was tilapia followed by catfish and bass. Combined, they accounted for
nearly 40% of the top fish/shellfish sold. All the stores visited sold live tilapia. Some managers
indicated customers wanted crappie, shrimp and crab, but there is inadequate supply of these
species. Managers were asked about fish processing. In response, 8 managers indicated they
purchased their fish live and processed in the store while 6 managers indicated they purchased
live and sold live without any processing. However, 7 managers indicated both methods of
processing fish were used.
11
6 6
5 5
4
3
2 2 2 2
1 1 1 1 1 1 1 1 1 1
0
2
4
6
8
10
12
No. of respo
nses
Type of fish/shellfish
Figure 1: Top species of fish/shellfish sold
3
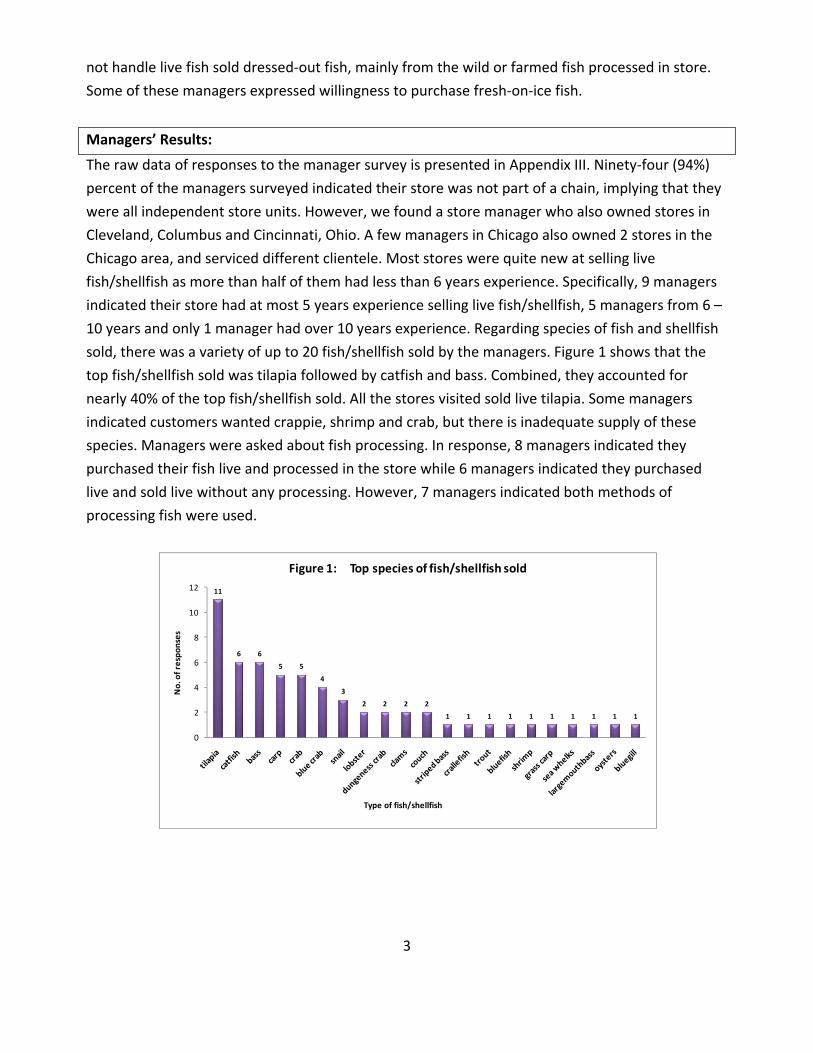
In regards to the
amount of fish/shellfish
sold weekly, 4 managers
indicated that they sold
between 101 to 250 lbs
of fish/shellfish per
week, 3 stores sold up
to 100 lbs, another 3
stores sold over 500 lbs,
and only 2 sold 251 to
500 lbs per week (Figure
2). Sale of fish appeared
to be throughout the
year without any significant differences in fish sales during the different seasons as indicated by
the managers. About 29% of managers indicated they sold most live fish in the winter, 26% in the
summer, 24% in the fall and 21% of the managers indicated they sold most of the fish in the
spring.
3
4
2
3
00.51
1.52
2.53
3.54
4.5
Up to 100 101 lb to 250 251 to 500 over 500No. of responses
lbs
Figure 2: Quantity of Fish/Shellfish sold per week
In‐state23%
Out‐of‐state46%
Both31%
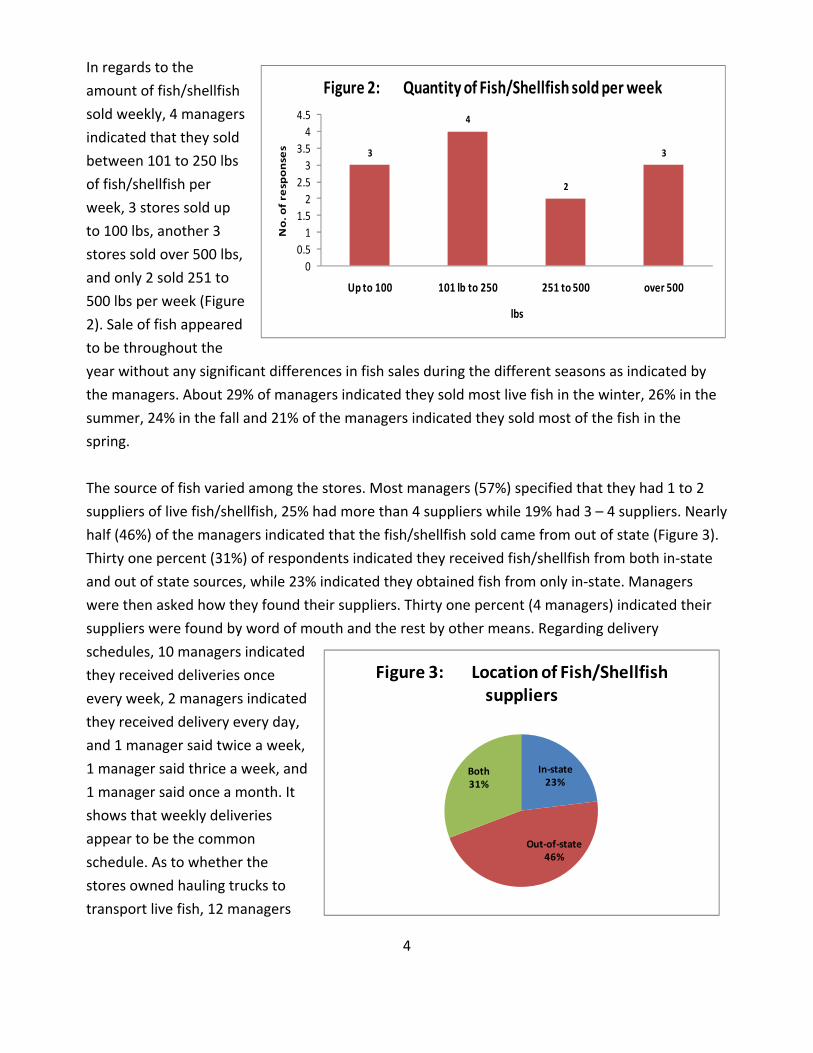
Figure 3: Location of Fish/Shellfish suppliers
The source of fish varied among the stores. Most managers (57%) specified that they had 1 to 2
suppliers of live fish/shellfish, 25% had more than 4 suppliers while 19% had 3 – 4 suppliers. Nearly
half (46%) of the managers indicated that the fish/shellfish sold came from out of state (Figure 3).
Thirty one percent (31%) of respondents indicated they received fish/shellfish from both in‐state
and out of state sources, while 23% indicated they obtained fish from only in‐state. Managers
were then asked how they found their suppliers. Thirty one percent (4 managers) indicated their
suppliers were found by word of mouth and the rest by other means. Regarding delivery
schedules, 10 managers indicated
they received deliveries once
every week, 2 managers indicated
they received delivery every day,
and 1 manager said twice a week,
1 manager said thrice a week, and
1 manager said once a month. It
shows that weekly deliveries
appear to be the common
schedule. As to whether the
stores owned hauling trucks to
transport live fish, 12 managers
4

indicated they did not own trucks while 4 indicated they owned trucks and hauled some of their
fish from their suppliers.
One major focus of this study was to assess the important factors managers consider when
purchasing live fish. The most important factors when purchasing live fish as indicated by
managers were overall quality, supply consistency, freshness, size, survival and price (Figure 4).
Most managers did not consider origin as important. Managers were asked if they would purchase
fish/shellfish from Indiana if assured of quality and availability. To this, all the respondents
responded “yes” to tilapia. Many also responded “yes” to largemouth bass and hybrid striped
bass. Over half of them responded negatively towards purchasing of trout and carp from Indiana.
Regarding the demographic factors of their clientele, most managers indicated that customers
who bought live fish/shellfish were Asians, followed by Africans, Hispanic and then Caucasians.
0
2
4
6
8
10
12
14
16
Price Supply consistency
Freshness Origin Customer demand
Overall quality
Size Longer survival
no. of respo
nses
Figure 4: Importance of selected factors when purchasing Fish/Shellfish
Very Important Somewhat Important Not Important
We also examined the relationship between the quantity of fish sold per week and some selected
responses. In the summer, 2 stores sold up to 100lbs, 3 stores sold 101 to 250lbs, 1 store sold 251
to 500lbs and 1 store sold over 500lbs. In the winter, 1 store sold up to 100lbs, 3 stores sold 101 to
250lbs, 2 stores sold 251 to 500lbs and 3 stores sold over 500lbs. The stores that sold the most fish
were those that purchased live and then sold them live. For example, 3 stores that purchase live
fish and sold them live in store sold up to 100lbs, 4 stores sold 101 to 250lbs, 2 stores sold 251 to
500lbs and 2 stores sold over 500 lbs. Those who had the least number of suppliers sold the most
fish. According to the data 3 stores with 1‐2 suppliers sold up to 100lbs, 3 stores sold 101 to 250lbs
and 2 stores sold over 500lbs per week. Most stores received fish once per week.
5

0
2
4
6
8
10
12
14
16
hybrid striped bass largemouth bass tilapia bluegill trout carp
No. of respo
nses
Type of fish/shellfish
Figure 5: Type of fish managers will purchase if available
no
yes
The most important factors to managers when purchasing live fish were supply consistency and
overall quality. The results show that these respondents sold the most fish. For example, one
manager who felt that supply consistency was very important when purchasing live fish indicated
selling up to 100lbs per week, 4 managers indicated selling 101 to 250lbs per week, 2 managers
sold 251 to 500lbs per week and 2 managers sold over 500lbs per week. Two managers who felt
that the overall quality was very important sold up to 100lbs per week, 3 managers indicated
selling 101 to 250lbs, 2 managers sold 251 to 500lbs and 3 managers sold over 500lbs per week.
Interestingly, the managers who indicated that factors such as supply consistency, freshness and
longer survival were not important sold less than 251lbs per week. One manager who felt that
supply consistency was not important sold up to 100lbs per week. One manager who also felt that
freshness was not important sold 101 to 250lbs per week and one manager who indicated that
longer survival was not important sold up to 100lbs per week. There is a weak relationship
between race and live fish sales.
The results show that two managers who indicated Africans as their main customers sold 101 to
250lbs per week, one sold 251 to 500lbs per week and two sold over 500lbs week. Managers who
indicated Hispanic customers as the main clientele also sold up to 100lbs, 1 store sold 101 to
250lbs and 1 store sold over 500lbs. If assured of availability and quality of live fish from Indiana,
most of the managers indicated that they would purchase tilapia, hybrid‐striped bass and
largemouth bass.
6

Customers’ Results:
The raw data of responses to the customer survey is presented in Appendix IV. A total of 363
customers who shopped at the ethnic markets were surveyed. Of this number, 44% were females
and 46% were males. Forty‐six percent (46%) of the respondents are from 36 to 50 years in age,
36% from 21 to 35, 13% from 51 to 65, and 5% over 65. More than half of the customers had a
household size of 3 to 5 persons. Thirty‐two percent (31%) had up to 2 individuals in their
household, 9% had 6 to 8 and less than 1% had more than 8 persons. The data shows that over
80% of the respondents had a level of education above high school. More specifically, 41% had a
college education and 41% had a post graduate level of education.
7
7.8%
30.6%
54.2%
6.4%
1.1%
0.0%
10.0%
20.0%
30.0%
40.0%
50.0%
60.0%
Africa North America Asia Latin America and Caribbean
Europe
% re
spon
ses
Region
Figure 6: Native Region of customers
15.9%
31.2%
28.9%
14.5%
6.6%
2.9%
0.0%
5.0%
10.0%
15.0%
20.0%
25.0%
30.0%
35.0%
$30K and below $31K ‐$60K $61K ‐ $100K $101K ‐$150K $151K ‐$200K $201K and above
% re
spon
ses
Income ($)
Figure 7: Household Income level of customers
Customers
intercepted at the
stores came from
different countries,
i.e., 29 countries on 5
major regions of the
world were
represented in the
survey (Figure 6).
Some of the Asian
countries included
China, Taiwan,
Vietnam, Burma
and Philippines.
Majority (54%) of
the respondents
were from Asia,
31% were from
North America, 8%
were from Africa,
6% were from Latin
America/Caribbean
and 1% was from
Europe. The
household income range of most respondents was $31,000‐$60,000 per annum (Figure 7). A good
proportion of customers also made between 61,000‐100,000 dollars. Very few people made more
than $150,000.
0
50
100
150
200
250
300
350
Spring Summer Fall Winter
No. of respo
nses
Season
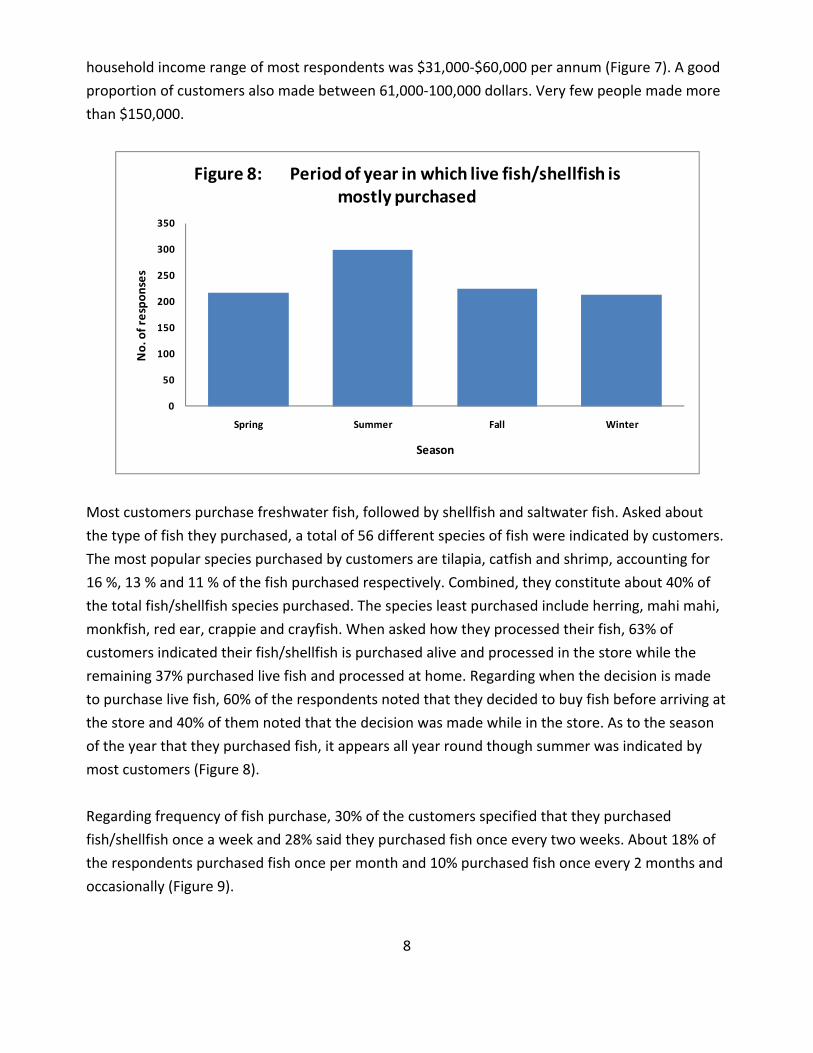
Figure 8: Period of year in which live fish/shellfish is mostly purchased
Most customers purchase freshwater fish, followed by shellfish and saltwater fish. Asked about
the type of fish they purchased, a total of 56 different species of fish were indicated by customers.
The most popular species purchased by customers are tilapia, catfish and shrimp, accounting for
16 %, 13 % and 11 % of the fish purchased respectively. Combined, they constitute about 40% of
the total fish/shellfish species purchased. The species least purchased include herring, mahi mahi,
monkfish, red ear, crappie and crayfish. When asked how they processed their fish, 63% of
customers indicated their fish/shellfish is purchased alive and processed in the store while the
remaining 37% purchased live fish and processed at home. Regarding when the decision is made
to purchase live fish, 60% of the respondents noted that they decided to buy fish before arriving at
the store and 40% of them noted that the decision was made while in the store. As to the season
of the year that they purchased fish, it appears all year round though summer was indicated by
most customers (Figure 8).
Regarding frequency of fish purchase, 30% of the customers specified that they purchased
fish/shellfish once a week and 28% said they purchased fish once every two weeks. About 18% of
the respondents purchased fish once per month and 10% purchased fish once every 2 months and
occasionally (Figure 9).
8

0.0%
5.0%
10.0%
15.0%
20.0%
25.0%
30.0%
35.0%
More than once every week
Once every week Once every 2 weeks Once every month Once every 2 months Occasionally
% re
spon
ses
Time
Figure 9: How often fish/shellfish is purchased
57.5%
23.0%
8.5%5.8% 5.2%
0.0%
10.0%
20.0%
30.0%
40.0%
50.0%
60.0%
70.0%
0 to 5lb 6 to 10lb 11 to 15lb 16 to 20lb over 21lb
% re
spon
ses
Quantity (lbs)
Figure 10: Average quantity of fish purchased
Almost 80 % of the customers buy less than 11 pounds of fish per visit (Figure 10). About 56 % of
the customers buy less than 6 pounds, 23 % buy 6 to 10 pounds, 8 % buy 11 to 15 pounds, 6 % buy
16 to 20 pounds and 5 % buy over 21 pounds of fish per visit. The least amount of fish purchased
was half a pound and the most purchased was 100 pounds per visit. The most frequent amount of
fish purchased was 5 pounds, which was around 16 % of the quantity purchased. In terms of the
value of fish purchase per visit, 23% of the customers indicated that they spent up to $10 per store
visit, while half
(50%) of customers
noted that they
spent an average of
$11 to $20 per visit.
Twenty‐seven
percent (27%) of the
customers spent
more than $20 on
fish/shellfish (Figure
11).
9

23%
50%
17%
10%
Figure 11: Average amount of money spent per visit on fish/shellfish
up to $10
$11‐$20
$21‐$30
more than $30
A number of customers traveled a relatively short distance to purchase live fish/shellfish.
Approximately 62 % of customers travelled less than 10 miles. The most frequent number of miles
travelled were 5, 10, 15 and 20 which were 13%, 14%, 9% and 12% respectfully.
0
50
100
150
200
250
Freshness Healthier Assurance of quality
Tradition Other
No. of respo
nses
Figure 12: Reasons for purchasing live fish/shellfish
Customers purchased live fish for a number of reasons. Freshness was the major reason indicated
by most customers
(Figure 12). A good
percentage of
customers also buy fish
because of health
purposes. Very few
people purchased fish
for traditional reasons.
Other reasons that
played a part in fish
purchase include
personal preference,
taste and the ease of
cooking. Regarding the
factors they consider
when purchasing fish, the most important factors appeared to be the appearance of the fish and
the water quality in the tank (Figure 13). Almost 80% of the respondents specified that the
10

appearance of the fish was very important, and about 70% indicated that the water quality in the
display tank was very important. The price and size were also indicated as important and
somewhat important. The origin of the fish was the least important factor to the customers. Of
importance to this study was to assess how customers will respond to fish grown in Indiana. A
large number of respondents indicated that they would buy tilapia from Indiana if quality and
availability were assured (Figure 14). Other notable species that would be purchased were hybrid
striped bass, trout and largemouth bass. The least preferred fishes appear to be carp and bluegill.
0
50
100
150
200
250
300
350
Price Appearance Origin Water quality in display tank
Size
No. of respo
nses
Factors
Figure 13: Importance of selected factors when purchasing live fish/shellfish
Very Important Somewhat Important Not Important
We also examined the relationship between the quantity of fish purchased per week and some selected variables. Most customers purchased 10lbs or less of live fish/shellfish. These customers frequently purchased fish/shellfish weekly or biweekly and spent less than $21 per visit. They also travelled less than 20 miles to purchase fish. There were some customers though who spent up to $30 per visit. Most of the respondents decided to buy fish before arriving at the store. However, most customers who purchased up to 2lbs per visit tend to decide to purchase fish while in the store. There was no noticeable relationship between the amount of fish purchased or money spent per visit, and the preferred Indiana fish customers will buy if availability and quality were assured. The customers who purchased 10lbs of fish/shellfish or less mostly had an income level of less than $100,000. Despite the quantity of fish purchased, data showed that customers generally bought fish mostly in the summer. However, the data shows that customers who purchased 5lbs or less of fish per month generally purchased fish in the summer. Those who purchased fish in the fall mostly purchased less than 10lbs. Overall, customers placed a low value on the assurance of
11

quality as a reason for purchasing fish. Those who purchased more than 10lbs (12‐48lbs) of fish and those who spent $11‐20, appeared to place a high value on health as a reason for purchasing. Regardless of the amount purchased, freshness was an important reason. Despite the quantity and frequency of fish/shellfish purchased, price, appearance and water quality were important. Customers who felt that the aforementioned factors were important, tend to purchase and process their live fish/shellfish in the store. These same customers mostly purchased fish once per week and once every 2 weeks.
0
50
100
150
200
250
300
Hybrid striped bass Largemouth bass Tilapia Bluegill Trout Carp
No. of respo
nses
Type of fish
Figure 14: Preferred fish to buy locally if availability and quality assured
Yes No
12
13
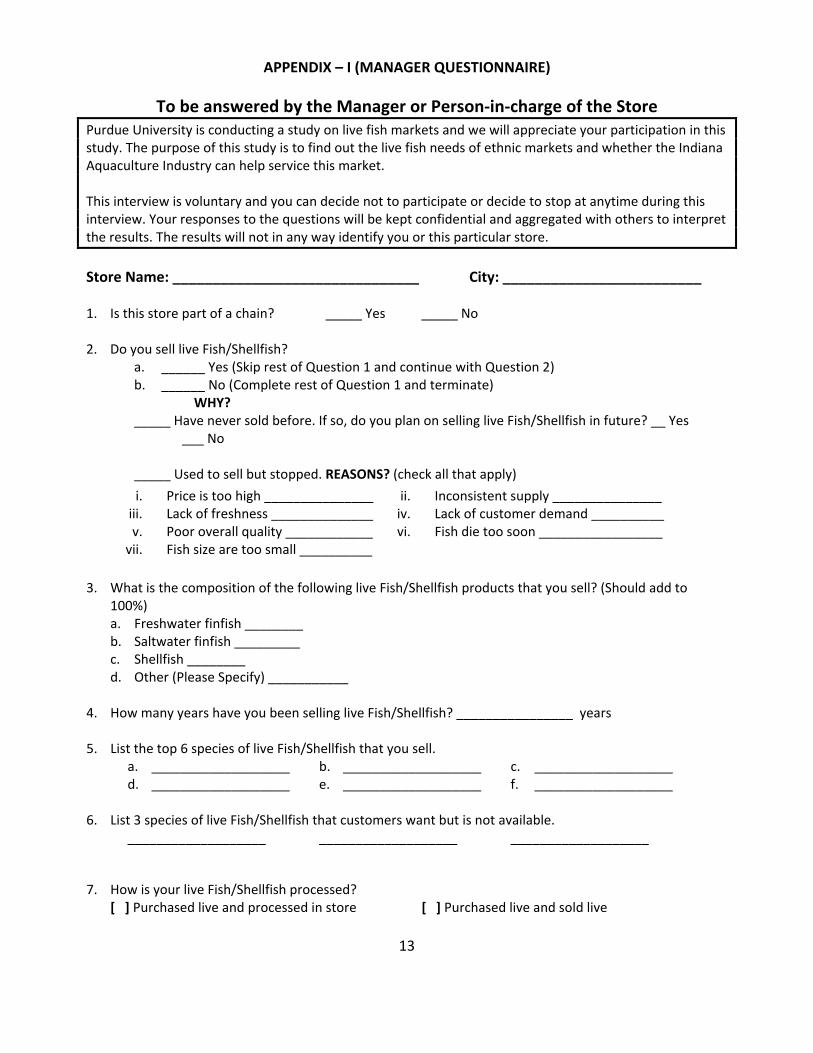
APPENDIX – I (MANAGER QUESTIONNAIRE)
To be answered by the Manager or Person‐in‐charge of the Store Purdue University is conducting a study on live fish markets and we will appreciate your participation in this study. The purpose of this study is to find out the live fish needs of ethnic markets and whether the Indiana Aquaculture Industry can help service this market. This interview is voluntary and you can decide not to participate or decide to stop at anytime during this interview. Your responses to the questions will be kept confidential and aggregated with others to interpret the results. The results will not in any way identify you or this particular store.
Store Name: _______________________________ City: _________________________ 1. Is this store part of a chain? _____ Yes _____ No 2. Do you sell live Fish/Shellfish?
a. ______ Yes (Skip rest of Question 1 and continue with Question 2) b. ______ No (Complete rest of Question 1 and terminate)
WHY? _____ Have never sold before. If so, do you plan on selling live Fish/Shellfish in future? __ Yes ___ No
_____ Used to sell but stopped. REASONS? (check all that apply)
i. Price is too high _______________ ii. Inconsistent supply _______________ iii. Lack of freshness ______________ iv. Lack of customer demand __________ v. Poor overall quality ____________ vi. Fish die too soon _________________ vii. Fish size are too small __________
3. What is the composition of the following live Fish/Shellfish products that you sell? (Should add to
100%) a. Freshwater finfish ________ b. Saltwater finfish _________ c. Shellfish ________ d. Other (Please Specify) ___________
4. How many years have you been selling live Fish/Shellfish? ________________ years 5. List the top 6 species of live Fish/Shellfish that you sell.
a. ___________________ b. ___________________ c. ___________________ d. ___________________ e. ___________________ f. ___________________
6. List 3 species of live Fish/Shellfish that customers want but is not available.
___________________ ___________________ ___________________
7. How is your live Fish/Shellfish processed?
[ ] Purchased live and processed in store [ ] Purchased live and sold live

14
8. What quantity of live Fish/Shellfish do you sell per week? [ ] Up to 100lb [ ] 101lb to 250lb [ ] 251lb to 500lb [ ] Over 500lb
9. What period of the year do you sell live fish the most?
[ ] Spring [ ] Summer [ ] Fall [ ] Winter 10. How many suppliers of live Fish/Shellfish do you have?
[ ] 1‐2 [ ] 3‐4 [ ] more than 4 11. Do you own a hauling truck for transporting live Fish/Shellfish yourself? ___ Yes ___ No 12. Where do your suppliers of live Fish/Shellfish come from?
[ ] In‐state [ ] Out‐of‐state [ ] Both [ ] Other __________ 13. How often do you receive live Fish/Shellfish (delivery schedule)?
_____ X every week _____ X every month _____ Occasionally 14. How did you find out about your suppliers of live Fish/Shellfish?
[ ] Word of mouth [ ] Newspaper [ ] Grocer Association Directory [ ] Website [ ] Other ________________
15. How important are these factors to you when purchasing live fish? (check one)
Very Important Somewhat Important Not Important a. Price b. Supply consistency c. Freshness d. Origin e. Customer demand f. Overall quality g. Size h. Longer survival
16. Who are your main Fish/Shellfish customers?
[ ] Asian [ ] African [ ] White [ ] Hispanic [ ] Other ________________ 17. If you were assured of availability and quality of the following species from Indiana, which of these live
fish would you buy? (check one) Yes No
a. Hybrid Striped Bass b. Largemouth Bass c. Tilapia d. Bluegill e. Trout f. Carp
THANK YOU FOR YOUR TIME AND PARTICIPATION
15
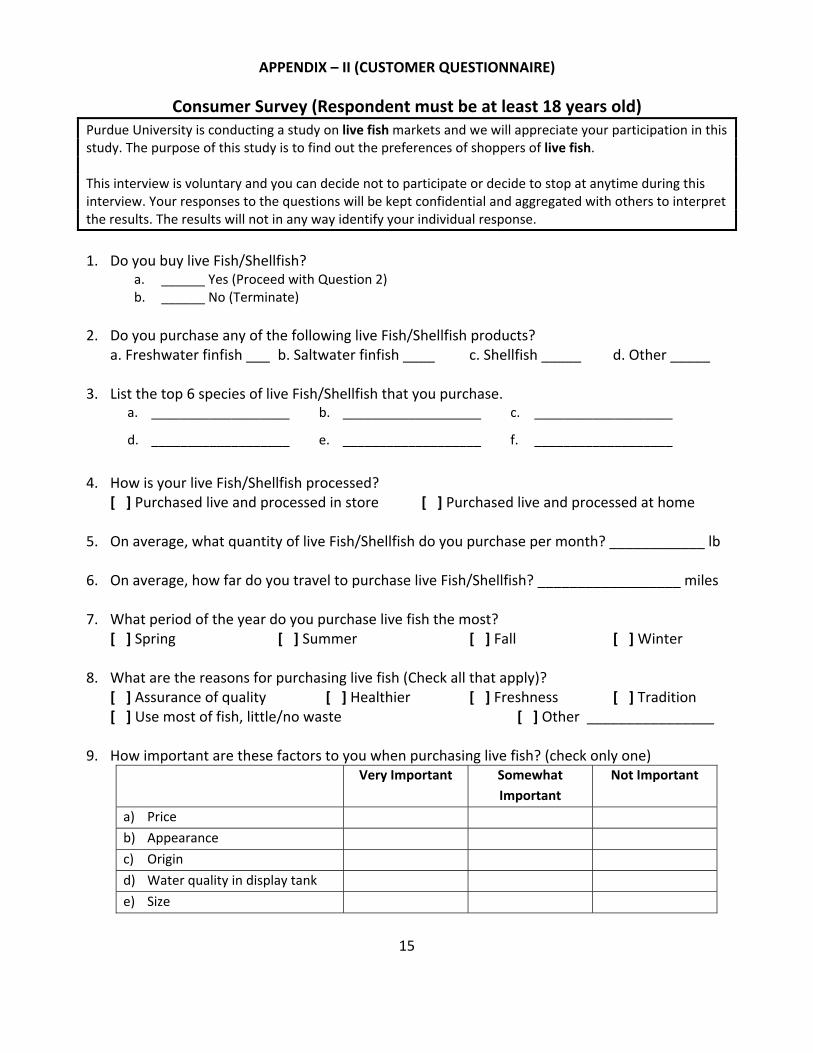
APPENDIX – II (CUSTOMER QUESTIONNAIRE)
Consumer Survey (Respondent must be at least 18 years old) Purdue University is conducting a study on live fish markets and we will appreciate your participation in this study. The purpose of this study is to find out the preferences of shoppers of live fish. This interview is voluntary and you can decide not to participate or decide to stop at anytime during this interview. Your responses to the questions will be kept confidential and aggregated with others to interpret the results. The results will not in any way identify your individual response.
1. Do you buy live Fish/Shellfish?
a. ______ Yes (Proceed with Question 2) b. ______ No (Terminate)
2. Do you purchase any of the following live Fish/Shellfish products?
a. Freshwater finfish ___ b. Saltwater finfish ____ c. Shellfish _____ d. Other _____ 3. List the top 6 species of live Fish/Shellfish that you purchase.
a. ___________________ b. ___________________ c. ___________________
d. ___________________ e. ___________________ f. ___________________
4. How is your live Fish/Shellfish processed?
[ ] Purchased live and processed in store [ ] Purchased live and processed at home 5. On average, what quantity of live Fish/Shellfish do you purchase per month? ____________ lb 6. On average, how far do you travel to purchase live Fish/Shellfish? __________________ miles 7. What period of the year do you purchase live fish the most?
[ ] Spring [ ] Summer [ ] Fall [ ] Winter 8. What are the reasons for purchasing live fish (Check all that apply)?
[ ] Assurance of quality [ ] Healthier [ ] Freshness [ ] Tradition [ ] Use most of fish, little/no waste [ ] Other ________________
9. How important are these factors to you when purchasing live fish? (check only one)
Very Important Somewhat Important
Not Important
a) Price
b) Appearance
c) Origin
d) Water quality in display tank
e) Size

16
10. How often do you purchase live Fish/Shellfish?
[ ] More than once every week [ ] Once every week [ ] Once every 2 weeks [ ] Once every month [ ] Once every 2 month [ ] Occasionally
11. On average, how much do you spend on live Fish/Shellfish per visit?
[ ] Up to $10 [ ] $11‐$20 [ ] $21‐$30 [ ] More than $30 12. When do you decide to purchase live Fish/Shellfish?
[ ] Before arriving at the store [ ] While in the store 13. If you were assured of availability and quality of the following species from Indiana, which of
these live fish would you buy? Yes No
a. Hybrid Striped Bass
b. Largemouth Bass
c. Tilapia
d. Bluegill
e. Trout
f. Carp
14. What is the size of your household? _______ 15. Gender _______Male _______ Female 16. What is your native country? _________________ 17. What is your level of education?
Some High School _______________ High School _______________ College _______________ Post graduate _________________
18. What is your age?
[ ] 20 years or less [ ] 21 ‐ 35 years [ ] 36 – 50 years [ ] 51 – 65 years [ ] 66 year and above
19. What is your total household income?
[ ] $30,000 and below [ ] $31,000 ‐ $60,000 [ ] $61,000 – $100,000 [ ] $101,000 – $150,000 [ ] $151,000 ‐ $200,000 [ ] $201,000 and above
THANK YOU FOR YOUR TIME AND PARTICIPATION

17
Appendix III: Responses to Manager Survey (Appendix I) Question 1: Is this store part of a chain? _____ Yes _____ No
no. of responses yes 1 no 15
Question 2: Do you sell live fish/shellfish? _____ Yes ____ No
no. of responses yes 16 no 0
Question 3: (No Response) Question 4: How many years have you been selling fish/shellfish?
Years 0-5 yrs 6-10 yrs 11-15 yrs no. of people 9 5 1
Question 5: List the top species of live fish/shellfish that you sell.
Type of fish No. of
fish/shellfish Percentage tilapia 11 19.0% catfish 6 10.3% bass 6 10.3% carp 5 8.6% crab 5 8.6% blue crab 4 6.9% snail 3 5.2% lobster 2 3.4% dungeness crab 2 3.4% clams 2 3.4% couch 2 3.4% striped bass 1 1.7% crallefish 1 1.7% trout 1 1.7% bluefish 1 1.7% shrimp 1 1.7% grass carp 1 1.7% sea whelks 1 1.7% largemouthbass 1 1.7% oysters 1 1.7% bluegill 1 1.7% N=16 Total=58

18
Question 6: List 3 species of live fish/shellfish that customers want but are not available. Type of fish/shellfish no. of responses shrimp 1 crab 1 crappie 2
Question 7: How is your live fish/shellfish processed?
How fish is processed no. of responses Purchased Live and processed in store 8 Purchased live and sold live 6 Both 7
Question 8: What quantity of fish do you sell per week?
Quantity of fish/shellfish sold no. of responses up to 100 3 101 lb to 250 4 251 to 500 2 over 500 3
Question 9: What period of year do you sell live fish the most?
Period of year fish is sold no. of responses Spring 7 Summer 9 Fall 8 Winter 10 N=15
Question 10: How many suppliers of fish/shellfish do you have?
No. of suppliers no. of responses 1 to 2 9 3 to 4 3 more than 4 4
Question 11: Do you own a hauling truck for transporting live fish/shellfish yourself?
Yes 4 no 12
Question 12: Where do your suppliers of live fish/shellfish come from?
In-state 3 Out-of-state 6 Both 4
19
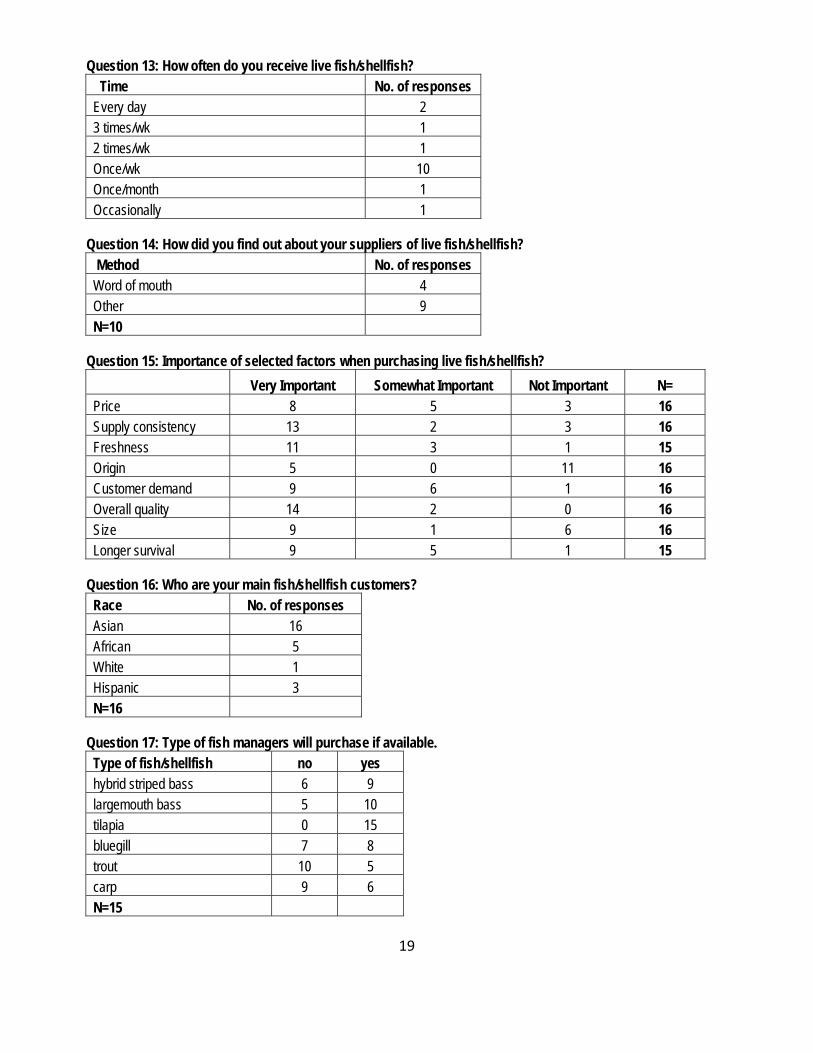
Question 13: How often do you receive live fish/shellfish? Time No. of responses Every day 2 3 times/wk 1 2 times/wk 1 Once/wk 10 Once/month 1 Occasionally 1
Question 14: How did you find out about your suppliers of live fish/shellfish?
Method No. of responses Word of mouth 4 Other 9 N=10
Question 15: Importance of selected factors when purchasing live fish/shellfish?
Very Important Somewhat Important Not Important N= Price 8 5 3 16 Supply consistency 13 2 3 16 Freshness 11 3 1 15 Origin 5 0 11 16 Customer demand 9 6 1 16 Overall quality 14 2 0 16 Size 9 1 6 16 Longer survival 9 5 1 15
Question 16: Who are your main fish/shellfish customers?
Race No. of responses Asian 16 African 5 White 1 Hispanic 3 N=16
Question 17: Type of fish managers will purchase if available.
Type of fish/shellfish no yes hybrid striped bass 6 9 largemouth bass 5 10 tilapia 0 15 bluegill 7 8 trout 10 5 carp 9 6 N=15
20
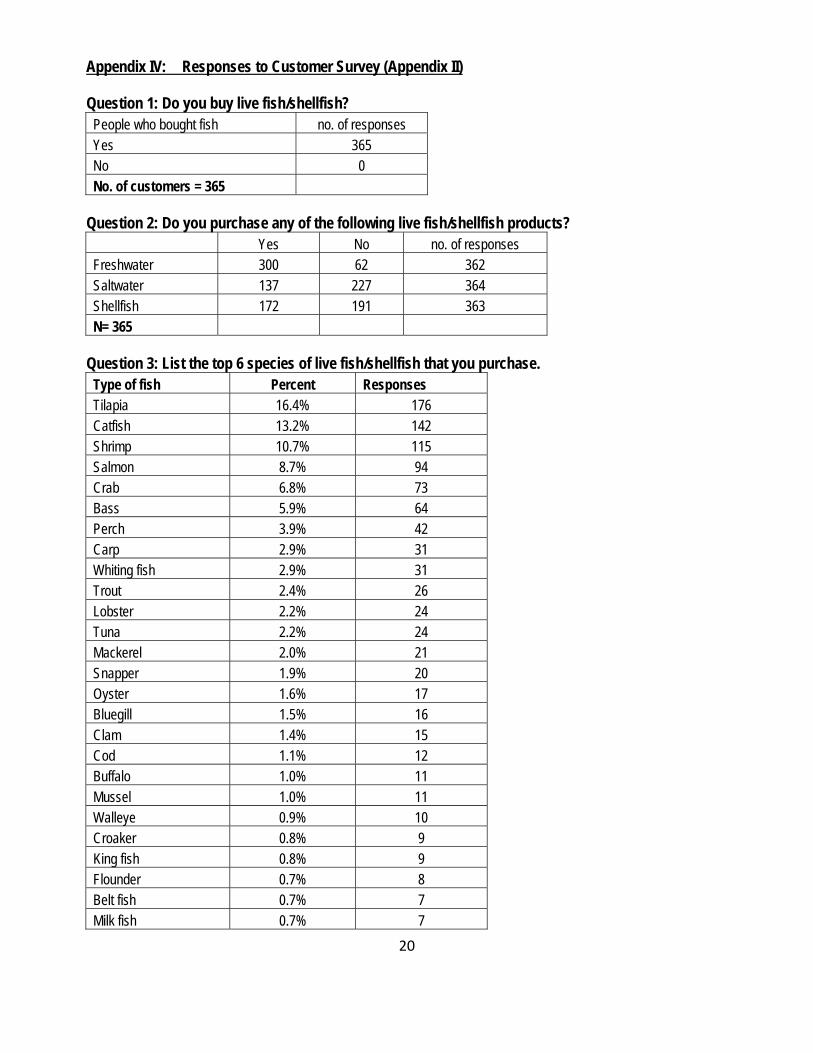
Appendix IV: Responses to Customer Survey (Appendix II) Question 1: Do you buy live fish/shellfish?
People who bought fish no. of responses Yes 365 No 0 No. of customers = 365
Question 2: Do you purchase any of the following live fish/shellfish products?
Yes No no. of responses Freshwater 300 62 362 Saltwater 137 227 364 Shellfish 172 191 363 N= 365
Question 3: List the top 6 species of live fish/shellfish that you purchase.
Type of fish Percent Responses Tilapia 16.4% 176 Catfish 13.2% 142 Shrimp 10.7% 115 Salmon 8.7% 94 Crab 6.8% 73 Bass 5.9% 64 Perch 3.9% 42 Carp 2.9% 31 Whiting fish 2.9% 31 Trout 2.4% 26 Lobster 2.2% 24 Tuna 2.2% 24 Mackerel 2.0% 21 Snapper 1.9% 20 Oyster 1.6% 17 Bluegill 1.5% 16 Clam 1.4% 15 Cod 1.1% 12 Buffalo 1.0% 11 Mussel 1.0% 11 Walleye 0.9% 10 Croaker 0.8% 9 King fish 0.8% 9 Flounder 0.7% 8 Belt fish 0.7% 7 Milk fish 0.7% 7

21
Pomfret 0.5% 5 Grouper 0.4% 4 Halibut 0.4% 4 Sardine 0.4% 4 Scallops 0.4% 4 Sword fish 0.4% 4 Asian 0.3% 3 Eel 0.3% 3 Blue fish 0.2% 2 Butter fish 0.2% 2 Octopus 0.2% 2 Orange roughy 0.2% 2 Snail 0.2% 2 Squid 0.2% 2 Sunfish 0.2% 2 Yellow fish 0.2% 2 Camaron 0.1% 1 Crayfish 0.1% 1 Crappie 0.1% 1 Gorden 0.1% 1 Herring 0.1% 1 Hokke 0.1% 1 Mahi mahi 0.1% 1 Monk fish 0.1% 1 Puppy drum 0.1% 1 Red ear 0.1% 1 Sea cucumber 0.1% 1 Shark 0.1% 1 Skates 0.1% 1 Spot 0.1% 1 N = 364
Question 4: How is your live fish/shellfish processed?
How fish is processed No. of responses
Purchased Live and processed in store 226
Purchased live and processed at home 134 N=360
Question 5: What quantity of fish/shellfish do you purchase per month?
Average quantity of fish purchased Percentage no. of responses 0 to 5 57.5% 210
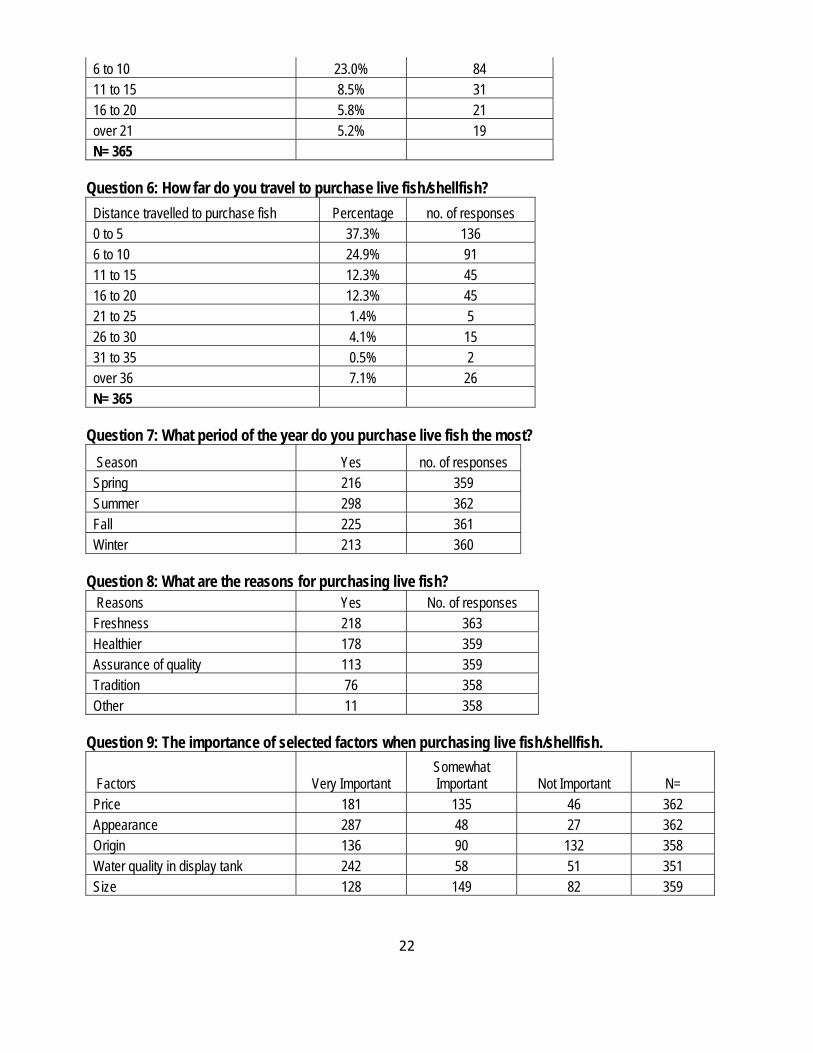
22
6 to 10 23.0% 84 11 to 15 8.5% 31 16 to 20 5.8% 21 over 21 5.2% 19 N= 365
Question 6: How far do you travel to purchase live fish/shellfish?
Distance travelled to purchase fish Percentage no. of responses 0 to 5 37.3% 136 6 to 10 24.9% 91 11 to 15 12.3% 45 16 to 20 12.3% 45 21 to 25 1.4% 5 26 to 30 4.1% 15 31 to 35 0.5% 2 over 36 7.1% 26 N= 365
Question 7: What period of the year do you purchase live fish the most?
Season Yes no. of responses Spring 216 359 Summer 298 362 Fall 225 361 Winter 213 360
Question 8: What are the reasons for purchasing live fish?
Reasons Yes No. of responses Freshness 218 363 Healthier 178 359 Assurance of quality 113 359 Tradition 76 358 Other 11 358
Question 9: The importance of selected factors when purchasing live fish/shellfish.
Factors Very Important Somewhat Important Not Important N=
Price 181 135 46 362 Appearance 287 48 27 362 Origin 136 90 132 358 Water quality in display tank 242 58 51 351 Size 128 149 82 359

23
Question 10: How often do you purchase live fish/shellfish? Time Percentage No. of responses More than once every week 9.9% 36 Once every week 29.9% 109 Once every 2 weeks 27.7% 101 Once every month 17.8% 65 Once every 2 months 3.6% 13 Occasionally 10.4% 38 N=365
Question 11: How much do you spend on live fish/shellfish per visit?
Money spent on live fish/shellfish per visit Percentage No. of responses up to $10 22.6% 82 $11-$20 50.1% 182 $21-$30 17.1% 62 more than $30 10.2% 37 N=363
Question 12: When do you decide to purchase live fish/shellfish?
Timing of decision to buy fish No. of responses Before arriving at the store 213 While in the store 141 N= 354
Question 13: Preferred fish to buy locally if availability and quality assurance were given.
Type of fish Yes No No. of responses Hybrid striped bass 142 219 363 Largemouth bass 131 230 363 Tilapia 267 98 365 Bluegill 97 265 363 Trout 150 214 364 Carp 75 284 359
Question 14: What is the size of your household?
No. of people Percentage No. of responses 0 to 2 32.1% 117 3 to 5 58.4% 213 6 to 8 8.8% 32 9 to 11 0.3% 1 more than 12 0.5% 2 N=365

24
Question 15: What is your gender? Gender No. of responses Male 166 Female 197
Question 16: What is your native country?
Region Percentage No. of responses Africa 7.8% 28 North America 30.6% 110 Asia 54.2% 195 Latin America and Caribbean 6.4% 23 Europe 1.1% 4 N=360
Question 17: What is your level of education?
Level of education Percentage No. of responses Some high school 3.6% 13 High school 14.0% 50 College 41.6% 149 Post graduate 40.8% 146 N=358
Question 18: What is your age?
Age No. of responses 20 years or less 3 21-35 127 36-50 165 51-65 47 66 and above 19 N=361
Question 19: What is your total household income?
Household Income Percentage No. of responses 30,000 and below 15.9% 55 31,000-60,000 31.2% 108 61,000-100,000 28.9% 100 101,000-150,000 14.5% 50 151,000-200,000 6.6% 23 201,000 and above 2.9% 10 N=346