financial report 2019 completbank islami pakistan limited the bank of khyber askari bank islamic...
TRANSCRIPT
2 0 1 9
Vision and MissionCode of Ethics and Business PracticesCompany InformationChairman�s Review ReportDirector � ReportSix Years at GlanceCorporate GovernanceStatement of Compliance with Best Practices ofCode of Corporate GovernanceShariah Compliance Review ReportPattern of Share HoldingNotice of Annual General MeetingIndependent Auditor's ReportReview Report of Code of Corporate GovernanceAssurance Report on Shariah ComplianceStatement of Financial PositionStatement of Profit or LossStatement of Comprehensive IncomeStatement of Cash FlowsStatement of Changes in EquityNotes to the Financial StatementForm of ProxyDividend Mandate FormCirculation of Annual Audited Accounts
s
04050607081921
2224272934383941434445474897100101
Contents

FINANCIAL
PERFORMANCE 2019
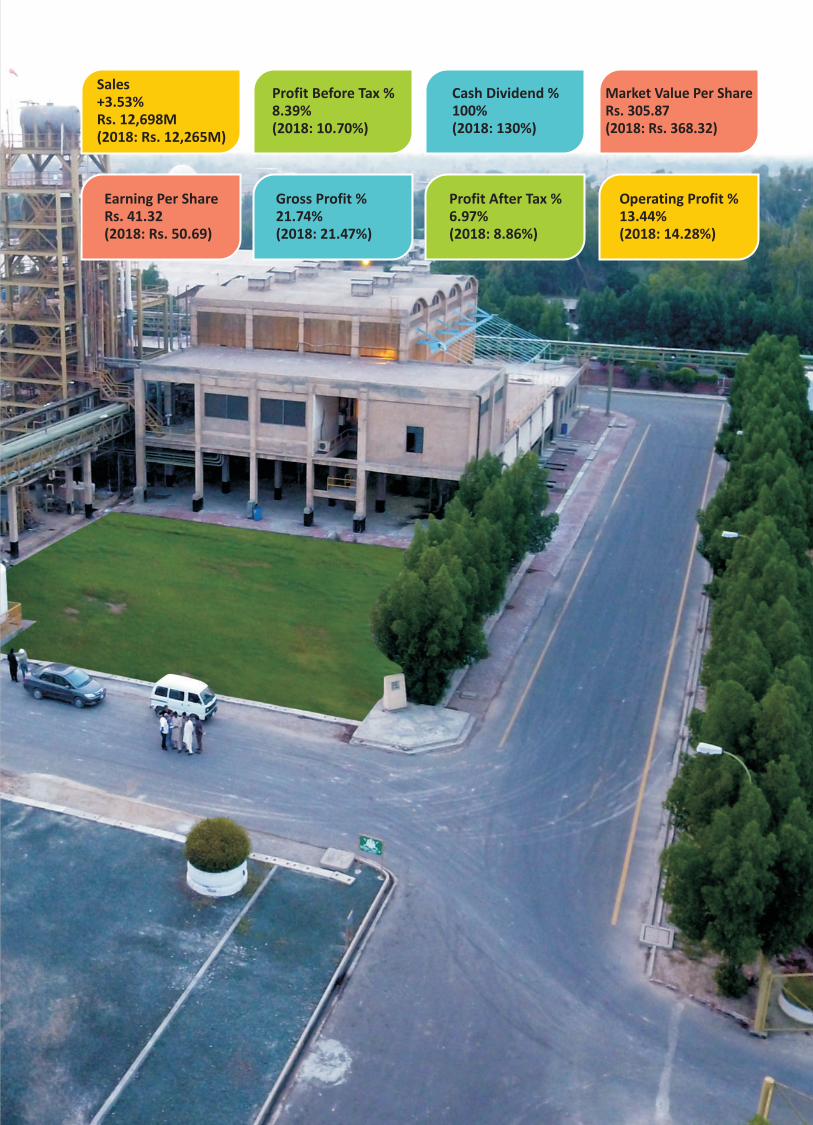
Sales+3.53%Rs. 12,698M(2018: Rs. 12,265M)
Profit Before Tax %8.39%(2018: 10.70%)
Cash Dividend %100%(2018: 130%)
Market Value Per ShareRs. 305.87(2018: Rs. 368.32)
Profit After Tax %6.97%(2018: 8.86%)
Earning Per ShareRs. 41.32(2018: Rs. 50.69)
Gross Profit %21.74%(2018: 21.47%)
Operating Profit %13.44%(2018: 14.28%)

VISIONStrive to develop and employ
innovation technological solutions
to add value to business with
progressive and proactive approach.
MISSIONContinuing growth and
diversification for bottom line
results with risk well contained.

CODE OF ETHICS
AND BUSINESS
PRACTICES
We believe in stimulating and challengingteam oriented work environment thatencourage, develops and reward excellenceand diligently serve communities,maintaining high standards of moral andethical values.
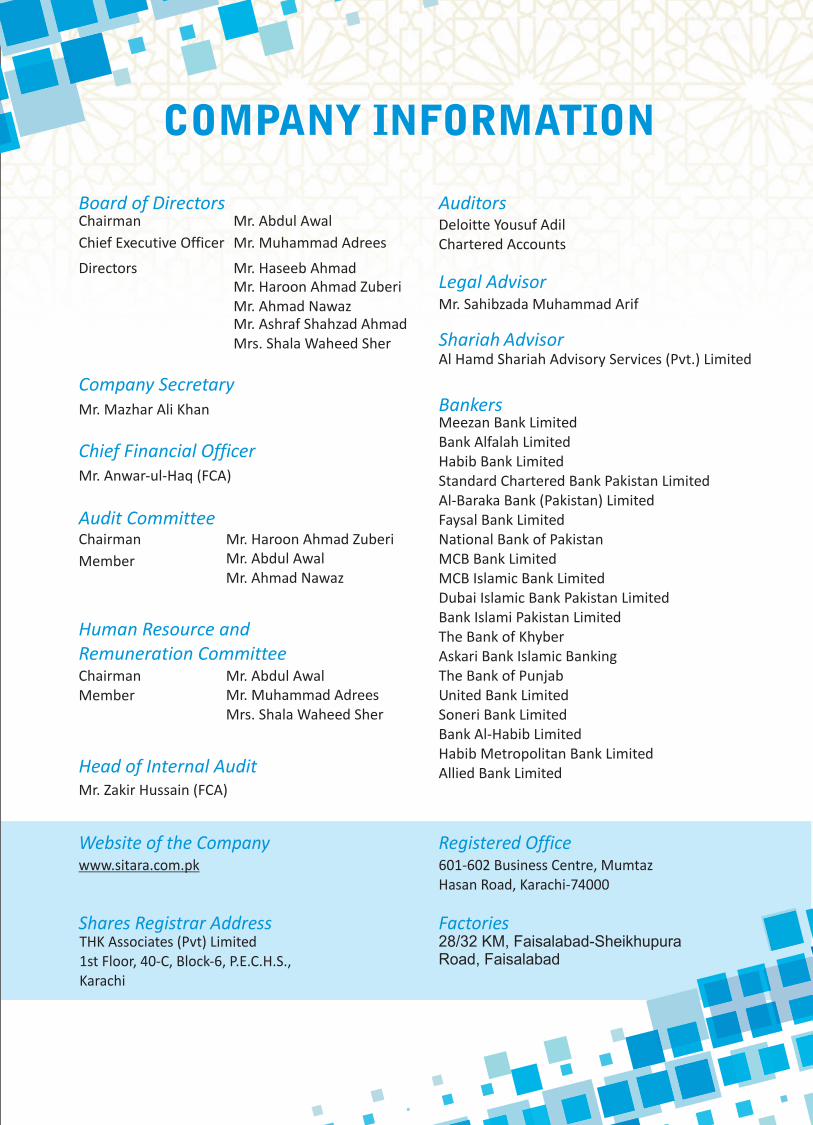
Website of the Company
Shares Registrar Address
www.sitara.com.pk
THK Associates (Pvt) Limited
1st Floor, 40-C, Block-6, P.E.C.H.S.,
Karachi
Registered Office
Factories
601-602 Business Centre, Mumtaz
Hasan Road, Karachi-74000
28/32 KM, Faisalabad-SheikhupuraRoad, Faisalabad
COMPANY INFORMATION
Board of Directors
Company Secretary
Chief Financial Officer
Audit Committee
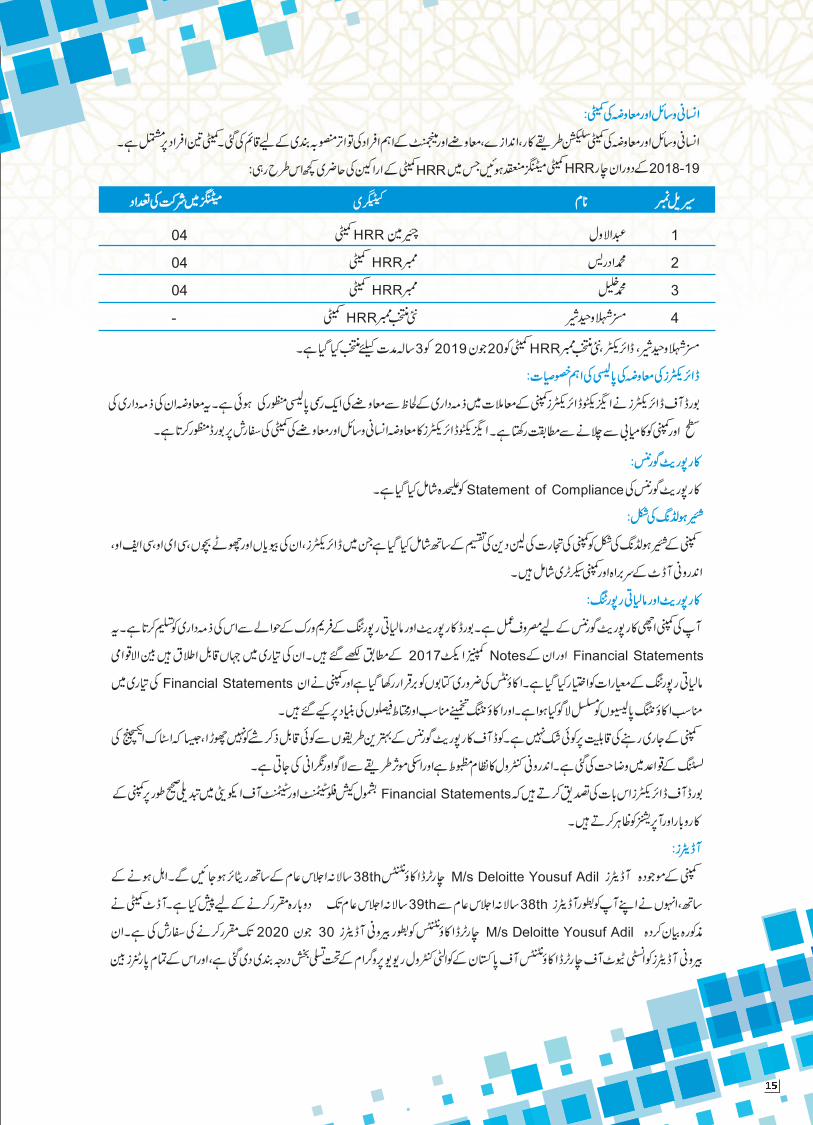
Human Resource and
Remuneration Committee
Head of Internal Audit
Auditors
Legal Advisor
Chairman
Chairman
Chairman
Member
Chief Executive Officer
Member
Mr. Zakir Hussain (FCA)
Directors
Mr. Abdul Awal Deloitte Yousuf Adil
Chartered Accounts
Mr. Sahibzada Muhammad Arif
Al Hamd Shariah Advisory Services (Pvt.) LimitedShariah Advisor
BankersMeezan Bank Limited
National Bank of Pakistan
Allied Bank Limited
Bank Alfalah Limited
Habib Bank Limited
Standard Chartered Bank Pakistan Limited
Al-Baraka Bank (Pakistan) Limited
Faysal Bank Limited
MCB Bank Limited
MCB Islamic Bank Limited
Dubai Islamic Bank Pakistan Limited
Bank Islami Pakistan Limited
The Bank of Khyber
Askari Bank Islamic Banking
The Bank of Punjab
United Bank Limited
Soneri Bank Limited
Bank Al-Habib Limited
Habib Metropolitan Bank Limited
Mr. Muhammad Adrees
Mr. Haroon Ahmad Zuberi
Mr. Abdul Awal
Mr. Abdul Awal
Mr. Ahmad Nawaz
Mr. Muhammad Adrees
Mrs. Shala Waheed Sher
Mr. Haseeb Ahmad
Mr. Haroon Ahmad Zuberi
Mr. Ahmad NawazMr. Ashraf Shahzad Ahmad
Mrs. Shala Waheed Sher
Mr. Mazhar Ali Khan
Mr. Anwar-ul-Haq (FCA)

CHAIRMAN’S REVIEW REPORT
ON BOARD'S OVERALL PERFORMANCE
Sitara Chemical Industries Limited complies with all the requirements as set out in the
Companies Act, 2017 and the Listed Companies (Code of Corporate Governance)
Regulations, 2017 with respect to the composition, procedures and meetings of the
Board of Directors and its committees. As required under the Code of Corporate
Governance, an annual evaluation of the Board of Directors of (the “Board”) of Sitara
Chemical Industries Limited (the “Company”) is carried out.
For the financial year ended June 30, 2019, Board's overall performance and
effectiveness has been assessed as Satisfactory. Improvements are an ongoing process
leading to action plans. The overall assessment as satisfactory is based on an evaluation
of integral components, which have a direct bearing on the Board's role in achievement
of company's objectives, including vision, mission and values; engagement in strategic
planning; monitoring the organization's business activities; monitoring financial
resource management; effective fiscal oversight; diversity, governance and control
environment.
The board ensured that all the legal and regulatory requirements have been compiled
with by the management of the company.
(u/s 192 of the Companies Act 2017)
Abdul AwalChairmanDate: September 19, 2019
7
DIRECTORS' REPORT
Business Overview:
Production Operations:
Overall economic environment of the country remained depressed during the year with GDP growthof 3.29% compared with 5.79% last year. Industrial growth of Large Scale Manufacturing industry(LSM) witnessed a growth of 2.93% during the current financial year as compared with growth of6.33% last year. The performance of textile sector remained under stress during the period as itdeclined by 0.30% against meager growth of 0.5% during the last year. Bank borrowing rates increasedsignificantly during the year causing financial cost of the company to rise.
In view of the above stated economic environment that remained prevalent during the year, which hasimpacted the businesses. However, some component of increased cost of production was added inthe selling price of caustic. During the financial year 2019, your Company has posted net sales ofRs.12,698/- million as against Rs. 12,265/- million last year, representing a growth of 3.53% inmonetary terms. Profit before tax stood at Rs. 1,065/- million during the year 2018-19 as against Rs.1,312/- million last year. Earning per share was recorded at Rs. 41.32 during the year as against Rs.50.69/- last financial year. Fall in earnings and EPS is mainly attributable to the rising financial costafter increased bank borrowing rates and borrowing levels to finance the capital expenditures of thecompany.
Detail of net production of different products of company for the year 2018-19 in comparison with lastyear is as given hereunder:
In the name of Allah, the Most Beneficent, the Most Gracious,the Most Merciful. On behalf of the Board of Directors of SitaraChemical Industries Limited, we are pleased to present theaudited financial statements of the Company together withAuditors' Report thereon, report of external shariah auditorsfor the year ended June 30, 2019.
Description 2019
(M. Ton)
2018
(M. Ton)
Caustic Soda (Liquid & Flakes)Sodium HypochloriteBleaching PowderLiquid ChlorineHydrochloric AcidCO2Calcium ChlorideFerric ChlorideMagnesium ChlorideMagnesium SulphateCotton Yarn converted into 20/S count
133,01542,4964,1297,994
109,1277,205
10,3652,0141,7981,0258,937
141,56335,7484,4927,851
117,0568,4563,9291,7511,7391,901
10,853
8

HSE - Fire fighting drill activity HSE - First aid activity
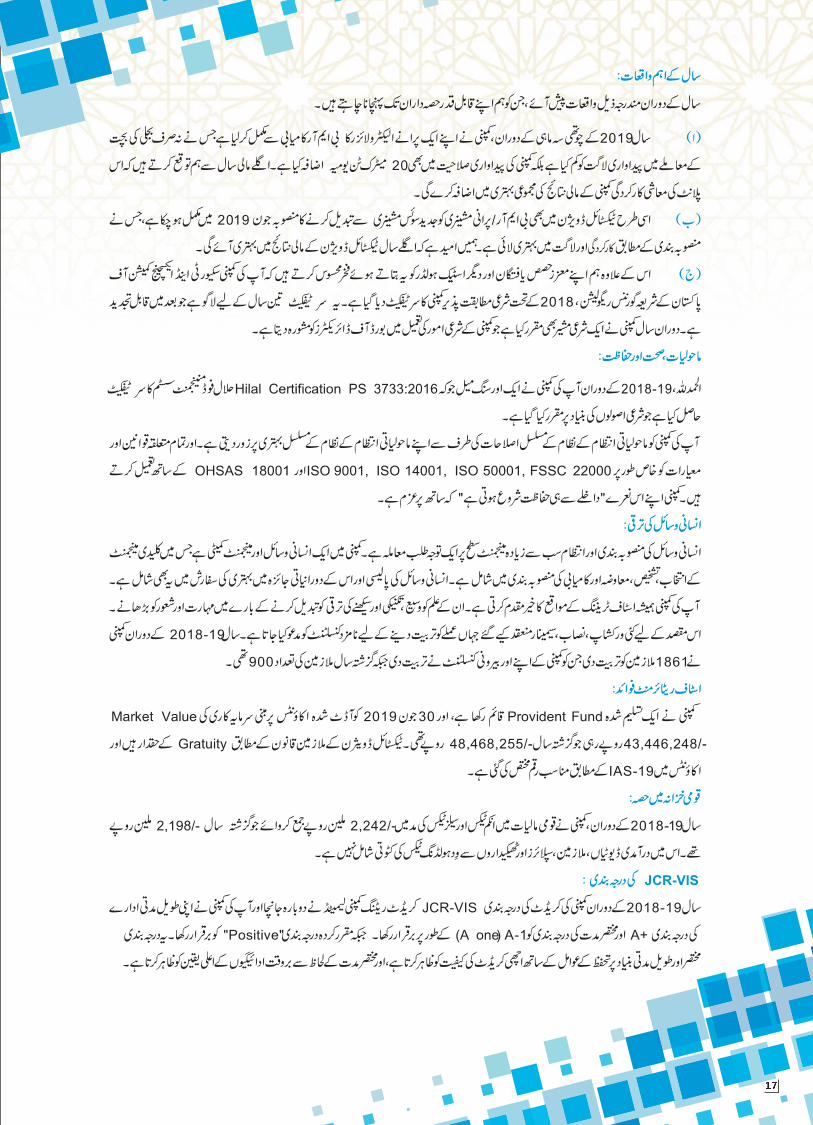
Human Resource Development:
Human Resource planning and management is one of the most focused point at the highest
management level. The company has a Human Resource and Management committee which is
involved in selection, evaluation, compensation and succession planning of the key management
personnel. It is also involved in recommending improvement in human resource policy and its periodic
review. Your company always welcomes the opportunities for staff training, broadening their
knowledge, vision and skill and awareness about changing technological and learning developments.
9
Environment, Health and Safety:
Al-Hamdullilah during the year 2018-19, your company has attained another milestone i.e. HALAL Certification
i.e. PS 3733:2016 Halal Food Management System, which has been developed based on Shariah fundamentals
and obligations, focus is to eliminate the non conformance of Halal requirements.
Your company is strongly committed to continued improvement of its environmental management system by
adaptation of appropriate pollution prevention measures and complying with all relevant legislation and
standards especially ISO 9001, ISO 14001, ISO 50001, FSSC 22000 and OHSAS 18001. Company is also
committed to the slogan of “safety starts from the entrance”.
Significant events occurred during the year:
During the year the following events occurred, which we would like to bring to the knowledge of our valued
shareholders:
a)
b)
c)
During the 4th quarter of the year 2019, company has successfully completed the BMR of one of its old
electrolyzer which has not only reduced the cost of production in terms of electricity savings but also
enhanced the production capacity of the company by 20 MTPD. From the next financial year, we expect
that economic efficiency of this plant will add its due share in overall improvement of the financial
results of the company.
Similarly in textile division, work on BMR / replacement of old machinery with latest Swiss machines at
all back process was also completed in June 2019, which will bring efficiency in operations and cost
savings as planned. From the next financial year, we hope to have the improvement in the financial
results of textile division.
Moreover, we feel proud to inform our valued shareholders and other stakeholders that your company
has been granted with the certificate of a Shariah Compliant Company by Securities & Exchange
Commission of Pakistan (SECP) under Shariah Governance Regulations, 2018. The said certificate is
valid forthree years which is renewable afterwards. During the year, company also appointed a Shariah
Advisor who advises to Board of Directors on shariah compliance matters of the company.
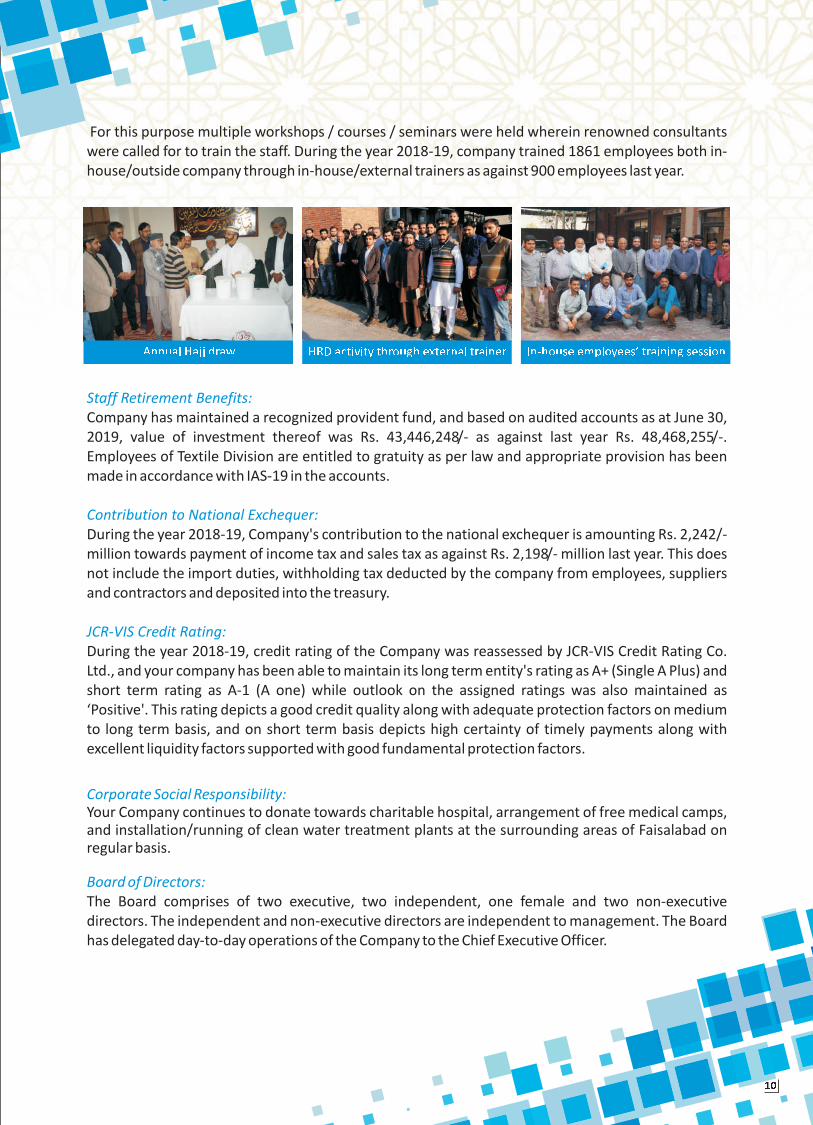
For this purpose multiple workshops / courses / seminars were held wherein renowned consultants
were called for to train the staff. During the year 2018-19, company trained 1861 employees both in-
house/outside company through in-house/external trainers as against 900 employees last year.
Staff Retirement Benefits:
Contribution to National Exchequer:
JCR-VIS Credit Rating:
Company has maintained a recognized provident fund, and based on audited accounts as at June 30,
2019, value of investment thereof was Rs. 43,446,248/- as against last year Rs. .
Employees of Textile Division are entitled to gratuity as per law and appropriate provision has been
made in accordance with IAS-19 in the accounts.
During the year 2018-19, Company's contribution to the national exchequer is amounting Rs. 2,242/-
million towards payment of income tax and sales tax as against Rs. million last year. This does
not include the import duties, withholding tax deducted by the company from employees, suppliers
and contractors and deposited into the treasury.
During the year 2018-19, credit rating of the Company was reassessed by JCR-VIS Credit Rating Co.
Ltd., and your company has been able to maintain its long term entity's rating as A+ (Single A Plus) and
short term rating as A-1 (A one) while outlook on the assigned ratings was also maintained as
‘Positive'. This rating depicts a good credit quality along with adequate protection factors on medium
to long term basis, and on short term basis depicts high certainty of timely payments along with
excellent liquidity factors supported with good fundamental protection factors.
48,468,255/-
2,198/-
Annual Hajj draw HRD activity through external trainer In-house employees� training session
Corporate Social Responsibility:Your Company continues to donate towards charitable hospital, arrangement of free medical camps,and installation/running of clean water treatment plants at the surrounding areas of Faisalabad onregular basis.
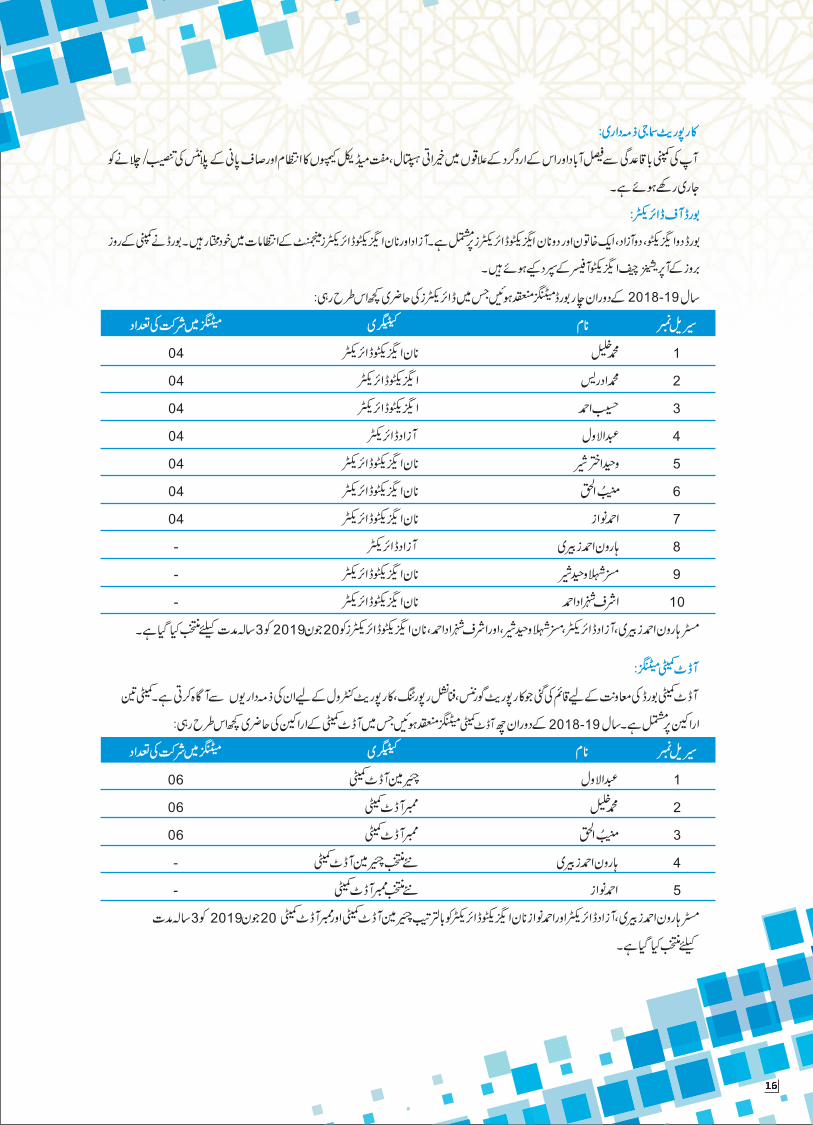
Board of Directors:
The Board comprises of two executive, two independent, one female and two non-executive
directors. The independent and non-executive directors are independent to management. The Board
has delegated day-to-day operations of the Company to the Chief Executive Officer.
10
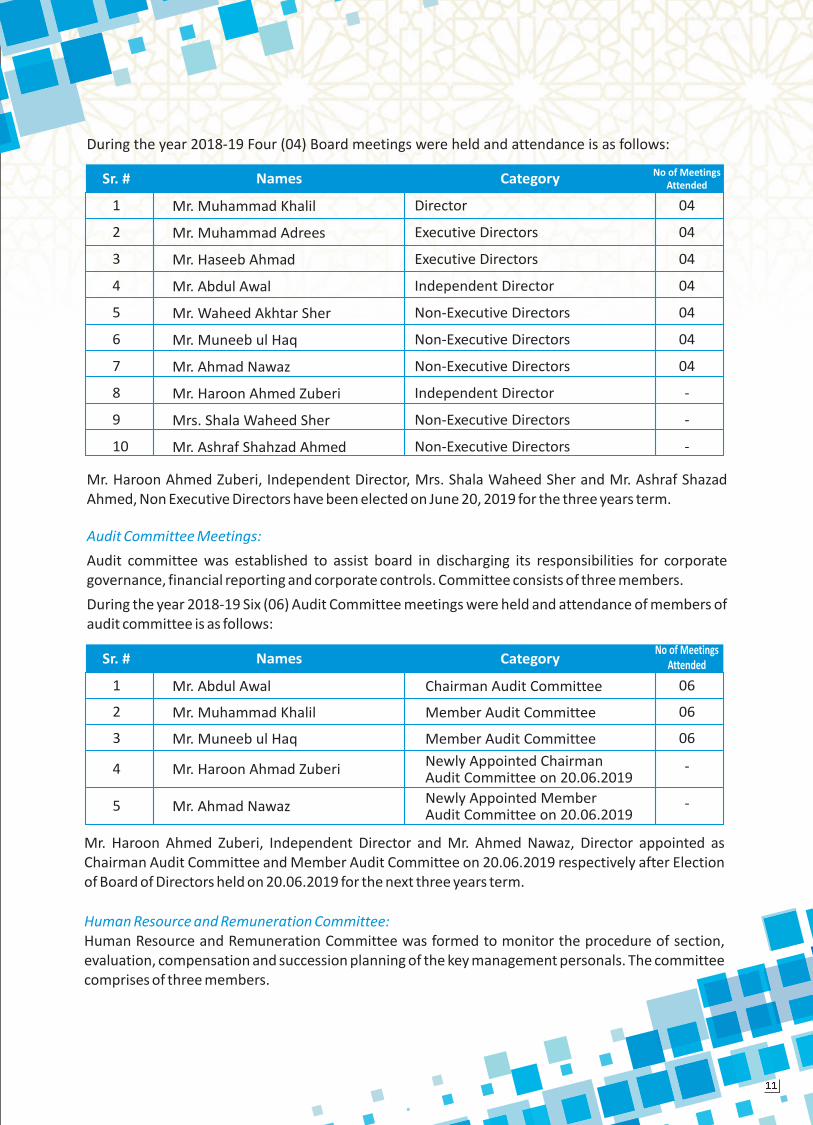
Names
Director
Executive Directors
Executive Directors
Independent Director
Non-Executive Directors
Non-Executive Directors
Non-Executive Directors
Independent Director
Non-Executive Directors
Non-Executive Directors
Mr. Muhammad Khalil
Mr. Abdul Awal
Mr. Waheed Akhtar Sher
Mr. Muneeb ul Haq
Mr. Ahmad Nawaz
Mr. Muhammad Adrees
Mr. Haseeb Ahmad
Mr. Haroon Ahmed Zuberi
Mrs. Shala Waheed Sher
Mr. Ashraf Shahzad Ahmed
Sr. #No of Meetings
Attended
1
2
3
4
5
6
7
8
9
10
04
04
04
04
04
04
04
-
-
-
Mr. Haroon Ahmed Zuberi, Independent Director, Mrs. Shala Waheed Sher and Mr. Ashraf Shazad
Ahmed, Non Executive Directors have been elected on June 20, 2019 for the three years term.
Mr. Haroon Ahmed Zuberi, Independent Director and Mr. Ahmed Nawaz, Director appointed as
Chairman Audit Committee and Member Audit Committee on 20.06.2019 respectively after Election
of Board of Directors held on 20.06.2019 for the next three years term.
Mr. Abdul Awal
Mr. Muhammad Khalil
Mr. Muneeb ul Haq
Mr. Haroon Ahmad Zuberi
Mr. Ahmad Nawaz
NamesSr. #
1
2
3
4
5
06
06
06
-
-
No of Meetings
Attended
Chairman Audit Committee
Member Audit Committee
Member Audit Committee
Newly Appointed ChairmanAudit Committee on 20.06.2019
Newly Appointed MemberAudit Committee on 20.06.2019
During the year 2018-19 Four (04) Board meetings were held and attendance is as follows:
Audit Committee Meetings:
Audit committee was established to assist board in discharging its responsibilities for corporate
governance, financial reporting and corporate controls. Committee consists of three members.
During the year 2018-19 Six (06) Audit Committee meetings were held and attendance of members of
audit committee is as follows:
Human Resource and Remuneration Committee:
Human Resource and Remuneration Committee was formed to monitor the procedure of section,
evaluation, compensation and succession planning of the key management personals. The committee
comprises of three members.
Category
Category
11
Significant Features of Directors' Remuneration Policy:
Corporate Governance:
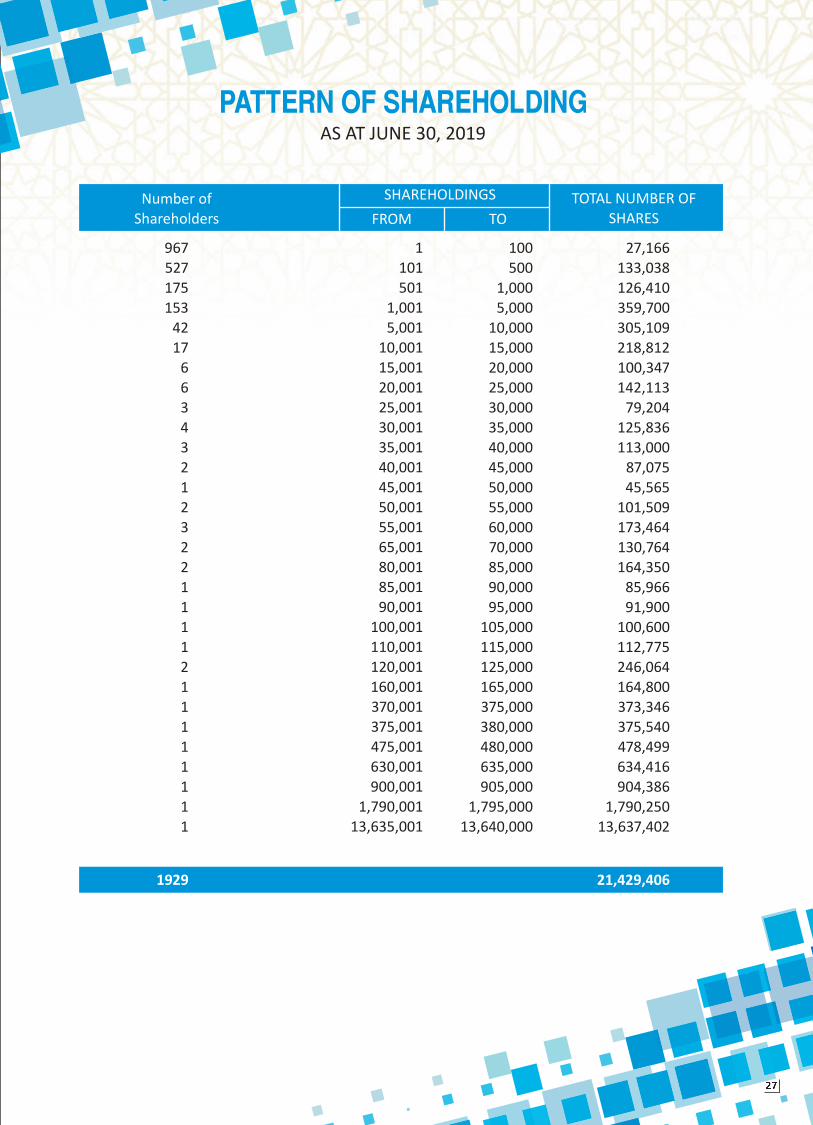
Pattern of Shareholding:
Corporate and Financial Reporting:
Auditors:
The Board of Directors has approved a formal policy for remuneration of executive directorsdepending upon their responsibility in affairs of the Company. The remuneration is commensuratewith their level of responsibility and expertise needed to govern the Company successfully and toencourage value addition from them. Remuneration of executive directors shall be approved by theBoard, as recommended by the Human Resource and Remuneration Committee.
Statement of Compliance of Corporate Governance is separately annexed.
The pattern of shareholding of the Company is annexed along with trading in shares of the Companyby its Directors, their spouse and minor children, CEO, CFO, Head of internal audit and CompanySecretary.
Your Company is committed to good corporate governance. The Board acknowledges its responsibilityin respect of Corporate and Financial Reporting Framework. These Financial Statements togetherwith the notes thereto have been drawn up, in conformity with the Companies Act, 2017.International Financial Reporting Standards wherever applicable have been followed in theirpreparation. Proper books of accounts have been maintained by the Company and appropriateaccounting policies have been consistently applied in the preparation of financial statements andaccounting estimates are based on reasonable and prudent judgment.
There are no doubts upon the Company's ability to continue as a going concern. There has been nomaterial departure from the best practices of the Code of Corporate Governance, as detailed in thelisting regulations of the stock exchange. The system of internal control is sound in design and hasbeen effectively implemented and monitored.
The board of Directors certifies that the financial statements including cash flow and statement ofchanges in equity fairly presents the state of affairs of company's business and of its operations.
The existing auditors M/s. Deloitte Yousuf Adil, Chartered Accountants, shall retire on the conclusionof 38th Annual General Meeting. Being eligible, they have offered themselves for re-appointment asAuditors of the Company from conclusion of the 38th Annual General Meeting until the conclusion of39th Annual General Meeting. The Audit Committee has recommended the appointment of aforesaidM/s. Deloitte Yousuf Adil, as external auditors for the year ending June 30, 2020. The external auditorshave been given a satisfactory rating under the Quality Control Review Program of the Institute ofChartered Accountants of Pakistan (ICAP) and the firm, and all its partners are in compliance with theInternational Federation of Accountants' Guidelines on Code of Ethics, as adopted by the ICAP.
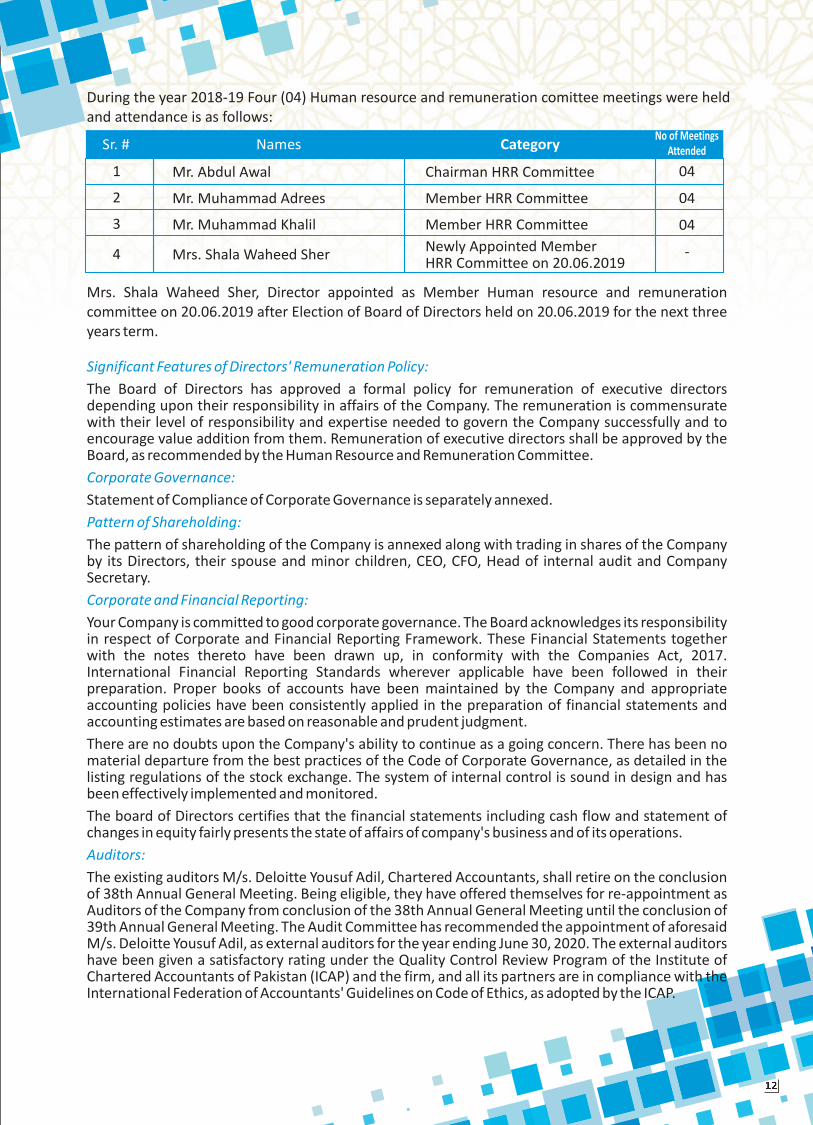
Mrs. Shala Waheed Sher, Director appointed as Member Human resource and remuneration
committee on 20.06.2019 after Election of Board of Directors held on 20.06.2019 for the next three
years term.
During the year 2018-19 Four (04) Human resource and remuneration comittee meetings were held
and attendance is as follows:
Mr. Abdul Awal
Mr. Muhammad Adrees
Mr. Muhammad Khalil
Mrs. Shala Waheed Sher
NamesSr. #
1
2
3
4
04
04
04
-
No of Meetings
Attended
Chairman HRR Committee
Member HRR Committee
Member HRR Committee
Newly Appointed MemberHRR Committee on 20.06.2019
Category
12

Dividend:
Future Outlook:
Acknowledgments:
In view of the financial results of the Company for the year ended June 30, 2019, the Board of Directorsof the Company have recommended a cash dividend of 100% i.e. Rs.10 per share.
We have an R&D department in the company which is working with full dedications to fulfill ouragenda of economic operations, diversification and induction of new product lines etc., that willcreate shareholders' value on sustainable basis. Furthermore, after significant increase in electricityand RLNG tariff by Govt., your company is evaluating number of options to have alternate, reliable andcheaper source of electricity to add value to the company.
Non-availability of system gas to the industry upto 28% of the sanctioned load, as was previously beingavailable, along with rising electricity cost by Govt., increase in RLNG prices, Pak rupee devaluation,interest rates increase etc. are the key challenges being faced by the Company currently.
We take this opportunity to thank our valued business partners and stakeholders for their continuedsupport, trust and assistance for the progress and prosperity of the Company. Company alsoappreciates its staff for their continuous dedication, commitment and support.
Faisalabad.September 19, 2019
Muhammad Adrees
Chief Executive Officer
Net profit for the year after tax before WPPF and WWF
Workers Welfare Fund (WWF) and Workers Profit Participation Fund (WPPF)
Net Profit for the year
Incremental depreciation (net of tax)
Impact of change in accounting policy- IFRS 9 (net of tax)
Final dividend for the year ended June 30, 2018 @ Rs. 13 per share
Amount available for appropriation
Proposed dividend for the year ended June 30, 2019 @ Rs. 10 per share
Earnings per share- basic and diluted
Un-appropriated profit brought forward
Description Rupees
Haseeb Ahmad
Director
964,389,916
(78,931,509)
60,064,648
7,892,906,389
(37,483,176)
7,855,423,213
(278,582,278)
(214,294,070)
885,458,407
8,522,363,987
41.32
13
Appropriations:
The following appropriations of profits for the year ended June 30, 2019 were made:

:(Appropriation)
:(Dividend)
14
1
2
3
4
04
04
04
-
15
16
17

18

SIX YEARS AT A GLANCE
Operating results (Rs. In Million)SalesGross profitOperating profitProfit before tax
Financial ratiosGross Profit %Operating Profit %Profit before tax %Earnings per share - Basic (Rs.)Market value per share - (Rs.)Cash Dividend Per Share - (Rs.)Inventory turn over (times)Current ratioFixed assets turn over (times)Price earning ratioReturn to capital employed %Debt equity
201912,6982,7601,7071,065
21.7413.448.39
41.32305.8710.008.72
0.88:10.827.405.31
24:76
201812,2652,6331,7511,312
21.4714.2810.7050.69
368.3213.008.98
0.84:11.287.279.20
18:82
201710,0742,3121,5511,180
22.9515.4011.7154.43
444.6212.506.76
0.88:11.078.179.72
24:76
20169,8142,1291,3741,123
21.6914.0011.4435.90
364.0011.508.44
0.75:11.12
10.147.29
23:77
20158,7231,5721,4461,112
18.0216.5712.7546.03
300.209.008.94
1.04:11.516.52
10.8919:81
20148,8072,1391,5511,146
24.2917.6113.0140.19
296.5010.507.05
0.87:11.537.38
10.7419:81
Gross Profit, Operating Profit and Profit before Tax
(Rs. In Million)
Sales (Rs. In Millon)
Market value per share (Rs.) Earning per share - Basic (Rs.)
2019 2018 2017 2016 2015 2014
19

Assets employed
Property, Plant and equipmentIntengible assetsInvestment propertyLong Term InvestmentAdvances and depositsCurrent assetsCurrent liabilities
Financed byOrdinary capitalReservesShareholders' equitySurplus on revaluationLong term and deferred liabilities
2019
2019
2018
2018
2017
2017
2016
2016
2015
2015
2014
2014
(Rupees '000')
SIX YEARS AT A GLANCE
15,516,23611,120
3,296,50519,640
1,193,9346,790,055
(7,677,633)19,149,857
9,572,02711,780
3,033,96825,039
1,460,3205,693,967
(6,770,386)13,026,715
9,413,11513,089
2,926,57031,579
1,379,0615,761,477
(6,523,898)13,000,993
8,789,14314,544
2,872,992100,125
1,376,0354,702,364
(6,286,868)11,568,335
5,790,53616,159
2,716,46399,192
1,375,4924,446,080
(4,293,654)10,150,268
5,765,29517,955
3,004,81568,280
928,3093,601,755
(4,160,633)9,225,776
214,2949,891,688
10,105,9824,513,6414,530,234
19,149,857
214,2949,258,4039,472,6971,164,7312,389,287
13,026,715
214,2948,410,6688,624,9621,226,1333,149,898
13,000,993
214,2947,321,1137,535,4071,355,6952,677,233
11,568,335
214,2946,677,8936,892,1871,305,6961,952,385
10,150,268
214,2945,887,7956,102,0891,347,4091,776,2789,225,776
Fixed Assets (Rupees �000�) Shareholders� equity (Rupees �000�)
Export Sales (Rupees �000�) Current Assets & Current Liabilities (Rupees �000�)
20

Statement of Director's Responsibility
Presentation of Financial Statements
Books of Accounts
Accounting Policies
Application of International Accounting Standards
Internal Control System
Taxation
Going Concerns
Audit Committee
Human Resource and Remuneration Committee
Board of Directors is mindful of its responsibilities and duties under legal and corporate framework.
The Board defines and establishes Company's overall objectives and directions and monitors status
thereof. Short term and long term plans and business performance targets are set by Chief Executive
Officer under overall policy famework of the Board.
There has been no-material departure from the best practices of the corporate Governance, as
detailed in the listing regulation.
The financial statement prepared by the management of the Company, fairly present its state of
affairs, the result of its operations, cash flows and changes in equity.
Company has maintained proper books of account.
Appropriate accounting policies have been consistently applied, in the preparation of financial
statements and accounting estimates are based on reasonable and prudent judgment.
International Accounting Standards, as applicable in Pakistan, have been followed in preparation of
financial statements and any departure there from has been adequately disclosed.
System of Internal Control is sound in design and has been effectively implemented and monitored.
Information about taxes and levies is given in the notes to and forming part of financial statements.
There is no doubt about the Company's ability to continue as a going concern.
Audit Committee was established to assist Board in discharging its responsibilities for Corporate
Governance, Financial Reporting and Corporate Control. The Committee consist of three members
Human Resource and Remuneration Committee was formed to monitor the procedure of selection,
evaluation, compensation and succession planning of the key management personal along with
designing and implementation of Human Resource Policy of the company. This committee comprises
of three members.
CORPORATE GOVERNANCE
21
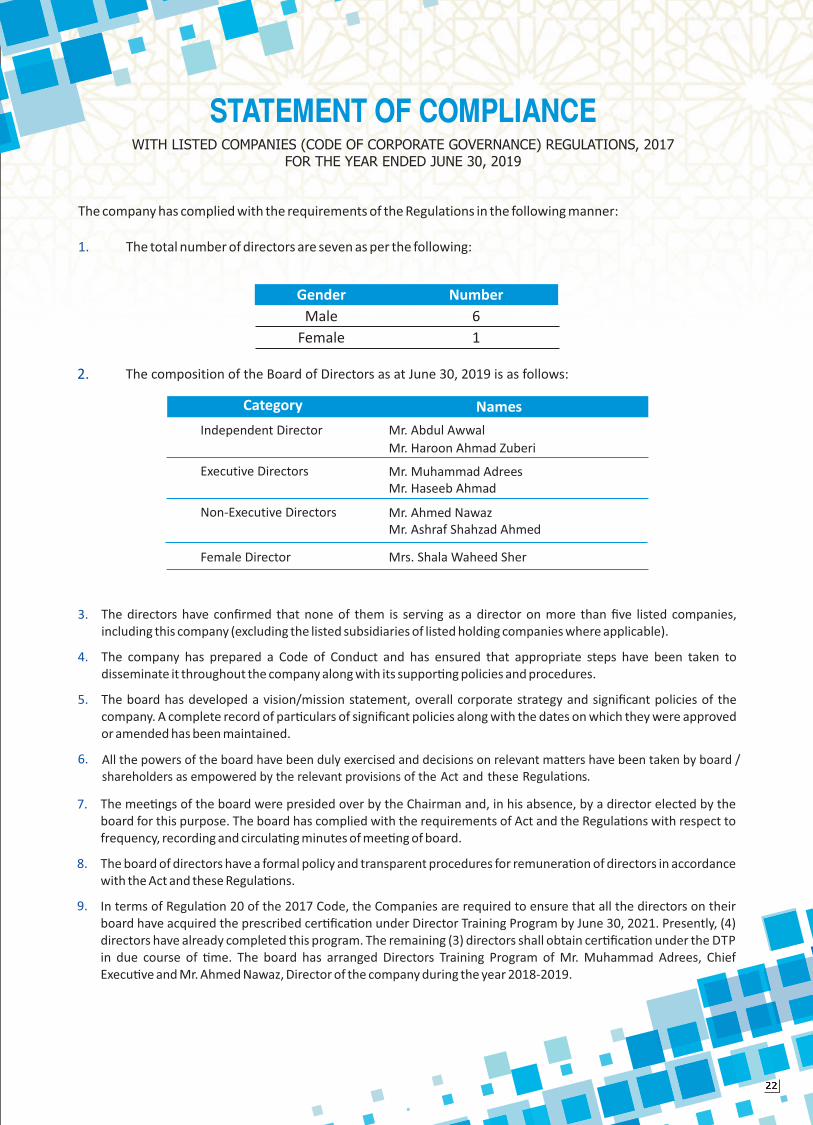
Gender
Male
Female
Number
6
1
2.
STATEMENT OF COMPLIANCEWITH LISTED COMPANIES (CODE OF CORPORATE GOVERNANCE) REGULATIONS, 2017
FOR THE YEAR ENDED JUNE 30, 2019
The company has complied with the requirements of the Regulations in the following manner:
The total number of directors are seven as per the following:1.
Names
Independent Director
Executive Directors
Non-Executive Directors
Female Director
Mr. Abdul Awwal
Mr. Haroon Ahmad Zuberi
Mr. Muhammad Adrees
Mr. Haseeb Ahmad
Mr. Ahmed Nawaz
Mr. Ashraf Shahzad Ahmed
Mrs. Shala Waheed Sher
3.
4.
5.
6.
7.
8.
9.
The composition of the Board of Directors as at June 30, 2019 is as follows:
22

a.
b.
Faisalabad
September 19,2019
10.
11.
12.
18.
17.
16.
15.
13.
14.
STATEMENT OF COMPLIANCEWITH LISTED COMPANIES (CODE OF CORPORATE GOVERNANCE) REGULATIONS, 2017
FOR THE YEAR ENDED JUNE 30, 2019
23

Shariah ComplianceReview Report
2019

? +92 322 2671867| ? |?
For the period ended June 30, 2019
With the grace of Allah, Sitara (
Shariah Advisor
Commissi
.
d are in line with the Shariah
principles;
Shariah;
Advise on regul
with the principles of Shariah;
Shariah principles;
-
March 14,
2019
25

? +92 322 2671867| ? |?
reviewed Sitara Chemical
and
rules and principles of Shariah.
Sitara Chemical
Limited.
_______________________ _______________________
For and on behalf of For and on behalf of
19, , 2019
26
967
527
175
153
42
17
6
6
3
4
3
2
1
2
3
2
2
1
1
1
1
2
1
1
1
1
1
1
1
1
1929
PATTERN OF SHAREHOLDING
1
101
501
1,001
5,001
10,001
15,001
20,001
25,001
30,001
35,001
40,001
45,001
50,001
55,001
65,001
80,001
85,001
90,001
100,001
110,001
120,001
160,001
370,001
375,001
475,001
630,001
900,001
1,790,001
13,635,001
100
500
1,000
5,000
10,000
15,000
20,000
25,000
30,000
35,000
40,000
45,000
50,000
55,000
60,000
70,000
85,000
90,000
95,000
105,000
115,000
125,000
165,000
375,000
380,000
480,000
635,000
905,000
1,795,000
13,640,000
27,166
133,038
126,410
359,700
305,109
218,812
100,347
142,113
79,204
125,836
113,000
87,075
45,565
101,509
173,464
130,764
164,350
85,966
91,900
100,600
112,775
246,064
164,800
373,346
375,540
478,499
634,416
904,386
1,790,250
13,637,402
21,429,406
Number of
Shareholders
SHAREHOLDINGS
FROM TO
TOTAL NUMBER OF
SHARES
AS AT JUNE 30, 2019
27

13,637,4021,790,250
2018-2019.
2
11111118
327221791351
2526
51,306
13,637,402375,540
500500
114
1,956,753
907,3861,365,166
16,0502,200
1,846,082165,467478,499
479,064147,485
0.24
63.641.750.000.000.000.000.009.13
4.246.370.070.018.620.772.23
2.240.69
1929 21,429,406 100.00
PATTERN OF SHAREHOLDINGAS AT JUNE 30, 2019
Number Share Held Percentage
NIT & ICP
Directors, CEO & their Spouse andMinor Children
Bank, Development Finance Institutions,Non Banking Finance Institutions.Insurance CompaniesMutual FundsModarabasForeign CompaniesGeneral Public (Local)General Public (Foreign)Associated Companies, Undertaking andRelated PartiesJoint Stock Companies, others, etc.Others
National Bank of Pakistan - Trustee DepartmentInvestment Corporation of Pakistan
Mr. Muhammad AdreesMr. Haseeb AhmadMr. Abdul AwalMr. Ahmad NawazMr. Haroon Ahmed ZuberiMrs. ShalaWaheed SherMr. Ashraf Shazad Ahmad
28

NOTICE OF ANNUAL GENERAL MEETING
Notice is hereby given that the 38th Annual General Meeting of Sitara Chemical Industries Limited
will be held at The Institute of Chartered Accountants of Pakistan (ICAP) Auditorium Hall,
Chartered Accountants Avenue, Clifton, Karachi, on Monday, October 28, 2019 at 5:45 p.m. to
transact the following business:
To confirm the minutes of Extra Ordinary General Meeting held on June 20, 2019.
To receive, consider and adopt the Annual Audited Accounts of the Company for the year ended
June 30, 2019 together with the Reports of Auditors and Directors thereon.
To approve payment of Cash Dividend at the rate of 100% (Rs. 10/- per share) as recommended by
the Board of Directors.
To appoint auditors and to fix their remuneration for the year ending June 30, 2020. The present
auditors M/s. Deloitte YousufAdil, Chartered Accountants, retire and being eligible, have offered
themselves for re-appointment.
To transact any other business of the Company with the permission of the Chair.
1.
2.
3.
4.
5.
Karachi
Dated : September 19, 2019
By order of the Board
MAZHAR ALI KHANCompany Secretary
CLOSURE OF SHARE TRANSFER BOOKS.
PARTICIPATION IN THE ANNUAL GENERAL MEETING.
CDC ACCOUNT HOLDERS WILL HAVE TO FOLLOW FURTHER UNDER MENTIONED GUIDELINES AS
LAID DOWN BY THE SECURITIES AND EXCHANGE COMMISSION OF PAKISTAN.
For attending the meeting:a)
The share transfer books of the company will remain closed and no transfer of shares will be
accepted for registration from October 22, 2019 to October 28, 2019 (both days inclusive).
Transfers received in order at Company's Share Registrar's Office by the close of business on
October 21, 2019 will be treated in time for the purpose of payment of cash dividend, if approved
by the shareholders.
A member entitled to attend and vote at this meeting is entitled to appoint another person as
his/her proxy to attend and vote. Proxies in order to be effective must be received at Company's
Share Registrar's Office M/s. THK Associates (Pvt) Limited, 1st Floor, 40-C, Block-6, P.E.C.H.S.,
Karachi duly stamped and signed not less than 48 hours before the time of meeting.
In case of individuals, the account holders or sub-account holders and their registration
details are uploaded as per the regulations, shall authenticate their identity by showing their
original Computerized National Identity Card (CNIC) or Original Passport at the time of
attending the meeting.
i)
1.
2.
3.
29

NOTICE OF ANNUAL GENERAL MEETING
i)
A)
i)
Ii)
iii)
For appointing proxies:
WITHHOLDING TAX ON DIVIDEND INCOME
In case of Corporate Entities, the Board of Directors' resolution/power of attorney with
specimen signature of the nominees shall be produced (unless it has been provided earlier) at
the time of the meeting.
In case of individuals, the account holders or sub account holders and their registration
details are uploaded as per the regulations, shall submit the proxy form as per the above
requirements. The proxy form shall be witnessed by two persons whose names, addresses and
CNIC numbers shall be mentioned on the form. Attested copies of CNIC or the passport of the
beneficial owners and the proxy shall be furnished with the proxy form. The proxies shall
produce their original CNIC or original passport at the time of meeting.
In case of corporate entities, the Board of Directors' resolution/power of attorney
with specimen signature of the person nominated to represent and vote on behalf of the
corporate entity, shall be submitted (unless it has been provided earlier) along with proxy
form to the company's registrar.
Form of proxy is attached to the notice of meeting being sent to the members. Proxy Form
may also be downloaded from the Company's website i.e.
The deduction of Income Tax from dividend payments shall be made on the basis of filers
and non-filers as follows:
www.sitara.com.pk
1. Filer of Income Tax Returns
2. Non-Filer of Income Tax Returns
15.0%
30.0%
Income Tax will be deducted on the basis of Active Tax Payers list posted on the Federal Board of
Revenue website.
Members seeking exemption from deduction of income tax or are eligible for deduction at a
reduced rate, are requested to submit a valid tax exemption certificate or necessary
documentary evidence as the case may be. Members desiring non-deduction of zakat are also
requested to submit a valid declaration for non-deduction of zakat.
The shareholders who have joint shareholdings held by Filers and Non-Filers shall be dealt with
separately and in such particular situation, each account holder is to be treated as either a Filer
or a Non-Filer and tax will be deducted according to his shareholding. If the shares are not
ascertainable then each account holder will be assumed to hold equal proportion of shares and
the deduction will be made accordingly. Therefore, in order to avoid deduction of tax at a higher
rate, the joint account holders are requested to provide the below details of their shareholding
to the Share Registrar of the Company.
4.
30
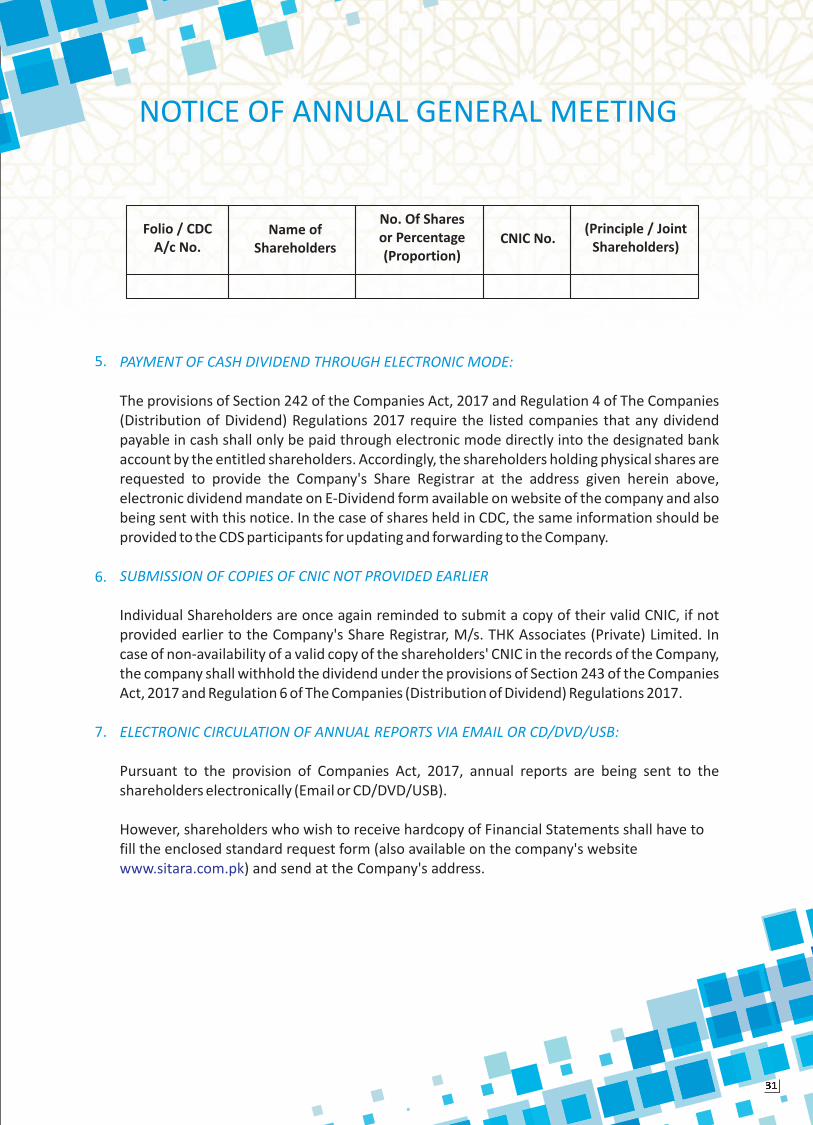
PAYMENT OF CASH DIVIDEND THROUGH ELECTRONIC MODE:
SUBMISSION OF COPIES OF CNIC NOT PROVIDED EARLIER
ELECTRONIC CIRCULATION OF ANNUAL REPORTS VIA EMAIL OR CD/DVD/USB:
The provisions of Section 242 of the Companies Act, 2017 and Regulation 4 of The Companies
(Distribution of Dividend) Regulations 2017 require the listed companies that any dividend
payable in cash shall only be paid through electronic mode directly into the designated bank
account by the entitled shareholders. Accordingly, the shareholders holding physical shares are
requested to provide the Company's Share Registrar at the address given herein above,
electronic dividend mandate on E-Dividend form available on website of the company and also
being sent with this notice. In the case of shares held in CDC, the same information should be
provided to the CDS participants for updating and forwarding to the Company.
Individual Shareholders are once again reminded to submit a copy of their valid CNIC, if not
provided earlier to the Company's Share Registrar, M/s. THK Associates (Private) Limited. In
case of non-availability of a valid copy of the shareholders' CNIC in the records of the Company,
the company shall withhold the dividend under the provisions of Section 243 of the Companies
Act, 2017 and Regulation 6 of The Companies (Distribution of Dividend) Regulations 2017.
Pursuant to the provision of Companies Act, 2017, annual reports are being sent to the
shareholders electronically (Email or CD/DVD/USB).
However, shareholders who wish to receive hardcopy of Financial Statements shall have to
fill the enclosed standard request form (also available on the company's website
) and send at the Company's address.www.sitara.com.pk
5.
6.
7.
Folio / CDC
A/c No.
Name of
Shareholders
No. Of Shares
or Percentage
(Proportion)
CNIC No.(Principle / Joint
Shareholders)
NOTICE OF ANNUAL GENERAL MEETING
31
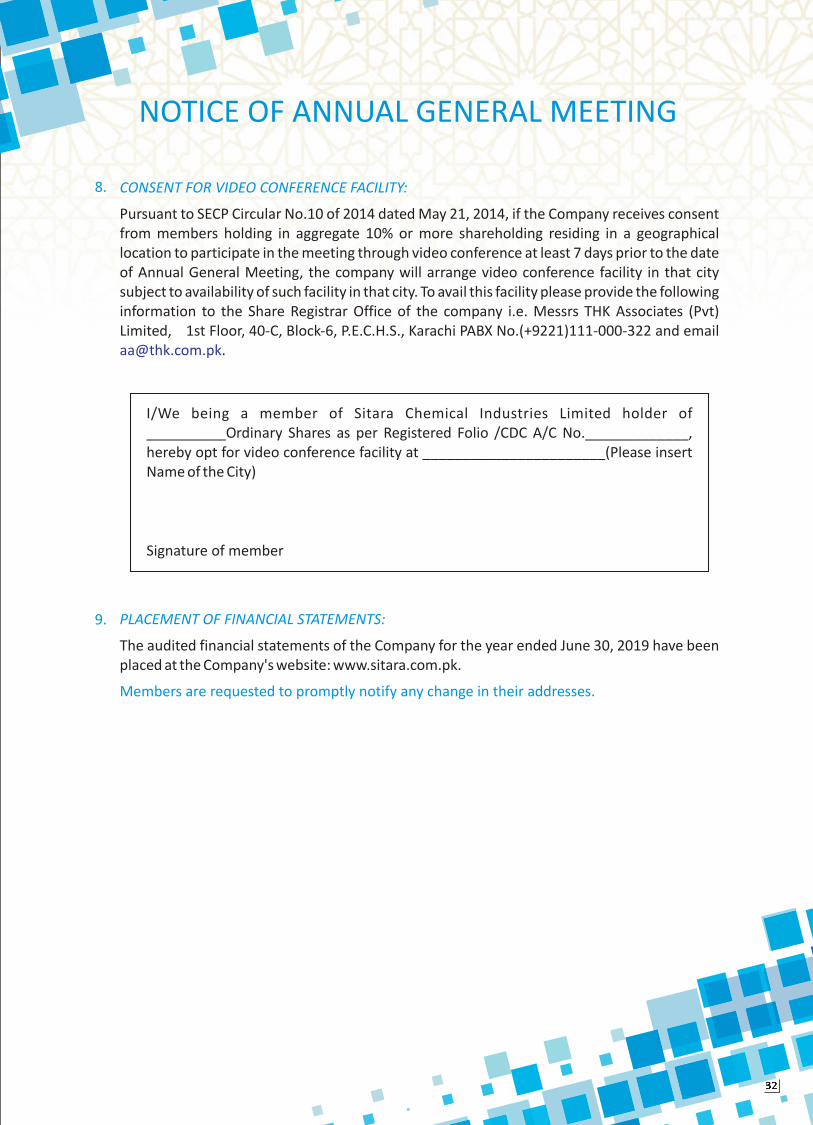
CONSENT FOR VIDEO CONFERENCE FACILITY:
Pursuant to SECP Circular No.10 of 2014 dated May 21, 2014, if the Company receives consent
from members holding in aggregate 10% or more shareholding residing in a geographical
location to participate in the meeting through video conference at least 7 days prior to the date
of Annual General Meeting, the company will arrange video conference facility in that city
subject to availability of such facility in that city. To avail this facility please provide the following
information to the Share Registrar Office of the company i.e. Messrs THK Associates (Pvt)
Limited, 1st Floor, 40-C, Block-6, P.E.C.H.S., Karachi PABX No.(+9221)111-000-322 and email
8.
NOTICE OF ANNUAL GENERAL MEETING
PLACEMENT OF FINANCIAL STATEMENTS:
Members are requested to promptly notify any change in their addresses.
The audited financial statements of the Company for the year ended June 30, 2019 have been
placed at the Company's website: www.sitara.com.pk.
I/We being a member of Sitara Chemical Industries Limited holder of
__________Ordinary Shares as per Registered Folio /CDC A/C No._____________,
hereby opt for video conference facility at _______________________(Please insert
Name of the City)
Signature of member
9.
32
AUDITORS’
REPORT
&
FINANCIAL
STATEMENTS
2019

Deloitte
Opinion
Basis for Opinion
Key Audit Matters
We have audited the annexed financial statements of Sitara Chemical Industries Limited (the Company)
which comprise the statement of financial position as at June 30, 2019, and the statement of profit or
loss, statement of comprehensive income, the statement of changes in equity, the statement of cash
flows for the year then ended, and notes to the financial statements including a summary of significant
accounting policies and other explanatory information, and we state that we have obtained all the
information and explanations which, to the best of our knowledge and belief, were necessary for the
purposes of the audit.
In our opinion and to the best of our information and according to the explanations given to us, the
statement of financial position, statement of profit or loss, statement of comprehensive income, the
statement of changes in equity and the statement of cash flows together with the notes forming part
thereof conform with the accounting and reporting standards as applicable in Pakistan and give the
information required by the Companies Act, 2017 (XIX of 2017), in the manner so required and
respectively give a true and fair view of the state of the Company's affairs as at June 30, 2019 and of the
profit and comprehensive income, the changes in equity and its cash flows for the year then ended.
We conducted our audit in accordance with International Standards on Auditing (ISAs) as applicable in
Pakistan. Our responsibilities under those standards are further described in the
section of our report We are independent of
the Company in accordance with the International Ethics Standards Board for Accountants'
as adopted by the Institute of Chartered Accountants of Pakistan
(the Code) and we have fulfilled our other ethical responsibilities in accordance with the Code. We
believe that the audit evidence we have obtained is sufficient and appropriate to provide a basis for our
opinion.
Key audit matters are those matters that, in our professional judgment, were of most significance in our
audit of the financial statements of the current period. These matters were addressed in the context of
our audit of the financial statements as a whole, and in forming our opinion thereon, and we do not
provide a separate opinion on these matters.
Auditor's
Responsibilities for the Audit of the Financial Statements .
Code of
Ethics for Professional Accountants
INDEPENDENT AUDITOR'S REPORTTo the Members
Report on the Audit of the Financial Statements
The Company's sales comprise of revenue from
the sale of chemicals and textiles (note 28) to the
financial statements.
Revenue from sale of goods is recognized at the
point in time when control of the goods is
transferred to the customer, generally on delivery
of the goods and at transaction price net of trade
discounts (note 4.17).
Following are the Key audit matter(s):
Key audit matter
Revenue Recognition
How the matter was addressed in our audit
Our audit procedures to address the Key Audit
Matter included the following:
· Obtaining an understanding of and assessing
the design, implementation and operating
effectiveness of controls over recognition of
revenue;
34

We identified revenue recognition as key audit
matter as it is one of the key performance
indicators of the Company and because of the
potential risk that revenue transactions may not
have been recognized based on transfer of risk
and rewards to the customers in line with the
accounting policy adopted and may not have
been recognized in the appropriate period.
· Assessing the appropriateness of the
Company's accounting policies for
revenue recognition and compliance of
those policies with the accounting
standards;
· Checked on sample basis whether the
recorded sales transactions are based on
transfer of control of goods to the
customer, satisfying the performance
obligation and were recorded in the
appropriate accounting period.
Reviewing the adequacy of disclosure as
required under applicable financial
reporting framework.
We reviewed and understood the requirements ofthe IFRS 9. Our audit procedures included thefollowing:
· Considered the management's process toassess the impact of adoption of IFRS 9 onthe Company's financial statements.
· Reviewed the appropriateness of theassumptions used, the methodology andpolicies applied to assess the ECL in respectof financial assets of the Company.
· Reviewed the working of management forexpected credit losses.
We reviewed and assessed the impact anddisclosures made in the financialstatements with regard to the effect ofadoption of IFRS 9.
IFRS 9 'Financial Instruments' is effective for theCompany for the first time during the current yearand replaces the financial instruments standard IAS39 'Financial Instruments: Recognition andMeasurement'.
In relation to financial assets, IFRS 9 requires therecognition of expected credit losses ('ECL') ratherthan incurred credit losses under IAS 39 and istherefore a fundamentally different approach.Management is required to determine theexpected credit loss that may occur over either a12-month period or the remaining life of financialasset, depending on the categorization of theindividual asset.
In accordance with IFRS 9, the measurement of ECLreflect a range of unbiased and probabilityweighted outcomes, time value of money,reasonable and supportable information based onthe consideration of historical events, currentconditions and forecasts of future economicconditions.
The Company has adopted IFRS 9 using the allowedmodified retrospective approach and recognizedexpected credit loss of Rs 40.36 million net of tax inopening retained earnings as at July 1, 2018 and Rs25.78 million for year ended June 30, 2019.
We considered this as key audit matter due to thesignificant amounts involved and significantjudgments made by management regarding thematter.
Adoption of IFRS 9 “Financial Instruments”
Deloitte
35

Information Other than the Financial Statements and Auditor's Report Thereon
Management is responsible for the other information. The other information comprises the information
included in the Annual report, but does not include the financial statements and our auditor's report
thereon.
Our opinion on the financial statements does not cover the other information and we do not express any
form of assurance opinion thereon.
In connection with our audit of the financial statements, our responsibility is to read the other information
and, in doing so, consider whether the other information is materially inconsistent with the financial
statements or our knowledge obtained in the audit, or otherwise appears to be materially misstated. If,
based on the work we have performed, we conclude that there is a material misstatement of this other
information when available, we are required to report that fact.
Responsibilities of Management and Board of Directors for the Financial Statements
Management is responsible for the preparation and fair presentation of the financial statements in
accordance with the accounting and reporting standards as applicable in Pakistan and the requirements of
Companies Act, 2017 (XIX of 2017) and for such internal control as management determines is necessary to
enable the preparation of financial statements that are free from material misstatement, whether due to
fraud or error.
In preparing the financial statements, management is responsible for assessing the Company's ability to
continue as a going concern, disclosing, as applicable, matters related to going concern and using the going
concern basis of accounting unless management either intends to liquidate the Company or to cease
operations, or has no realistic alternative but to do so.
Board of Directors are responsible for overseeing the Company's financial reporting process.
Auditor's Responsibilities for the Audit of the Financial Statements
Our objectives are to obtain reasonable assurance about whether the financial statements as a whole are
free from material misstatement, whether due to fraud or error, and to issue an auditor's report that
includes our opinion. Reasonable assurance is a high level of assurance, but is not a guarantee that an audit
conducted in accordance with ISAs as applicable in Pakistan will always detect a material misstatement
when it exists. Misstatements can arise from fraud or error and are considered material if, individually or in
aggregate, they could reasonably be expected to influence the economic decisions of users taken on the
basis of these financial statements.
As part of an audit in accordance with ISAs as applicable in Pakistan, we exercise professional judgment and
maintain professional skepticism throughout the audit. We also:
Identify and assess the risks of material misstatement of the financial statements, whether due to
fraud or error, design and perform audit procedures responsive to those risks, and obtain audit
evidence that is sufficient and appropriate to provide a basis for our opinion. The risk of not detecting a
material misstatement resulting from fraud is higher than for one resulting from error, as fraud may
involve collusion, forgery, intentional omissions, misrepresentations, or the override of internal
control.
Obtain an understanding of internal control relevant to the audit in order to design audit procedures
that are appropriate in the circumstances, but not for the purpose of expressing an opinion on the
effectiveness of the Company's internal control.
Evaluate the appropriateness of accounting policies used and the reasonableness of accounting
estimates and related disclosures made by management.
Deloitte
36

Chartered Accountants
Engagement Partner:
Rana M. Usman Khan
Lahore
Date: September 19, 2019
We communicate with the board of directors regarding, among other matters, the planned scope and timing
of audit and significant audit findings, including any significant deficiencies in internal control that we
identify during our audit.
We also provide the board of directors with a statement that we have complied with relevant ethical
requirements regarding independence, and to communicate with them all relationships and other matters
that may reasonably be thought to bear on our independence, and where applicable, related safeguards.
From the matters communicated with the board of directors, we determine those matters that were of most
significance in the audit of the financial statements of the current period and are therefore the key audit
matters. We describe these matters in our auditor's report unless law or regulation precludes public
disclosure about the matter or when, in extremely rare circumstances, we determine that a matter should
not be communicated in our report because the adverse consequences of doing so would reasonably be
expected to outweigh the public interest benefits of such communication.
Report on Other Legal and Regulatory Requirements
Based on our audit, we further report that in our opinion:
proper books of account have been kept by the Company as required by the Companies Act,
2017 (XIX of 2017);
the statement of financial position, the statement of profit or loss, statement of comprehensive
Income, the statement of changes in equity and the statement of cash flows together with the
notes thereon have been drawn up in conformity with the Companies Act, 2017 (XIX of 2017) a n d
are in agreement with the books of account and returns;
investments made, expenditure incurred and guarantees extended during the year were for the
purpose of the Company's business; and
zakat deductible at source under the Zakat and Ushr Ordinance, 1980 (XVIII of 1980), was
deducted by the Company and deposited in the Central Zakat Fund established under section 7 of
that Ordinance.
The engagement partner on the audit resulting in this independent auditor's report is Rana M. Usman Khan.
a)
b)
c)
d)
Conclude on the appropriateness of management's use of the going concern basis of accounting and,
based on audit evidence obtained, whether a material uncertainty exists related to events or
conditions that may cast significant doubt on the Company's ability to continue as a going concern. If
we conclude that a material uncertainty exists, we are required to draw attention in our auditor's
report to the related disclosures in the financial statements or, if such disclosures are inadequate, to
modify our opinion. Our conclusions are based on the audit evidence obtained up to date of our
auditor's report. However, future events or conditions may cause the Company to cease to continue as
a going concern.
Evaluate the overall presentation, structure and content of the financial statements, including the
disclosures, and whether the financial statements represent the underlying transactions and events in
a manner that achieves fair presentation.
Deloitte
37
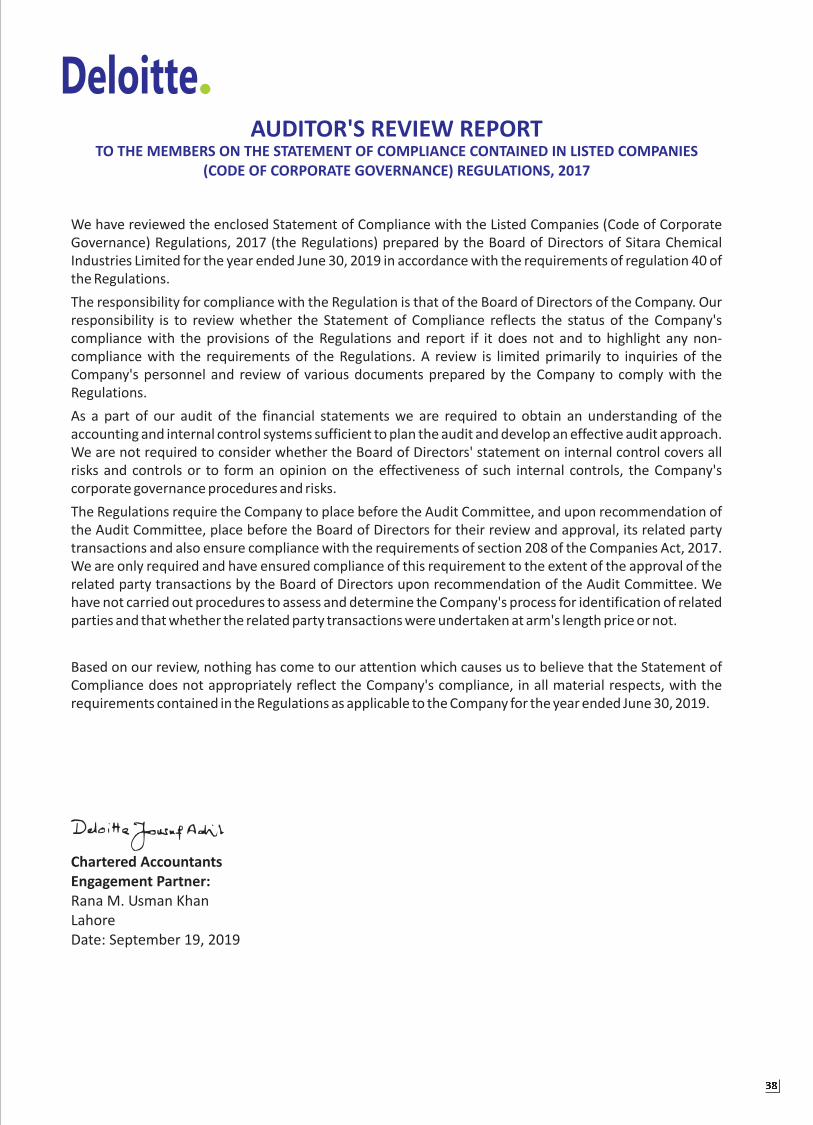
We have reviewed the enclosed Statement of Compliance with the Listed Companies (Code of Corporate
Governance) Regulations, 2017 (the Regulations) prepared by the Board of Directors of Sitara Chemical
Industries Limited for the year ended June 30, 2019 in accordance with the requirements of regulation 40 of
the Regulations.
The responsibility for compliance with the Regulation is that of the Board of Directors of the Company. Our
responsibility is to review whether the Statement of Compliance reflects the status of the Company's
compliance with the provisions of the Regulations and report if it does not and to highlight any non-
compliance with the requirements of the Regulations. A review is limited primarily to inquiries of the
Company's personnel and review of various documents prepared by the Company to comply with the
Regulations.
As a part of our audit of the financial statements we are required to obtain an understanding of the
accounting and internal control systems sufficient to plan the audit and develop an effective audit approach.
We are not required to consider whether the Board of Directors' statement on internal control covers all
risks and controls or to form an opinion on the effectiveness of such internal controls, the Company's
corporate governance procedures and risks.
The Regulations require the Company to place before the Audit Committee, and upon recommendation of
the Audit Committee, place before the Board of Directors for their review and approval, its related party
transactions and also ensure compliance with the requirements of section 208 of the Companies Act, 2017.
We are only required and have ensured compliance of this requirement to the extent of the approval of the
related party transactions by the Board of Directors upon recommendation of the Audit Committee. We
have not carried out procedures to assess and determine the Company's process for identification of related
parties and that whether the related party transactions were undertaken at arm's length price or not.
Based on our review, nothing has come to our attention which causes us to believe that the Statement of
Compliance does not appropriately reflect the Company's compliance, in all material respects, with the
requirements contained in the Regulations as applicable to the Company for the year ended June 30, 2019.
AUDITOR'S REVIEW REPORTTO THE MEMBERS ON THE STATEMENT OF COMPLIANCE CONTAINED IN LISTED COMPANIES
(CODE OF CORPORATE GOVERNANCE) REGULATIONS, 2017
Chartered Accountants
Engagement Partner:
Rana M. Usman Khan
Lahore
Date: September 19, 2019
Deloitte
38

Introduction
Applicable Criteria
(a)
(b)
(c)
(d)
(e)
Management's Responsibility for Shariah Compliance
Our Independence and Quality Control
We have undertaken a reasonable assurance engagement that the Securities and Exchange
Commission of Pakistan (the Commission) has required in terms of its Shariah Governance
Regulations, 2018 (the Regulations) for assessing compliance of the Sitara Chemical Industries
Limited's (the Company's) financial arrangements, contracts and transactions having Shariah
implications with the Shariah principles (criteria specified in paragraph 2 below) for the period
from March 14, 2019 to June 30, 2019.
The criteria for the assurance engagement as per the Regulations, against which the underlying
subject matter (financial arrangements, contracts and transactions having Shariah implications for
the period from March 14, 2019 to June 30, 2019) is assessed, comprise the following:
rules, regulations and directives issued by the Commission from time to time;
pronouncements of Shariah Advisory Board;
Shariah Standards issued by the Accounting and Auditing Organization for Islamic Financial
Institutions, as adopted by the Commission, if any;
requirements of the applicable Islamic Financial Accounting Standards as notified by the
Commission, if any; and
approvals and rulings given by the Shariah Advisor of the Company in line with the
Regulations and in accordance with the rulings of Shariah Advisory Board.
The above criteria were evaluated for the implications on the financial statements of the Company
for the year ended June 30, 2019.
The Company's management is responsible to ensure that the financial arrangements, contracts
and transactions having Shariah implications, entered into by the Company and related policies
and procedures are in compliance with Shariah principles (criteria specified in paragraph 2 above).
The management is also responsible for design, implementation and maintenance of appropriate
internal control procedures with respect to such compliance and maintenance of relevant
accounting records.
We are independent of the Company in accordance with the International Ethics Standards Board
for Accountants' Code of Ethics for Professional Accountants as adopted by the Institute of
Chartered Accountants of Pakistan (the Code) and we have fulfilled our other ethical
responsibilities in accordance with the Code. Our opinion on the financial statements does not
cover the other information and we do not express any form of assurance opinion thereon.
ASSURANCE REPORT ON COMPLIANCE WITH THE
SHARIAH GOVERNANCE REGULATIONS, 2018To the Board of Directors
1.
2.
3.
4.
Deloitte
39
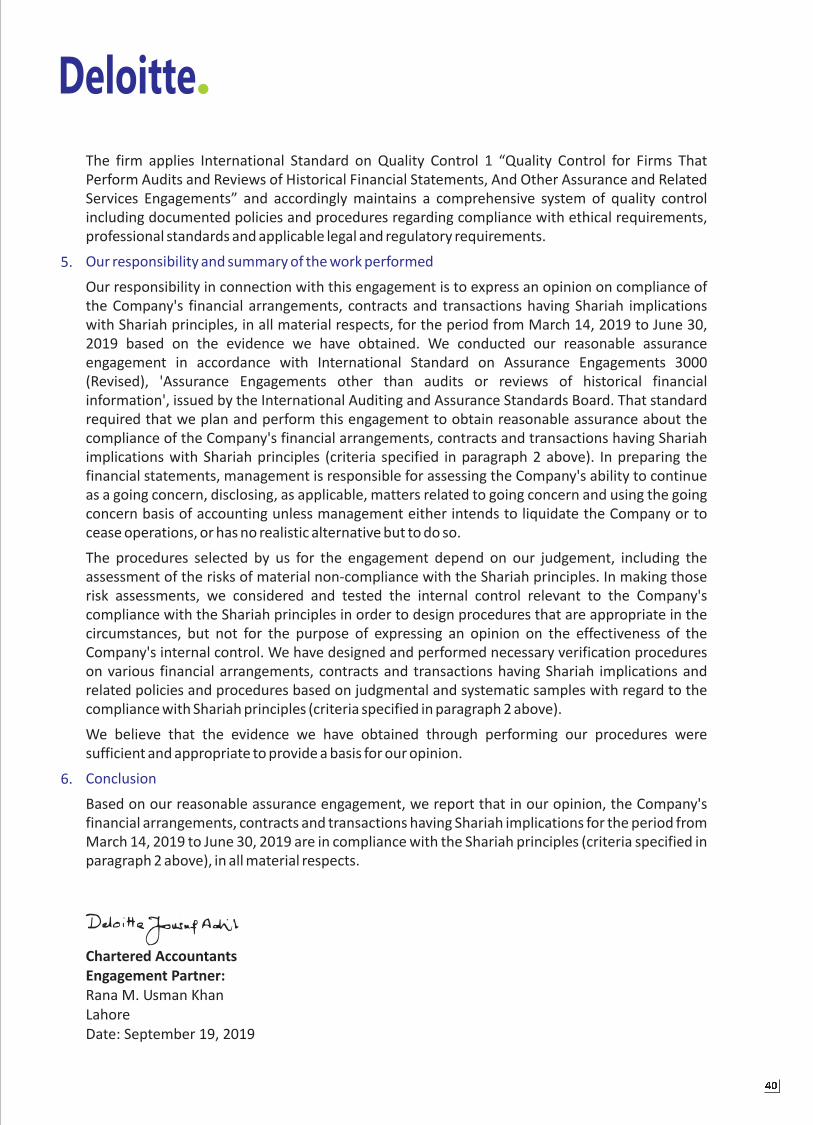
The firm applies International Standard on Quality Control 1 “Quality Control for Firms That
Perform Audits and Reviews of Historical Financial Statements, And Other Assurance and Related
Services Engagements” and accordingly maintains a comprehensive system of quality control
including documented policies and procedures regarding compliance with ethical requirements,
professional standards and applicable legal and regulatory requirements.
Our responsibility in connection with this engagement is to express an opinion on compliance of
the Company's financial arrangements, contracts and transactions having Shariah implications
with Shariah principles, in all material respects, for the period from March 14, 2019 to June 30,
2019 based on the evidence we have obtained. We conducted our reasonable assurance
engagement in accordance with International Standard on Assurance Engagements 3000
(Revised), 'Assurance Engagements other than audits or reviews of historical financial
information', issued by the International Auditing and Assurance Standards Board. That standard
required that we plan and perform this engagement to obtain reasonable assurance about the
compliance of the Company's financial arrangements, contracts and transactions having Shariah
implications with Shariah principles (criteria specified in paragraph 2 above). In preparing the
financial statements, management is responsible for assessing the Company's ability to continue
as a going concern, disclosing, as applicable, matters related to going concern and using the going
concern basis of accounting unless management either intends to liquidate the Company or to
cease operations, or has no realistic alternative but to do so.
The procedures selected by us for the engagement depend on our judgement, including the
assessment of the risks of material non-compliance with the Shariah principles. In making those
risk assessments, we considered and tested the internal control relevant to the Company's
compliance with the Shariah principles in order to design procedures that are appropriate in the
circumstances, but not for the purpose of expressing an opinion on the effectiveness of the
Company's internal control. We have designed and performed necessary verification procedures
on various financial arrangements, contracts and transactions having Shariah implications and
related policies and procedures based on judgmental and systematic samples with regard to the
compliance with Shariah principles (criteria specified in paragraph 2 above).
We believe that the evidence we have obtained through performing our procedures were
sufficient and appropriate to provide a basis for our opinion.
Based on our reasonable assurance engagement, we report that in our opinion, the Company's
financial arrangements, contracts and transactions having Shariah implications for the period from
March 14, 2019 to June 30, 2019 are in compliance with the Shariah principles (criteria specified in
paragraph 2 above), in all material respects.
Our responsibility and summary of the work performed
Conclusion
5.
6.
Chartered Accountants
Engagement Partner:
Rana M. Usman Khan
Lahore
Date: September 19, 2019
Deloitte
40
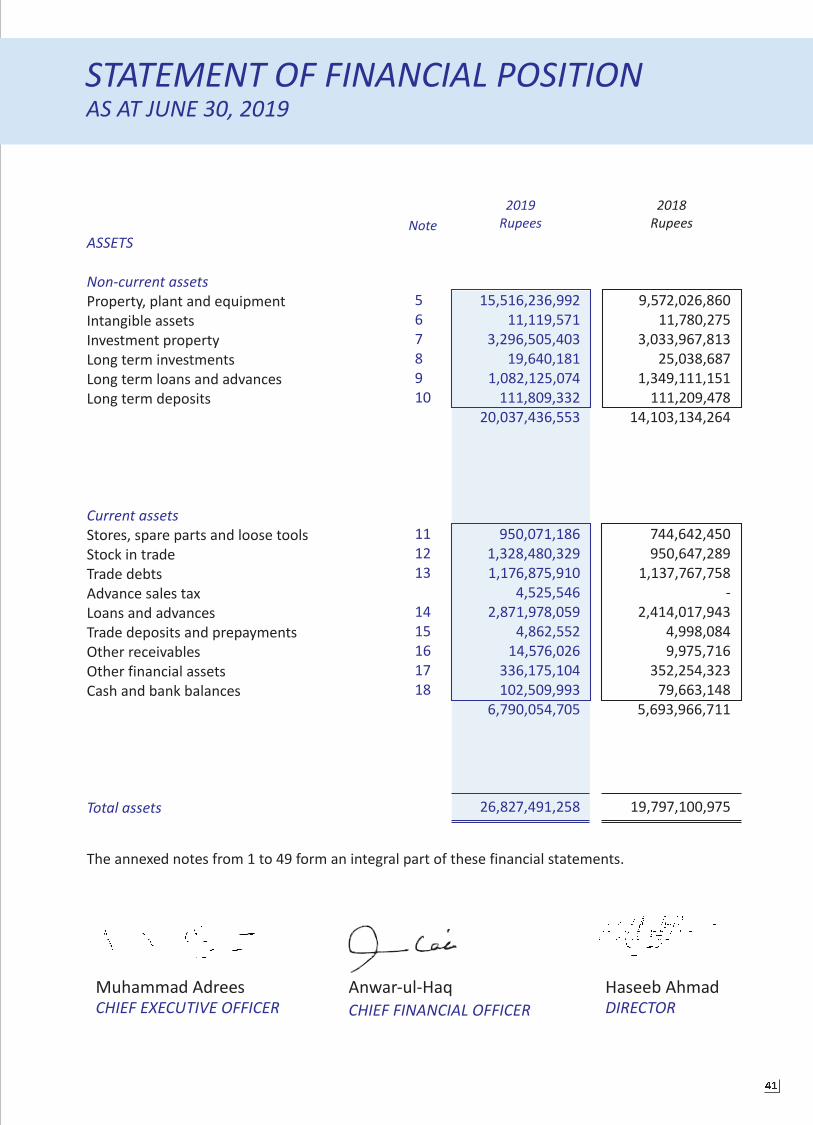
2019
Rupees
2018
RupeesNote
ASSETS
Non-current assets
Current assets
Total assets
Property, plant and equipment
Intangible assets
Investment property
Long term investments
Long term loans and advances
Long term deposits
Stores, spare parts and loose tools
Stock in trade
Trade debts
Advance sales tax
Loans and advances
Trade deposits and prepayments
Other receivables
Other financial assets
Cash and bank balances
5
6
7
8
9
10
11
12
13
14
15
16
17
18
CHIEF EXECUTIVE OFFICER DIRECTOR
Haseeb AhmadMuhammad Adrees Anwar-ul-Haq
CHIEF FINANCIAL OFFICER
15,516,236,992
11,119,571
3,296,505,403
19,640,181
1,082,125,074
111,809,332
20,037,436,553
950,071,186
1,328,480,329
1,176,875,910
4,525,546
2,871,978,059
4,862,552
14,576,026
336,175,104
102,509,993
6,790,054,705
26,827,491,258
9,572,026,860
11,780,275
3,033,967,813
25,038,687
1,349,111,151
111,209,478
14,103,134,264
744,642,450
950,647,289
1,137,767,758
-
2,414,017,943
4,998,084
9,975,716
352,254,323
79,663,148
5,693,966,711
19,797,100,975
The annexed notes from 1 to 49 form an integral part of these financial statements.
AS AT JUNE 30, 2019
STATEMENT OF FINANCIAL POSITION
41

CHIEF EXECUTIVE OFFICER DIRECTOR
Haseeb AhmadMuhammad Adrees Anwar-ul-Haq
CHIEF FINANCIAL OFFICER
2019
Rupees
2018
RupeesNote
EQUITY AND LIABILITIES
Share capital and reserves
Total equity
LIABILITIES
Non-current liabilities
Current liabilities
Contingencies and commitments
Total equity and liabilities
Share capital
Reserves
Unappropriated profit
Surplus on revaluation of property,
plant and equipment
Long term financing
Long term deposits
Deferred liabilities
Trade and other payables
Sales tax payable
Profit / financial charges payable
Short term borrowings
Unclaimed dividend
Current portion of long term financing
19
20
21
22
23
24
25
26
21
27
214,294,070
1,369,324,352
8,522,363,987
4,513,641,059
14,619,623,468
2,054,446,636
39,787,093
2,436,000,612
4,530,234,341
2,416,097,017
-
186,353,883
4,333,342,248
19,823,931
722,016,370
7,677,633,449
26,827,491,258
214,294,070
1,365,496,630
7,892,906,389
1,164,730,520
10,637,427,609
1,174,946,885
30,442,791
1,183,897,453
2,389,287,129
2,293,218,533
8,498,670
76,973,355
3,525,026,677
21,775,238
844,893,764
6,770,386,237
19,797,100,975
The annexed notes from 1 to 49 form an integral part of these financial statements.
AS AT JUNE 30, 2019 - continued
STATEMENT OF FINANCIAL POSITION
42
Haseeb AhmadMuhammad Adrees Anwar-ul-Haq
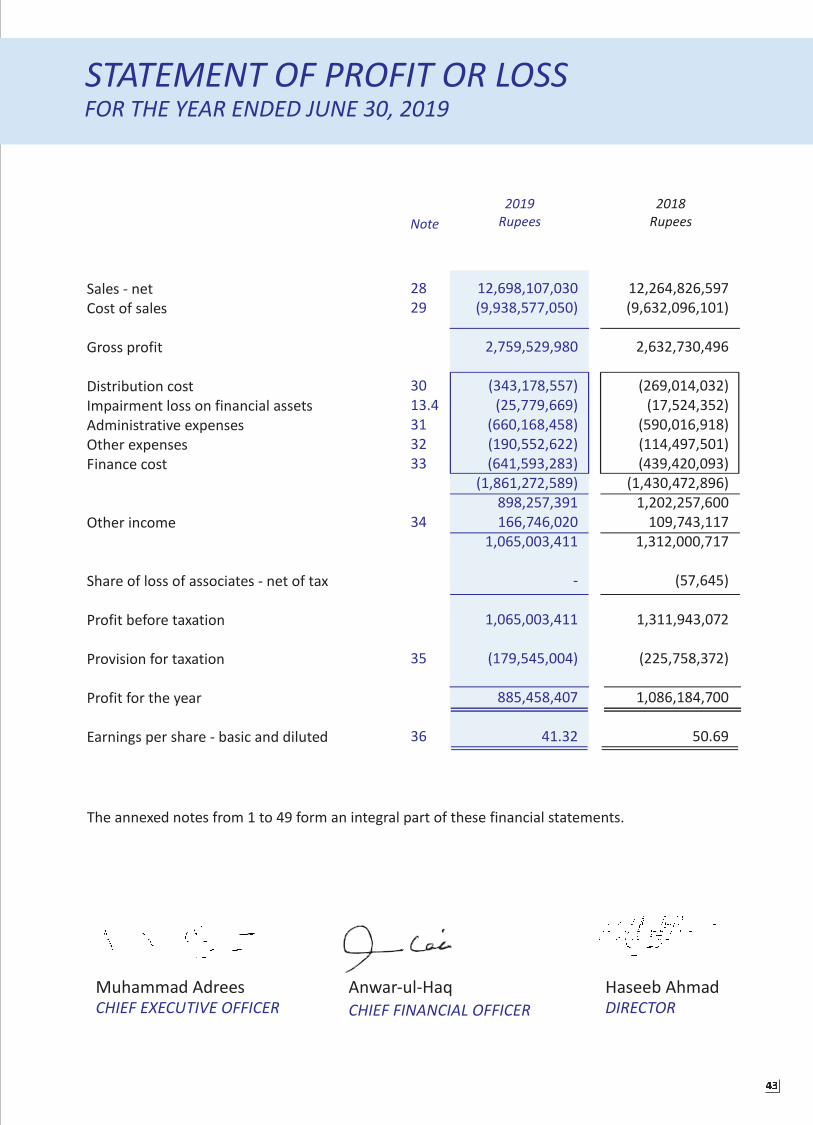
28
29
30
13.4
31
32
33
34
35
36
Sales - net
Cost of sales
Gross profit
Distribution cost
Impairment loss on financial assets
Administrative expenses
Other expenses
Finance cost
Other income
Share of loss of associates - net of tax
Profit before taxation
Provision for taxation
Profit for the year
Earnings per share - basic and diluted
12,698,107,030
(9,938,577,050)
2,759,529,980
(343,178,557)
(25,779,669)
(660,168,458)
(190,552,622)
(641,593,283)
(1,861,272,589)
898,257,391
166,746,020
1,065,003,411
-
1,065,003,411
(179,545,004)
885,458,407
41.32
The annexed notes from 1 to 49 form an integral part of these financial statements.
2019
Rupees
2018
RupeesNote
12,264,826,597
(9,632,096,101)
2,632,730,496
(269,014,032)
(17,524,352)
(590,016,918)
(114,497,501)
(439,420,093)
(1,430,472,896)
1,202,257,600
109,743,117
1,312,000,717
(57,645)
1,311,943,072
(225,758,372)
1,086,184,700
50.69
STATEMENT OF PROFIT OR LOSSFOR THE YEAR ENDED JUNE 30, 2019
CHIEF EXECUTIVE OFFICER DIRECTORCHIEF FINANCIAL OFFICER
43

CHIEF EXECUTIVE OFFICER DIRECTOR
Haseeb AhmadMuhammad Adrees Anwar-ul-Haq
CHIEF FINANCIAL OFFICER
Profit for the year
Loss on re-measurement of available
for sale investments to fair value
Reclassification adjustments relating to available for
sale investments disposed off during the year
Re measurement of post retirement benefits obligation
Deferred tax impact of re measurement of
post retirement benefits obligation
Loss on re-measurement of equity instruments as at FVTOCI
Surplus on revaluation of property, plant and equipment
Deferred tax impact of surplus on revaluation
Surplus on disposals of equity instruments as at FVTOCI
Total items that will not be reclassified to profit or loss
Total comprehensive income for the year
Items that may be reclassified subsequently
to profit or loss:
Items that will not be reclassified to profit or loss:
Total items that may be reclassified subsequently
to profit or loss
The annexed notes from 1 to 49 form an integral part of these financial statements.
2019
Rupees
2018
RupeesNote
885,458,407
-
-
-
3,790,916
(1,067,344)
(673,131)
4,549,908,889
(1,140,933,702)
4,657,305
3,415,682,933
4,301,141,340
1,086,184,700
(36,122,234)
(173,345)
(36,295,579)
(1,443,416)
418,591
-
-
-
-
(1,024,825)
1,048,864,296
FOR THE YEAR ENDED JUNE 30, 2019
STATEMENT OF COMPREHENSIVE INCOME
23.3
44

CHIEF EXECUTIVE OFFICER DIRECTOR
Haseeb AhmadMuhammad Adrees Anwar-ul-Haq
CHIEF FINANCIAL OFFICER
FOR THE YEAR ENDED JUNE 30, 2019
A. CASH FLOWS FROM OPERATING ACTIVITIES
Profit before taxation
Adjustments for:
Depreciation on property, plant and equipment
Depreciation on investment property
Amortization on intangible assets
Finance cost
Share of loss from associate - net of tax
Loss / (Gain) on disposal of property, plant and equipment
Gain on disposal of investment property
Gain on sale of investments measured at FVTPL
Loss on deemed disposal on investment in associate
Exchange gain
Provision for employee benefits
Impairment loss on financial assets
Impairment of long term investments
Unwinding of discount on deferred consideration due
Markup on bank deposits
Dividend income
Operating cash flows before changes in working capital
Working capital changes
Cash generated from operations
Finance cost paid
Employee benefits paid
Taxes paid
Net cash generated from operating activities
2019
Rupees
2018
RupeesNote
1,065,003,411
967,587,086
4,786,380
1,210,960
641,593,283
-
106,222,607
-
(4,192,819)
-
(6,299,133)
11,071,307
25,779,669
5,398,506
(97,706,782)
(7,567,793)
(7,113,259)
2,705,773,423
(327,185,656)
2,378,587,767
(532,212,755)
(9,053,170)
(426,948,352)
(968,214,277)
1,410,373,490
1,311,943,072
922,250,616
6,802,534
1,308,920
439,420,093
57,645
(3,396,397)
(30,529,200)
(491,350)
6,483,027
(5,621,511)
9,490,011
17,524,352
-
-
(8,229,608)
(6,340,705)
2,660,671,499
(182,410,798)
2,478,260,701
(444,666,492)
(5,610,468)
(411,714,096)
(861,991,056)
1,616,269,645
42
STATEMENT OF CASH FLOWS
45

CHIEF EXECUTIVE OFFICER DIRECTOR
Haseeb AhmadMuhammad Adrees Anwar-ul-Haq
CHIEF FINANCIAL OFFICER
FOR THE YEAR ENDED JUNE 30, 2019 - continued
2019
Rupees
2018
RupeesNote
B. CASH FLOWS FROM INVESTING ACTIVITIES
Proceeds from disposal of property, plant and equipment
Proceeds from disposal of other financial assets
Additions to property, plant and equipment including
capital work in progress
Additions to intangibles
Purchase of other financial assets
Purchase of investment property
Advance received on sale of investment property
Long-term loans and advances
Long term deposits paid
Dividend received
Profit received
Net cash used in investing activities
44,194,260
557,733,541
(2,512,305,196)
(550,256)
(533,477,329)
(267,323,970)
-
16,372,465
(599,854)
7,113,259
7,567,793
(2,681,275,287)
6,006,197
2,770,350
(1,083,772,012)
-
(115,945,982)
(155,250,152)
438,000,000
(72,258,212)
-
6,340,705
8,229,608
(965,879,498)
C. CASH FLOWS FROM FINANCING ACTIVITIES
Proceeds from long term financing
Payment of long term financing
Short term borrowings-net
Long term deposits
Dividend paid
Net cash generated / (used in) from financing activities
Net increase / (decrease) in cash and cash equivalents (A+B+C)
Cash and cash equivalents at beginning of the year
Cash and cash equivalents at end of the year
1,570,266,122
(813,643,765)
808,315,571
9,344,302
(280,533,588)
1,293,748,642
22,846,845
79,663,148
102,509,993
-
(995,196,012)
548,856,933
6,700,000
(262,089,951)
(701,729,030)
(51,338,883)
131,002,031
79,663,148
The annexed notes from 1 to 49 form an integral part of these financial statements.
18
STATEMENT OF CASH FLOWS
46

FOR THE YEAR ENDED JUNE 30, 2019
CHIEF EXECUTIVE OFFICER DIRECTORHaseeb AhmadMuhammad Adrees Anwar-ul-Haq
CHIEF FINANCIAL OFFICER
Profit for the year
Other comprehensive income during the year- net of tax
Remeasurement of post retirement benefits - net of tax
Transfer to un-appropriated profit on account of incremental
depreciation - net of tax
Revaluation surplus on property, plant and equipment
adjustment due to change in tax rate
Final dividend for the year ended
June 30, 2017 @ Rs. 12.5 per share
Balance at July 01, 2017 - restated
Total comprehensive income
Other comprehensive income
Total other comprehensive income
Total comprehensive income
Transactions with owners
Balance as at June 30, 2018
214,294,070
-
-
-
-
-
-
-
-
214,294,070
97,490,410
-
-
-
-
-
-
-
-
97,490,410
86,640,526
-
(36,295,579)
-
(36,295,579)
(36,295,579)
-
-
-
50,344,947
(6,313,902)
-
-
(1,024,825)
(1,024,825)
(1,024,825)
-
-
-
(7,338,727)
1,226,133,404
-
-
-
-
-
(66,738,501)
5,335,617
-
1,164,730,520
1,225,000,000
-
-
-
-
-
-
-
-
1,225,000,000
7,007,851,217
1,086,184,700
-
-
-
1,086,184,700
66,738,501
-
(267,868,029)
7,892,906,389
9,851,095,725
1,086,184,700
(36,295,579)
(1,024,825)
(37,320,404)
1,048,864,296
-
5,335,617
(267,868,029)
10,637,427,609
The annexed notes from 1 to 49 form an integral part of these financial statements.
Share
capital
Share
premium
Reserve onre-measurement on
post retirementbenefits obligation
- net of tax
Capital reserves Revenue reserves
General
reserve
Un-
appropriated
profitTotal
Surplus onrevaluation of
property,plant and
equipment
Reserve on re-measurement
of equityinstrumentsas at FVTOCI
Balance as at July 01, 2018 (earlier reported)
Impact of change in accounting
policy- IFRS 9 (net of tax) (Note 5.2)
Impact of reclassification of available for sale investment
to investment measured at FVTPL - IFRS 9
Adjusted balance as at July 01, 2018
Total comprehensive income
Other comprehensive income
Total other comprehensive income
Total comprehensive income
Transactions with owners
Balance as at June 30, 2019
Profit for the year
Other comprehensive income during the year- net of tax
Surplus on re-measurement of equity
instruments as at FVTOCI to fair value
Surplus on disposals of equity instruments
as at FVTOCI
Remeasurement of post retirement benefits - net of tax
Transfer to unappropriated profit on account of
incremental depreciation - net of tax
Revaluation surplus on property, plant and equipment
adjustment due to change in tax rate
Final dividend for the year ended June
30, 2018 @ Rs. 13 per share
214,294,070
-
-
214,294,070
-
-
-
-
-
-
-
-
-
-
214,294,070
97,490,410
-
-
97,490,410
-
-
-
-
-
-
-
-
-
-
97,490,410
50,344,947
-
(2,880,024)
47,464,923
-
-
(673,131)
4,657,305
-
3,984,174
3,984,174
-
-
-
51,449,097
(7,338,727)
-
-
(7,338,727)
-
-
-
-
2,723,572
2,723,572
2,723,572
-
-
-
(4,615,155)
1,164,730,520
-
-
1,164,730,520
-
3,408,975,187
-
-
-
3,408,975,187
3,408,975,187
(60,064,648)
-
-
4,513,641,059
7,892,906,389
(40,363,200)
2,880,024
7,855,423,213
885,458,407
-
-
-
-
-
885,458,407
60,064,648
-
(278,582,281)
8,522,363,987
10,637,427,609
(40,363,200)
-
10,597,064,409
885,458,407
3,408,975,187
(673,131)
4,657,305
2,723,572
3,415,682,933
4,301,141,340
-
-
(278,582,281)
14,619,623,468
1,225,000,000
-
-
1,225,000,000
-
-
-
-
-
-
-
-
-
-
1,225,000,000
STATEMENT OF CHANGES IN EQUITY
-----------------------------------Rupees-----------------------------------
47

NOTES TO THE FINANCIAL STATEMENTSFOR THE YEAR ENDED JUNE 30, 2019
Sitara Chemical Industries Limited ("the Company") was incorporated in Pakistan on September
08, 1981 as a public limited Company under Companies Act, 1913 (now Companies Act, 2017). The
Company is listed on Pakistan Stock Exchange Limited. The Company is a Shariah Compliant
Company certified by Securities & Exchange Commission of Pakistan (SECP) under Shariah
Governance Regulation 2018. The principal activities of the Company are operation of Chlor Alkali
plant and yarn spinning unit. The registered office of the Company is situated at 601-602, Business
Centre, Mumtaz Hasan Road, Karachi, in the province of Sindh and the manufacturing facilities are
located at 28/32 K.M., Faisalabad - Sheikhupura Road, Faisalabad, in the province of Punjab.
The Company is currently organized into two operating divisions and these divisions are the basis
on which the Company reports its primary segment information.
Principal business activities are as follows:
Chemical Division Manufacturing of caustic soda and allied products
Textile Division Manufacturing of yarn and trading of fabric
1.1
1.2
GENERAL INFORMATION1.
The financial statements are presented in Pak Rupee, which is the Company's functional and
presentation currency.
These financial statements have been prepared in accordance with the accounting and reporting
standards as applicable in Pakistan. The accounting and reporting standards applicable in Pakistan
comprise of:
- International Financial Reporting Standards (IFRS Standards) issued by the International
Accounting Standards Board (IASB) as notified under the Companies Act, 2017; and
- Provisions of and directives issued under the Companies Act, 2017.
Where provisions of and directives issued under the Companies Act, 2017 (the Act) differ from the
IFRS Standards, the provisions of and directives issued under the Act have been followed.
These financial statements have been prepared under the "historical cost convention", modified
by:
- revaluation of certain property, plant and equipment;
- financial instruments at fair value;
- recognition of certain employee retirement benefits at present value.
The following standards, amendments and interpretations are effective for the year ended June
30, 2019.
BASIS OF PREPARATION
Accounting convention
New accounting standards / amendments and IFRS interpretations that are effective for the year
ended June 30, 2019
Statement of compliance
2.2
2.3
2.
2.1
48

NOTES TO THE FINANCIAL STATEMENTSFOR THE YEAR ENDED JUNE 30, 2019
IFRS 15 Revenue from contacts with customers
IFRS 9 Financial instruments
IFRS 15 establishes a comprehensive framework for determining whether, how much and when
revenue is recognised. It replaced IAS 18 Revenue, IAS 11 Construction Contracts and related
interpretations. Under IFRS 15, revenue is recognised when a customer obtains control of the
goods or services. Determining the timing of the transfer of control – at a point in time or over time
– requires judgement.
The Company has adopted IFRS 15 by applying modified retrospective approach according to
which the company is not required to restate prior year results. However, the adoption of IFRS 15
does not have any material impact on the reported revenue of the company for the year ended
June 30, 2019 and June 30, 2018.
IFRS 9 replaces the provisions of IAS 39 - Financial Instruments: Recognition and Measurement
that relate to the recognition, classification and measurement of financial assets and financial
liabilities, derecognition of financial instruments, impairment of financial assets and hedge
accounting. Under IFRS 9 the financial instruments, excluding derivatives, are accounted for at
amortised cost, fair value through other comprehensive income or fair value through profit or loss
depending on the nature of the relevant contractual cash flows and the business model in which it
is held.
2.4
Standards or interpretations with no significant impact
Amendments to IFRS 2 'Share-based Payment' - Clarification
on the classification and measurement of share-based
payment transactions
IFRS 4 'Insurance Contracts': Amendments regarding the
interaction of IFRS 4 and IFRS 9.
IFRS 15 'Revenue' - This standard supersedes IAS 18, IAS 11,
IFRIC 13, 15 and 18 and SIC 31 upon its effective date.
Effective from accounting
period beginning on or after:
January 01, 2018
January 01, 2018
July 01, 2018
Amendments to IAS 40 'Investment Property': Clarification on
transfers of property to or from investment property
IFRIC 22 'Foreign Currency Transactions and Advance
Consideration': Provides guidance on transactions where
consideration against non-monetary prepaid asset / deferred
income is denominated in foreign currency.
IFRS 9 'Financial Instruments' - This standard supersedes IAS 39
Financial Instruments: Recognition and Measurement upon its
effective date.
Standards impacting financial statements
January 01, 2018
January 01, 2018
July 01, 2018
2.5
49

NOTES TO THE FINANCIAL STATEMENTSFOR THE YEAR ENDED JUNE 30, 2019
The adoption of IFRS 9 from July 01, 2018 resulted in changes in relevant accounting policies and
adjustment to the trade and other receivables amounts recognised in the financial statements.
IFRS 9 requires implementation of a new impairment model based on expected credit losses,
resulting in transition adjustment summarised below. In accordance with the transition provision
of IFRS 9, the Company has followed modified retrospective transitional method, taking into
consideration the exemption allowing it not to restate comparative information or prior periods.
Trade debts
Cash and cash equivalents
Loans and advances
Other receivables
Other financial assets
Original
Classification
under IAS 39
New
classification
under IFRS 9
Original carrying
amount
under IAS 39
New carrying
amount
under IFRS 9
Financial assets
Loans and
receivables
Loans and
receivables
Available
for sale
Loans and
receivables
Loans and
receivables
At amortized
cost
At amortized
cost
At amortized
cost
At amortized
cost
FVTOCI /
FVTPL
1,137,767,758
62,744,253
1,752,225,000
9,975,716
352,254,323
1,081,586,584
62,744,253
1,752,225,000
9,975,716
352,254,323
(Rupees in thousand)
Original
Classification
under IAS 39
New
classification
under IFRS 9
Original carrying
amount
under IAS 39
New carrying
amount
under IFRS 9
Financial Liabilities
(Rupees in thousand)
Trade and other payables
Finances under mark-up
arrangements - secured
At amortized
cost
At amortized
cost
At amortized
cost
At amortized
cost
2,241,189,831
7,109,805,254
2,241,189,831
7,109,805,254
As a result of adoption of IFRS 9, opening retained earnings of the Company as of July 1, 2018 are
restated downward by Rs. 40.36 million, net of tax of Rs. 15.82 million due to recognition of
allowance for expected credit losses using the modified retrospective method as disclosed in note
13.4. Had this policy not been changed, the profit after tax for the year would have been higher by
Rs. 19.02 million and retained earnings would have been higher by Rs. 59.38 million.
50

NOTES TO THE FINANCIAL STATEMENTSFOR THE YEAR ENDED JUNE 30, 2019
New accounting standards / amendments and IFRS interpretations that are not yet effective
The following standards, amendments and interpretations are only effective for accounting
periods, beginning on or after the date mentioned against each of them. These standards,
interpretations and the amendments are either not relevant to the Company's operations or are
not expected to have significant impact on the Company's financial statements other than certain
additional disclosures.
Amendments to IFRS 3 'Business Combinations' - Amendments
regarding the definition of business
Amendments to IFRS 9 'Financial Instruments' - Amendments
regarding prepayment features with negative compensation
and modifications of financial liabilities
Amendments to IFRS 10 'Consolidated Financial Statements'
and IAS 28 'Investments in Associates and Joint Ventures' - Sale
or contribution of assets between an investor and its associate
or joint venture
IFRS 16 'Leases': This standard will supersede IAS 17 'Leases',
IFRIC 4, SIC 15 and SIC 27 upon its effective date.
Amendments to References to the Conceptual Framework in
IFRS Standards
Amendments to IAS 1 'Presentation of Financial Statements'
and IAS 8 'Accounting Policies, Changes in Accounting Estimates
and Errors' - Amendments regarding the definition of material
Amendments to IAS 19 'Employee Benefits' - Amendments
regarding plan amendments, curtailments or settlements.
Amendments to IAS 28 'Investments in Associates and Joint
Ventures' - Amendments regarding long-term interests in an
associate or joint venture that form part of the net investment
in the associate or joint venture but to which the equity method
is not applied.
IFRIC 23 'Uncertainty over Income Tax Treatments': Clarifies the
accounting treatment in relation to determination of taxable
profit (tax loss), tax bases, unused tax losses, unused tax credits
and tax rates, when there is uncertainty over income tax
treatments under IAS 12 'Income Taxes'.
January 01, 2020
January 01, 2019
Effective from accounting
period beginning on or after a
date to be determined. Earlier
application is permitted.
January 01, 2019
January 01, 2020
January 01, 2020
January 01, 2019
January 01, 2019
January 01, 2019
Effective from accounting period
beginning on or after:
2.6
51
NOTES TO THE FINANCIAL STATEMENTSFOR THE YEAR ENDED JUNE 30, 2019
Certain annual improvements have also been made to a number of IFRSs.
Other than the aforesaid standards, interpretations and amendments, the International
Accounting Standards Board (IASB) has also issued the following standards which have not been
adopted locally by the Securities and Exchange Commission of Pakistan:
- IFRS 1 – First Time Adoption of International Financial Reporting Standards
- IFRS 14 – Regulatory Deferral Accounts
- IFRS 17 – Insurance Contracts
SIGNIFICANT ESTIMATES AND JUDGEMENTS
The preparation of financial statements in conformity with IFRS's requires management to make
judgments, estimates and assumptions that affect the application of policies and reported
amounts of assets and liabilities, incomes and expenses. The estimates, associate assumptions
and judgements are based on historical experience and various other factors that are believed to
be reasonable under the circumstances, the results of which form the basis of making judgments
about carrying values of assets and liabilities that are not readily apparent from other sources.
Actual results may differ from these estimates. The estimates and underlying assumptions are
reviewed on an ongoing basis. Revisions to accounting estimates are recognized in the period in
which the estimates are revised.
Estimates and judgments are continually evaluated and are based on historical experience and
other factors, including expectations of future events that are believed to be reasonable under the
circumstances. Significant areas requiring the use of management estimates in these financial
statements relate to the useful life of property, plant and equipment and intangibles, revaluation
of land, building and plant and machinery, provision for expected credit losses, provision for
taxation, slow moving inventory, measurement of defined benefit obligations and assumptions
used in discounted cash flow projections for deferred sale receivable. However, assumptions and
judgments made by management in the application of accounting policies that have significant
effect on the financial statements are not expected to result in material adjustment to the carrying
amounts of assets and liabilities in the next year.
3.
SUMMARY OF SIGNIFICANT ACCOUNTING POLICIES
Property, plant and equipment
The principal accounting policies adopted are set out below :
Property, plant and equipment and capital work in progress are stated at cost except free hold
land, building on freehold land (factory) and plant & machinery less accumulated depreciation and
accumulated impairment losses, if any. Building on freehold land (factory) and plant and
machinery are stated at revalued amount less accumulated depreciation and accumulated
impairment losses, if any. Freehold land is stated at revalued amount. Capital work-in-progress is
stated at cost less impairment in value, if any. Cost includes borrowing cost as referred in
accounting policy of borrowing cost.
Assets' residual values, if significant and their useful lives are reviewed and adjusted, if
appropriate, at each statement of financial position date.
4.
4.1
52

NOTES TO THE FINANCIAL STATEMENTSFOR THE YEAR ENDED JUNE 30, 2019
When significant parts of an item of property, plant and equipment have different useful lives,
they are recognized as separate items of property, plant and equipment. Repair and maintenance
costs are charged to income during the year in which they are incurred.
Depreciation is charged to income applying the reducing balance method at the rates specified in
Property, plant and equipment note to these financial statements. Depreciation on additions and
disposals during the year is charged on the basis of proportionate period of use.
Surplus arising on revaluation of property, plant and equipment is recognized, net of tax, in other
comprehensive income and accumulated in reserves in shareholders' equity and is shown in
equity. Revaluation is carried out with sufficient regularity to ensure that the carrying amounts of
the assets does not differ materially from the fair value. Accumulated depreciation at the date of
revaluation is eliminated against the cost of the asset and net amount is restated to the revalued
amount of the asset. The surplus on revaluation of property, plant and equipment to the extent of
incremental depreciation charged on the related property, plant and equipment during the year is
part of statement of changes in equity.
Gains or losses on disposal of assets, if any, are recognized as and when incurred in statement of
profit or loss and the related asset is derecognized. Surplus arising on revaluation is credited to
surplus on revaluation of property, plant and equipment. The surplus on revaluation of property,
plant and equipment to the extent of incremental depreciation charged on the related assets is
transferred by the Company to its un-appropriated profit.
All expenditure connected with specific assets incurred during installation and construction
period are carried under capital work-in-progress. These are transferred to specific assets as and
when these assets are available for use.
An intangible asset is an identifiable non-monetary asset without physical substance. Intangible
assets are recognized when it is probable that the expected future economic benefits will flow to
the entity and the cost of the asset can be measured reliably. Cost of the intangible asset (i.e.
Computer software) include purchase cost and directly attributable expenses incidental to bring
the asset for its intended use. Cost associated with maintaining computer software are recognized
as an expense as and when incurred.
Intangible assets are stated at cost less accumulated amortization and accumulated impairment
losses, if any. Amortization is charged over estimated useful life of the asset on a systematic basis
applying the reducing balance method. Useful life of intangible operating assets are reviewed, at
each reporting date and adjusted if the impact of amortization is significant.
Investment property, which is property held to earn rentals and/ or for capital appreciation, is
valued using the cost method i.e. at cost less any accumulated depreciation and any identified
impairment loss.
Depreciation on buildings is charged to income on reducing balance method at the rate of 10% per
annum. Depreciation on additions to investment property is charged from the month in which a
property is acquired or capitalized while no depreciation is charged for the month in which the
difference between present value of the proceeds from disposal and the carrying amount is
recognised in the profit or loss account.
Capital work-in-progress
Intangible Assets
Investment property
4.2
4.3
53
NOTES TO THE FINANCIAL STATEMENTSFOR THE YEAR ENDED JUNE 30, 2019
Investments
Regular way purchase or sale of investments
Investments designated as at fair value through other comprehensive income (FVTOCI)
Investments measured at fair value through profit or loss (FVTPL)
De-recognition
Stores, spare parts and loose tools
All purchases and sales of investments are recognized using trade date accounting. Trade date is
the date that the Company commits to purchase or sell the investment.
On initial recognition, the Company may make an irrevocable election (on an
instrument?by?instrument basis) to designate investments in equity instruments as at FVTOCI.
Designation at FVTOCI is not permitted if the equity investment is held for trading or if it is
contingent consideration recognised by an acquirer in a business combination.
A financial asset is held for trading if:
• it has been acquired principally for the purpose of selling it in the near term; or
• on initial recognition it is part of a portfolio of identified financial instruments that the Company
manages together and has evidence of a recent actual pattern of short-term profit-taking; or
• it is a derivative (except for a derivative that is a financial guarantee contract or a designated and
effective hedging instrument).
Investments in equity instruments at FVTOCI are initially measured at fair value plus transaction
costs.
Subsequently, they are measured at fair value with gains and losses arising from changes in fair
value recognized in other comprehensive income and accumulated in the investments revaluation
reserve. The cumulative gain or loss is not be reclassified to profit or loss on disposal of the equity
investments, instead, it is transferred to retained earnings.
Dividends on these investments in equity instruments are recognised in profit or loss in
accordance with IFRS 9, unless the dividends clearly represent a recovery of part of the cost of the
investment.
The Company has designated all investments in equity instruments that are not held for trading as
at FVTOCI on initial application of IFRS 9 (see note 5.2).
Investments in equity instruments are classified as at FVTPL, unless the Company designates an
equity investment that is neither held for trading nor a contingent consideration arising from a
business combination as at FVTOCI on initial recognition.
Investments measured at FVTPL are measured at fair value at the end of each reporting period,
with any fair value gains or losses recognised in profit or loss.
All investments are derecognized when the rights to receive cash flows from the investments have
expired or have been transferred and the Company has transferred substantially all risks and
rewards of ownership.
These are valued at lower of cost and net realizable value less allowance for the obsolete and slow
moving items. Cost is determined using weighted average method. Items in transit are valued at
cost comprising invoice value and other charges incurred thereon, up to reporting date.
4.4
4.5
Net realizable value represents estimated selling price in the ordinary course of business, less
estimated cost of completion and estimated cost necessary to make the sales.
54
NOTES TO THE FINANCIAL STATEMENTSFOR THE YEAR ENDED JUNE 30, 2019
4.6
4.9
Stock-in-trade
These are valued at lower of cost and net realizable value. Cost is determined as follows:-
Raw and packing materials Average cost except for those in transit which are stated at
invoice price plus other charges paid thereon up to the
reporting date.
Work-in-process Average manufacturing cost
Finished goods Average manufacturing cost
Waste Net realizable value
Net realizable value represents estimated selling price in the ordinary course of business, less
estimated cost of completion and estimated cost necessary to make the sale.
Trade debts and other receivables are initially recognised at fair value, which is usually the original
invoiced amount and subsequently carried at amortised cost using the effective interest method
less allowance for expected credit loss.
Cash and cash equivalents are carried in the statement of financial position at amortised cost. For
the purpose of cash flow statement, cash and cash equivalents consist of cash in hand, balances
with banks, highly liquid short-term investments that are convertible to known amount of cash
and are subject to insignificant risk of change in value, and short-term running finance under
mark-up arrangements.
The Company assesses at each statement of financial position date whether there is any indication
that assets except deferred tax assets may be impaired. If such indication exists, the carrying
amounts of such assets are reviewed to assess whether they are recorded in excess of their
recoverable amount. Where carrying values exceed the respective recoverable amount, assets are
written down to their recoverable amounts and the resulting impairment loss is recognized in
profit or loss account. The recoverable amount is the higher of an asset's fair value less costs to sell
and value in use.
Where impairment loss subsequently reverses, the carrying amount of the asset is increased to
the revised recoverable amount but limited to the extent of the amount that would have been
determined (net of depreciation and amortization) had no impairment loss been recognized.
Reversal of impairment loss is recognized as income.
The Company recognises a loss allowance for expected credit losses on trade and other
receivables. The amount of expected credit losses is updated at each reporting date to reflect
changes in credit risk since initial recognition of the respective financial instrument.
The Company always recognises lifetime ECL for trade receivables and other receivables. The
expected credit losses on these financial assets are estimated using a provision matrix based on
the Company’s historical credit loss experience, adjusted for factors that are specific to the
debtors, general economic conditions and an assessment of both the current as well as the
forecast direction of conditions at the reporting date, including time value of money where
appropriate.
Trade debts and other receivables
Cash and cash equivalents
Impairment
Non Financial Assets
Financial Assets
4.8
4.7
55

NOTES TO THE FINANCIAL STATEMENTSFOR THE YEAR ENDED JUNE 30, 2019
For all other financial instruments, the Company recognises lifetime ECL when there has been a
significant increase in credit risk since initial recognition. However, if the credit risk on the financial
instrument has not increased significantly since initial recognition, the Company measures the
loss allowance for that financial instrument at an amount equal to 12?month ECL.
Lifetime ECL represents the expected credit losses that will result from all possible default events
over the expected life of a financial instrument. In contrast, 12?month ECL represents the portion
of lifetime ECL that is expected to result from default events on a financial instrument that are
possible within 12 months after the reporting date.
Borrowings are recognized initially at fair value, net of transaction costs incurred. Borrowings are
subsequently stated at amortized cost; any difference between the proceeds (net of transaction
costs) and the redemption value is recognized in the income statement over the period of the
borrowings using the effective interest method. Borrowings are classified as current liabilities
unless the Company has an unconditional right to defer settlement of liability for at least 12
months after the statement of financial position date.
The Company operates an approved funded contributory provident fund scheme for all its
employees eligible for benefit. Equal monthly contributions are made by the Company and
employees at the rate from 6.5% to 8.33% of basic salary depending upon the length of service of
an employee. The Company's contribution to the fund is charged to profit or loss account for the
year.
The Company operates an unfunded gratuity scheme for all those permanent employees who
have completed minimum qualifying period of service as defined under the respective scheme.
Provision is made to cover the obligation under scheme on the basis of actuarial valuation and is
charged to statement of profit or loss and other comprehensive income. The most recent Actuarial
Valuation was carried out at June 30, 2019 using "Projected Unit Credit Method". The amount
recognized in the statement of financial position represents the present value of defined benefit
obligation as adjusted for unrecognized actuarial gains and losses.
Liabilities for trade and other amounts payable are measured at cost which is the fair value of the
consideration to be paid in future for goods and services received whether billed to the Company
or not.
Provisions are recognized when the Company has a present, legal or constructive obligation as a
result of past event, it is probable that an outflow of resources embodying economic benefits will
be required to settle the obligation and a reliable estimate of the amount can be made. However,
provisions are reviewed at each reporting date and adjusted to reflect the current best
estimate.
Borrowings
Employee retirement benefits
Defined contribution plan - Chemical division
Defined benefit plan - Textile division
Trade and other payables
Provisions
4.11
4.10
4.12
4.13
56
NOTES TO THE FINANCIAL STATEMENTSFOR THE YEAR ENDED JUNE 30, 2019
Taxation
Current
Deferred
Dividend and other appropriations
Financial instruments
Revenue recognition
The charge for current taxation is based on taxable income at the current rate of taxation after
taking into account applicable tax credits, rebates and exemptions available, if any. The charge for
tax also includes adjustments, where considered necessary, to provision for tax made in previous
years arising from assessment made during the year. However, for income covered under final tax
regime, taxation is based on applicable tax rates under such regime.
Deferred income tax is provided using the liability method for all temporary differences at the
reporting date between tax bases of assets and liabilities and their carrying amounts for financial
reporting purposes. In this regard, the effects on deferred taxation of the portion of income
subject to final tax regime is considered in accordance with the requirement of Technical Release –
27 of Institute of Chartered Accountants of Pakistan.
Deferred tax liabilities are generally recognised for taxable temporary differences. Deferred tax
asset is recognized for all deductible temporary differences, unused tax credits and carry forward
of unused tax losses, if any, to the extent that it is probable that taxable profit will be available
against which such temporary differences and tax losses can be utilized.
Deferred tax assets and liabilities are measured at the tax rates that are expected to apply to the
period when the asset is realized or the liability is settled, based on tax rates that have been
enacted or substantively enacted at the reporting date.
Dividend is recognized as a liability in the year in which it is approved. Appropriations of profits are
reflected in the statement of changes in equity in the year in which such appropriations are
made.
Financial assets and liabilities are recognized when the Company becomes a party to the
contractual provisions of the instrument and derecognized when the Company loses control of the
contractual rights that comprise the financial asset and in case of financial liability when the
obligation specified in the contract is discharged, cancelled or expired.
Other particular recognition methods adopted by the Company are disclosed in the individual
policy statements associated with each item of financial instruments.
Revenue is measured based on consideration to which company expects to be entitled in a
contract with customer and excludes amounts collected on behalf of third parties.
- Sales of goods are recognized when control of goods has been transferred to customers and
performance obligation is satisfied.
- Export rebate is recognized on accrual basis at the time of making the export sale.
- Interest income is accrued on a time proportionate basis, by reference to the principal
outstanding and at the effective interest rate applicable, which is the rate that exactly
discounts estimated future cash receipts through the expected life of the financial asset to
that asset’s net carrying amount.
4.15
4.17
4.14
4.16
57

NOTES TO THE FINANCIAL STATEMENTSFOR THE YEAR ENDED JUNE 30, 2019
- Dividend income from investments is recognized when the company's rights to receive payment
have been established.
Borrowing costs directly attributable to the acquisition, construction or production of qualifying
assets, which are assets that necessarily take a substantial period of time to get ready for their
intended use or sale, are added to the cost of those assets, until such time as the assets are
substantially ready for their intended use or sale. Investment income earned on the temporary
investment of specific borrowings pending their expenditure on qualifying assets is deducted from
the borrowing costs eligible for capitalization. All other borrowing costs are recognized in profit or
loss in the period in which they are incurred.
Transactions in currencies other than Pakistani Rupee are recorded at the rates of exchange
prevailing on the dates of the transactions. At each reporting date, monetary assets and liabilities
that are denominated in foreign currencies are retranslated at the rates prevailing on the reporting
date except where forward exchange contracts have been entered into for repayment of liabilities,
in that case, the rates contracted for are used. Gains and losses arising on retranslation and
settlement are included in net profit or loss for the period.
An operating segment is a component of the Company that engages in business activities from
which it may earn revenues and incur expenses, including revenues and expenses that relate to
transactions with any of the company’s other components. All operating segments’ operating
results are reviewed regularly by the company’s CEO to make decisions about resources to be
allocated to the segment and assess its performance, and for which discrete financial information
is available.
Segment results that are reported to the CEO include items directly attributable to a segment as
well as those that can be allocated on a reasonable basis. Unallocated items comprise mainly
administrative and other operating expenses, and income tax assets and liabilities. Segment
capital expenditure is the total cost incurred during the period to acquire property, plant and
equipment, and intangible assets other than goodwill.
A financial asset and financial liability is offset and the net amount is reported in the statement of
financial position if the Company has a legal enforceable right to set off the transaction and also
intends to settle on a net basis or to realize the asset and settle the liability
simultaneously.
Borrowing costs
Foreign currencies
Segment Reporting
Off setting of financial assets and financial liabilities
4.20
4.21
4.18
4.19
Earnings per share
The Company presents basic and diluted earnings per share (EPS) data for its ordinary shares. Basic
EPS is calculated by dividing the profit after tax attributable to ordinary shareholders of the
Company by the weighted average number of ordinary shares outstanding during the year. Diluted
EPS is determined by adjusting the profit after tax attributable to ordinary shareholders and the
weighted average number of ordinary shares outstanding, adjusted for the effects of all dilutive
potential ordinary shares.
4.22
58
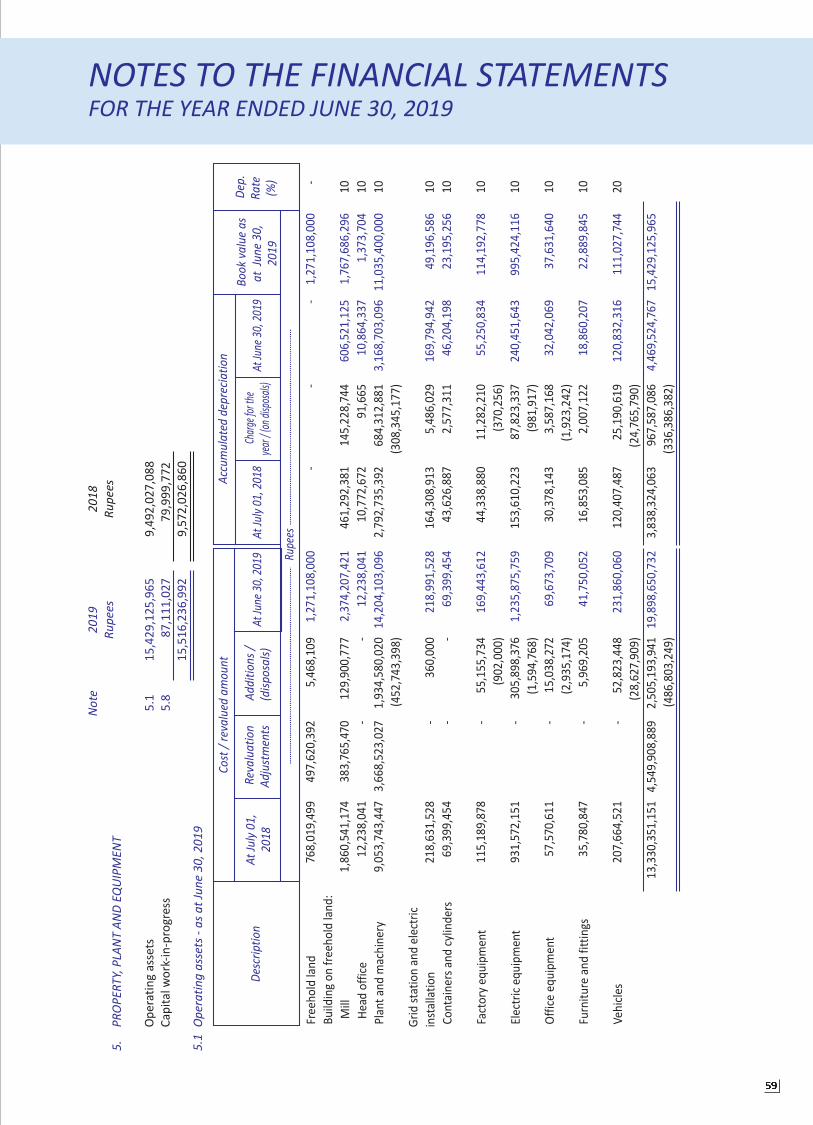
NOTES TO THE FINANCIAL STATEMENTSFOR THE YEAR ENDED JUNE 30, 2019
PR
OP
ER
TY,
PLA
NT
AN
D E
QU
IPM
EN
T
Op
era
tin
g a
sse
ts -
as
at
Jun
e 3
0,
20
19
Op
era
tin
g a
sse
t s
Ca
pit
al w
ork
-in
-pro
gre
ss
5.1
5.8
No
te2
01
8
Ru
pe
es
20
19
Ru
pe
es
Fre
eh
old
lan
d
Bu
ildin
g o
n f
ree
ho
ld la
nd
:
Mi ll
He a
d o
ffic
e
Pla
nt
and
mac
hin
ery
Gri
d s
tati
on
an
d e
lect
ric
ins t
alla
tio
n
Co
nta
ine
rs a
nd
cyl
ind
ers
Fact
ory
eq
uip
me
nt
Ele
ctri
c e
qu
ipm
en
t
Of f
ice
eq
uip
me
nt
Furn
itu
re a
nd
fit
tin
gs
Ve
hic
les
Des
crip
tio
nA
t Ju
ly 0
1,
20
18
Ad
dit
ion
s /
(dis
po
sals
)A
t Ju
ne 3
0, 2
019
Co
st /
rev
alu
ed a
mo
un
tA
ccu
mu
late
d d
epre
cia
tio
n
5.
5.1
-
10
10
10
10
10
10
10
10
10
20
Bo
ok
valu
e a
s
at
Ju
ne
30
,
20
19
Dep
.
Ra
te
(%)
A t Ju
ne 3
0, 2
019
Char
ge fo
r the
year
/ (o
n di
spos
als)
At
July
01,
201
8
15
,42
9,1
25
,96
5
87
,11
1,0
27
15
,51
6,2
36
,99
2
9,4
92
,02
7,0
88
79
,99
9,7
72
9,5
72
,02
6,8
60
7 68
,01
9,4
99
1,8
60
,54
1,1
74
12
,23
8,0
41
9,0
53
,74
3,4
47
21
8,6
31
,52
8
69
,39
9,4
54
11
5,1
89
,878
93
1,5
72,1
51
57,5
70,6
11
35
,78
0,8
47
20 7
,66
4,5
21
13
,33
0,3
51
,15
1
Rev
alu
ati
on
Ad
just
men
ts
497
,62
0,3
92
38
3,7
65
,470
-
3,6
68
,52
3,0
27
- - - - - - -
4,5
49
,90
8,8
89
5,4
68
,10
9
12
9,9
00
,77
7 -
1,9
34
,58
0,0
20
(452
,74
3,3
98
)
36
0,0
00 -
55
,15
5,7
34
(902
,00
0)
30
5,8
98
,376
(1,5
94
,76
8)
15
,03
8,2
72
(2,9
35
,174
)
5,9
69
,20
5
5 2,8
23
,44
8
(28
,627
,90
9)
2,5
05
,19
3,9
41
(48
6,8
03
,24
9)
1,2
71
,10
8,0
00
2,3
74,2
07,4
21
12
,23
8,0
41
14
,20
4,1
03
,09
6
21
8,9
91
,52
8
69
,39
9,4
54
16
9,4
43
,61
2
1,2
35
,87
5,7
59
69
,67
3,7
09
41
,75
0,0
52
23
1,8
60
,06
0
19
,89
8,6
50
,73
2
-
46
1,2
92,3
81
10
,772
,672
2,7
92,7
35
,392
16
4,3
08
,91
3
43
,62
6,8
87
44
,33
8,8
80
15
3,6
10
,22
3
30
,378
,14
3
16
,85
3,0
85
12
0,4
07,4
87
3,8
38
,32
4,0
63
-
14
5,2
28
,74
4
91
,66
5
68
4,3
12
,88
1
(30
8,3
45
,17
7)
5,4
86
,02
9
2,5
77
,31
1
11
,28
2,2
10
(370
,25
6)
87,8
23
,337
(98
1,9
17
)
3,5
87,1
68
(1,9
23
,24
2)
2,0
07,1
22
25
,19
0,6
19
(24
,76
5,7
90
)
96 7
,587
,08
6
(33
6,3
86
,38
2)
-
60
6,5
21
,12
5
10
,86
4,3
37
3,1
68
,70
3,0
96
16
9,7
94
,94
2
46
,20
4,1
98
55
,25
0,8
34
24
0,4
51
,64
3
32
,04
2,0
69
18
,86
0,2
07
12
0,8
32
,31
6
4,4
69
,52
4,7
67
1,2
71
,10
8,0
00
1,7
67,6
86
,29
6
1,3
73
,70
4
11
,03
5,4
00
,00
0
49
,19
6,5
86
23
,19
5,2
56
11
4,1
92,7
78
99
5,4
24
,11
6
37,6
31
,64
0
22
,88
9,8
45
11
1,0
2 7,7
44
15
,42
9,1
25
,96
5
Rup
ees
59
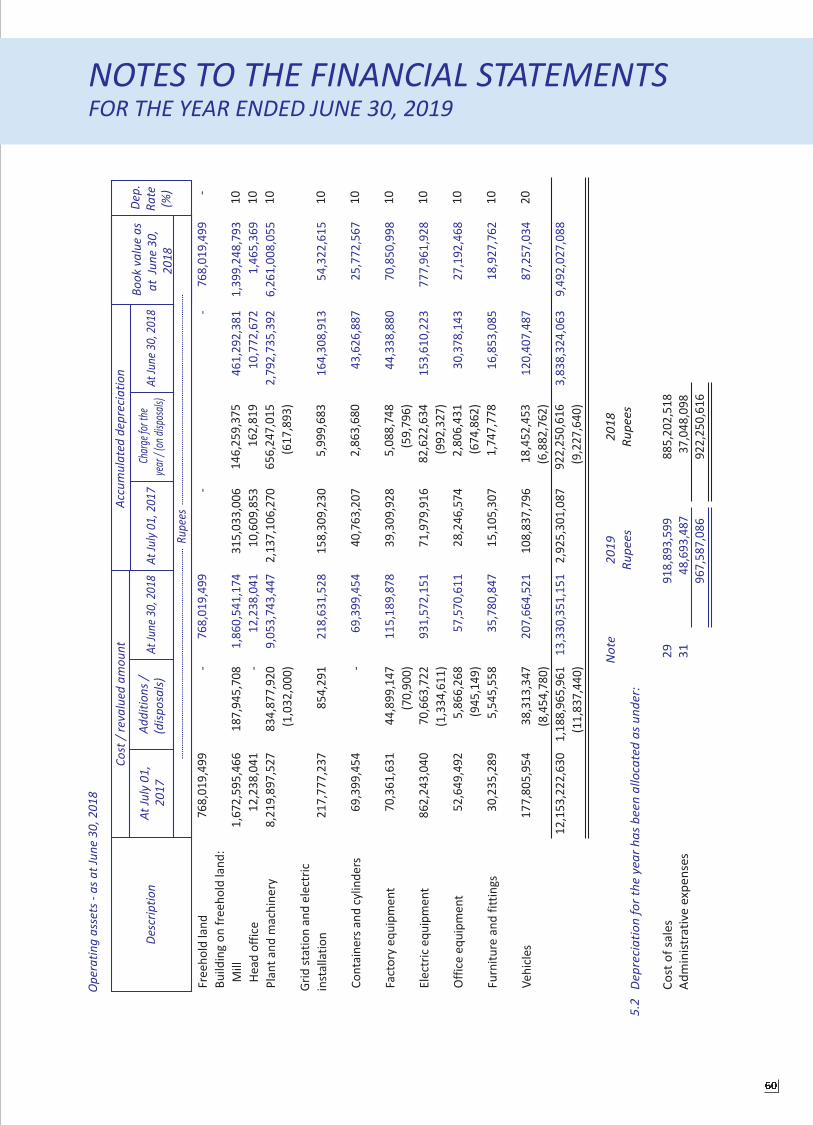
NOTES TO THE FINANCIAL STATEMENTSFOR THE YEAR ENDED JUNE 30, 2019
Op
era
tin
g a
sse
ts -
as
at
Jun
e 3
0,
20
18
De
scri
pti
on
At
July
01
,
20
17
Ad
dit
ion
s /
(dis
po
sals
)A
t Ju
ne
30
, 20
18
Co
st /
re
valu
ed
am
ou
nt
Ac c
um
ula
ted
de
pre
cia
tio
n
At
June
30,
201
8Ch
arge
for t
he
year
/ (o
n di
spos
als)
At
July
01
, 20
17
Fre
eh
old
lan
d
Bu
ildin
g o
n f
ree
ho
ld la
nd
:
Mill
He
ad o
ffic
e
Pla
nt
an
d m
ach
ine
r y
Gri
d s
tati
on
an
d e
lect
ric
inst
alla
tio
n
Co
nt a
ine
rs a
nd
cyl
ind
ers
Fact
ory
eq
uip
me
nt
Ele
ctri
c e
qu
ipm
en
t
Off
ice
eq
uip
me
nt
Furn
itu
re a
nd
fit
tin
gs
Ve
hic
les
29
31
No
te2
01
8
Ru
pe
es
20
19
Ru
pe
es
De
pre
cia
tio
n f
or
the
ye
ar
ha
s b
ee
n a
llo
cat e
d a
s u
nd
er:
Co
st o
f sa
les
Ad
min
istr
ati
ve e
xpe
nse
s
Bo
ok
va
lue
as
at
Ju
ne
30
,
20
18
De
p.
Ra
te
(%) -
10
10
10
10
10
10
10
10
10
20
76
8,0
19
,49
9
1,6
72
,59
5,4
66
12
,23
8,0
41
8,2
19
,89
7,5
27
21
7,7
77
,23
7
69
,39
9,4
54
70
,36
1,6
31
86
2,2
43
,04
0
52
,64
9,4
92
30
,23
5,2
89
17
7,8
05
,95
4
12
,15
3,2
22
,63
0
-
18
7,9
45
,70
8 -
83
4,8
77
,92
0
(1,0
32
,00
0)
85
4,2
91 -
44
,89
9,1
47
(70
,90
0)
70
,66
3,7
22
(1,3
34
,61
1)
5,8
66
,26
8
(94
5,1
49
)
5,5
45
,55
8
38
,31
3,3
47
(8,4
54
,78
0)
1,1
88
,96
5,9
61
(11
,83
7,4
40
)
76
8,0
19
,49
9
1,8
60
,54
1,1
74
12
,23
8,0
41
9,0
53
,74
3,4
47
21
8,6
31
,52
8
69
,39
9,4
54
11
5,1
89
,87
8
93
1,5
72
,15
1
57
,57
0,6
11
35
,78
0,8
47
20
7,6
64
,52
1
13
,33
0,3
51
,15
1
-
31
5,0
33
,00
6
10
,60
9,8
53
2,1
37
,10
6,2
70
15
8,3
09
,23
0
40
,76
3,2
07
39
,30
9,9
28
71
,97
9,9
16
28
,24
6,5
74
15
,10
5,3
07
10
8,8
37
,79
6
2,9
25
,30
1,0
87
14
6,2
59
,37
5
16
2,8
19
65
6,2
47
,01
5
(61
7,8
93
)
5,9
99
,68
3
2,8
63
,68
0
5,0
88
,74
8
(59
,79
6)
82
,62
2,6
34
(99
2,3
27
)
2,8
06
,43
1
(67
4,8
62
)
1,7
47
,77
8
18
,45
2,4
53
(6,8
82
,76
2)
92
2,2
50
,61
6
(9,2
27
,64
0)
-
46
1,2
92
,38
1
10
,77
2,6
72
2,7
92
,73
5,3
92
16
4,3
08
,91
3
43
,62
6,8
87
44
,33
8,8
80
15
3,6
10
,22
3
30
,37
8,1
43
16
,85
3,0
85
12
0,4
07
,48
7
3,8
38
,32
4,0
63
76
8,0
19
,49
9
1,3
99
,24
8,7
93
1,4
65
,36
9
6,2
61
,00
8,0
55
54
,32
2,6
15
25
,77
2,5
67
70
,85
0,9
98
77
7,9
61
,92
8
27
,19
2,4
68
18
,92
7,7
62
87
,25
7,0
34
9,4
92
,02
7,0
88
91
8,8
93
,59
9
48
,69
3,4
87
96
7,5
87
,08
6
88
5,2
02
,51
8
37
,04
8,0
98
92
2,2
50
,61
6
5.2
Ru
pee
s
60

NOTES TO THE FINANCIAL STATEMENTSFOR THE YEAR ENDED JUNE 30, 2019
The Company had revalued its freehold land, building and plant & machinery at June 30, 2019. The
revaluation has been carried out by Hamid Mukhatar & Company (Private) Limited, an
independent valuer not connected to the Company and is on the panel of Pakistan Banks
Association as ‘Any Amount’ asset valuer. It is also on the panel of State Bank of Pakistan and
possesses appropriate qualification and recent experience in the fair value measurements in the
relevant locations. The basis used for the revaluation of freehold land, buildings and machinery
were as follows:
Fair market rate of the land was assessed through inquiries in the vicinity of land and information
obtained through property dealers of the area.
New construction value (new replacement value of each item of the buildings) was arrived at by
looking at the condition of the buildings. Valuer applied 3% per annum depreciation on “Written
Down Value” basis to arrive at fair depreciated market value on “Going Concern” basis.
Inquiries were made from market to obtain prevalent fair market values of similar local and
imported machinery items.
For the purpose of valuation the valuer has taken the capitalized cost of the plant and machinery
only (not any electric equipment, grid stations) from the year 1986 till 2013 was capitalized and
addition / deletion form the year 2014 to 2019 of the each year is taken since its commissioning
from the audited accounts of the Company. The original cost is divided into two parts i.e. 70% of
the value is basic foreign amount of the plant & machinery and 30 % is local component of plant
and machinery.
Land
Buildings
Machinery (Textile)
Machinery (Chemical)
5.4
5.3 Particulars of immovable property (i.e. land and building) in the name of the Company are as follows:
Location Usage of immovable property
Total area
(Square feet)
Covered area
(Square feet)
7,359,642
3,645,972
9,720
9,210
1,344
5,436
1,194
1,640
499,100
253,763
16,851
9,210
1,344
2,700
1,194
1,640
Chak# 61- RB, Faisalabad
Chak# 97- RB, Faisalabad
Chak# 204- RB, Faisalabad
Sitara Tower, Civil Line, Faisalabad
Flat No.7, 2nd Floor, Malik Complex,
Jinnah Avenue, Blue Area, Islamabad
Vehari Road, Multan
110-A Siddique Trade Center, Lahore
Business Center, Mumtaz Hassan Road, Karachi
Manufacturing unit
Power Generation Unit (CFPP)
Guest House
Site Office
Site Office
Site Office
Site Office
Site Office
The covered area includes double storey building.
61

Land - freehold
Buildings on freehold land
Plant and machinery
-
-
-
Level 1 Level 2 Level 3 Total
-
-
-
Rupees
NOTES TO THE FINANCIAL STATEMENTSFOR THE YEAR ENDED JUNE 30, 2019
Foreign Values:
Local components:
The 70% of original capitalized cost in Pak Rupee is converted to USD $ prices by diving the $ rate of
the year of procurement. This $ price of each equipment is then converted into current Rupees
price by multiplying the original $ price by current $ rate (30-06-2019). These are the basis used by
the valuer for valuation of the New Replacement value of plant & machinery in Pak
Rupee.
The remaining 30% of original capitalized cost of local purchased machinery equipment have been
fairly escalated by using compounded inflation factor calculated on compounding basis since the
year 1990. The actual inflation in Pakistan (CPI) since 1986 to date has been fluctuating between 4
to 12 % per year (except 20% in the year 2009) as per economic survey of Pakistan. The
compounded factor (CIF) is the adjusted for inflation. The re-instatement factor is obtained by
discounting the above CIF by 35 % as per Economic Survey of Pakistan.
Thus after summing the foreign and local amounts the valuer has arrived to New Replacement
Value of Plant & machinery.
Depreciation due to usage has been applied on all assets of machinery at 5% to 10% per annum on
written down value basis to arrive at a fair present / depreciated market value of the
assets.
Forced Sales Value (FSV) of land, buildings and machinery is Rs. 1,016.89 million, Rs. 1,415.25
million and Rs. 8,276.55 million respectively as at June 30, 2019.
Details of the Company's revalued assets and information about fair value hierarchy, as at June 30,
2019 are as follows.
1,271,108,000
1,769,060,000
11,035,400,000
1,271,108,000
1,769,060,000
11,035,400,000
Details of the Company's revalued assets and information about fair value hierarchy,
as at June 30, 2018 are as follows.
Land - freehold
Buildings on freehold land
Plant and machinery
-
-
-
-
-
-
768,019,499
1,400,714,162
6,261,008,055
768,019,499
1,400,714,162
6,261,008,055
5.6
5.5
Level 1 Level 2 Level 3 TotalRupees
62

NOTES TO THE FINANCIAL STATEMENTSFOR THE YEAR ENDED JUNE 30, 2019
Land
Buildings on free hold land
Plant and Machinery
Cost
Accumulated
depreciation Book Value
2019
2018
327,264,537
1,930,174,694
9,668,106,525
10,308,340,248
11,925,545,756
-
597,747,320
3,009,966,551
3,170,802,555
3,607,713,871
327,264,537
1,332,427,374
6,658,139,974
7,137,537,693
8,317,831,885
2019
Rupees
2018
Rupees
Note
5.8
6.
6.1
7.
Capital work-in-progress
INTANGIBLE ASSETS
Cost
Accumulated amortization
INVESTMENT PROPERTY
Civil work
Plant and machinery including in transit
Advance for property, plant and equipment
Major spare parts and stand-by equipment
qualifying as property, plant and equipment
As at July 01
Additions
As at June 30
As at July 01
Amortization during the year
As at June 30
Computer software are being amortized at 10% using reducing balance method.
Land
Buildings
2,213,000
49,404,824
2,250,462
33,242,741
87,111,027
21,000,000
550,256
21,550,256
9,219,725
1,210,960
10,430,685
11,119,571
3,246,711,918
49,793,485
3,296,505,403
2019
Rupees
2018
Rupees
1,083,679
54,229,345
3,406,126
21,280,622
79,999,772
21,000,000
-
21,000,000
7,910,805
1,308,920
9,219,725
11,780,275
2,979,387,948
54,579,865
3,033,967,813
Had there been no revaluation the cost, accumulated depreciation and book value of revalued
assets as at June 30, 2019 would have been as follows:
5.7
Rupees
6.1
7.1
7.2
Note
63

NOTES TO THE FINANCIAL STATEMENTSFOR THE YEAR ENDED JUNE 30, 2019
2019
Rupees
2018
Rupees
Note
7.1
7.2
8.
Land
Buildings
Cost
Accumulated depreciation
Balance at the beginning of the year
Add: Acquisitions during the year
Less: Disposal during the year
Balance at the end of the year
Balance at the beginning of the year
Add: Addition during the year
Less: Disposal during the year
Balance at the end of the year
At the beginning of the year
For the year
Less: Accumulated depreciation on disposed asset
At the end of the year
Written down value at the end of year
2,979,387,948
267,323,970
-
3,246,711,918
89,276,765
-
-
89,276,765
34,696,900
4,786,380
-
39,483,280
49,793,485
2,854,288,282
1,813,047,693
(1,687,948,027)
2,979,387,948
101,864,880
5,426,410
(18,014,525)
89,276,765
29,583,114
6,802,534
(1,688,748)
34,696,900
54,579,865
The Company has invested in freehold land, residential plots and building portions covering area
of 3,407 kanals and 11 marla for the purpose of capital appreciation and earning rental income.
These properties are situtated within the Province of Punjab.
The rental income earned by the Company from its investment property amounted to Rs. 30.17
million (2018: Rs. 30.10 million).
These includes investments in Dawood Family Takaful Limited and Takaful Pakistan Limited. These
investments in equity instruments are not held for trading. Instead, they are held for long-term
strategic purposes. Accordingly, the Company has elected to designate these investments in
equity instruments as at FVTOCI as they believe that recognizing short-term fluctuations in these
investments’ fair value in profit or loss would not be consistent with the Company’s strategy of
holding these investments for long-term purposes and realizing their performance potential in the
long run.
LONG TERM INVESTMENTS
31
64

NOTES TO THE FINANCIAL STATEMENTSFOR THE YEAR ENDED JUNE 30, 2019
2019
Rupees
2018
Rupees
Note
9.
9.1
9.2.1
LONG TERM LOANS AND ADVANCES
Deferred consideration on sale of investment property
Deferred consideration on sale of
investment property
Loans and advances
Deferred consideration on sale of
investment property
Less: current portion shown in current assets
1,064,509,787
17,615,287
1,082,125,074
1,414,509,787
(350,000,000)
1,064,509,787
1,316,803,005
32,308,146
1,349,111,151
1,316,803,005
-
1,316,803,005
During March 2018, the Company entered into an agreement for sale of investment property land
measuring 1,510 kanals situated at 199 RB Faisalabad to M/s Sitara Developers (Private) Limited,
at an aggregate sale price of Rs. 2,190 million. Twenty percent advance amount of total sale price
amounting to Rs. 438 million has been received and balance receivable amounting to Rs. 1,752
million will be received from M/s Sitara Developers (Private) Limited over a period of 6 years (5
installments) which has been recorded in the financial statements at amortised cost.
9.1.1
2019
Rupees
2018
Rupees
Note
Loans and advances
Considered good
Secured
Unsecured
Staff
Staff
Less: current portion shown in current assets 14
9.2.1
9.2
3,882,504
37,898,506
41,781,010
(24,165,723)
17,615,287
25,981,929
32,171,546
58,153,475
(25,845,329)
32,308,146
The maximum aggregate amount due at the end of any month during the year was Rs. 56.91
million (2018: Rs. 60.28 million).
9.1
9.2
14
9.1.1
65

NOTES TO THE FINANCIAL STATEMENTSFOR THE YEAR ENDED JUNE 30, 2019
2019
Rupees
2018
RupeesNoteLONG TERM DEPOSITS
STORES, SPARE PARTS AND LOOSE TOOLS
STOCK IN TRADE
Security deposits for:
Electricity
Gas
WASA
Others
Stores
Spare parts
Loose tools
Raw and packing material
Work in process
Finished goods
Waste
10.
11.
12.
38,903,990
72,291,588
155,354
458,400
111,809,332
910,633,084
35,180,900
4,257,202
950,071,186
423,564,494
-
899,807,416
5,108,419
1,328,480,329
38,775,110
71,951,168
-
483,200
111,209,478
561,527,008
179,032,860
4,082,582
744,642,450
300,918,880
14,928,200
625,032,718
9,767,491
950,647,289
13. TRADE DEBTS
Related parties - considered good
Others
Aziz Fatima Trust Hospital
- Considered good
Local - unsecured
Foreign-secured
- Considered doubtful
Unsecured
The maximum aggregate amount of receivable due from related party at the end of any month
during the year was Rs. 0.48 million (2018: Rs 0.65 million).
Trade receivables are non-interest bearing and relate to different products being sold on credit
to customers. The credit period allowed on these products are generally on fifteen (15) days
terms for dealers and twenty five (25) days terms for institutions.
Before accepting any new customer, the Company makes its own survey to assess the potential
customer’s credit quality and defines credit limits for customer. Limits attributed to customers
are reviewed once a year.
Allowance for expected credit losses
Trade debts written off
477,468
1,296,683,138
41,219,950
13,900,472
1,351,803,560
(175,306,056)
(99,062)
1,176,398,442
1,176,875,910
-
1,129,901,750
7,866,008
93,345,213
1,231,112,971
(93,345,213)
-
1,137,767,758
1,137,767,758
13.1
13.2
13.3
13.1
13.4
31
66

13.4
14.
14.1
LOANS AND ADVANCES
Movement in provision for doubtful advances
TRADE DEPOSITS AND PREPAYMENTS
Current portion of long term loans
and advances
eferred consideration
on sale of investment property
Advance tax
Advances - considered good
For expenses
Letters of credit fee, margin and expenses
Suppliers and contractors
Advances - considered doubtful
For expenses
Suppliers and contractors
Provision for doubtful advances
At beginning of the year
Reversed during the year
At end of the year
Trade deposits
Prepayments
Current portion d
15.
NOTES TO THE FINANCIAL STATEMENTSFOR THE YEAR ENDED JUNE 30, 2019
2019
Rupees
2018
Rupees
Note
Movement in allowance for expected credit losses
At beginning of the year
Effect of implementation of IFRS 9
Adjusted balance as at beginning of the year
Impairment losses on financial assets
At end of the year
93,345,213
56,181,174
149,526,387
25,779,669
175,306,056
75,820,861
-
75,820,861
17,524,352
93,345,213
24,165,723
350,000,000
374,165,723
1,257,590,686
12,748,789
520,930,576
706,542,285
1,240,221,650
42,589
599,955
(642,544)
-
2,871,978,059
642,544
-
642,544
3,473,802
1,388,750
4,862,552
25,845,329
-
25,845,329
882,857,644
12,271,720
678,050,142
814,993,108
1,505,314,970
42,589
599,955
(642,544)
-
2,414,017,943
1,925,430
(1,282,886)
642,544
3,799,970
1,198,114
4,998,084
14.1
9.2
9.1
67

16.
NOTES TO THE FINANCIAL STATEMENTSFOR THE YEAR ENDED JUNE 30, 2019
2019
Rupees
2018
Rupees
Note
OTHER RECEIVABLES
Unsecured - considered good
Receivable from provident fund - related party
Others
3,584,275
10,991,751
14,576,026
-
9,975,716
9,975,716
This represents contribution of the Company and employees in respect of provident fund.16.1.
OTHER FINANCIAL ASSETS
Investments designated as at fair value through
other comprehensive income (FVTOCI)
Investments measured at fair value through
profit or loss (FVTPL)
Equity investments
Mutual funds
200,727,034
135,448,070
336,175,104
194,960,587
157,293,736
352,254,323
17.
3,220,000
753,382
674,661
72,000
82,197
84,698
40,000
22,500
66,000
33,629
27,500
-
25,000
160,000
24,000
7,200
17.1 Investments designated as at FVTOCI
Fully paid ordinary shares of Rs. 10 each.
2019
No. of shares
2018
3,480,000
577,176
674,661
72,000
82,197
76,999
40,000
22,500
55,000
30,000
25,000
35,000
25,000
100,000
-
6,000
Sitara Peroxide Limited
Meezan Bank Limited
Sitara Energy Limited
D.G Khan Cement Company Limited
Engro Polymer & Chemical Limited
Ittehad Chemicals Limited
Fauji Cement Company Limited
Maple Leaf Cement Factory Limited
Pakistan Oilfield Limited
Hub Power Company Limited
Engro Corporation Limited
Kot Addu Power Company Limited
Engro Fertilizers Limited
Fauji Foods Limited
National Foods Limited
Pakistan State Oil Company Limited
61,759,596
65,664,775
17,473,720
4,070,880
2,216,031
2,283,458
629,200
537,525
26,788,740
2,648,283
7,304,000
-
1,599,250
2,110,400
4,419,840
1,221,336
200,727,034
60,412,800
47,166,823
15,375,524
8,243,280
2,577,698
2,671,602
914,000
1,141,650
36,948,450
2,764,800
7,846,500
1,886,850
1,872,750
3,228,000
-
1,909,860
194,960,587
16.1
17.1
17.2
68
2019
Rupees
2018
Rupees

NOTES TO THE FINANCIAL STATEMENTSFOR THE YEAR ENDED JUNE 30, 2019
17.2
2019
No. of units
2018 2019
Rupees
2018
These investments in equity instruments are not held for trading and are instead, they are held for
medium to long-term strategic purposes. Accordingly, the Company has elected to designate
these investments in equity instruments as at FVTOCI as they believe that recognising short-term
fluctuations in these investments’ fair value in profit or loss would not be consistent with the
Company’s strategy of holding these investments for long-term purposes and realising their
performance potential in the long run.
Investments measured at FVTPL
Units having face value of Rs. 50 each.
296,935
2,203,077
98,745
97,506
-
1,243,760
-
-
1,261,670
2,314,116
Al-Meezan Investment Management Limited
Meezan Rozana Amdani Fund
Meezan Sovereign Fund (MSF) (T.D)
Meezan Islamic Income Fund
NAFA Islamic Income Fund
15,255,165
110,153,874
5,083,966
4,955,065
-
135,448,070
66,291,070
-
-
67,880,024
23,122,642
157,293,736
These comprise portfolio of investments acquired principally for sale in the near term and
accordingly measured at FVTPL.
CASH AND BANK BALANCES
Cash in hand
Cash at banks
In current accounts
In saving accounts
16,204,772
53,343,784
32,961,437
86,305,221
102,509,993
16,918,895
35,519,255
27,224,998
62,744,253
79,663,148
18.
These are shariah compliant bank balances and carry profits at rates ranging from 4.26% to
7.26% (2018: 2.40% to 4.27%) per annum.
The Company has banking relationships majorly with the banks having Islamic banking system.
18.1
18.2
Rupees
2019
Rupees
2018
RupeesNote
18.1
69

NOTES TO THE FINANCIAL STATEMENTSFOR THE YEAR ENDED JUNE 30, 2019
Class "B" ordinary shares do not carry any voting rights.
Number of shares held by associated companies or related parties are 478,499.
The Company has no reserved shares under options and sales contracts.
The Board of Directors of the Company act by majority vote. The membership of the Board of
Directors reflects as closely as possible the proportion in which the shares of the Company are
held.
Rights and privileges of Board of Directors
SHARE CAPITAL19.
40,000,000
20,000,000
8,640,000
10,804,398
1,985,009
21,429,407
40,000,000
20,000,000
8,640,000
10,804,398
1,985,009
21,429,407
Authorized
Ordinary shares of Rs. 10 each
Class "A"
Class "B"
Issued, subscribed and paid up
Class "A" ordinary shares of Rs.10/- each
- fully paid in cash
- issued as fully paid bonus shares
- issued as fully paid under scheme
of arrangement for amalgamation
400,000,000
200,000,000
86,400,000
108,043,980
19,850,090
214,294,070
400,000,000
200,000,000
86,400,000
108,043,980
19,850,090
214,294,070
2019
Rupees
2018
Rupees
2019
No. of Shares
2018
19.1
19.2
19.3
19.4
2019
Rupees
2018
Rupees
Note
20. RESERVES
Capital
Revenue
Other
Share premium
Surplus on revaluation of property
Plant and equipment
General reserve
Reserve on re-measurement of
equity instruments at FVTOCI
Reserve on re-measurement of
post retirement benefits net of tax
20.1
20.2
20.3
97,490,410
4,513,641,059
1,225,000,000
51,449,097
(4,615,155)
5,882,965,411
97,490,410
1,164,730,520
1,225,000,000
50,344,947
(7,338,727)
2,530,227,150
2019
No. of Shares
2018 2019Rupees
2018Rupees
70

NOTES TO THE FINANCIAL STATEMENTSFOR THE YEAR ENDED JUNE 30, 2019
This represents premium realized on issue of right shares amounting to Rs. 34.55 million during
1991-92, 1993-94 and 1994-95 at the rate of 10%, 10% and 12.50% respectively and amounting to
Rs. 62.94 million on issue of 1,985,009 fully paid ordinary shares to the shareholders of Sitara
Spinning Mills Limited under scheme of amalgamation of Sitara Chemical Industries Limited and
Sitara Spinning Mills Limited, sanctioned by Honorable Sindh High Court in 1999.
The general reserve is used from time to time to transfer profits from un-appropriated profit.
There is no policy of regular transfer.
This reserve represents the unrealized surplus on remeasurement of equity instruments as at
FVTOCI as at June 30, 2019.
20.1
20.2
20.3
LONG TERM FINANCING
From banking companies and other financial
institutions - secured
Diminishing Musharka (from financial institutions - secured)
2019
Rupees
2018
Rupees
2,054,446,636
2,054,446,636
1,174,946,885
1,174,946,885
21.
Diminishing Musharka (from financial institutions - secured)21.1
2019 2018
This Diminishing MusharikaFacility was sactioned for amountof Rs. 200 million. Facility isrepayable in 14 equal quarterlyinstallments with grace period of06 months commencing fromSeptember 03, 2019 and ending onDecember 03, 2022.This Diminishing MusharikaFacility was sactioned for amountof Rs. 300 million. Facility isrepayable in 14 equal quarterlyinstallments with grace period of06 months commencing fromDecember 27, 2019 and ending onMarch27, 2023.This Diminishing Musharika facilitywas sanctioned for amount of RS.500 million. Facility is repayable in14 equal quarterly installmentswith grace period of 18 months.The repaymentwill start fromApril11, 2020 and ending on July 11,2023.
This Diminishing Musharika facilitywas sanctioned for amount of RS.175 million. The amount isrepayable in 16 equal quarterlyinstalments with grace period of12 months. The repayment willstart from October 04, 2020 andending on June 27, 2024.
Askari Bank Ltd
Askari Bank Ltd
Meezan Bank Limited
Meezan Bank Limited
Three months KIBOR plus1.00 % (2018: Nil) pera n n um pay a b l e o nquarterly basis.
Three months KIBOR plus1.00 % (2018: Nil) perannum payable onquarterly basis.
Three months KIBOR plus1.00 % (2018: Nil) perannum payable onquarterly basis.
Three months KIBOR plus1.15 % (2018: Nil) perannum payable onquarterly basis.
1st Pari Passu charge overCaustic Soda-Liquid-BMR-II plantwith 25%Margin.
a) 1st perpassu charge ofRs. 267m including 25%margin over Caustic Soda-Liquid-BMR-II plant.b) 1st exclusive charge ofRs. 133 million overCaustic Sodaflake Plant(CSP-III) with 25%margin.a) Ranking charge by wayof hypothecation overplant &machinery ofM-III(Membrane-III) plant with25% margin of ChemicalDivision.b ) 1 s t e x c l u s i v ehypothecation chargeover all present and futureplant and machinery ofMembrane-I plant.1st exclusive and specificc h a r g e b y w a y o fhypothecation over 04Gas Fired Generators ofJenbacher GE, pertainingto Gas F i red PowerP ro je c t , l o ca ted onFaisalabad-SheikhupuraRoad, Faisalabad.
200,000,000
300,000,000
498,972,826
175,000,000
-
-
-
-
RepaymentSecurityProfitDescriptionRupeesRupees
71
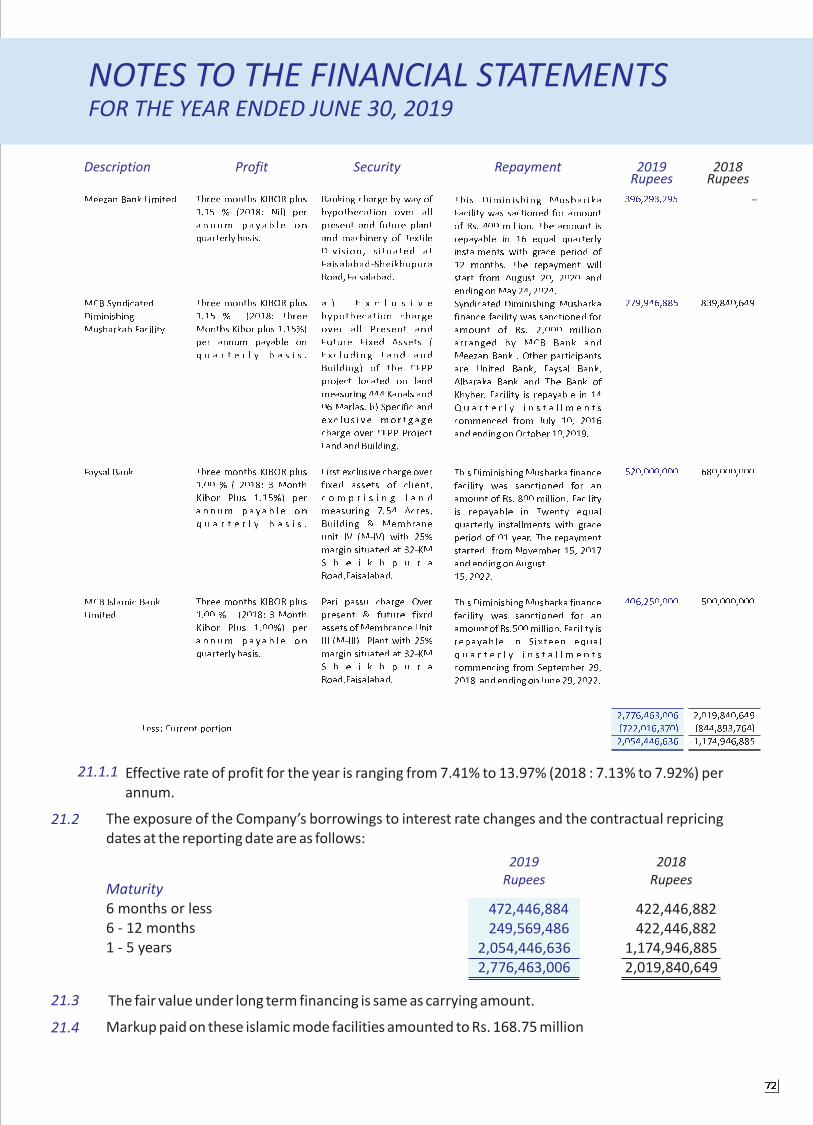
2019 2018RepaymentSecurityProfitDescriptionRupeesRupees
NOTES TO THE FINANCIAL STATEMENTSFOR THE YEAR ENDED JUNE 30, 2019
Effective rate of profit for the year is ranging from 7.41% to 13.97% (2018 : 7.13% to 7.92%) per
annum.
The exposure of the Company’s borrowings to interest rate changes and the contractual repricing
dates at the reporting date are as follows:
21.1.1
2019
Rupees
2018
Rupees
21.2
Maturity
6 months or less
6 - 12 months
1 - 5 years
472,446,884
249,569,486
2,054,446,636
2,776,463,006
422,446,882
422,446,882
1,174,946,885
2,019,840,649
The fair value under long term financing is same as carrying amount.
Markup paid on these islamic mode facilities amounted to Rs. 168.75 million
21.3
21.4
This Diminishing MusharikaFacility was sactioned for amountof Rs. 400 million. The amount isrepayable in 16 equal quarterlyinstalments with grace period of12 months. The repayment willstart from August 20, 2020 andending onMay24, 2024.Syndicated Diminishing Musharkafinance facility was sanctioned foramount of Rs. 2,000 millionarranged by MCB Bank andMeezan Bank . Other participantsare United Bank, Faysal Bank,Albaraka Bank and The Bank ofKhyber. Facility is repayable in 14Q u a r t e r l y i n s t a l l m e n t scommenced from July 10, 2016and ending onOctober 10,2019.
This DiminishingMusharka financefacility was sanctioned for anamount of Rs. 800 million. Facilityis repayable in Twenty equalquarterly installments with graceperiod of 01 year. The repaymentstarted from November 15, 2017and ending onAugust15, 2022.This DiminishingMusharka financefacility was sanctioned for anamountof Rs.500million. Facility isrepayable in Sixteen equalq u a r t e r l y i n s t a l l m e n t scommencing from September 29,2018 and ending on June 29, 2022.
Three months KIBOR plus1.15 % (2018: Nil) pera n n um pay a b l e o nquarterly basis.
Three months KIBOR plus1.15 % (2018: ThreeMonths Kibor plus 1.15%)per annum payable onq u a r t e r l y b a s i s .
Three months KIBOR plus1.00 % ( 2018: 3 MonthKibor Plus 1.15%) pera n n um pay a b l e o nq u a r t e r l y b a s i s .
Three months KIBOR plus1.00 % (2018: 3 MonthKibor Plus 1.00%) pera n n um pay a b l e o nquarterly basis.
Ranking charge by way ofhypothecation over allpresent and future plantand machinery of TextileDivis ion, s ituated atFaisalabad-SheikhupuraRoad, Faisalabad.a ) E x c l u s i v ehypothecation chargeover all Present andFuture Fixed Assets (Exc lud ing Land andBuilding) of the CFPPproject located on landmeasuring 444 Kanals and06 Marlas. b) Specific andexc l u s i v e mo r t ga gecharge over CFPP ProjectLand andBuilding.First exclusive charge overfixed assets of client,c o m p r i s i n g l a n dmeasuring 7.54 Acres,Building & Membraneunit IV (M-IV) with 25%margin situated at 32-KMS h e i k h p u r aRoad,Faisalabad.Pari passu charge Overpresent & future fixrdassets of Membrance UnitIII (M-III) Plant with 25%margin situated at 32-KMS h e i k h p u r aRoad,Faisalabad.
Meezan Bank Limited
MCB SyndicatedDiminishingMusharkah Facility
Faysal Bank
MCB Islamic BankLimited
396,293,295
279,946,885
520,000,000
406,250,000
-
839,840,649
680,000,000
500,000,000
Less: Current portion2,776,463,006(722,016,370)2,054,446,636
2,019,840,649(844,893,764)1,174,946,885
72
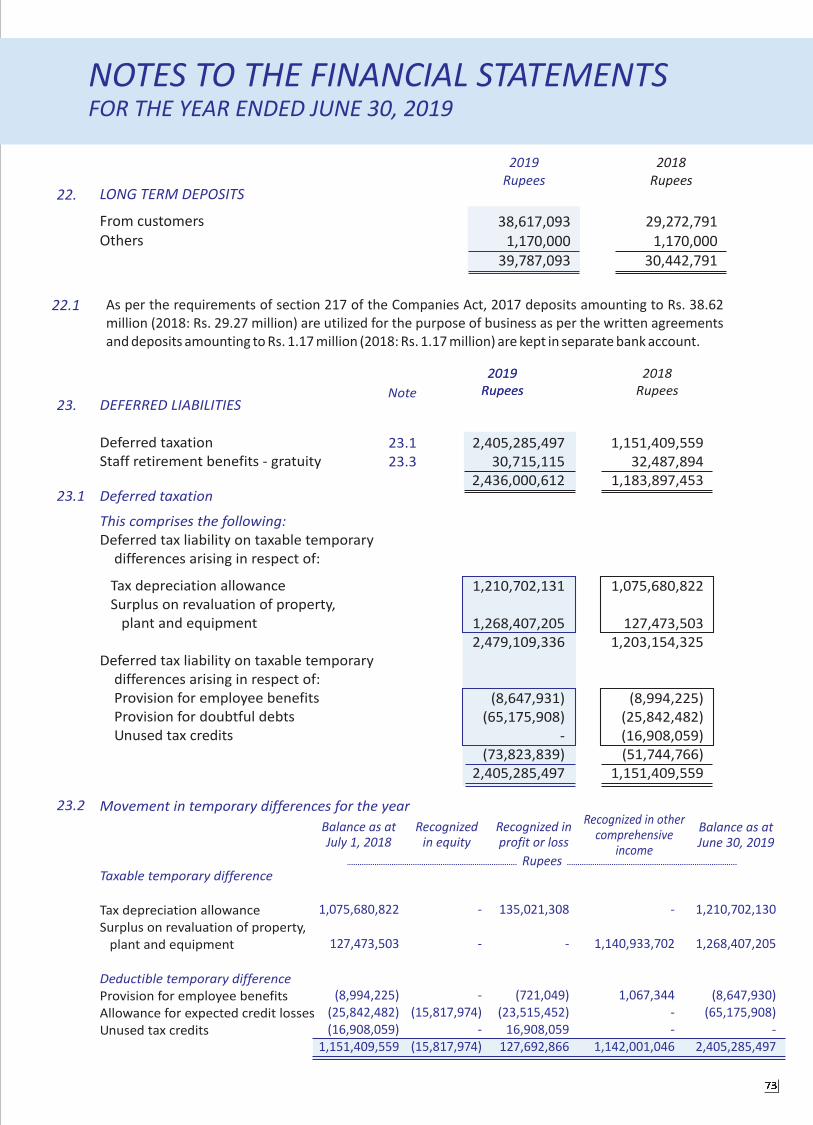
NOTES TO THE FINANCIAL STATEMENTSFOR THE YEAR ENDED JUNE 30, 2019
Note
2018
Rupees
As per the requirements of section 217 of the Companies Act, 2017 deposits amounting to Rs. 38.62
million (2018: Rs. 29.27 million) are utilized for the purpose of business as per the written agreements
and deposits amounting to Rs. 1.17 million (2018: Rs. 1.17 million) are kept in separate bank account.
22.1
DEFERRED LIABILITIES
Deferred taxation
Staff retirement benefits - gratuity
Deferred taxation
This comprises the following:
Deferred tax liability on taxable temporary
differences arising in respect of:
Tax depreciation allowance
Surplus on revaluation of property,
plant and equipment
Deferred tax liability on taxable temporary
differences arising in respect of:
Provision for employee benefits
Provision for doubtful debts
Unused tax credits
23.
23.1
2,405,285,497
30,715,115
2,436,000,612
1,210,702,131
1,268,407,205
2,479,109,336
(8,647,931)
(65,175,908)
-
(73,823,839)
2,405,285,497
23.1
23.3
1,151,409,559
32,487,894
1,183,897,453
1,075,680,822
127,473,503
1,203,154,325
(8,994,225)
(25,842,482)
(16,908,059)
(51,744,766)
1,151,409,559
Movement in temporary differences for the year23.2
Balance as atJuly 1, 2018
Recognizedin equity
Recognized inprofit or loss
Recognized in othercomprehensive
income
Balance as atJune 30, 2019
RupeesTaxable temporary difference
Deductible temporary difference
Tax depreciation allowance
Surplus on revaluation of property,
plant and equipment
Provision for employee benefits
Allowance for expected credit losses
Unused tax credits
1,075,680,822
127,473,503
(8,994,225)
(25,842,482)
(16,908,059)
1,151,409,559
-
-
-
(15,817,974)
-
(15,817,974)
135,021,308
-
(721,049)
(23,515,452)
16,908,059
127,692,866
-
1,140,933,702
1,067,344
-
-
1,142,001,046
1,210,702,130
1,268,407,205
(8,647,930)
(65,175,908)
-
2,405,285,497
2019
Rupees
2019
Rupees
2019
Rupees
2018
Rupees22. LONG TERM DEPOSITS
From customers
Others
38,617,093
1,170,000
39,787,093
29,272,791
1,170,000
30,442,791
73

NOTES TO THE FINANCIAL STATEMENTSFOR THE YEAR ENDED JUNE 30, 2019
23.3
Balance as atJuly 1, 2017
Recognizedin equity
Recognized inprofit or loss
Recognized in othercomprehensive
income
Balance as atJune 30, 2018
Rupees
Taxable temporary difference
Deductible temporary difference
Tax depreciation allowance
Surplus on revaluation of property,
plant and equipment
Provision for employee benefits
Allowance for expected credit losses
Unused tax credits
1,101,393,050
160,068,508
(7,994,640)
(22,314,079)
(275,179,113)
955,973,726
-
(5,335,617)
-
-
-
(5,335,617)
(25,712,228)
(27,259,388)
(580,994)
(3,528,403)
258,271,054
201,190,041
-
-
(418,591)
-
-
(418,591)
1,075,680,822
127,473,503
(8,994,225)
(25,842,482)
(16,908,059)
1,151,409,559
Staff retirement benefits - gratuity
Movement in liability
Movement in the present value of defined benefit
obligation is as follows:
Expense recognized in profit and loss account is as follows
Charge for the year has been allocated as follows:
At beginning of the year
Charge for the year
Remeasurement (income) / loss recognized
Benefits paid during the year
At the end of the year
Present value of defined benefit obligation as at July 01
Current service cost
Interest cost
Benefits paid
Remeasurements:
Actuarial gain / (losses) from changes in financial assumptions
Present value of defined benefit obligation as at June 30
Current service cost
Interest cost
Cost of sales
Administrative expenses
2019
Rupees
2018
Rupees
32,487,894
11,071,307
(3,790,916)
(9,053,170)
30,715,115
32,487,894
8,618,213
2,453,094
(9,053,170)
(3,790,916)
30,715,115
8,618,213
2,453,094
11,071,307
7,749,915
3,321,392
11,071,307
27,164,935
9,490,011
1,443,416
(5,610,468)
32,487,894
27,164,935
7,602,134
1,887,877
(5,610,468)
1,443,416
32,487,894
7,602,134
1,887,877
9,490,011
6,453,207
3,036,804
9,490,011
23.4
23.5
23.6
74

NOTES TO THE FINANCIAL STATEMENTSFOR THE YEAR ENDED JUNE 30, 2019
23.7
2019
Rupees
2018
RupeesTotal remeasurement chargeable to
other comprehensive income:
Remeasurement of defined benefit obligation:
Actuarial gain / (losses) from changes in
financial assumptions (3,790,916)
(3,790,916)
1,443,416
1,443,416
Projected unit credit method, based on the following significant assumptions, is used for
valuation of gratuity:
23.8
Discount rate
Expected rate of salary increase
Average retirement age of employee
14.25%
12.25%
60 years
9.00%
8.00%
60 years
2019 2018
The sensitivity of defined benefit obligation to changes in weighted principal assumptions is:23.9
Discount rate
Salary growth
Impact on defined benefit obligation
Change in
assumption
Increase in
assumption
Decrease in
assumption
1%
1%
28,265,391
33,762,812
33,565,942
28,061,690
The aforementioned sensitivity analysis is based on a change in an assumption while holding all
other assumptions constant. In practice, this is unlikely to occur, and changes in some of the
assumptions may be correlated. When calculating the sensitivity of the defined benefit obligation
to significant actuarial assumptions the same method (present value of the defined benefit
obligation calculated with the projected unit credit method at the end of the reporting period) has
been applied as when calculating the gratuity liability recognized within the balance
sheet.
Maturity profile of the defined23.10
23.10.1 Weighted average duration of the benefit (Years)
23.10.2 Distribution of timing of benefit
payments (time in years)1
2
3
4
5
6 to 10
11 and above
2,413,216
1,939,451
2,541,623
6,031,488
1,603,739
19,790,649
203,524,583
1,894,920
2,194,606
1,614,453
2,111,462
5,088,231
14,673,859
79,938,745
8.78 9.95
2019
Rupees
2018
Rupees
75

NOTES TO THE FINANCIAL STATEMENTSFOR THE YEAR ENDED JUNE 30, 2019
Risk associated with defined benefit plans
Investment risks
Longevity risks
This risk arises when the actual performance of the investment is lower than expectation and thus
creating a shortfall in the funding objectives.
This risk arises when the actual lifetime of retirees is longer than expectation. This risk is measured
at the plan level over the entire retiree population.
23.11
24. TRADE AND OTHER PAYABLES
Creditors
Accrued liabilities
Advances from customers
Payable to provident fund - related party
Retentions / security deposits
Withholding tax
Workers' profit participation fund
Workers' welfare fund
Others
855,669,839
1,389,925,462
56,834,046
-
57,584,251
2,468,495
6,574,834
46,899,249
140,841
2,416,097,017
833,965,974
1,342,985,183
22,163,595
958,307
61,287,474
2,831,667
910,648
25,164,485
2,951,200
2,293,218,533
This represents contribution of the Company and employees in respect of contribution from last
month's salary. Subsequent to year end same was deposited in the provident fund's separate bank
account.
Workers' profit participation fund
Movement
Workers' profit participation fund
At beginning of the year
Less: amount paid to workers on behalf of the fund
Allocation for the year
At end of the year
6,574,834
6,574,834
910,648
51,532,560
(50,621,912)
57,196,746
6,574,834
910,648
910,648
(336,149)
71,033,605
(71,369,754)
72,280,402
910,648
24.2
24.1
24.2.1
PROFIT / FINANCIAL CHARGES PAYABLE
Long term financing
Murabaha financing / short term borrowings
66,951,417
119,402,466
186,353,883
26,981,707
49,991,648
76,973,355
25.
2019
Rupees
2018
RupeesNote
24.1
24.2
32
24.2.1
2019
Rupees
2018
RupeesNote
76

NOTES TO THE FINANCIAL STATEMENTSFOR THE YEAR ENDED JUNE 30, 2019
26.
2019
Rupees
2018
Rupees
SHORT TERM BORROWINGS
Secured
From banking companies - Islamic financing facilities 4,333,342,248
4,333,342,248
3,525,026,677
3,525,026,677
The Company has obtained Islamic financing facilities of Rs. 50 million from MCB Islamic Bank,
Rs. 810 million from Meezan Bank Limited - Islamic, Rs. 500 million from Duabi Islamic Bank -
Islamic, Rs. 125 million from Standard Chartered Bank Limited - Islamic, Rs. 200 million from
Bank Islami - Islamic, Rs. 400 million from Askri Bank Limited - Islamic, Rs. 370 million from Habib
Bank Limited - Islamic, Rs. 700 million from The Bank of Punjab - Islamic, Rs. 150 million from
Faysal Bank Limited - Islamic, Rs. 278 million from UBL Ameen - Islamic, Rs. 250 million from
Soneri Bank Limited - Islamic and Rs. 500 million from The Bank Of Khyber - Islamic. Markup paid
on these facilities amounted to Rs. 353.86 million.
The aggregate unavailed facilities from banking companies amounted to Rs. 1,767 million (2018:
Rs. 1,775 million). These are subject to profit margin ranging from 6.90% to 13.82% (2018: 6.81%
to 7.78%) per annum and are secured against joint pari-passu charge over present and future
current assets of the chemical division and textile division.
26.1
26.2
CONTINGENCIES AND COMMITMENTS
Contingencies
Commitments
Guarantees issued by banks on behalf of the Company
Outstanding letters of credit for raw material and spare parts
259,984,467
268,872,532
310,703,832
516,465,946
2019
Rupees
2018
Rupees27.
27.1
27.2
2019
Rupees
2018
Rupees
28. SALES - NET
Chemical
Textile
Sales - net
Less:
Commission and discount
Sales tax
12,526,718,410
2,372,857,620
14,899,576,030
(509,489,101)
(1,691,979,899)
12,698,107,030
12,296,380,019
2,205,720,371
14,502,100,390
(527,682,409)
(1,709,591,384)
12,264,826,597
28.1 All revenue earned by the Company is shariah compliant.
77

2019
Rupees
2018
Rupees
Note
29.
Raw material consumed
Fuel and power
Salaries, wages and benefits
Stores and spares
Repair and maintenance
Vehicle running and maintenance
Travelling and conveyance
Insurance
Depreciation
Amortization
Others
Opening stock
Closing stock
Opening stock - including waste
Closing stock - including waste
Work in process
Finished stocks
COST OF SALES
Cost of goods manufactured
NOTES TO THE FINANCIAL STATEMENTSFOR THE YEAR ENDED JUNE 30, 2019
2,714,106,083
5,415,708,365
513,554,450
492,078,989
64,193,630
1,676,053
36,119,615
29,052,728
918,893,599
1,210,960
7,170,004
10,193,764,476
14,928,200
-
14,928,200
10,208,692,676
634,800,209
(904,915,835)
(270,115,626)
9,938,577,050
2,713,057,076
5,273,698,604
511,064,068
211,822,991
56,452,602
2,795,940
29,146,956
25,781,568
885,202,518
1,308,920
5,800,509
9,716,131,752
11,629,718
(14,928,200)
(3,298,482)
9,712,833,270
554,063,040
(634,800,209)
(80,737,169)
9,632,096,101
Raw material consumed
Opening stock
Purchases
Closing stock
29.1
300,918,880
2,836,751,697
3,137,670,577
(423,564,494)
2,714,106,083
628,634,121
2,385,341,835
3,013,975,956
(300,918,880)
2,713,057,076
Salaries, wages and benefits include Rs. 7.75 million (2018: Rs. 6.46 million) in respect of
employee retirement benefits.
29.2
29.1
29.2
5.2
6
78
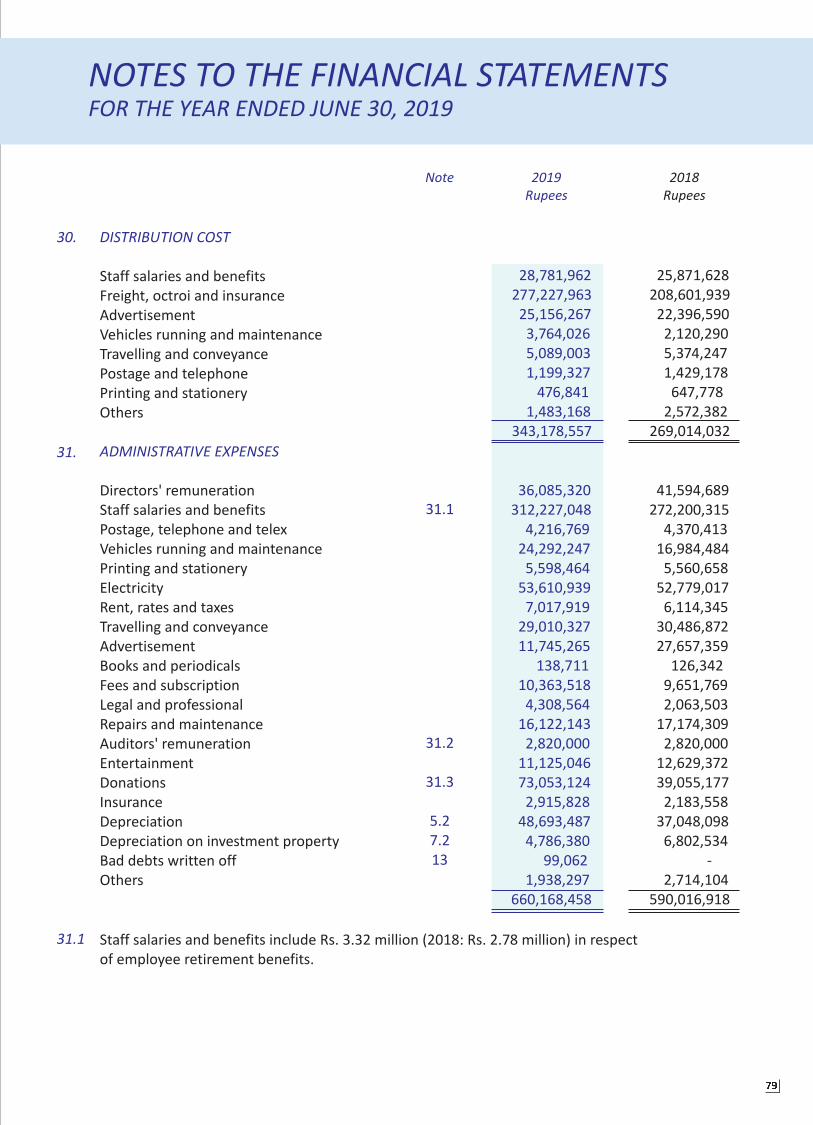
NOTES TO THE FINANCIAL STATEMENTSFOR THE YEAR ENDED JUNE 30, 2019
2019
Rupees
2018
Rupees
Note
30. DISTRIBUTION COST
ADMINISTRATIVE EXPENSES
Staff salaries and benefits
Freight, octroi and insurance
Advertisement
Vehicles running and maintenance
Travelling and conveyance
Postage and telephone
Printing and stationery
Others
Directors' remuneration
Staff salaries and benefits
Postage, telephone and telex
Vehicles running and maintenance
Printing and stationery
Electricity
Rent, rates and taxes
Travelling and conveyance
Advertisement
Books and periodicals
Fees and subscription
Legal and professional
Repairs and maintenance
Auditors' remuneration
Entertainment
Donations
Insurance
Depreciation
Depreciation on investment property
Bad debts written off
Others
31.
31.1
31.2
31.3
5.2
7.2
13
28,781,962
277,227,963
25,156,267
3,764,026
5,089,003
1,199,327
476,841
1,483,168
343,178,557
25,871,628
208,601,939
22,396,590
2,120,290
5,374,247
1,429,178
647,778
2,572,382
269,014,032
36,085,320
312,227,048
4,216,769
24,292,247
5,598,464
53,610,939
7,017,919
29,010,327
11,745,265
138,711
10,363,518
4,308,564
16,122,143
2,820,000
11,125,046
73,053,124
2,915,828
48,693,487
4,786,380
99,062
1,938,297
660,168,458
41,594,689
272,200,315
4,370,413
16,984,484
5,560,658
52,779,017
6,114,345
30,486,872
27,657,359
126,342
9,651,769
2,063,503
17,174,309
2,820,000
12,629,372
39,055,177
2,183,558
37,048,098
6,802,534
-
2,714,104
590,016,918
Staff salaries and benefits include Rs. 3.32 million (2018: Rs. 2.78 million) in respect
of employee retirement benefits.
31.1
79

NOTES TO THE FINANCIAL STATEMENTSFOR THE YEAR ENDED JUNE 30, 2019
2019
Rupees
2018
Rupees
Note
31.2 Auditors' remuneration
Annual statutory audit
Half yearly and COCG compliance reviews
Out of pocket expenses
Tax advisory services
1,650,000
550,000
120,000
500,000
2,820,000
1,650,000
550,000
120,000
500,000
2,820,000
It includes Rs. 21.24 million (2018: Rs. 23.09 million) donated to Aziz Fatima Trust (AFT),
Faisalabad which is primarily running a charitable hospital for needy and poor people. Mr.
Muhammad Adrees, the CEO and director of the Company is also Trustee of the AFT.
32.
33.
34.
OTHER EXPENSES
FINANCE COST
OTHER INCOME
Income from financial assets
Workers' profit participation fund
Workers' welfare fund
Loss on reclassification of investment in associate
Impairment of Available For Sale securities
Impairment of long term investments
Loss on disposal of property, plant and equipment
Long term financing
Murabaha payable / short term borrowings
Bank charges and commission
Markup on bank deposits
Dividend income
Exchange gain
Gain on sale of investments measured at FVTPL
Unwinding of discount on deferred consideration receivable
57,196,746
21,734,763
-
-
5,398,506
106,222,607
190,552,622
203,456,131
428,532,447
9,604,705
641,593,283
7,567,793
7,113,259
6,299,133
4,192,819
97,706,783
122,879,787
72,280,402
25,164,485
6,483,027
10,569,587
-
-
114,497,501
184,139,634
243,686,291
11,594,168
439,420,093
8,229,608
6,340,705
5,621,511
491,350
-
20,683,174
31.3
24.2.1
34.1
34.2
34.3
2019
Rupees
2018
Rupees
Note
80
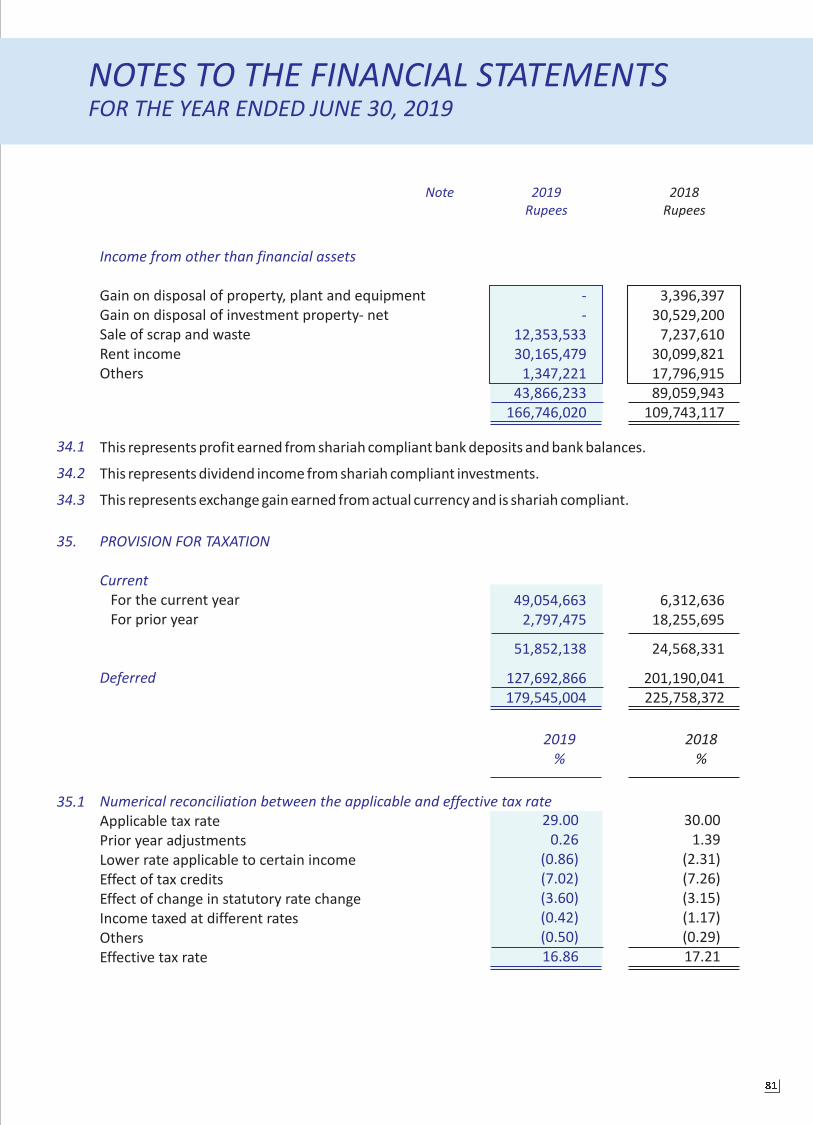
NOTES TO THE FINANCIAL STATEMENTSFOR THE YEAR ENDED JUNE 30, 2019
2019
Rupees
2018
Rupees
Note
35.
35.1
Income from other than financial assets
Gain on disposal of property, plant and equipment
Gain on disposal of investment property- net
Sale of scrap and waste
Rent income
Others
PROVISION FOR TAXATION
Current
Deferred
For the current year
For prior year
2019
%
-
-
12,353,533
30,165,479
1,347,221
43,866,233
166,746,020
3,396,397
30,529,200
7,237,610
30,099,821
17,796,915
89,059,943
109,743,117
This represents profit earned from shariah compliant bank deposits and bank balances.
This represents dividend income from shariah compliant investments.
This represents exchange gain earned from actual currency and is shariah compliant.
34.1
34.2
34.3
49,054,663
2,797,475
51,852,138
127,692,866
179,545,004
6,312,636
18,255,695
24,568,331
201,190,041
225,758,372
29.00
0.26
(0.86)
(7.02)
(3.60)
(0.42)
(0.50)
16.86
30.00
1.39
(2.31)
(7.26)
(3.15)
(1.17)
(0.29)
17.21
Numerical reconciliation between the applicable and effective tax rate
Applicable tax rate
Prior year adjustments
Lower rate applicable to certain income
Effect of tax credits
Effect of change in statutory rate change
Income taxed at different rates
Others
Effective tax rate
2018
%
81

NOTES TO THE FINANCIAL STATEMENTSFOR THE YEAR ENDED JUNE 30, 2019
Profit for the year
Weighted average number of ordinary
shares outstanding during the year
Earnings per share
2019 2018
885,458,407
21,429,407
41.32
1,086,184,700
21,429,407
50.69
RECONCILIATION OF LIABLITIES ARISING FROM FINANCING ACTIVITIES37.
At July 01, 2018Availed during
the year
Repaid during
the year
At June 30,
2019
2,019,840,649
3,525,026,677
5,544,867,326
Long term financing
Short term borrowings
1,570,266,122
10,595,885,829
12,166,151,951
(813,643,764)
(9,787,570,257)
(10,601,214,021)
2,776,463,006
4,333,342,248
7,109,805,254
………..……………................Rupees………...............………………
FINANCIAL RISK MANAGEMENT
The Company has exposure to the following risks from its use of financial instruments:
Credit risk
Liquidity risk
Market risk
This note presents information about the Company’s exposure to each of the above risks, the
Company’s objectives, policies and processes for measuring and managing risk, and the
Company’s management of capital. Further quantitative disclosures are included throughout
these financial statements.
The Board of Directors has overall responsibility for the establishment and oversight of the
Company’s risk management framework. The Board is responsible for developing and monitoring
the Company’s risk management policies.
The Company’s risk management policies are established to identify and analyze the risks faced by
the Company, to set appropriate risk limits and controls and to monitor risks and adherence to
limits. Risk management policies and systems are reviewed regularly to reflect changes in market
conditions and the Company's activities. The Company, through its training and management
standards and procedures, aims to develop a disciplined and constructive control environment in
which all employees understand their roles and obligations. All derivative activities for risk
management purposes are carried out by specialist teams that have the appropriate skills,
experience and supervision. It is the Company’s policy that no trading in derivatives for speculative
purposes shall be undertaken. The Board of Directors reviews and agrees policies for managing
each of these risks.
38.
EARNINGS PER SHARE - BASIC AND DILUTED
There is no dilutive effect on basic earnings per share of the Company, basic is computed as
follows:
36.
Rupees
Number
Rupees
82

NOTES TO THE FINANCIAL STATEMENTSFOR THE YEAR ENDED JUNE 30, 2019
Credit risk and concentration of credit risk
Counterparties
Bank and investments
Exposure to credit risk
Trade debts
Credit risk is the risk of financial loss to the Company if a customer or counterparty to a financial
instrument fails to meet its contractual obligations. To manage credit risk the Company maintains
procedures covering the application for credit approvals, granting and renewal of counterparty
limits and monitoring of exposures against these limits. As part of these processes the financial
viability of all counterparties is regularly monitored and assessed.
The Company is exposed to credit risk from its operating activities primarily for local trade debts,
sundry receivables and other financial assets.
The Company’s credit risk exposures are categorized under the following headings:
The Company conducts transactions with the following major types of counterparties for its
financial assets at amortised cost:
Trade debts are essentially due from local customers against sale of yarn, fabric caustic soda,
hydrochloric acid and other allied products and from foreign customers against supply of caustic
soda (liquid and flakes) and calcium chloride. The Company does not expect these counterparties
to fail to meet their obligations. The majority of sales to the Company’s customers are made on
specific terms. Customer credit risk is managed by each business unit subject to the Company’s
established policy, procedures and controls relating to customer credit risk management. Credit
limits are established for all customers based on internal rating criteria. Credit quality of the
customer is assessed based on an extensive credit rating. Outstanding customer receivables are
regularly monitored and any shipments to foreign customers are generally covered by letters of
credit or other form of credit insurance.
The Company limits its exposure to credit risk by only investing in highly liquid securities and only
with counterparties that have a credit rating of at least A1 and A. Given these high credit ratings,
management does not expect any counterparty to fail to meet its obligations.
The carrying amount of financial assets represents the maximum credit exposure. The maximum
exposure to credit risk at the reporting date was:
38.1
38.1.2
38.1.1
The Company's Audit Committee oversees how management monitors compliance with the
Company’s risk management policies and procedures and reviews the adequacy of the risk
management framework in relation to the risks faced by the Company. The Audit Committee is
assisted in its oversight role by Internal Audit. Internal Audit undertakes both regular and ad-hoc
reviews of risk management controls and procedures, the results of which are reported to the
Audit Committee.
83

NOTES TO THE FINANCIAL STATEMENTSFOR THE YEAR ENDED JUNE 30, 2019
2019
Rupees
2018
Rupees
The maximum exposure to credit risk for trade receivables at the reporting date by type of
customer is as follows:
Chemical - local
Textile - local
737,566,473
439,309,437
1,176,875,910
674,126,120
463,641,638
1,137,767,758
There is no single significant customer in the trade debts of the Company.
The maximum exposure to credit risk for trade debts at the reporting date by type of product
is:
2019
Rupees
2018
Rupees
Chemicals
Textile
737,566,473
439,309,437
1,176,875,910
674,126,120
463,641,638
1,137,767,758
Impairment losses
The aging of trade receivables at the reporting date is:
Not past due
Past due 0-180 days
Past due 181-360 days
Over 360 days
Gross
2019
Impairment
2019
Gross
2018
Impairment
2018---------------------------------- Rupees ----------------------------------
467,349,966
611,406,228
40,462,740
232,584,626
1,351,803,560
419,010,396
557,951,172
26,095,375
228,056,028
1,231,112,971
-
-
-
93,345,213
93,345,213
38.1.3
Geographically there is no concentration of credit risk.
Financial assets at amortised cost:
Trade debts
Loans and advances
Other receivables
Bank balances
1,176,875,910
1,414,509,787
14,576,026
86,305,221
2,692,266,944
2019
Rupees
2018
Rupees
1,137,767,758
1,752,225,000
9,975,716
62,744,253
2,962,712,727
-
1,477,783
7,633,390
166,194,883
175,306,056
84
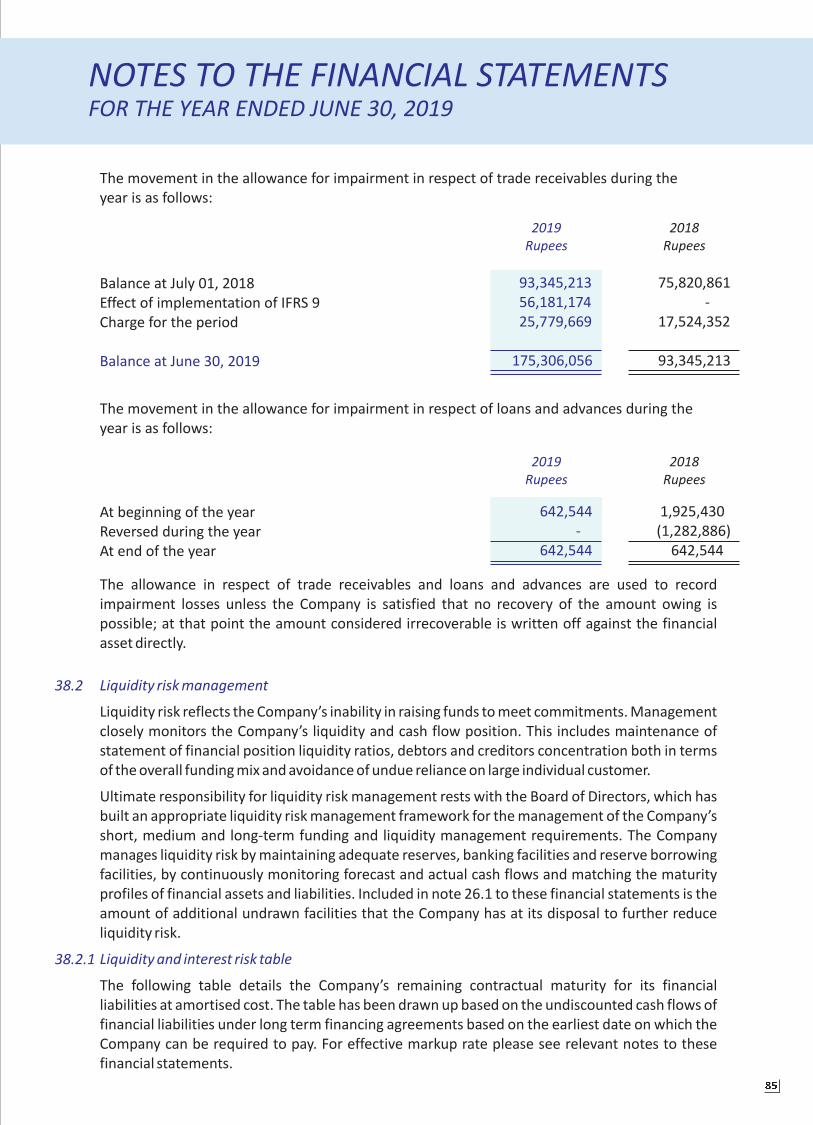
NOTES TO THE FINANCIAL STATEMENTSFOR THE YEAR ENDED JUNE 30, 2019
2019
Rupees
2018
Rupees
The allowance in respect of trade receivables and loans and advances are used to record
impairment losses unless the Company is satisfied that no recovery of the amount owing is
possible; at that point the amount considered irrecoverable is written off against the financial
asset directly.
At beginning of the year
Reversed during the year
At end of the year
642,544
-
642,544
1,925,430
(1,282,886)
642,544
Liquidity risk management
Liquidity and interest risk table
Liquidity risk reflects the Company’s inability in raising funds to meet commitments. Management
closely monitors the Company’s liquidity and cash flow position. This includes maintenance of
statement of financial position liquidity ratios, debtors and creditors concentration both in terms
of the overall funding mix and avoidance of undue reliance on large individual customer.
Ultimate responsibility for liquidity risk management rests with the Board of Directors, which has
built an appropriate liquidity risk management framework for the management of the Company’s
short, medium and long-term funding and liquidity management requirements. The Company
manages liquidity risk by maintaining adequate reserves, banking facilities and reserve borrowing
facilities, by continuously monitoring forecast and actual cash flows and matching the maturity
profiles of financial assets and liabilities. Included in note 26.1 to these financial statements is the
amount of additional undrawn facilities that the Company has at its disposal to further reduce
liquidity risk.
The following table details the Company’s remaining contractual maturity for its financial
liabilities at amortised cost. The table has been drawn up based on the undiscounted cash flows of
financial liabilities under long term financing agreements based on the earliest date on which the
Company can be required to pay. For effective markup rate please see relevant notes to these
financial statements.
38.2
38.2.1
The movement in the allowance for impairment in respect of trade receivables during the
year is as follows:
Balance at July 01, 2018
Effect of implementation of IFRS 9
Charge for the period
Balance at June 30, 2019
93,345,213
56,181,174
25,779,669
175,306,056
75,820,861
-
17,524,352
93,345,213
2019
Rupees
2018
Rupees
The movement in the allowance for impairment in respect of loans and advances during the
year is as follows:
85

NOTES TO THE FINANCIAL STATEMENTSFOR THE YEAR ENDED JUNE 30, 2019
Market risk
Foreign currency risk management
Transactional exposure in respect of non functional currency monetary items
Transactional exposure in respect of non functional currency expenditure and revenues
Market risk is the risk that changes in market prices, such as foreign exchange rates, interest rates
and equity prices will affect the Company’s income or the value of its holdings of financial
instruments. The objective of market risk management is to manage and control market risk
exposures within acceptable parameters, while optimizing the return on risk.
Pak Rupee (PKR) is the functional currency of the Company and as a result currency exposure
arises from transactions and balances in currencies other than PKR. The Company's potential
currency exposure comprise;
- Transactional exposure in respect of non functional currency monetary items.
- Transactional exposure in respect of non functional currency expenditure and revenues.
The potential currency exposures are discussed below;
Monetary items, including financial assets and liabilities, denominated in currencies other than
the functional currency of the Company are periodically restated to PKR equivalent, and the
associated gain or loss is taken to the profit and loss account. The foreign currency risk related to
monetary items is managed as part of the risk management strategy.
Certain operating and capital expenditure is incurred by the Company in currencies other than the
functional currency. Certain sales revenue is earned in currencies other than the functional
currency of the Company. These currency risks are managed as a part of overall risk management
strategy.
38.3
38.3.1
Trade and other payables
Short term borrowings
Long term financing
Maturity up to one year
Maturity up to one year
Maturity up to one year
Maturity after one year and up to five years
2,303,320,393
4,333,342,248
722,016,370
2,054,446,636
9,413,125,647
2019
Rupees
2018
Rupees
2,241,189,831
3,525,026,677
844,893,764
1,174,946,885
7,786,057,157
Carrying amount and contractual cash flows of trade and other financial liabilities are
approximately same.
Carrying amount
86
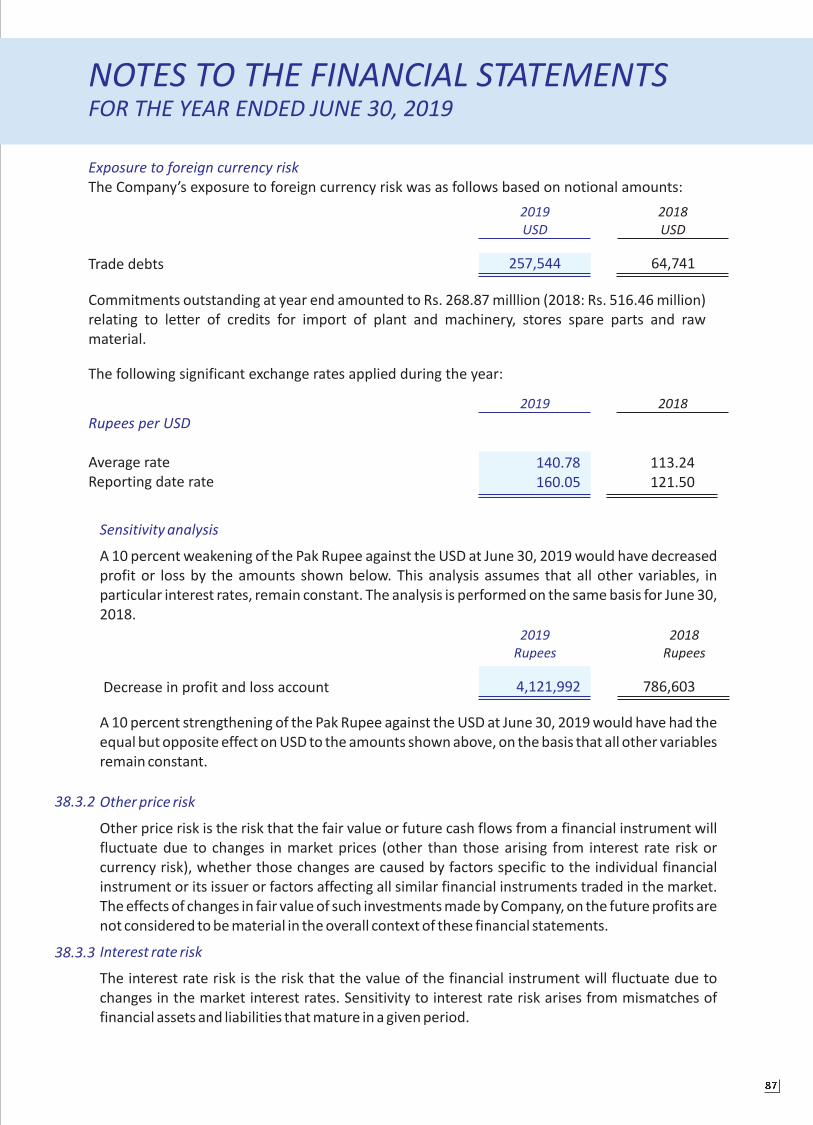
NOTES TO THE FINANCIAL STATEMENTSFOR THE YEAR ENDED JUNE 30, 2019
Sensitivity analysis
A 10 percent weakening of the Pak Rupee against the USD at June 30, 2019 would have decreased
profit or loss by the amounts shown below. This analysis assumes that all other variables, in
particular interest rates, remain constant. The analysis is performed on the same basis for June 30,
2018.
38.3.2
2019
Rupees
2018
Rupees
Decrease in profit and loss account 786,603
A 10 percent strengthening of the Pak Rupee against the USD at June 30, 2019 would have had the
equal but opposite effect on USD to the amounts shown above, on the basis that all other variables
remain constant.
Other price risk
Interest rate risk
Other price risk is the risk that the fair value or future cash flows from a financial instrument will
fluctuate due to changes in market prices (other than those arising from interest rate risk or
currency risk), whether those changes are caused by factors specific to the individual financial
instrument or its issuer or factors affecting all similar financial instruments traded in the market.
The effects of changes in fair value of such investments made by Company, on the future profits are
not considered to be material in the overall context of these financial statements.
The interest rate risk is the risk that the value of the financial instrument will fluctuate due to
changes in the market interest rates. Sensitivity to interest rate risk arises from mismatches of
financial assets and liabilities that mature in a given period.
38.3.3
2019
USD
2018
USD
Trade debts 257,544 64,741
Commitments outstanding at year end amounted to Rs. 268.87 milllion (2018: Rs. 516.46 million)
relating to letter of credits for import of plant and machinery, stores spare parts and raw
material.
The following significant exchange rates applied during the year:
Rupees per USD
Average rate
Reporting date rate
140.78
160.05
113.24
121.50
2019 2018
Exposure to foreign currency risk
The Company’s exposure to foreign currency risk was as follows based on notional amounts:
4,121,992
87
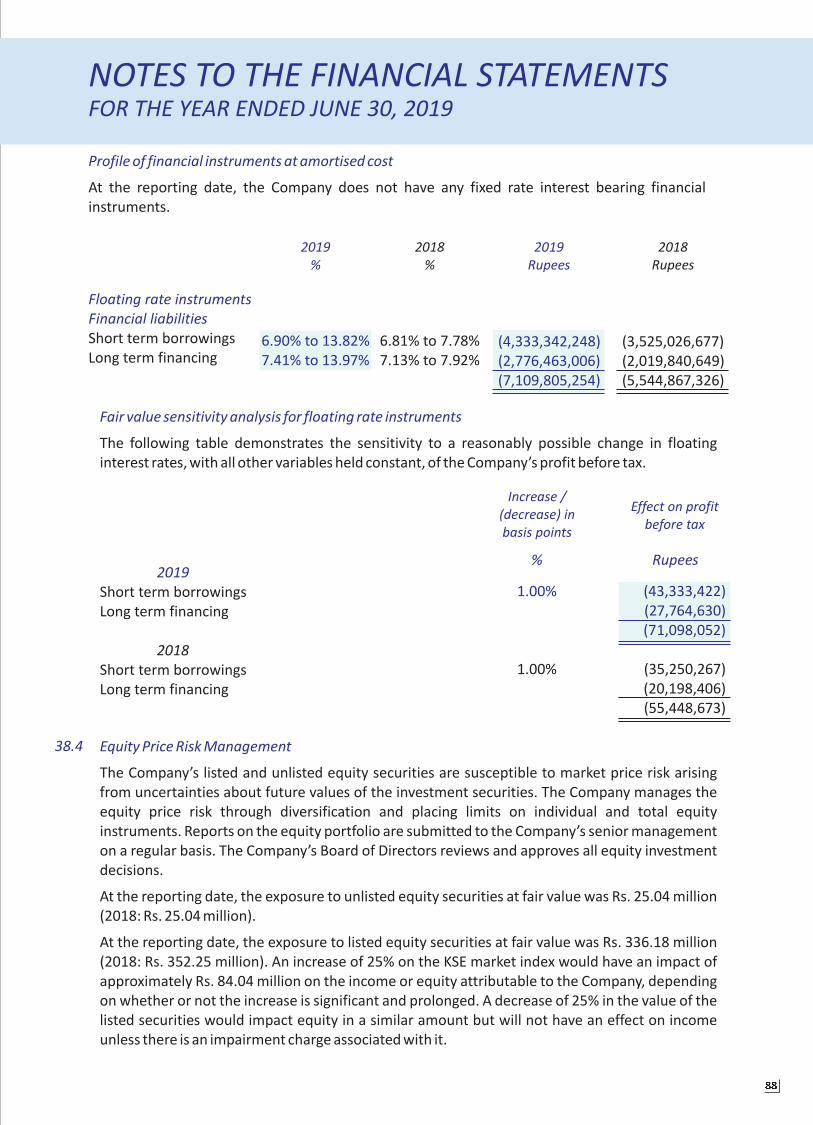
Profile of financial instruments at amortised cost
At the reporting date, the Company does not have any fixed rate interest bearing financial
instruments.
2019
Rupees
2018
Rupees
2019
%
2018
%
Floating rate instruments
Financial liabilities
Short term borrowings
Long term financing6.90% to 13.82%
7.41% to 13.97%
6.81% to 7.78%
7.13% to 7.92%
(4,333,342,248)
(2,776,463,006)
(7,109,805,254)
(3,525,026,677)
(2,019,840,649)
(5,544,867,326)
NOTES TO THE FINANCIAL STATEMENTSFOR THE YEAR ENDED JUNE 30, 2019
Fair value sensitivity analysis for floating rate instruments
The following table demonstrates the sensitivity to a reasonably possible change in floating
interest rates, with all other variables held constant, of the Company’s profit before tax.
38.4 Equity Price Risk Management
The Company’s listed and unlisted equity securities are susceptible to market price risk arising
from uncertainties about future values of the investment securities. The Company manages the
equity price risk through diversification and placing limits on individual and total equity
instruments. Reports on the equity portfolio are submitted to the Company’s senior management
on a regular basis. The Company’s Board of Directors reviews and approves all equity investment
decisions.
At the reporting date, the exposure to unlisted equity securities at fair value was Rs. 25.04 million
(2018: Rs. 25.04 million).
At the reporting date, the exposure to listed equity securities at fair value was Rs. 336.18 million
(2018: Rs. 352.25 million). An increase of 25% on the KSE market index would have an impact of
approximately Rs. 84.04 million on the income or equity attributable to the Company, depending
on whether or not the increase is significant and prolonged. A decrease of 25% in the value of the
listed securities would impact equity in a similar amount but will not have an effect on income
unless there is an impairment charge associated with it.
Increase /
(decrease) in
basis points
Effect on profit
before tax
2019
Short term borrowings
Long term financing
2018
Short term borrowings
Long term financing
(35,250,267)
(20,198,406)
(55,448,673)
(43,333,422)
(27,764,630)
(71,098,052)
1.00%
1.00%
% Rupees
88
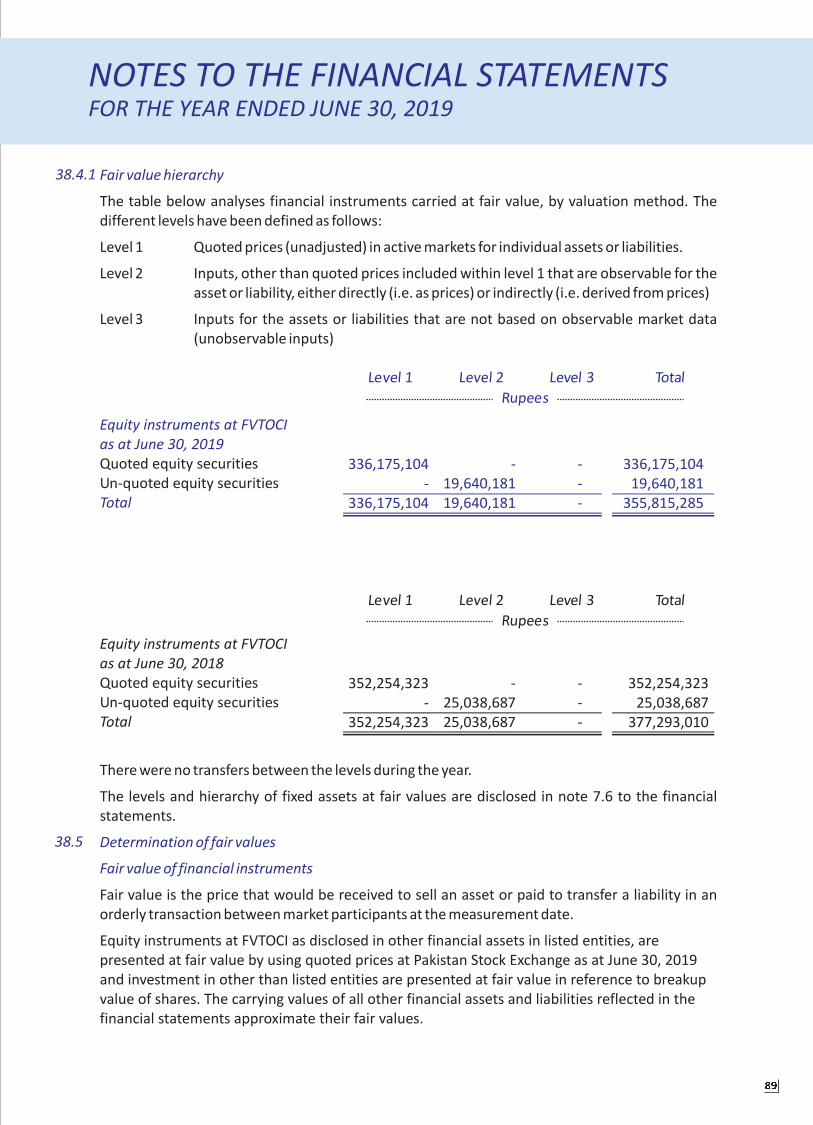
38.4.1
The table below analyses financial instruments carried at fair value, by valuation method. The
different levels have been defined as follows:
Level 1 Quoted prices (unadjusted) in active markets for individual assets or liabilities.
Level 2 Inputs, other than quoted prices included within level 1 that are observable for the
asset or liability, either directly (i.e. as prices) or indirectly (i.e. derived from prices)
Level 3 Inputs for the assets or liabilities that are not based on observable market data
(unobservable inputs)
Fair value hierarchy
NOTES TO THE FINANCIAL STATEMENTSFOR THE YEAR ENDED JUNE 30, 2019
38.5
There were no transfers between the levels during the year.
The levels and hierarchy of fixed assets at fair values are disclosed in note 7.6 to the financial
statements.
Fair value is the price that would be received to sell an asset or paid to transfer a liability in an
orderly transaction between market participants at the measurement date.
Equity instruments at FVTOCI as disclosed in other financial assets in listed entities, are
presented at fair value by using quoted prices at Pakistan Stock Exchange as at June 30, 2019
and investment in other than listed entities are presented at fair value in reference to breakup
value of shares. The carrying values of all other financial assets and liabilities reflected in the
financial statements approximate their fair values.
Determination of fair values
Fair value of financial instruments
Equity instruments at FVTOCI
as at June 30, 2019
Quoted equity securities
Un-quoted equity securities
Total
336,175,104
-
336,175,104
-
19,640,181
19,640,181
-
-
-
336,175,104
19,640,181
355,815,285
Equity instruments at FVTOCI
as at June 30, 2018
Quoted equity securities
Un-quoted equity securities
Total
-
25,038,687
25,038,687
-
-
-
352,254,323
-
352,254,323
352,254,323
25,038,687
377,293,010
89

NOTES TO THE FINANCIAL STATEMENTSFOR THE YEAR ENDED JUNE 30, 2019
Total borrowings
Less: Cash and bank balances
Net debt
Total equity including revaluation surplus
Total capital
Gearing ratio
7,109,805,254
102,509,993
7,007,295,261
14,619,623,468
21,626,918,729
32.40%
2019
Rupees
2018
Rupees
5,544,867,326
79,663,148
5,465,204,178
10,637,427,609
16,102,631,787
33.94%
2019 2018
REMUNERATION TO CHIEF EXECUTIVE, DIRECTORS AND EXECUTIVES
The aggregate amount charged in the accounts for remuneration including all benefits to Chief
Executive, Directors and Executives of the Company are as follows:
39
Remuneration
Perquisites
House rent
Utilities
Medical allowance
Special allowance
Income tax
Reimbursement of
expenses
14,400,000
5,760,000
1,440,000
-
-
1,321,736
-
22,921,736
1
4,000,008
1,599,996
399,996
-
-
577,941
-
6,577,941
1
55,931,707
15,814,706
5,511,132
5,511,040
279,116
-
-
83,047,701
31
14,400,000
5,760,000
1,440,000
-
-
5,000,000
-
26,600,000
1
4,000,008
1,599,996
399,996
-
-
1,326,034
-
7,326,034
1
61,452,947
17,627,697
5,735,986
6,136,054
227,205
-
4,690,864
95,870,753
33
The Company's objective when managing capital is to safeguard the Company's ability to continue
as a going concern so that it can continue to provide returns for shareholders and benefits for
other stakeholders and to maintain a strong capital base to support the sustained development of
its businesses. The Company manages its capital structure which comprises capital and reserves by
monitoring return on net assets and makes adjustments to it in the light of changes in economic
conditions. In order to maintain or adjust the capital structure, the Company may adjust the
amount of dividend paid to shareholders, appropriation of amounts to capital reserves or/and
issue new shares.
Capital risk management38.6
Chief
ExceutiveDirector Executives
Chief
ExceutiveDirector Executives
Rupees
90

NOTES TO THE FINANCIAL STATEMENTSFOR THE YEAR ENDED JUNE 30, 2019
2019
Rupees
2018
Rupees
TRANSACTIONS WITH RELATED PARTIES
The related parties comprise holding company, subsidiary and associated undertakings, other
related group companies, directors of the company, key management personnel and post
employment benefit plans. The Company in the normal course of business carries out transactions
with its related parties. Amounts due from related parties are shown under receivables. Details of
transactions with related parties for the year are as follows:
40.
Transactions with related parties
527,968
21,239,161
-
112,402,895
82,975
23,086,165
2,190,225,000
129,796,787
40.1
Following are the related parties with whom the Company had entered into transactions or have
arrangement / agreement in place:
40.2
The Company does not hold any shares in the above mentioned companies.40.2.1
41.
Caustic soda
Sodium hypo chlorite
Liquid chlorine
Bleaching powder
Hydrochloric acid
Calcium Chloride prill
202,950
66,000
11,550
7,920
363,000
13,200
201,300
66,000
11,550
7,920
363,000
13,200
133,015
42,496
7,994
4,129
109,127
9,236
141,563
35,748
7,851
4,492
117,056
3,173
Demand based production
Demand based production
Demand based production
Demand based production
Demand based production
Demand based production
39.1
39.2
The Chief Executive, certain Directors and Executives are provided with free use of Company
maintained cars and telephone etc. having value amounting to Rs. 5.45 million (2018: Rs 3.46
million).
Directors have waived their meeting fees.
Basis of association
Designed capacity
2019 2018 20182019
Actual production
Tons
91
NOTES TO THE FINANCIAL STATEMENTSFOR THE YEAR ENDED JUNE 30, 2019
Textile Division
Ring Spinning
Number of spindles installed
Number of spindles worked
Number of shifts per day
Installed capacity after conversion into
20/s count (Kgs)
Actual production of yarn after conversion
into 20/s count (Kgs)
28,512
28,512
3
10,885,413
8,937,310
28,512
28,512
3
10,885,413
10,853,414
2019 2018
2019
Rupees
2018
RupeesWORKING CAPITAL CHANGES
(Increase)/ decrease in current assets
Stores, spare parts and loose tools
Stock in trade
Trade debts
Advance Sales Tax
Loans and advances
Trade deposits and short-term prepayments
Other receivables
Increase/ (decrease) in current liabilities
Trade and other payables
Sales tax payable
42.
(205,428,736)
(377,833,040)
(114,769,862)
(4,525,546)
265,093,320
135,532
(4,600,310)
(441,928,642)
123,241,656
(8,498,670)
(327,185,656)
(100,230,242)
243,679,591
13,814,393
-
(66,671,441)
693,725
2,077,591
93,363,617
(244,146,909)
(31,627,506)
(182,410,798)
Provident Fund Related Disclosure
The investments by the provident fund in collective investment schemes, listed equity and debts
securities have been made in accordance with the conditions specified in section 218 of the
Companies Act, 2017 and rules specified thereunder.
The average and total number of employees during year ended June 30, 2019 and June 30, 2018 are
as follows:
43.
44.
Total number of employees as at June 30
Average number of employees during the year
2,172
2,250
2,327
2,264
2019 2018
RECLASSIFICATION
Corresponding figures have been re-arranged, wherever necessary, for the purposes of comparison.
However, following significant reclassification has been made to reflect more appropriate
presentation of events and transactions for the purpose of comparison:
45.
From
Administrative expenses
To
Impairment losses on trade debts
(Presented on the face of
statement of profit or loss)
Reason
Application of IFRS 9
Rupees
17,524,352
92

NOTES TO THE FINANCIAL STATEMENTSFOR THE YEAR ENDED JUNE 30, 2019
Chemical Textile Total
2019 2018 2019 2018 2019 2018
Sales:LocalCaustic sodaSodium hypochloriteBleaching powderLiquid chlorineHydrochloric acidMagnesium chlorideand othersYarnWasteFabrics
ExportCaustic soda flakesOthers
Less:Commission and discountSales tax
Sales - net
9,870,772,5771,009,214,967
194,474,637251,850,890587,811,775
305,608,018
---
214,938,435165,475,416
12,600,146,715
500,743,4911,765,408,204
10,333,995,020
9,464,985,737835,538,176214,032,842233,403,091785,670,007
206,531,732
---
457,723,81098,494,624
12,296,380,019
517,706,5481,685,996,872
10,092,676,599
-----
-
--
2,426,851,735
8,745,61053,994,115
2,364,112,010
-----
1,831,983,01916,784,712
578,084,004
1,775,243,65411,731,393
418,745,324-
--
2,205,720,371
9,975,86123,594,512
2,172,149,998
9,870,772,5771,009,214,967
194,474,637251,850,890587,811,775
-
214,938,435165,475,416
15,026,998,450
509,489,1011,819,402,319
12,698,107,030
9,464,985,737835,538,176214,032,842233,403,091785,670,007
305,608,0181,831,983,019
16,784,712578,084,004
206,531,7321,775,243,654
11,731,393418,745,324
457,723,81098,494,624
14,502,100,390
527,682,4091,709,591,384
12,264,826,597
Sales - netCost of sales
Gross profit
Other incomeDistribution costImpairment loss onfinancial assetsAdministrative expensesFinance cost
Reportable segmentsprofit before tax
Unallocated income/(expenses)
Administrative expensesOther operating expensesShare of lossof associated company
Provision for taxation
Profit for the year
10,333,995,020(7,788,455,839)
2,545,539,181
163,809,244(312,236,709)
(9,253,599)(582,488,931)(623,684,718)
(1,363,854,713)
1,181,684,468
10,092,676,599(7,631,722,381)
2,460,954,218
94,134,452(241,299,913)
(15,945,324)(536,771,942)(436,026,603)
(1,135,909,330)
1,325,044,888
2,364,112,010(2,150,121,211)
213,990,799
2,936,776(30,941,848)
(16,526,070)(74,859,527)(17,908,565)
(137,299,234)
76,691,565
2,172,149,998(2,000,373,720)
171,776,278
15,608,665(27,714,119)
(1,579,028)(67,949,328)
(3,393,490)
(85,027,300)
86,748,978
12,698,107,030(9,938,577,050)
2,759,529,980
166,746,020(343,178,557)
(25,779,669)(657,348,458)(641,593,283)
(1,501,153,947)
1,258,376,033
12,264,826,597(9,632,096,101)
2,632,730,496
109,743,117(269,014,032)
(17,524,352)(587,196,918)(439,420,093)
(1,203,412,278)
1,429,318,218
46.
(2,820,000)(190,552,622)
-
1,065,003,411(179,545,004)
885,458,407
(2,820,000)(114,497,501)
(57,645)
1,311,943,072(225,758,372)
1,086,184,700
OPERATING RESULTS
Rupees
- -
93

NOTES TO THE FINANCIAL STATEMENTSFOR THE YEAR ENDED JUNE 30, 2019
Inter-segment pricing / sales
Products and services from which reportable segments derive their revenues
There is no purchase and sale between the segments.
For management purposes, the Company is organized into business units based on their products and
services and has the following two reportable operating segments. The strategic business units offer
different products and services, and are managed separately because they require different
technology and marketing strategies. For each of the strategic business units, the Company’s CEO
reviews internal management reports on at least a quarterly basis:
The Chemicals segment produces and supplies various chemicals used in textile and fertilizer
industry.
The textile segment is a spinning unit which produces yarn and also trading of fabric.
The Company does not have any geographical segment.
For the purposes of monitoring segment performance and allocating resources between segments,
all assets are allocated to reportable segments other than investments in associates, and tax assets.
Assets used jointly by reportable segments are allocated on the basis of the revenues earned by
individual reportable segments and all liabilities are allocated to reportable segments other than
current and deferred tax liabilities. Liabilities for which reportable segments are jointly liable are
allocated in proportion to segment assets.
46.1
46.2
46.3
Chemical
2019 2018
Textile
2019 2018
Total
2019 2018
Rupees
Other information
Segment assets
Unallocated corporate assets
Segment liabilities
Unallocated corporate liabilities
Capital expenditure
Depreciation
15,599,826,057
1,735,387,527
2,058,530,968
925,966,995
13,574,258,161
1,233,492,468
1,149,546,562
878,391,352
2,151,910,831
397,364,295
446,662,973
41,620,091
1,417,913,493
1,170,000
39,419,399
43,859,264
17,751,736,888
9,075,754,370
26,827,491,258
2,132,751,822
10,075,115,968
12,207,867,790
2,505,193,941
967,587,086
14,992,171,654
4,804,929,321
19,797,100,975
1,234,662,468
7,925,010,898
9,159,673,366
1,188,965,961
922,250,616
94

NOTES TO THE FINANCIAL STATEMENTSFOR THE YEAR ENDED JUNE 30, 2019
EVENTS AFTER THE STATEMENT OF FINANCIAL DATE
DATE OF AUTHORIZATION FOR ISSUE
GENERAL
In respect of current year, the directors have proposed to pay final cash dividend of Rs. 214.29 million
(2018: Rs. 278.58 million) at Rs. 10 (2018: Rs. 13.00) per ordinary share of Rs. 10 each for approval of
the shareholders at the forthcoming Annual General Meeting. Financial effect of the proposed
dividend has not been taken in these financial statements and will be accounted for subsequently in
the year when such dividend is approved.
These financial statements were authorized for issue on September 19, 2019 by the Board of
Directors of the Company.
Figures have been rounded off to the nearest Rupee.
47.
48.
49.
CHIEF EXECUTIVE OFFICER DIRECTOR
Haseeb AhmadMuhammad Adrees Anwar-ul-Haq
CHIEF FINANCIAL OFFICER
95


I/We______________________________S/o/D/o/W/o____________________________
of___________________________ being a member of
and holder of __________Ordinary Shares as per Share Register Folio No.____________and/or CDC
Participant ID No. _________________andAccount / Sub-account No.________________ do hereby
appoint Mr./Mrs./Miss _______________________________of__________________failing him/her,
Mr/Mrs./Miss______________________ __ of __________________as my/our proxy to attend, act
and vote for me/us on my/our behalf at Annual General Meeting of the Company to be held on
Monday October 28, 2019 at 5:45 pm at the Institute of Chartered Accountants of Pakistan,
Chartered Accountants Avenue, Clifton, Karachi and at any adjournment thereof in the same
manner as I/we myself/ourselves would vote if personally present at such meeting.
SITARA CHEMICAL INDUSTRIES LIMITED
__________________________ __________________Signature of Shareholder Signature of ProxyFolio / CDC A/C No.
Dated this _____________day of _______________2019
Witness: Witness:
1.Signature ___________________________ 2. Signature____________________________Name ______________________________ Name_______________________________Address_____________________________ Address_________________________________________________________________ ___________________________________CNIC or_____________________________ CNIC or_____________________________Passport No._________________________ Passport ____________________________
Five Rupees
Revenue Stamp
SITARA CHEMICAL INDUSTRIES LIMITED
FORM OF PROXY
ANNUAL GENERAL MEETING
1. A member entitled to attend and vote at the meeting may appoint a proxy in writing to attendthe meeting and vote on member's behalf.
2. If a member is unable to attend the meeting. He/She may complete and sign this form and
send it to the Company's Share Registrar M/s. THK Associates (Pvt) Limited 1 Floor, 40-C,
Block-6, P.E.C.H.S., Karachi-75400 so as to reach not less than 48 hours before the time
appointed for holding the Meeting.
3. For CDC Account Holders / Corporate Entities; in addition to the above, the following
requirements have to be met:
(a) The proxy form shall be witnessed by two persons whose names, addresses and CNIC
numbers be stated on the form.
(b) Attested copies of CNIC or the passport of the beneficial owners and the proxy shall be
provided with the proxy form.
(c) The proxy shall produce his original CNIC or original passport at the time of the meeting.
In case of a corporate entity, the Board of Directors resolution / power of attorney with
specimen signature shall be submitted (unless it has been provided earlier) along with
proxy form to the Company.
st
Notes:
97

Affix
Correct
Postage
M/s THK Associates (Pvt) Limited
1st Floor, 40-C, Block-6, P.E.C.H.S.
Karachi.

75400-
2820195:45

Affix
Correct
Postage
M/s THK Associates (Pvt) Limited
1st Floor, 40-C, Block-6, P.E.C.H.S.
Karachi.

DIVIDEND MANDATE (MANDATORY)
By virtue of the provisions of the Companies Act, 2017, shareholders are MANDATORILY required to
provide their bank account details to receive their dividends by way of direct credit on electronic
transfer to their bank account instead of receiving them through dividend warrants (crossed as A/c
Payee only).
Bank Account Details of Shareholder for payment of Cash Dividend through electronic mode
I hereby wish to communicate my desire to receive my dividends directly in my bank account as detailed below:
Name of Shareholder _________________________________________
Folio Number _________________________________________
Contact Number of Shareholder _________________________________________
Bank Account No. _________________________________________
IBAN _________________________________________
Title of Account _________________________________________
Type of Account _________________________________________
Name of Bank _________________________________________
Bank Branch & full Mailing Address _________________________________________
Contact No. of Bank _________________________________________
It is stated that the above particulars given by me are correct to the best of my knowledge and I shall keep the
company informed in case of any changes in the said particulars in the future.
----------------------------- ------------------ --------------------------------------------
Shareholder's signature Date CNIC No. (Copy attached)
SITARA CHEMICAL INDUSTRIES LIMITED

SITARA CHEMICAL INDUSTRIES LIMITED
CIRCULATIONOFANNUALAUDITEDACCOUNTSTheCompanySecretarySitaraChemical Industries Limited601-602,BusinessCentre,MumtazHasanRoad,KarachiSubject : CirculationofAnnualAuditedAccounts viaEmail oranyotherMediaPursuant to the directions given by the Securities and Exchange Commission of Pakistan through its SRO No. 470(I)/2016dated 31 May, 2016, that have allowed companies to circulate their Annual Audited Accounts (i.e. Annual Balance SheetandProfit and LossAccounts, Auditor's Report andDirectors' Report etc (�AnnualReport�) alongwith theNoticeof AnnualGeneralMeeting (�Notice�)to its shareholders throughEmail oranyotherElectronicMediaat the registeredaddresses.Shareholders who wish to receive the hard copy of Financial Statements shall have to fill the below form and send us toCompanyaddress.I/We hereby consent Option 1 or Option 2 to the above SROs for Audited Financial Statements and Notice of GeneralMeeting(s)delivered tomehard frominsteadEmail oranyotherElectronicMedia.
ST
Option 1 Via EmailName of the Members/ShareholdersCNIC NO.Folio / CDC Account NumberValid Email Address(to receive Financial Statements alongwithNotice of General Meetings instead ofhardcopy/CD/DVD/USB)
Option 2 Via Hard copyName of the Members/ShareholdersCNIC NO.Folio / CDC Account NumberMailing Address(to receive Financial Statements alongwithNotice of General Meetings instead ofEmail/CD/DVD/USB and other Electronic Media)
I/We hereby confirm that the above mentioned information is correct and in case of any change thereon, I/We willimmediately intimate to the Company's Share Registrar. I/we further confirm that the transmission of Company's AnnualAudited Financial Statements and Notice of General Meeting(s) through my/our above address would be taken ascompliancewith theCompaniesAct,2017.

Affix
Correct
Postage
M/s Sitara Chemical Industries Ltd.
601-602 Business Center,
Mumtaz Hassan Road
Karachi.
