fir center report
TRANSCRIPT
FIR Center Report
FIR FU-116 July 2012
Observation of Dynamic Interactions between Fundamental and Second Harmonic Modes in
a High-Power Sub-Terahertz Gyrotron
Teruo Saito, Yoshinori Tatematsu, Yuusuke Yamaguchi,
Shinji Ikeuchi, Shinya Ogasawara, Naoki Yamada, Ryosuke Ikeda, Isamu Ogawa, Toshitaka Idehara
Research Center for Development of Far-Infrared Region University of Fukui
Bunkyo 3-9-1, Fukui 910-8507, Japan
Tel 81 776 27 8657 Fax 81 776 27 8770

1
Observation of Dynamic Interactions between Fundamental and Second Harmonic Modes in a High-Power Sub-Terahertz Gyrotron
Teruo Saito,1 Yoshinori Tatematsu,1 Yuusuke Yamaguchi,1
Shinji Ikeuchi,1 Shinya Ogasawara,2 Naoki Yamada,1 Ryosuke Ikeda,1 Isamu Ogawa,1 Toshitaka Idehara1
1Recearch Center for Development of Far-Infrared Region, University of Fukui, 3-9-1
Bunkyo, Fukui 910-8507, Japan 2Department of Energy Engineering and Science, Nagoya University, Nagoya 464-8463,
Japan
Dynamic mode interactions have been observed in the course of attaining new power
records in a high-power sub-THz second harmonic (SH) gyrotrons [T. Notake et al.,
Phys. Rev. Lett. 103, 225002 (2009), T. Saito et al., Phys. Plasmas 19, 063100 (2012)].
Interaction takes place between a parasitic fundamental harmonic (FH) and SH modes,
as well as among SH modes. Many combinations of simultaneously oscillating modes
have appeared depending on operating conditions. In particular, a nonlinear excitation
of the FH mode has been clearly observed; that is, an SH mode has assisted oscillations
of the parasitic FH mode in the hard excitation region.
2
Mode interaction has been one of major research subjects of gyrotrons [1]. Its
importance has grown acceleratedly with increases in frequency and power. Recently,
the development of high-frequency gyrotrons extending to the sub-THz and THz region
has increasingly intensified because many new applications of high-frequency gyrotrons
are anticipated in various research fields [2, 3]. Since gyrotrons in the sub-THz and THz
region usually operate at second harmonic (SH) resonance, new studies have arisen on
the interaction between an SH mode and a parasitic fundamental harmonic (FH) mode
[4, 5]. In addition, mode interaction among SH modes in a dense mode spectrum is also
a serious problem. This paper reports dynamic mode interactions observed in a
high-power sub-THz gyrotron. In particular, a nonlinear excitation of a parasitic FH
mode assisted by an SH mode was clearly observed for the first time in a sub-THz
gyrotron. In addition, multimode SH oscillation was observed.
The SH gyrotron used for this study has been developed for application to collective
Thomson scattering (CTS) diagnostics in magnetic fusion devices [6-8]. CTS
measurements need a high-power gyrotron of the order of 100 kW [9]. Recently,
gyrotrons originally developed for electron heating have been used in several devices
[10, 11]. The electromagnetic waves with frequencies are around 100 GHz suffer from
strong refraction and/or absorption. High-level background electron cyclotron emissions
are a source of much noise. A sub-THz gyrotron with a frequency around 0.4 THz will
resolve these problems [12, 13].
Use of an SH mode increases the chance of mode interaction with a neighboring FH
mode. In particular, nonlinear excitation of the parasitic mode through interaction with
the operation mode is a serious problem in high-power gyrotrons [1]. Multimode
oscillations of FH modes in a high-power millimeter wave gyrotron were interpreted as
3
nonlinear excitations [14]. The high-power single-mode SH oscillation is much more
difficult to induce than the single-mode FH oscillation, because of mode interaction
with parasitic FH modes. The SH oscillation of hundreds of kW was realized in the cm
wavelength region [15]. In the sub-THz range, a 20 kW level SH oscillation was
realized [16]. Very recently, by carefully exploring the best mode, a sub-THz SH
oscillation approaching 100 kW has been demonstrated [6–8].
However, as the beam voltage Vk or the beam current Ib increases, the chance for
mode interaction rises. Figure 1 plots the start oscillation currents of relevant modes
including the finally chosen SH TE17,2 mode along with the nearest FH TE4,3 mode. The
resonance frequency of the TE17,2 mode is about 390 GHz and that of the TE4,3 mode is
about 203 GHz. Several SH modes are distributed within a narrow region. The
following inequality gives the condition for interaction between two same cyclotron
harmonics modes
1 2 CRf f f− ≤ Δ . (1)
Here f1 and f2 are the frequencies of the two modes [1]. The cyclotron resonance band
CRfΔ should be narrower than 1/T with T = L/v|| being the transit time of an electron
with the parallel electron velocity v|| travelling through the cavity length L. In the present
study, CRfΔ ~ 3 GHz and the relation 1 2 CRf f f− ≤ Δ hold between neighboring SH
modes [8]. Indeed, the simultaneous oscillations of two SH modes were observed in the
present study. This is considered as a nonsynchronous mode interaction [1].
Interaction between an SH oscillation mode and a parasitic FH mode is much more
important. In this case, Eq. (1) should read 1 22 CRf f f− ≤ Δ , where f1 and f2 are the
frequencies of the SH mode and the FH mode, respectively. Since 1CRf TΔ ≤ ≈ 5 GHz
4
[8], the above inequality 1 22 CRf f f− ≤ Δ does not hold between the TE17,2 and TE4,3
modes and mode interaction would appear to be difficult. However, two-mode
interaction was observed. The magnetic field range for TE4,3 mode oscillation extended
substantially to the low field side. The “mode distance” then cannot be evaluated simply
as 1 22f f− .
This mode interaction is considered a nonlinear excitation [1] with the TE4,3 mode
lying in the hard excitation region. To the best of our knowledge, this nonlinear hard
excitation of an FH mode in a sub-THz gyrotron has been observed for the first time.
The frequency detuning parameter Δ is a good indication of hard excitation [17]. For the
present experiment, Δ for the FH mode evaluated with the definition given in Ref. [17]
is larger than 0.6. Then, to be shown below, the FH mode is definitely in the hard
excitation region. Reduction of the start oscillation current of an FH mode through
interaction with an SH mode were reported as mode cooperation [18, 19]. However, Δ
for the FH mode is estimated to be lower than 0.4; that is, the FH mode was still in the
soft excitation region.
The radius of the cavity of our sub-THz gyrotron is 2.99 mm, and the length of the
straight section is 12 mm. The cavity has a down taper on the electron gun side and an
up taper connected to a vacuum window via a straight cylindrical waveguide. The
maximum beam voltage is 65 kV and the maximum beam current is larger than 10 A.
The gyrotron was operated in pulse mode, the pulse length being several microseconds
with a repetition rate of less than 10 Hz. See Ref. [8] for design details.
Figure 2 shows the dependence of the oscillation intensity on the magnetic field Bc
within the cavity. Plots are given for beam voltage Vk of 50 kV (Fig. 2(a)) and 60 kV
5
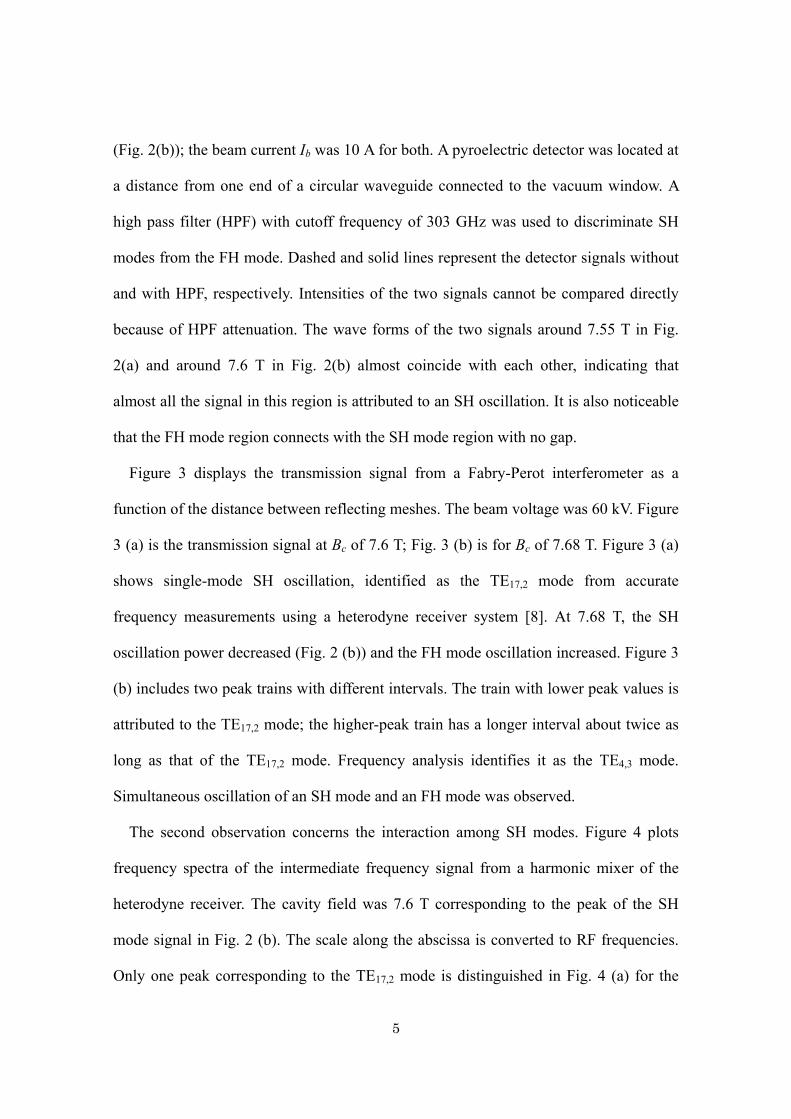
(Fig. 2(b)); the beam current Ib was 10 A for both. A pyroelectric detector was located at
a distance from one end of a circular waveguide connected to the vacuum window. A
high pass filter (HPF) with cutoff frequency of 303 GHz was used to discriminate SH
modes from the FH mode. Dashed and solid lines represent the detector signals without
and with HPF, respectively. Intensities of the two signals cannot be compared directly
because of HPF attenuation. The wave forms of the two signals around 7.55 T in Fig.
2(a) and around 7.6 T in Fig. 2(b) almost coincide with each other, indicating that
almost all the signal in this region is attributed to an SH oscillation. It is also noticeable
that the FH mode region connects with the SH mode region with no gap.
Figure 3 displays the transmission signal from a Fabry-Perot interferometer as a
function of the distance between reflecting meshes. The beam voltage was 60 kV. Figure
3 (a) is the transmission signal at Bc of 7.6 T; Fig. 3 (b) is for Bc of 7.68 T. Figure 3 (a)
shows single-mode SH oscillation, identified as the TE17,2 mode from accurate
frequency measurements using a heterodyne receiver system [8]. At 7.68 T, the SH
oscillation power decreased (Fig. 2 (b)) and the FH mode oscillation increased. Figure 3
(b) includes two peak trains with different intervals. The train with lower peak values is
attributed to the TE17,2 mode; the higher-peak train has a longer interval about twice as
long as that of the TE17,2 mode. Frequency analysis identifies it as the TE4,3 mode.
Simultaneous oscillation of an SH mode and an FH mode was observed.
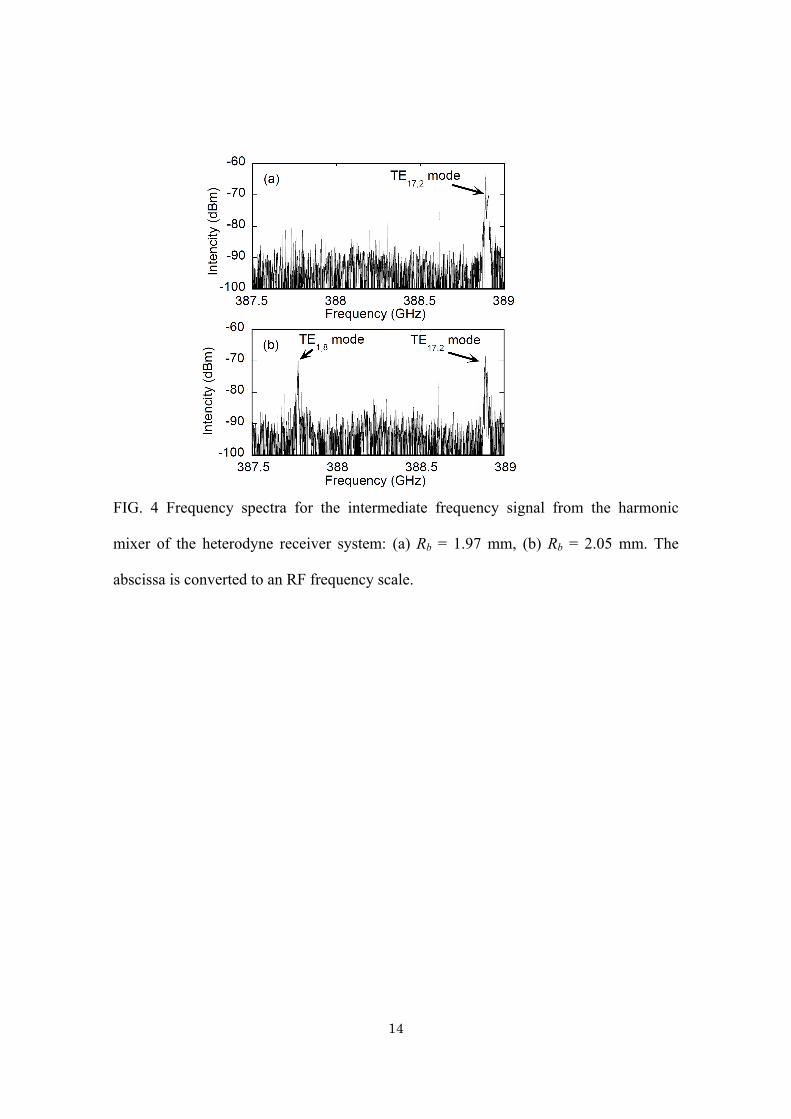
The second observation concerns the interaction among SH modes. Figure 4 plots
frequency spectra of the intermediate frequency signal from a harmonic mixer of the
heterodyne receiver. The cavity field was 7.6 T corresponding to the peak of the SH
mode signal in Fig. 2 (b). The scale along the abscissa is converted to RF frequencies.
Only one peak corresponding to the TE17,2 mode is distinguished in Fig. 4 (a) for the

6
same condition as the highest power oscillation at 389 GHz [8]. The electron beam
radius Rb was set at 1.97 mm where the coupling coefficient of the competing TE1,8
mode is almost zero. A small variation of Rb resulted in a new peak as shown in Fig. 4
(b). The frequency interval between the two peaks is just equal to the difference
between the frequencies 388.89 GHz of the TE17,2 mode and 387.77 GHz of the TE1,8
mode. Simultaneous oscillation of two SH modes was observed. Three SH mode
oscillation was also observed but depended on the operating conditions.
We discuss next the dynamic behavior of the observed mode interactions. Figure 5
represents mode interaction calculations [8, 20] for Rb = 1.97 mm. The calculation
producing Fig. 5 (a) takes into account four SH modes, TE3,7, TE1,8, TE17,2, and TE8,5
whereas for Fig. 5 (b) these modes are not included. The range of Bc for the TE4,3 mode
oscillation substantially extends to the low field side in Fig. 5 (a) as compared with the
range in Fig. 5 (b). There is no oscillation gap around 7.7 T in Fig. 5 (a). The Bc region
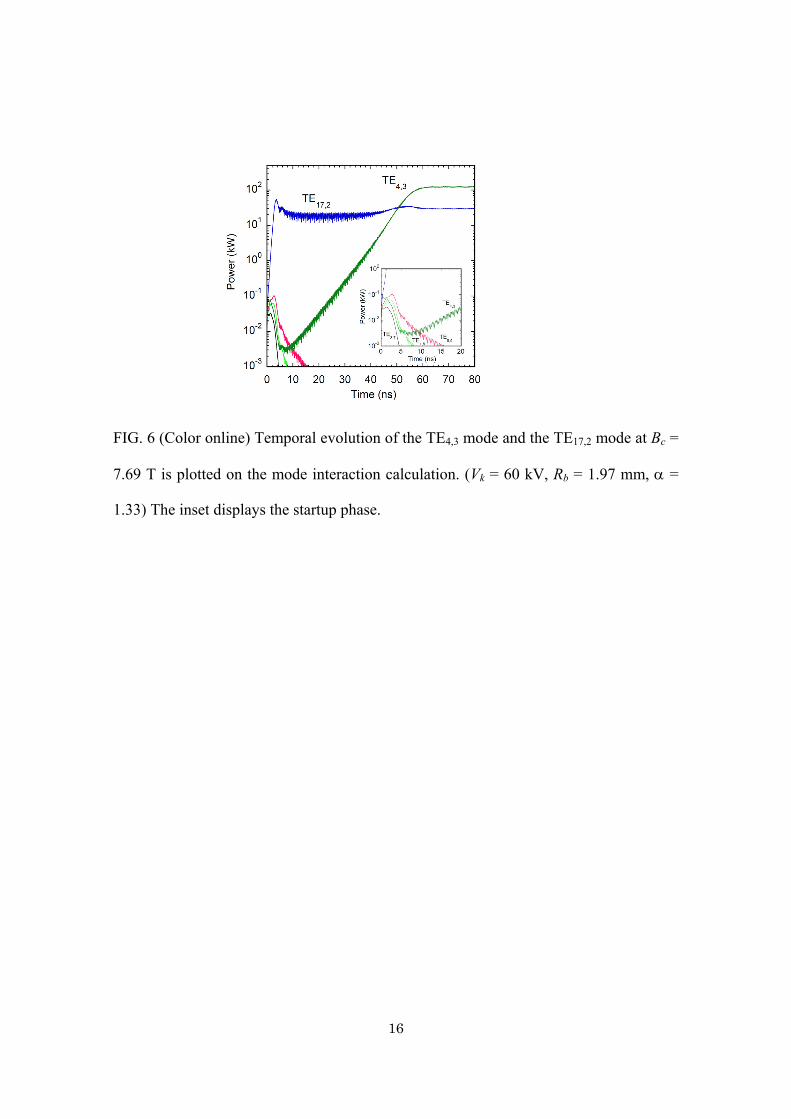
of the TE17,2 mode oscillation agrees well with that in Fig. 2 (b). Temporal evolution of
the relevant modes at Bc = 7.69 T is plotted in Fig. 6. This temporal evolution is
calculated from non-zero initial values given for each mode under fixed voltage and
current. The TE17,2 mode is first excited, and then the TE4,3 mode grows. Other SH
modes do not grow as displayed in the inset. A steady state of the two-mode oscillation
is established within tens of nanoseconds, that being much shorter than the pulse width.
Therefore, experimental observation corresponds to the steady state.
These calculations strongly indicate a nonlinear excitation of the TE4,3 mode. As
shown in Fig. 5 (b), oscillation of this mode alone is not possible for Bc lower than 7.75
T and assistance from the TE17,2 mode is necessary. In addition, the highest power of the
TE4,3 mode is obtained at around 7.75 T in the nonlinear excitation region. However, the

7
TE17,2 mode does not oscillate at 7.75 T in the steady state. Temporal evolution
calculation shows that the TE17,2 mode is first excited at the start-up stage and then
decays to zero. The TE4,3 mode grows with assistance from the TE17,2 mode, and once it
has grown its power level remains constant.
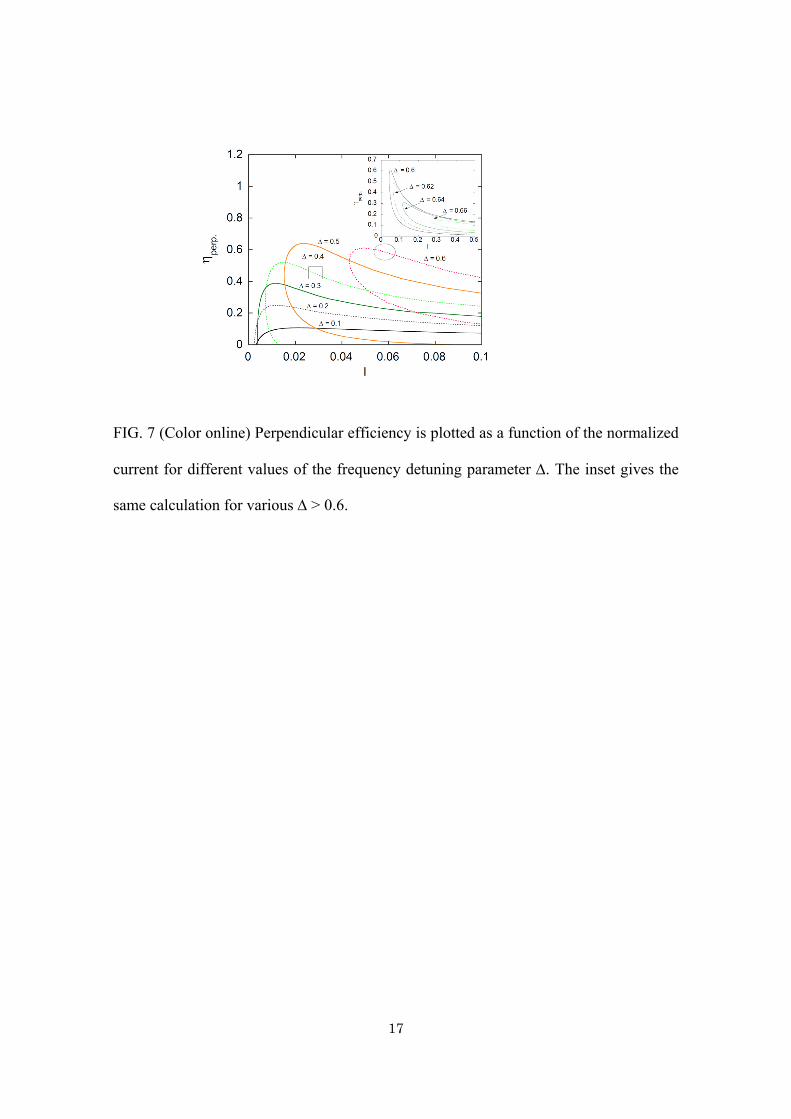
The frequency detuning parameter Δ for the FH TE4,3 mode is about 0.6 at Bc of 7.75
T and larger than 0.8 at 7.7 T. For these values of Δ, gyrotrons are in the hard excitation
region [17, 22]. With Δ as a parameter, the perpendicular efficiency η⊥ of the TE4,3
mode is plotted as a function of the normalized current I (Fig.7). The definitions of η⊥
and I are given in Ref. [17]. In this calculation, the normalized interaction length μ is set
at 13 corresponding to the present experiment; a circle indicates its parameter region.
The value of I is smaller than the start oscillation current at which η⊥ = 0. This region is
then in the hard excitation region. The square represents the parameter region of a
previous experiment [18, 19] and is located in the soft self-excitation region. The
present study is the first confirmation of the nonlinear excitation of an FH mode in the
hard excitation region in an SH sub-THz gyrotron. The inset in Fig. 7 depicts η⊥ for Δ
> 0.6. The abscissa is expanded to 0.5. The value of η⊥ rapidly decreases with Δ and
goes down to almost zero for Δ = 0.7. The calculation shown in Fig. 7 does not include
mode interaction. Therefore, the oscillation of the TE4,3 mode at Bc < 7.7 T is essentially
due to nonlinear excitation as a result of mode interaction. As shown in Fig. 2 (a), the
oscillation region of the TE4,3 mode extended to the low field side for Vk = 50 kV also. A
mode-interaction calculation confirms the nonlinear excitation of the TE4,3 mode for Vk
= 50 kV.
Mode interaction in gyrotrons has been discussed from various angles [1, 4, 5, 22, 23].
8
Mode changes from an SH mode to an FH mode with increasing Ib have been shown [4,
5]. The theory though predicts oscillations of only one mode. This is contrary to the
present observations. As for the interaction between an SH mode and the FH mode, hard
excitation of an SH mode with the help of a parasitic FH mode was theoretically found
[22]. However, the TE17,2 mode is self-excited, and moreover, the condition requiring
instant rise of beam voltage does not hold in the present experiment. Interaction
between arbitrary cyclotron harmonics was studied self-consistently [23]. This analysis
predicts hard excitation of a parasitic FH mode over a wide range of Δ with the presence
of an SH mode. The observed hard excitation of the TE4,3 mode agrees with this model.
Quantitative examination is the next task.
The interaction between two SH modes, TE17,2 and TE1,8, is good evidence of
nonsynchronous interaction between two modes [1]. A change of Rb results in a
transition from strong coupling, for which only the one-mode oscillation is stable, to
weak coupling for which two modes coexist. The transition from coexistence of the
TE17,2 and TE4,3 modes to oscillation of the TE4,3 mode only with increasing Bc can also
be interpreted as an example of nonsynchronous interaction. In this case, in Eq. (19) of
Ref. [1], γ21 < 0 holds for allocations of the TE17,2 mode to mode 1 and the TE4,3 mode
to mode 2. A discussion with the same viewpoint was given in Ref. [1].
In summary, we have observed for the first time the oscillation of a parasitic FH
mode in the hard excitation region coexisting with an SH mode in a high-power
sub-THz gyrotron. Both experimental and theoretical analyses interpret this as a
nonlinear excitation. The simultaneous oscillation of two SH modes was also clearly
observed. This is considered as an example of weak coupling between
nonsynchronously interacting modes.
9
The present study was supported by programs of the Grants-in-Aid for Scientific
Research of Japan Society for the Promotion of Science. Support was also received
under the NIFS Collaboration Research program.
[1] G. S. Nusinovich, IEEE Trans. Plasma Sci. 27, 313 (1999) and papers cited therein.
[2] V. Bratman et al., IEEE Trans. Plasma Sci. 37, 36 (2009).
[3] T. Idehara and S Sabchevski, J. Infrared Milli. Terahertz Waves 33, 667 (2012).
[4] S. H. Kao et al., Phys. Rev. Lett. 107, 135101 (2011).
[5] S. H. Kao et al., Phys. Plasmas 19, 023112 (2012).
[6] T. Notake et al., Phys. Rev. Lett. 103, 225002 (2009).
[7] T. Saito et al. Plasma Fusion Res. 7, 1206003 (2012).
[8] T. Saito et al., Phys. Plasmas 19, 063106 (2012).
[9] P. Woskoboinikov et al., Rev. Sic. Instrum. 57, 2113 (1986).
[10] H. Bindslev et al., Plasma Fusion Res. 2, S1023 (2007).
[11] M. Nishiura et al, Plasma Fusion Res. 6, 2402068 (2011).
[12] T. Notake et al., Rev. Sci. Instrum. 79, 10E732 (2008).
[13] T. Saito et al., J. Phys: Conference Series 227, 012013 (2010).
[14] K. E. Kreischer et al., IEEE Trans. Microwave Theory Tech. MTT-32, 481 (1984).
[15] V. E. Zapevalov et al., RadioPhys. Quantum Electronics 36, 346 (1993).
[16] S. Spira-Hakkarainen et al., IEEE Trans. Plasma Sci. 18, 334 (1990).
[17] B. G. Danly and R. J. Temkin, Phys. Fluids 29, 561 (1986).
[18] T. Idehara and Y. Shimizu, Phys. Plasmas 1, 3145 (1994).
[19] T. Idehara et al., Int. J. Infrared Milli. Waves 20, 1249 (1999).
[20] Y. Tatematsu et al., J. Infrared Milli. Terahz. Waves 33, 292 (2012).
10
[21] G. S. Saraph et al., Phys. Fluids B5, 4473 (1993).
[22] G. S. Nusinovich, Introduction to the Physics of Gyrotrons (The Johns Hopkins
University Press, 2004, Baltimore), p.100.
[23] O. Dumbrajs and G. S. Nusinovich, IEEE Trans. Plasma Sci. 18, 301 (1990).

11
FIG. 1 (Color online) Start oscillation currents Is plotted as functions of the cavity field
for Vk = 60 kV, Rb = 1.97 mm, α = 1.3. Labels near each curve indicate the oscillation
mode. For each mode, Is of either co-rotating or counter-rotating mode with lower
current is plotted to avoid unnecessary complication.

12
FIG. 2 (Color online) Oscillation intensities for (a) Vk = 50 kV, and (b) Vk = 60 kV are
plotted as functions of the cavity field. Solid lines represent signals with the high pass
filter; dashed lines are those without the high pass filter.

13
FIG. 3 Transmission signals through a Fabry-Perot interferometer plotted as functions
of distance between the reflecting meshes: (a) Bc = 7.6 T, (b) Bc = 7.68 T. The beam
voltage Vk was 60 kV; the beam current Ib was 10 A.
14
FIG. 4 Frequency spectra for the intermediate frequency signal from the harmonic
mixer of the heterodyne receiver system: (a) Rb = 1.97 mm, (b) Rb = 2.05 mm. The
abscissa is converted to an RF frequency scale.

15
FIG. 5 (Color online) Mode interaction calculations: (a) the relevant four SH modes are
taken into account; (b) only the FH TE4,3 mode is included in the calculation. (Vk = 60
kV, Rb = 1.97 mm, α = 1.33)
16
FIG. 6 (Color online) Temporal evolution of the TE4,3 mode and the TE17,2 mode at Bc =
7.69 T is plotted on the mode interaction calculation. (Vk = 60 kV, Rb = 1.97 mm, α =
1.33) The inset displays the startup phase.
17
FIG. 7 (Color online) Perpendicular efficiency is plotted as a function of the normalized
current for different values of the frequency detuning parameter Δ. The inset gives the
same calculation for various Δ > 0.6.