front row seatfilecache.drivetheweb.com/mr5cnw_flintenergy/69866/a… · · 2013-02-04north...
TRANSCRIPT

ANNUAL MEETING OF SHAREHOLDERSMetropolitan CentreC l Alb tCalgary, AlbertaMay 5, 2011
Your investment in Flint gives you a
t ti l l i FRONT ROW SEAT
at every unconventional energy play in North America
1
Annual Meeting of Shareholders
Agenda
gMay 5, 2011
Agenda• Call Meeting to Order Scrutineer’s Report• Election of Directors• Tabling of the December 31, 2010 Financial Statements• Appointment of Auditors• Other Matters• Adjournment
Management Presentation W J Bill Li d
2
• W. J. Bill Lingard President and Chief Executive Officer

Nominees for Directors of the Corporation
•••
••
•••
• •
3
Management PresentationManagement Presentation
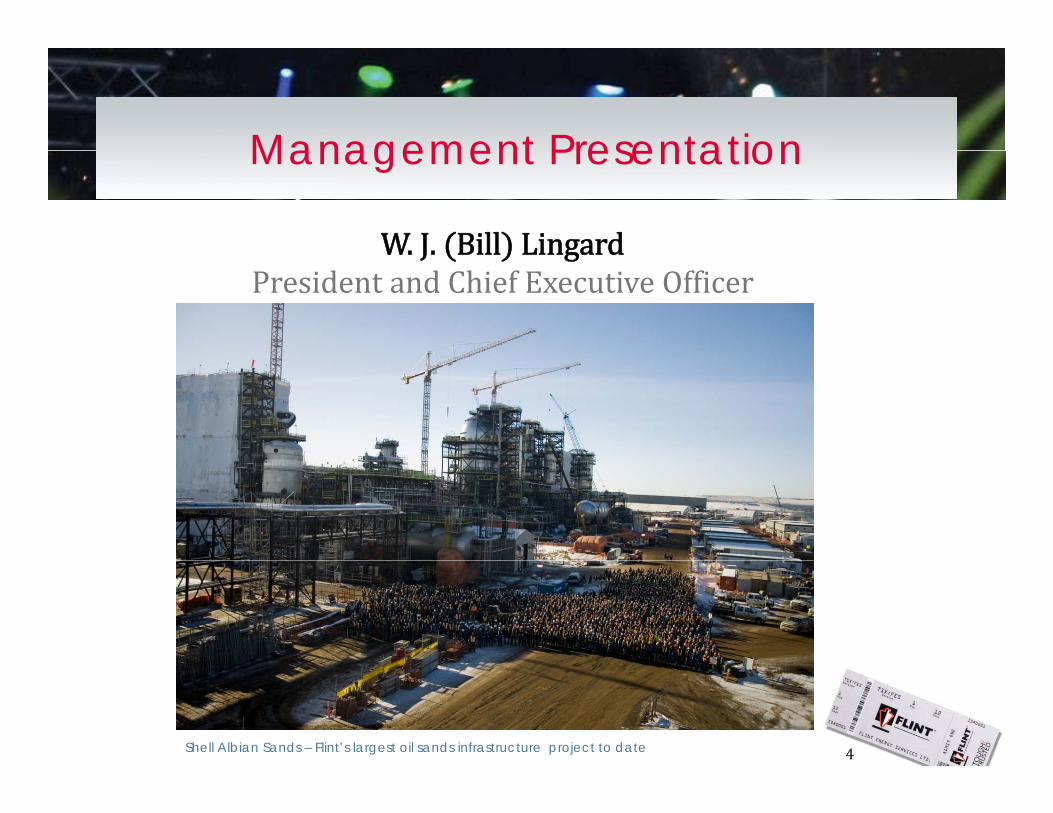
W. J. Bill LingardW. J. Bill LingardPresident and Chief Executive Officer
4Shell Albian Sands – Flint’s largest oil sands infrastructure project to date

Forward Looking Information StatementForward-Looking Information Statement
This presentation contains forward‐looking statements concerning the Company’s projected operating results and anticipated capital expenditure trends and drilling activity in the oil and gas industry. Actual events or results may differ materially from those reflected in the Company’s forward‐looking statements due to a
b f i k i i d h f ff i h C ’ b inumber of risks, uncertainties and other factors affecting the Company’s business and the oil and gas industry generally. These risk factors include, but are not limited to risks and uncertainties described d h h di “Ri k F ” d l h i h C ’ A lunder the heading “Risk Factors” and elsewhere in the Company’s Annual
Information Form for the year ended December 31, 2010, and other documents filed with Canadian provincial securities authorities, which are available to the public at wwwsedarcompublic at www.sedar.com. Unless otherwise indicated, all financial information in this presentation is in Canadian dollars and in accordance with Canadian generally accepted accounting principles
5
principles.
Flint’s History of GrowthFlint s History of Growth
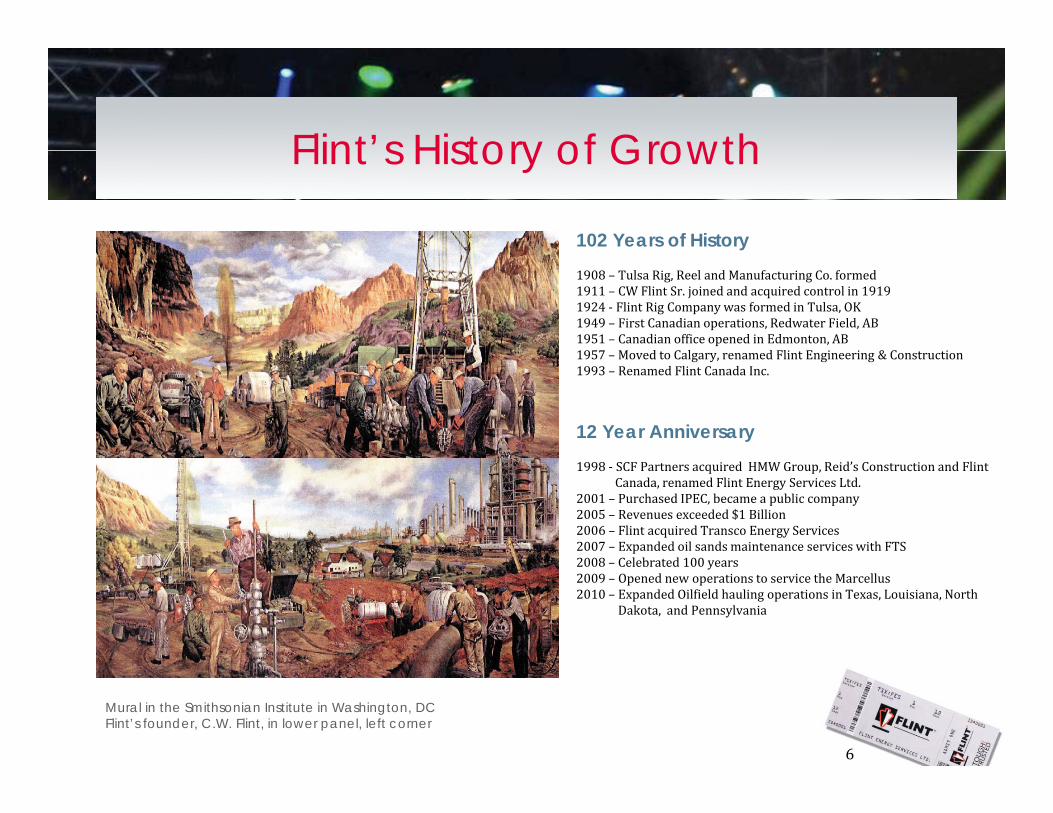
102 Years of History1908 – Tulsa Rig, Reel and Manufacturing Co. formed 1911 – CW Flint Sr. joined and acquired control in 19191924 ‐ Flint Rig Company was formed in Tulsa, OK 1949 – First Canadian operations, Redwater Field, AB1951 – Canadian office opened in Edmonton, AB1957 – Moved to Calgary renamed Flint Engineering & Construction1957 – Moved to Calgary, renamed Flint Engineering & Construction1993 – Renamed Flint Canada Inc.
12 Year Anniversary1998 ‐ SCF Partners acquired HMW Group, Reid’s Construction and Flint
Canada, renamed Flint Energy Services Ltd.2001 – Purchased IPEC, became a public company 2005 – Revenues exceeded $1 Billion2006 – Flint acquired Transco Energy Services2007 – Expanded oil sands maintenance services with FTS 2008 Celebrated 100 years2008 – Celebrated 100 years 2009 – Opened new operations to service the Marcellus2010 – Expanded Oilfield hauling operations in Texas, Louisiana, North
Dakota, and Pennsylvania
6
Mural in the Smithsonian Institute in Washington, DC Flint’s founder, C.W. Flint, in lower panel, left corner
Flint’s Strategy - “Build it then Maintain it”Trading and Financial Indicatorsit”Trading and Financial Indicators
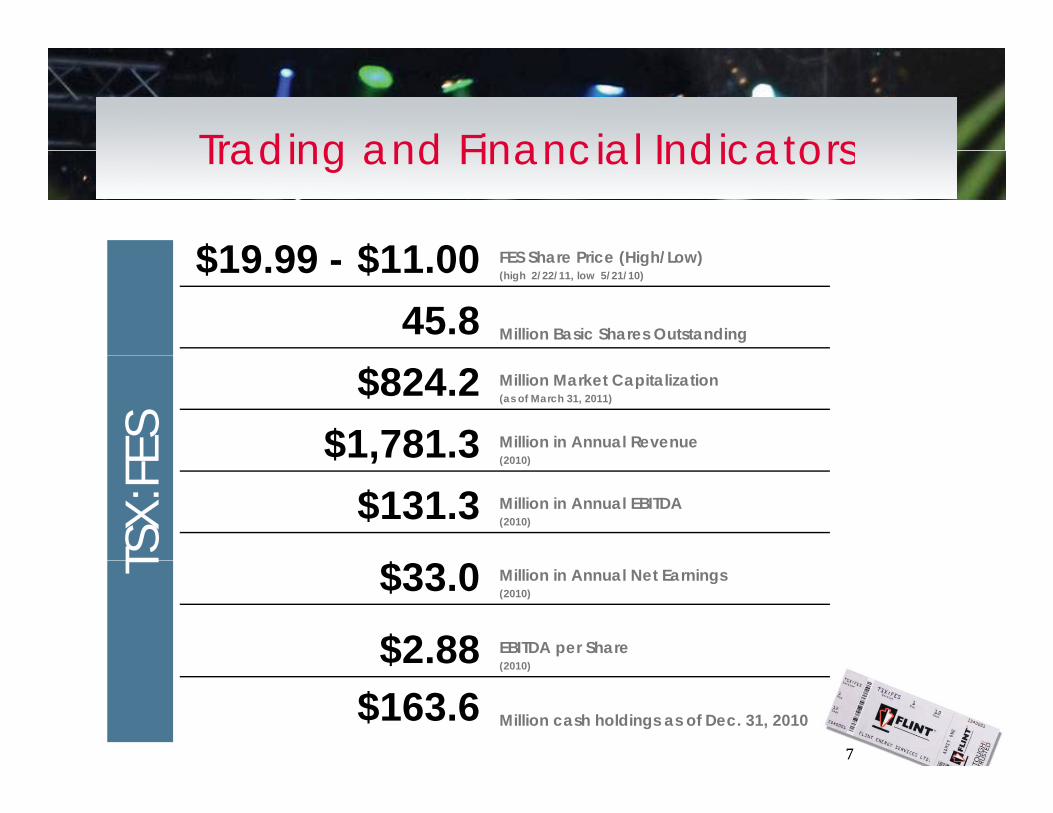
$19 99 $11 00 FES Sh P i (Hi h/L )$19.99 - $11.00 FES Share Price (High/Low)(high 2/22/11, low 5/21/10)
45.8 Million Basic Shares Outstanding
$824.2 Million Market Capitalization (as of March 31, 2011)
$1,781.3 Million in Annual Revenue (2010)ES $ ,78 3 (2010)
$131.3 Million in Annual EBITDA(2010)
$TSX:
FE
$33.0 Million in Annual Net Earnings (2010)
$2.88 EBITDA per Share (2010)
T
7
$ .88 (2010)
$163.6 Million cash holdings as of Dec. 31, 2010
Flint’s Strategy - “Build it then Maintain it”
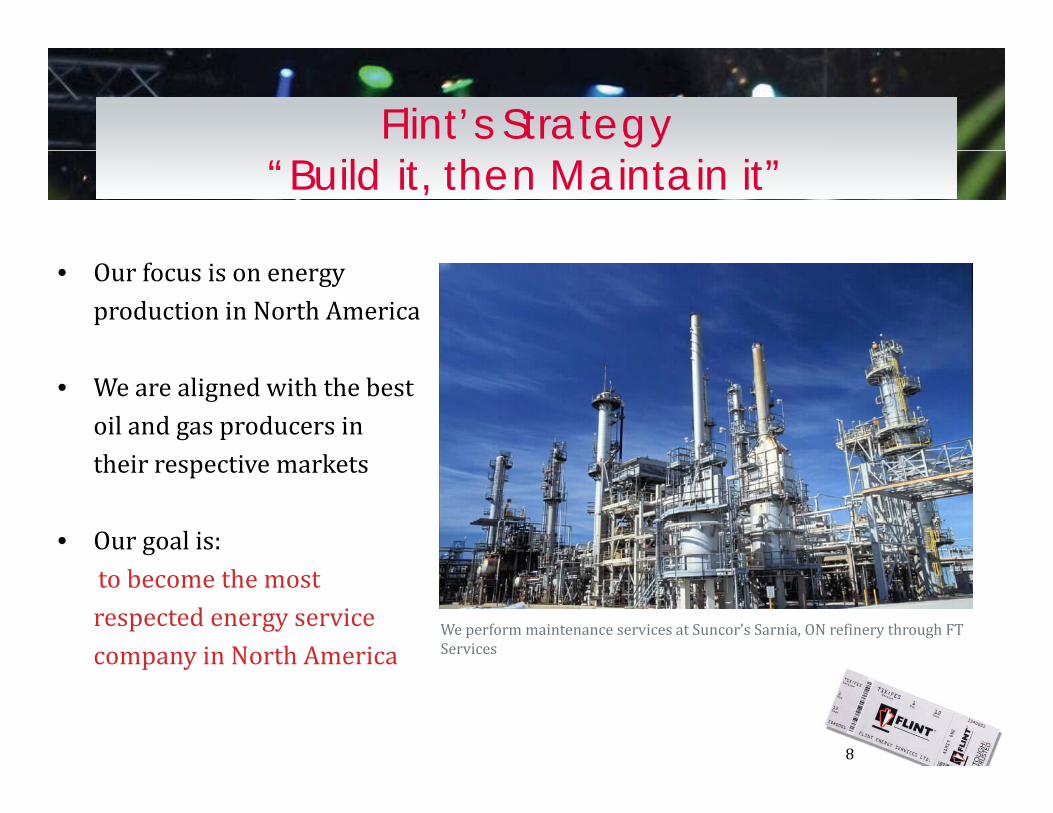
Flint’s Strategyit”“Build it, then Maintain it”
• Our focus is on energy production in North America
• We are aligned with the best oil and gas producers in th i ti k ttheir respective markets
• Our goal is:to become the most respected energy service company in North America
We perform maintenance services at Suncor’s Sarnia, ON refinery through FT Services
8
company in North America

Full Cycle ServicesFull-Cycle Services
OILFIELD PRODUCTION FACILITY MAINTENANCESERVICES SERVICES INFRASTRUCTURE SERVICES
Early cycle Late cycleEarly cycle Late cycle
Upstream Drilling Downstream RefiningMidstream Production
9
Transportation, Construction, Manufacturing & Maintenance
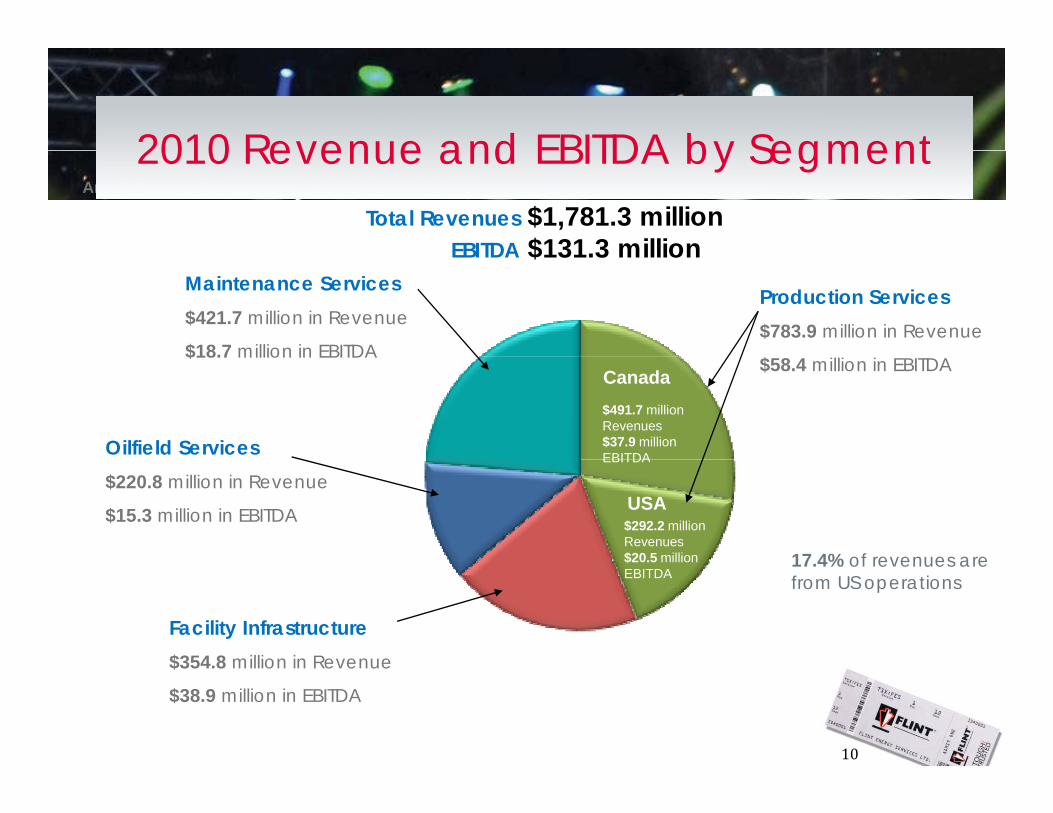
2010 Revenue by Segment2010 Revenue and EBITDA by Segment2010 Revenue by Segment
Total Revenues $1,781.3 millionEBITDA $131 3 million
Amounts in C$ millions
2010 Revenue and EBITDA by Segment
EBITDA $131.3 millionProduction Services$783.9 million in Revenue
Maintenance Services$421.7 million in Revenue
$18.7 million in EBITDA$58.4 million in EBITDA
Oilfield Services
$18.7 million in EBITDACanada$491.7 million Revenues$37.9 million EBITDA
$220.8 million in Revenue
$15.3 million in EBITDA USA
EBITDA
$292.2 million Revenues$20.5 million 17 4% of revenues are
Facility Infrastructure$354 8 million in Revenue
$20.5 million EBITDA
17.4% of revenues arefrom US operations
10
$354.8 million in Revenue
$38.9 million in EBITDA

Fabrication & Construction ActivitiesFabrication & Construction Activities
Top L: Shell’s Albian Sands Project, NE ABTop R: BP Node 3 in NE BCTop R: BP Node 3, in NE BCBottom L: Module Fabrication, Sherwood Park, AB
11
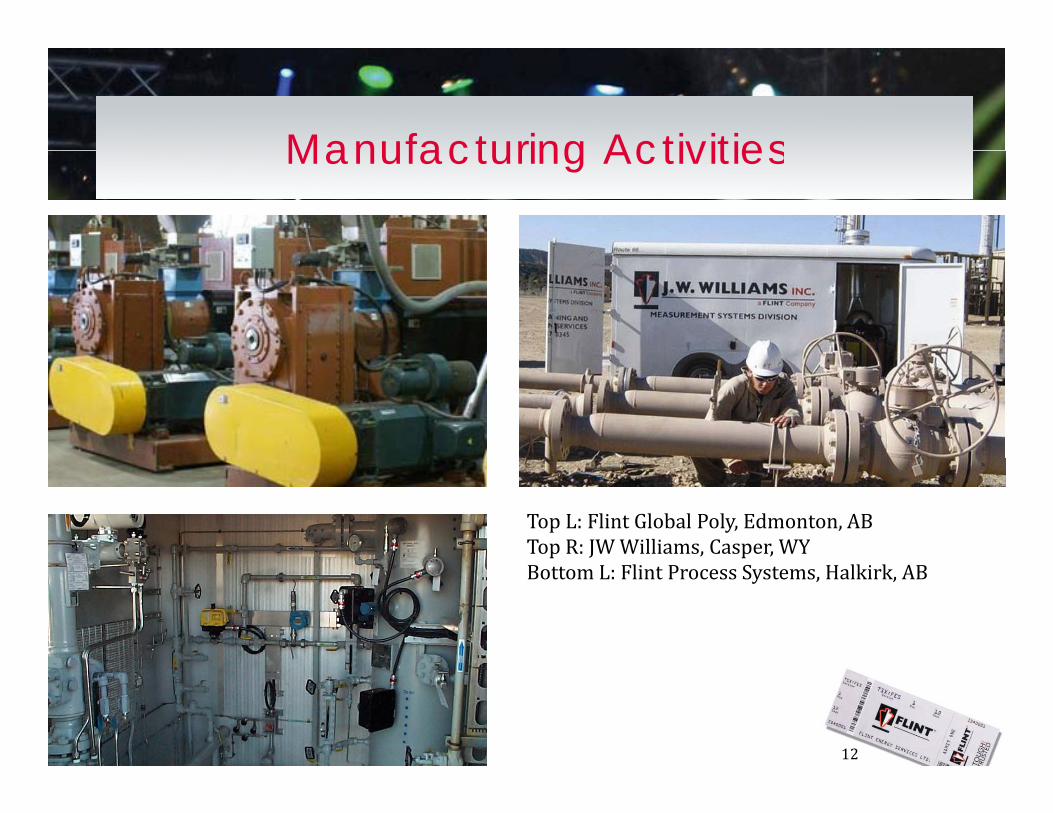
Manufacturing ActivitiesManufacturing Activities
Add global poly
Top L: Flint Global Poly, Edmonton, ABTop R: JW Williams, Casper, WYBottom L: Flint Process Systems, Halkirk, AB
Add paint earth
12
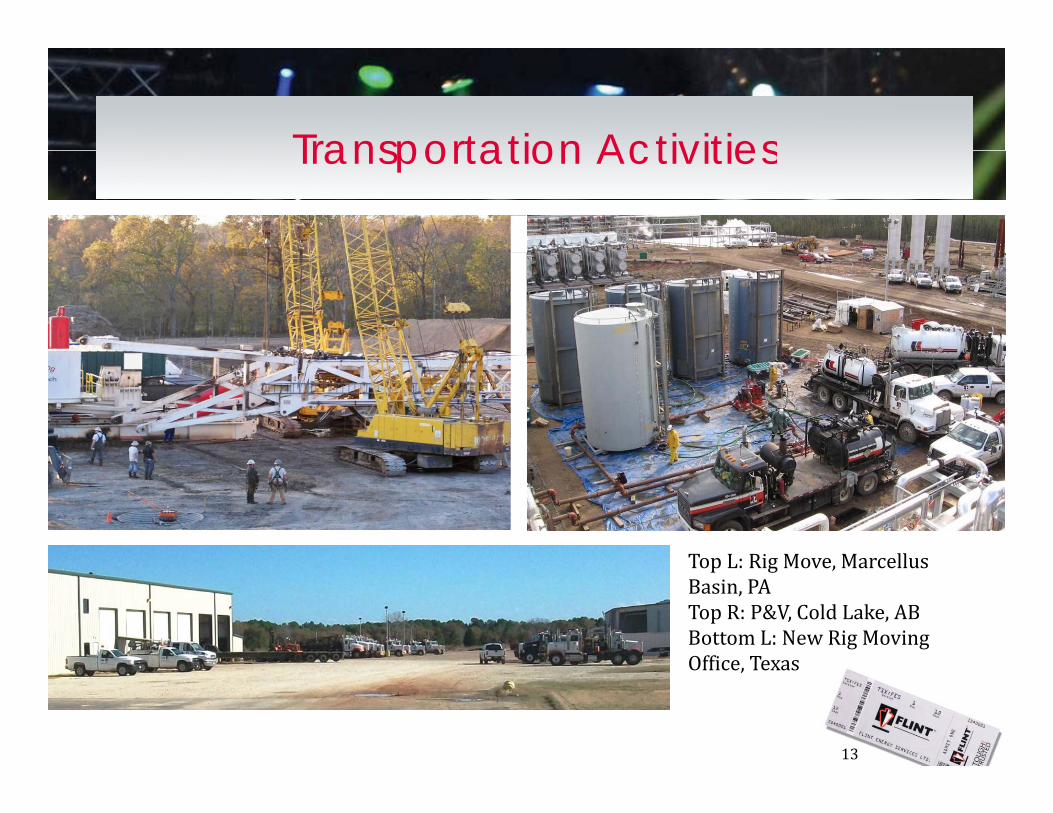
Transportation ActivitiesTransportation Activities
Top L: Rig Move MarcellusTop L: Rig Move, Marcellus Basin, PATop R: P&V, Cold Lake, ABBottom L: New Rig Moving Office Texas
13
Office, Texas

Maintenance ActivitiesMaintenance Activities
Top L: Nexen’s Long Lake Facilities p gTop R: Suncor Energy’s Firebag 1 & 2Bottom L: Tubular Management, Nisku, ABAdd tubular management
14
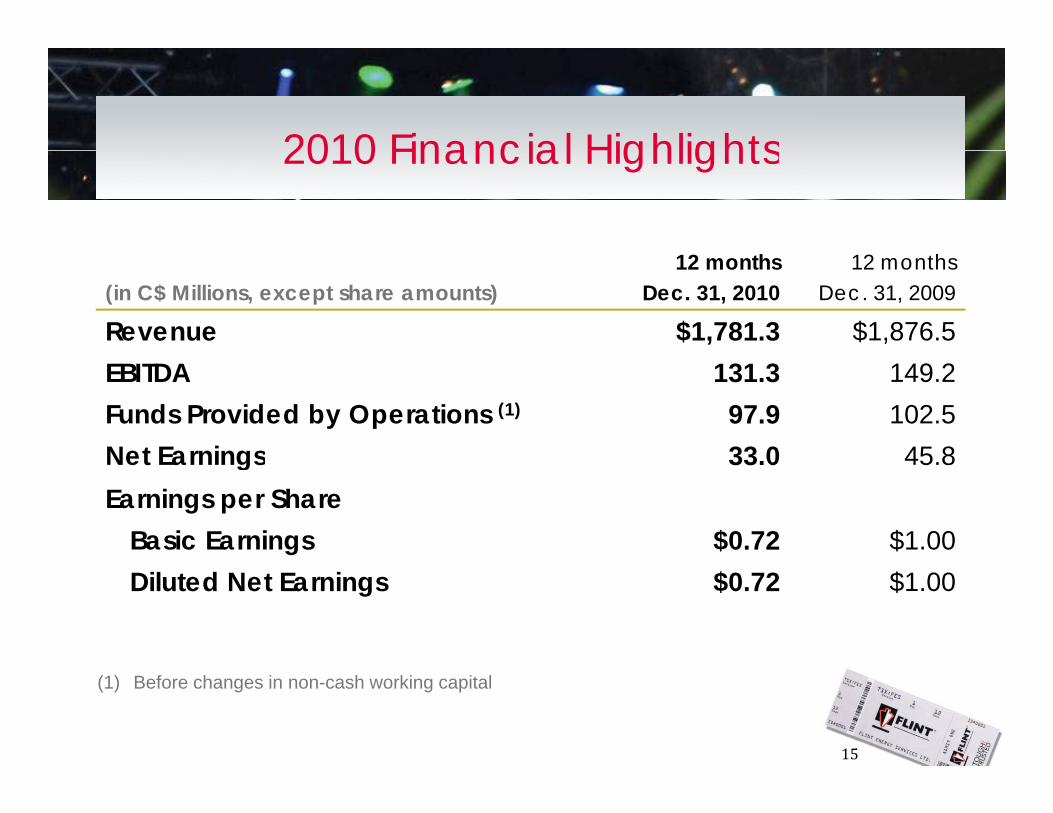
2010 Financial Highlights2010 Financial Highlights
(in C$ Millions, except share amounts)12 months
Dec. 31, 201012 months
Dec. 31, 2009
Revenue $1,781.3 $1,876.5EBITDA 131.3 149.2Funds Provided by Operations (1) 97.9 102.5Net Earnings 33 0 45 8Net Earnings 33.0 45.8Earnings per Share
Basic Earnings $0.72 $1.00Diluted Net Earnings $0.72 $1.00
15
(1) Before changes in non-cash working capital
2010 Balance Sheet Summary
(in C$ Millions) Dec 31 2010 Dec 31 2009
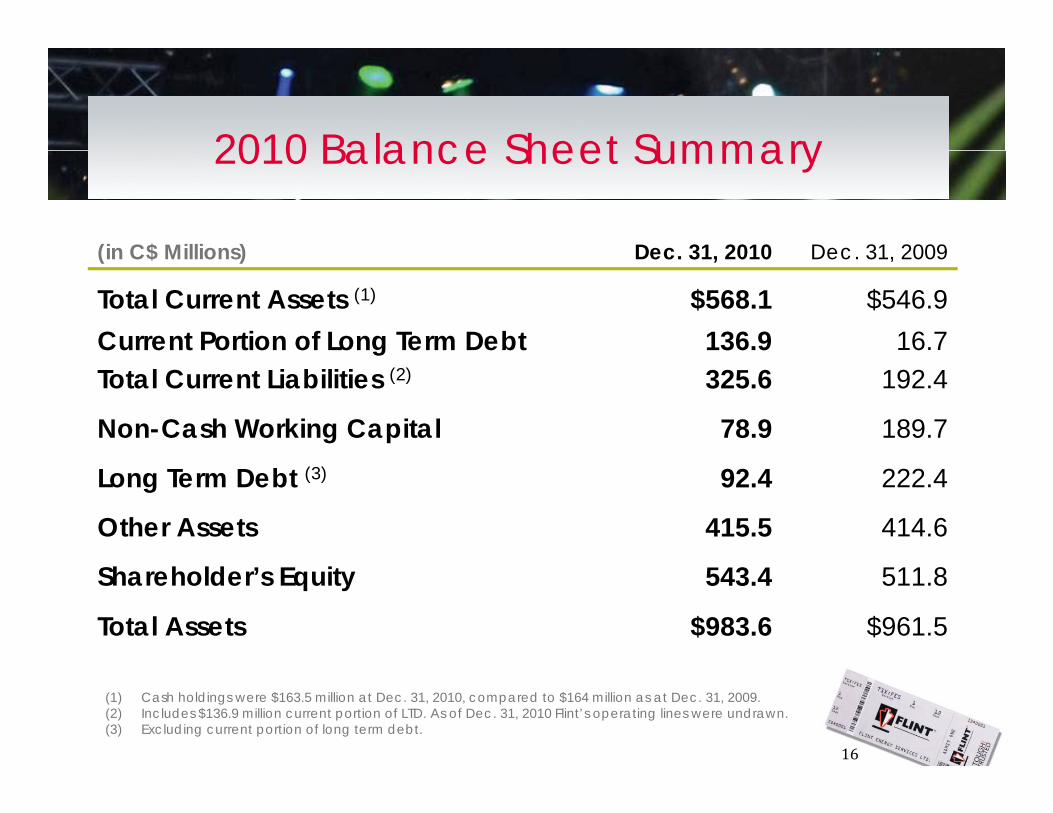
2010 Balance Sheet Summary
(in C$ Millions) Dec. 31, 2010 Dec. 31, 2009
Total Current Assets (1) $568.1 $546.9Current Portion of Long Term Debt 136.9 16.7gTotal Current Liabilities (2) 325.6 192.4
Non-Cash Working Capital 78.9 189.7
Long Term Debt (3) 92.4 222.4
Other Assets 415.5 414.6
Shareholder’s Equity 543.4 511.8
Total Assets $983.6 $961.5
16
(1) Cash holdings were $163.5 million at Dec. 31, 2010, compared to $164 million as at Dec. 31, 2009. (2) Includes $136.9 million current portion of LTD. As of Dec. 31, 2010 Flint’s operating lines were undrawn. (3) Excluding current portion of long term debt.
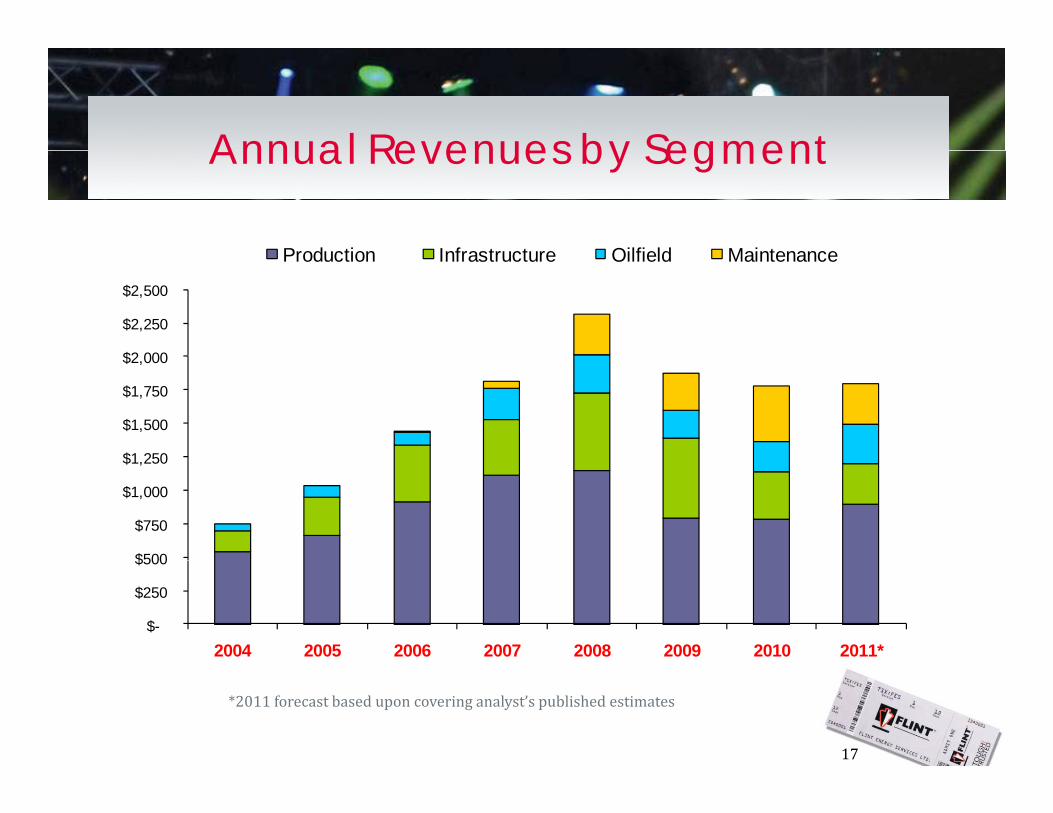
Annual Revenues by Segment
Production Infrastructure Oilfield Maintenance
Annual Revenues by Segment
$2 000
$2,250
$2,500
Production Infrastructure Oilfield Maintenance
$1 250
$1,500
$1,750
$2,000
$500
$750
$1,000
$1,250
$-
$250
$500
2004 2005 2006 2007 2008 2009 2010 2011*
17
*2011 forecast based upon covering analyst’s published estimates
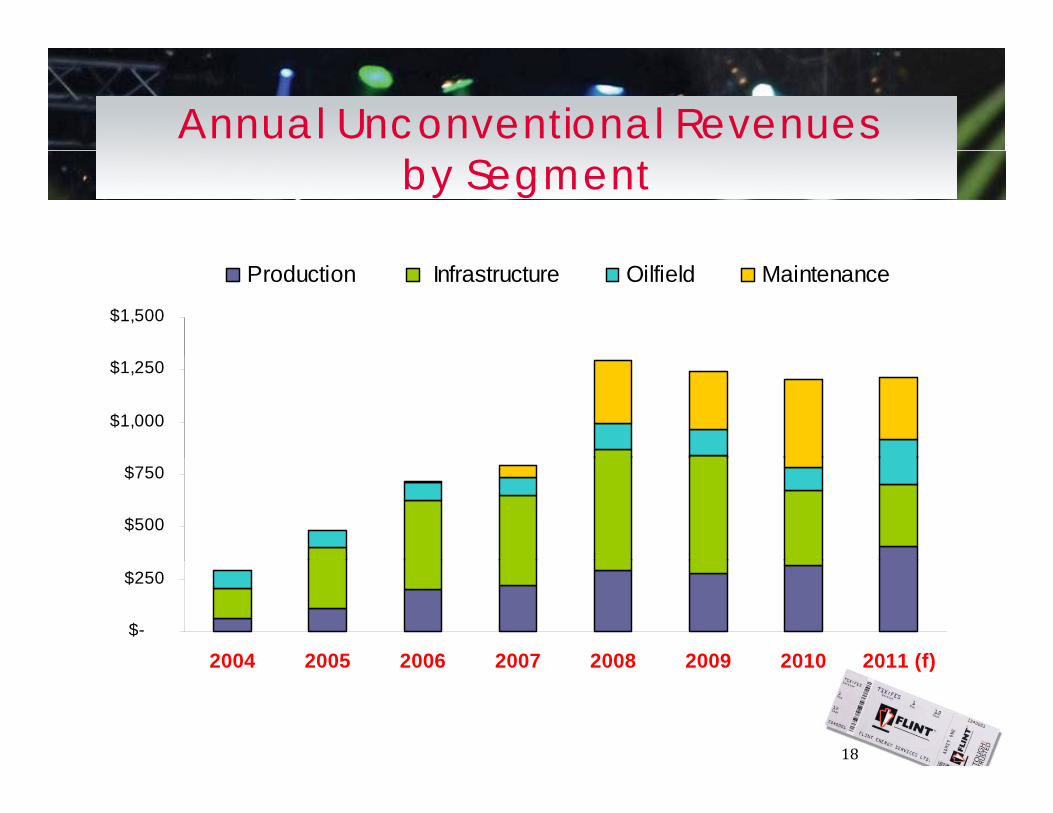
Annual Unconventional Revenues by Segment
$1,500
Production Infrastructure Oilfield Maintenance
$1,000
$1,250
$500
$750
$-
$250
2004 2005 2006 2007 2008 2009 2010 2011 (f)
18
2004 2005 2006 2007 2008 2009 2010 2011 (f)
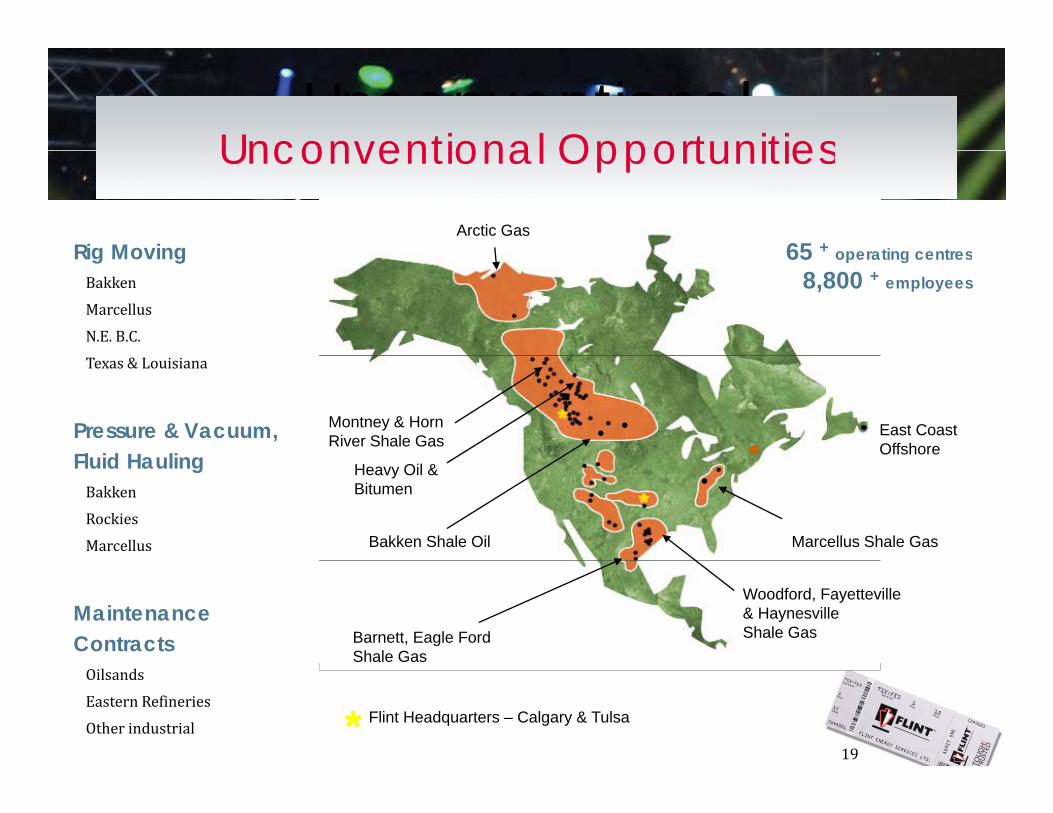
Unconventional i iUnconventional OpportunitiesOpportunities
Rig MovingArctic Gas
65 + operating centres
Unconventional Opportunities
Rig MovingBakken
Marcellus
N.E. B.C.
65 operating centres
8,800 + employees
Texas & Louisiana
Pressure & Vacuum, Fluid Hauling
Montney & Horn River Shale Gas
East CoastOffshoreFluid Hauling
Bakken
Rockies
Marcellus Bakken Shale Oil Marcellus Shale Gas
Heavy Oil & Bitumen
Maintenance Contracts
Woodford, Fayetteville & HaynesvilleShale GasBarnett, Eagle Ford
Shale Gas
19
Oilsands
Eastern Refineries
Other industrial ** Flint Headquarters – Calgary & Tulsa
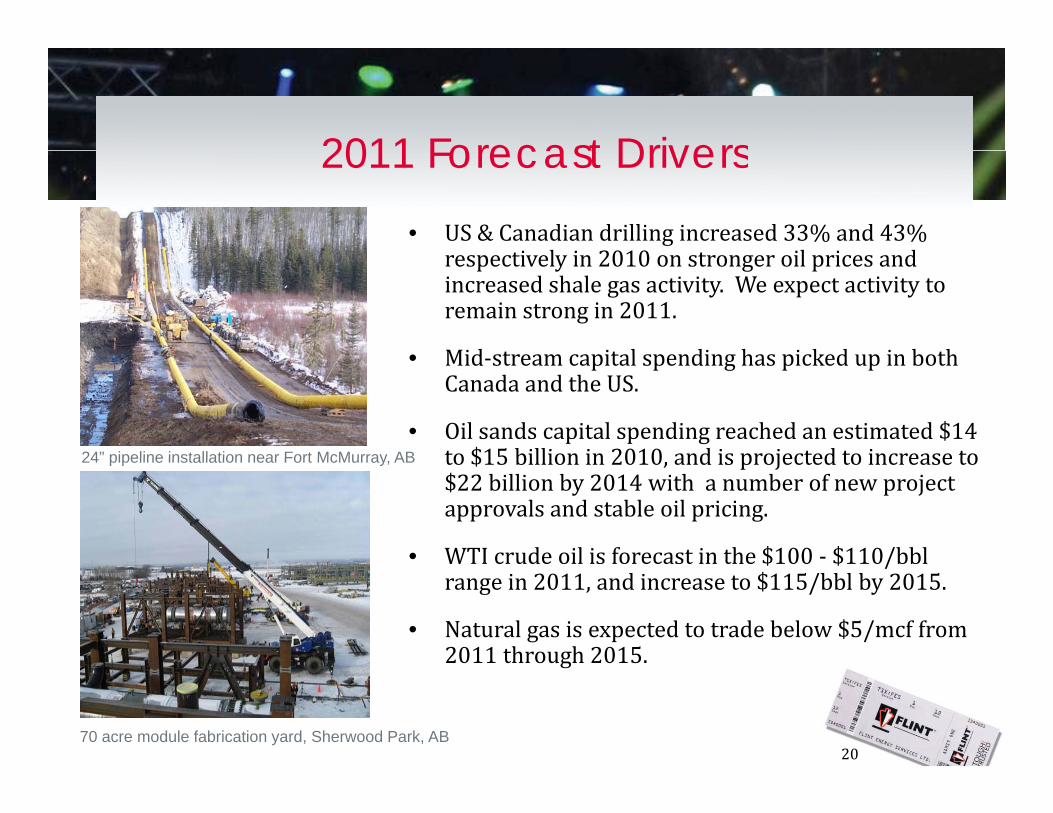
2011 Forecast Drivers
• US & Canadian drilling increased 33% and 43% ti l i 2010 t il i d
2011 Forecast Drivers
respectively in 2010 on stronger oil prices and increased shale gas activity. We expect activity to remain strong in 2011.
• Mid stream capital spending has picked up in both• Mid‐stream capital spending has picked up in both Canada and the US.
• Oil sands capital spending reached an estimated $14 to $15 billion in 2010 and is projected to increase to24” pipeline installation near Fort McMurray AB to $15 billion in 2010, and is projected to increase to $22 billion by 2014 with a number of new project approvals and stable oil pricing.
• WTI crude oil is forecast in the $100 ‐ $110/bbl
24 pipeline installation near Fort McMurray, AB
WTI crude oil is forecast in the $100 $110/bbl range in 2011, and increase to $115/bbl by 2015.
• Natural gas is expected to trade below $5/mcf from 2011 through 2015.
20
0 t oug 0 5
70 acre module fabrication yard, Sherwood Park, AB
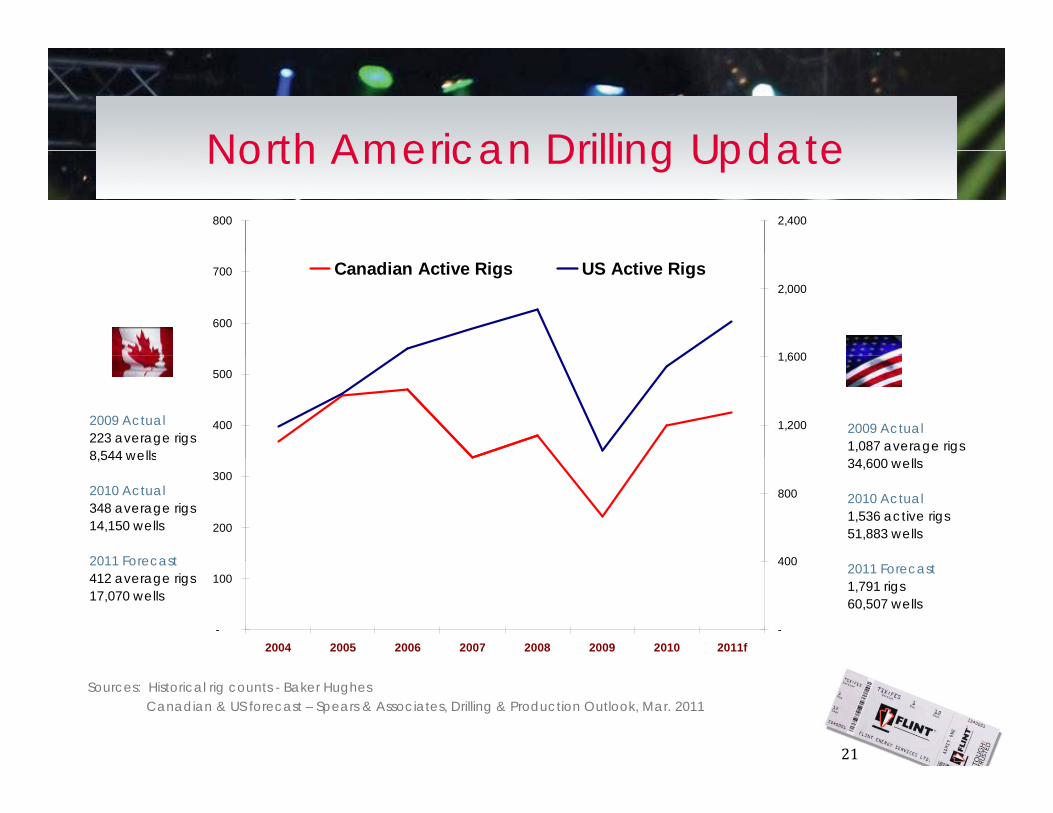
North American Drilling Update800 2,400
North American Drilling Update
600
700
1 600
2,000Canadian Active Rigs US Active Rigs
2009 Actual223 average rigs 8 544 wells
400
500
1,200
1,600
2009 Actual1,087 average rigs
8,544 wells
2010 Actual 348 average rigs 14,150 wells
2011 Forecast
200
300
400
800
34,600 wells
2010 Actual 1,536 active rigs 51,883 wells
2011 Forecast 412 average rigs17,070 wells
-
100
2004 2005 2006 2007 2008 2009 2010 2011f-
400 2011 Forecast 1,791 rigs60,507 wells
21
Sources: Historical rig counts - Baker HughesCanadian & US forecast – Spears & Associates, Drilling & Production Outlook, Mar. 2011

Flint’s Oil Sands Construction ActivitiesFlint s Oil Sands Construction Activities
Current Contracts: Contract History:Suncor’s Firebag 3 ‐ site‐wide field construction
Suncor’s Firebag 4 ‐ module fabrication$108 million in contract backlog
Suncor’s Firebag 1 & 2 & Co‐GenSuncor’s Millennium Coker & Vacuum UnitsNexen’s Long Lake GasifierHusky’s Tucker Lake$108 million in contract backlog Husky s Tucker LakeConocoPhillips’ Surmont 1EnCana’s Foster CreekPetro‐Canada’s Mackay RiverShell’s Albian Sands Froth Treatment Statoil’s Leismer SAGD Project
Statoil Leismer SAGD Project
22Shell’s Albian Sands Mine – froth treatment facility
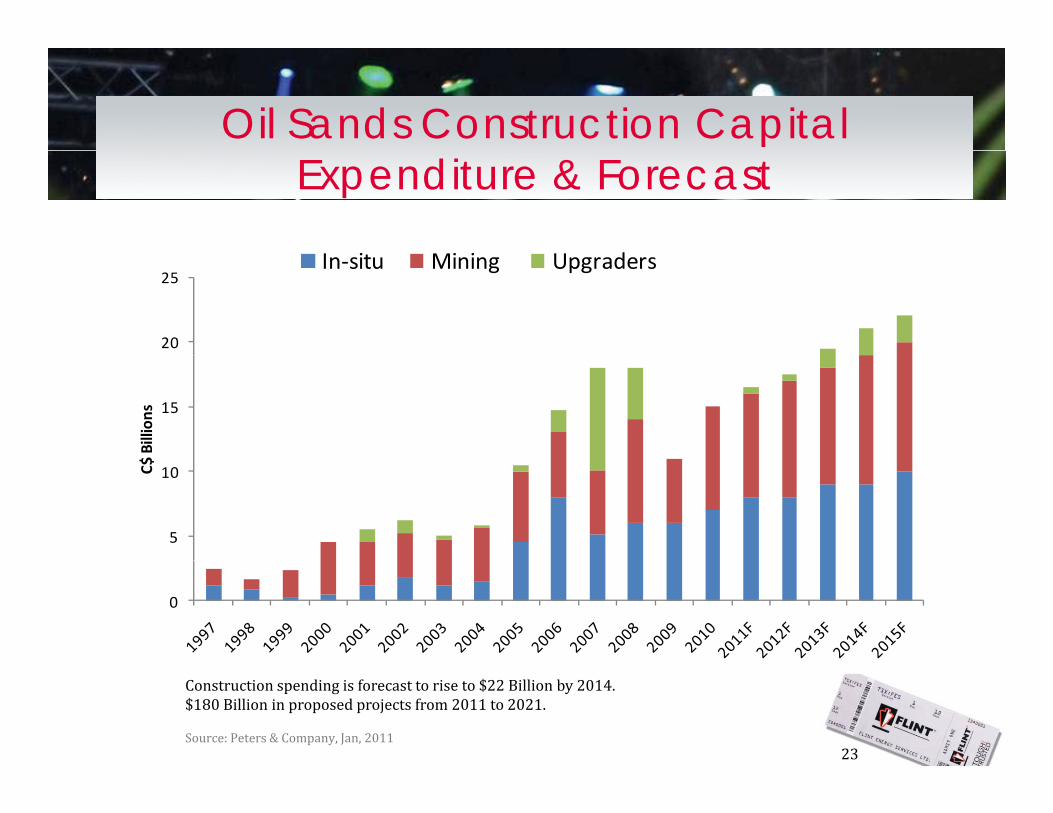
Oil Sands Construction Capital Expenditure & Forecast
i i i d
20
25In‐situ Mining Upgraders
15
$ Billion
s
5
10C$
0
23
Construction spending is forecast to rise to $22 Billion by 2014.$180 Billion in proposed projects from 2011 to 2021.
Source: Peters & Company, Jan, 2011
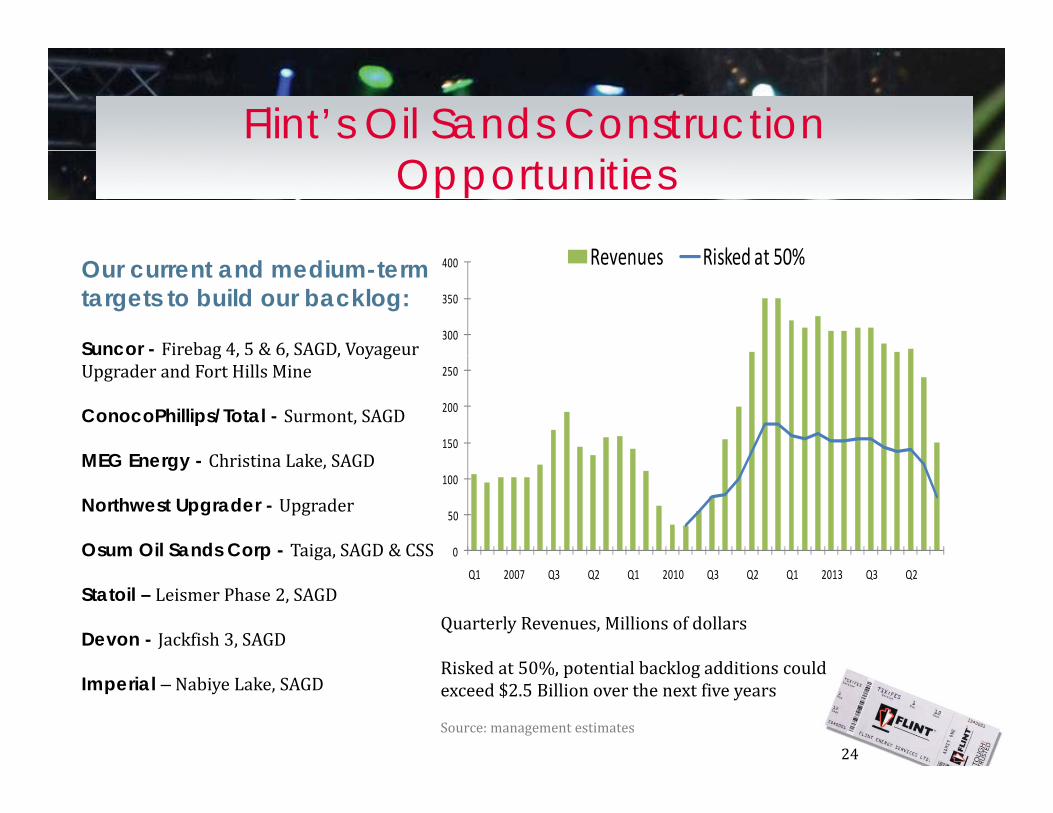
Flint’s Oil Sands Construction Opportunities
Revenues Risked at 50%
300
350
400 Revenues Risked at 50%Our current and medium-term targets to build our backlog:
Suncor - Firebag 4, 5 & 6, SAGD, Voyageur
150
200
250
g , , , y gUpgrader and Fort Hills Mine
ConocoPhillips/Total - Surmont, SAGD
MEG Energy Christina Lake SAGD
0
50
100MEG Energy - Christina Lake, SAGD
Northwest Upgrader - Upgrader
Osum Oil Sands Corp - Taiga, SAGD & CSSQ1 2007 Q3 Q2 Q1 2010 Q3 Q2 Q1 2013 Q3 Q2
Quarterly Revenues, Millions of dollars
Ri k d 50% i l b kl ddi i ld
Statoil – Leismer Phase 2, SAGD
Devon - Jackfish 3, SAGD
24
Risked at 50%, potential backlog additions could exceed $2.5 Billion over the next five years
Source: management estimates
Imperial – Nabiye Lake, SAGD

Flint’s Maintenance StrategyFlint’s Oilsands Maintenance gy‘Build it, then Maintain it’
Flint s Oilsands Maintenance
•Bitumen production is expected to increase to over 2.2 million bbl/day by 2015
Oilsands Production & Maintenance Forecast
2.5 Daily Production Annual Maintenance
•Maintenance spending projected to increase 10% annually to $1.6 billion in 2015•Flint’s 50% owned FT Services has
1.0
1.5
2.0
t s 50% o ed Se v ces asthree multi‐year contracts with major oil sands producers•Over $2.1 billion in contracted maintenance backlog 50% to Flint
0.0
0.5
2007 2008 2009e 2010e 2011e 2012e 2013e 2014e 2015e
maintenance backlog 50% to Flint•Maintenance typically covers : day‐to‐day maintenance, sustaining capital, turnarounds, and managing
Millions of barrels per day, Billions of dollars annuallySource: CAPP Oilsands production forecast, Oilsands Review 10/10Maintenance costs adapted from Peters & Company ‐ Oilsands Maintenance
h 2008
25
third party services Forecast March 2008
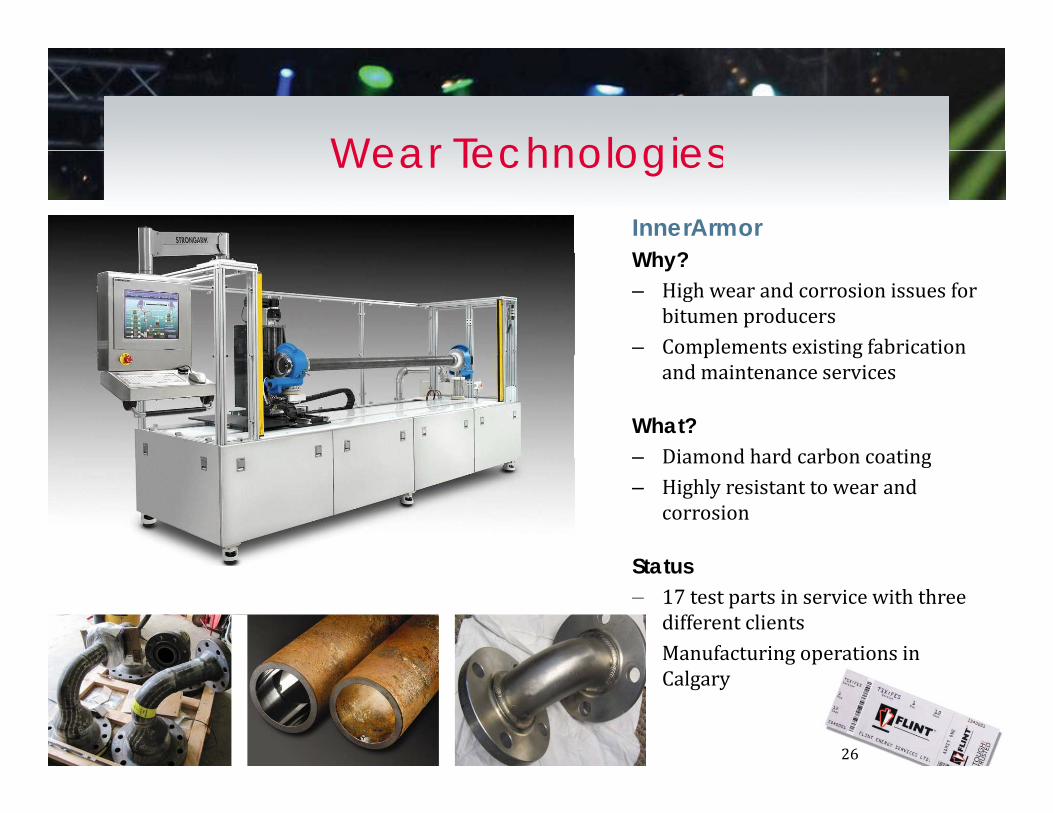
Wear TechnologiesInnerArmorWh ?
Wear Technologies
Why?– High wear and corrosion issues for
bitumen producers– Complements existing fabrication p g
and maintenance services
What?– Diamond hard carbon coating– Diamond hard carbon coating– Highly resistant to wear and
corrosion
St tStatus– 17 test parts in service with three
different clients– Manufacturing operations in
26
g pCalgary
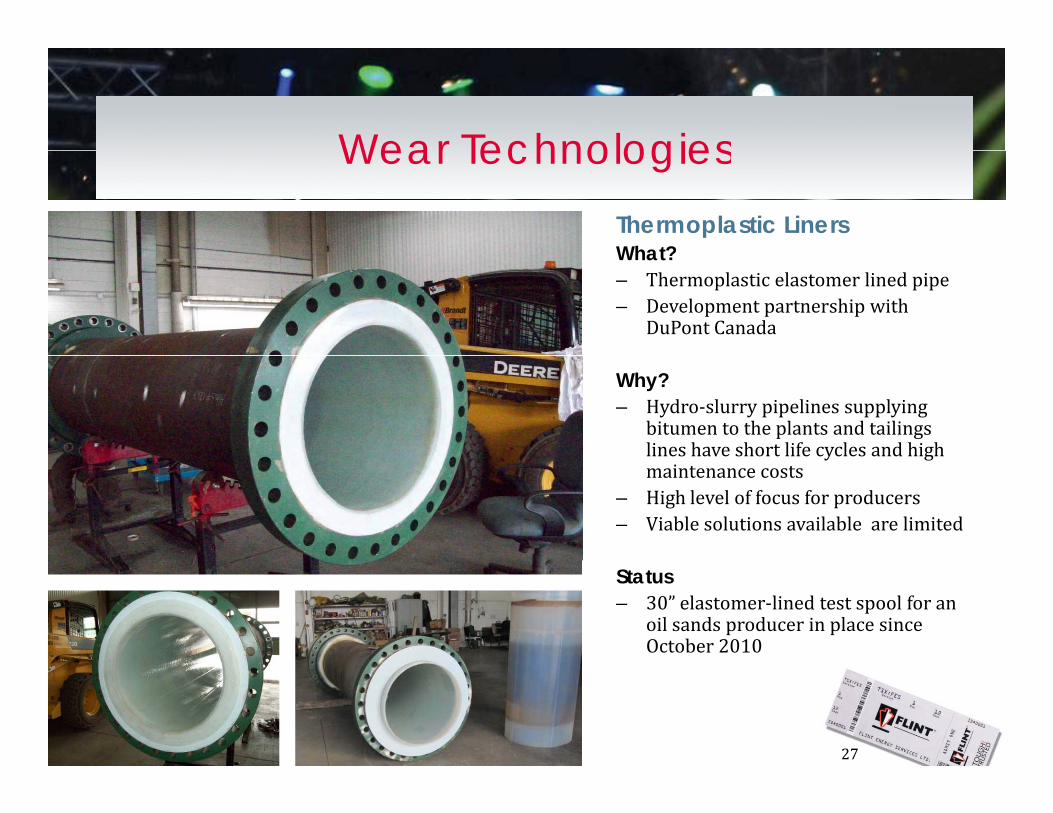
Wear TechnologiesThermoplastic LinersWhat?
Wear Technologies
What?– Thermoplastic elastomer lined pipe– Development partnership with
DuPont Canada
Why?– Hydro‐slurry pipelines supplying
bitumen to the plants and tailings lines have short life cycles and high y gmaintenance costs
– High level of focus for producers– Viable solutions available are limited
Status– 30” elastomer‐lined test spool for an
oil sands producer in place since October 2010
27
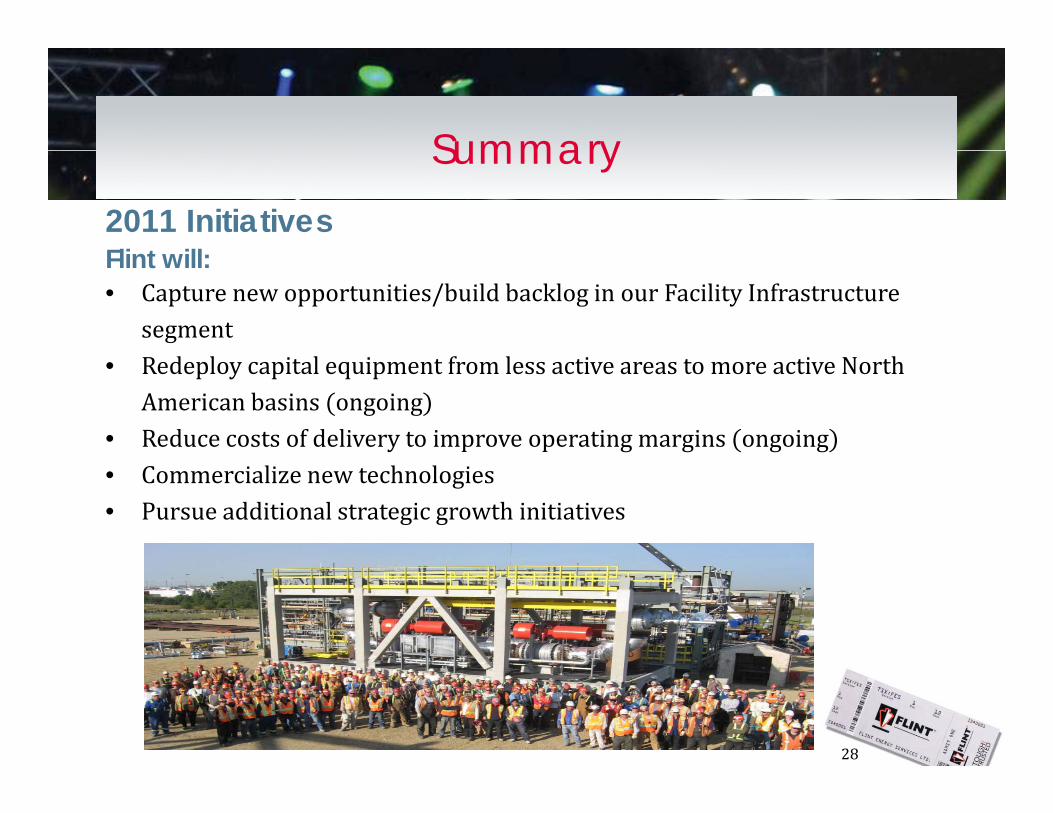
Summary2011 Initiatives Fli t ill
Summary
Flint will:• Capture new opportunities/build backlog in our Facility Infrastructure
segment• Redeploy capital equipment from less active areas to more active North
American basins ongoing• Reduce costs of delivery to improve operating margins ongoing• Commercialize new technologies• Pursue additional strategic growth initiatives
28

St t i ll P iti dStrategically Positioned
Fi i ll StFinancially Strong
Diversified Integrated ServicesDiversified, Integrated Services
InnovativeInnovative
An Encore Performer
29