full media release
TRANSCRIPT
P.O. Box 28 – 1000 AA Amsterdam – The Netherlands
Office address - Tweede Weteringplantsoen 21 – 1017 ZD Amsterdam
Heineken N.V. - Registered Office at Amsterdam – Trade Register Amsterdam No. 33011433
Page 1 of 49
MEDIA RELEASE
Heineken N.V. reports full year 2014 results
Strong profit growth, delivering on strategic priorities
Amsterdam, 11 February 2015 – Heineken N.V. today announced:
Group revenue grew 3.3% organically, with group revenue per hl up 1.4%
Heineken® premium volume +5.1% with growth across all regions
Innovation rate accelerated further to 7.7% contributing €1.5 billion of revenues
Group operating profit (beia) up 7.8% organically
Consolidated Operating profit (beia) margin expansion of 90bps, ahead of medium
term target level
Net profit (beia) of €1,758 million, 14% higher organically
Diluted EPS (beia) of €3.05 (2013: €2.75) including a 6 cent adverse currency impact
Dividend policy pay-out ratio widened to 30%-40% (from 30%-35%) of Net profit
(beia); proposed 2014 total dividend €1.10 per share (2013: €0.89), implying a 36%
pay-out ratio (2013: 32%)
CEO STATEMENT
Jean-François van Boxmeer, Chairman of the Executive Board & CEO, commented:
"Our strong performance reflects the success of our strategy. We continued to invest in our portfolio of brands and we have significantly improved our commercial execution. We combined this with compelling consumer marketing and a powerful innovation agenda which contributed €1.5 billion to our revenues. As a result, Heineken® premium volume grew 5.1% and a number of our global brands achieved double digit growth. We remain committed to our medium term margin guidance, underpinned by a continued focus on efficiency and further cost savings. Whilst we expect further volatility in emerging markets and deflationary pressures in 2015, we are confident that we will deliver further top and bottom line growth in the year ahead."
FINANCIAL SUMMARY Key financials3
(in mhl or € million unless otherwise stated)
FY14 FY131 Total
growth %
Organic growth
%
Group revenue 21,191 21,174 0.1 3.3
Group revenue/ hl (in €) 91 92 -0.9 1.4
Group operating profit (beia) 3,359 3,192 5.2 7.8
Group operating profit (beia) margin 15.9% 15.1% +80bps
Consolidated revenue 19,257 19,203 0.3 3.0
Consolidated operating profit (beia) 3,129 2,941 6.4 8.7
Consolidated operating profit (beia) margin 16.2% 15.3% +90bps
Net profit (beia) 1,758 1,585 11 14
Net profit 1,516 1,364 11
Diluted EPS (beia) (in €) 3.05 2.75 11
Free operating cash flow 1,574 1,518 3.7
Net debt/ EBITDA (beia) 2
2.5x 2.6x
1 As disclosed with the H1 results on 20 August 2014 Group Revenue in 2013 was restated to correctly reflect HEINEKEN share of JV and associates predominantly in AME
2 Includes acquisitions and excludes disposals on a 12 month proforma basis
3 Refer to Definitions and Glossary sections for an explanation of non IFRS measures and other terms used throughout this report
P.O. Box 28 – 1000 AA Amsterdam – The Netherlands
Office address - Tweede Weteringplantsoen 21 – 1017 ZD Amsterdam
Heineken N.V. - Registered Office at Amsterdam – Trade Register Amsterdam No. 33011433
Page 2 of 49
MEDIA RELEASE
OUTLOOK 2015
(Based on consolidated reporting)
In 2015 HEINEKEN expects a continued challenging external environment, however, delivering
on its strategic priorities is expected to drive further organic revenue and profit growth.
Continued revenue growth: HEINEKEN expects positive organic revenue growth in 2015 with
volume growth at a more moderate level than 2014, and weighted towards H2 (tougher
comparatives in H1). Continued volume growth in developing markets will offset more subdued
volume growth elsewhere. Revenue per hectolitre is expected to increase driven by revenue
management. Pricing will be limited by deflationary and off premise pressure in some markets.
Increased commercial investment: HEINEKEN will continue its targeted higher commercial
investments across the regions, and expects a slight increase in marketing and selling (beia)
spend as a percentage of revenue in 2015 (2014: 12.7%).
Continued cost savings: HEINEKEN is committed to delivering further cost savings and will
continue its focus on driving cost efficiencies across the company. These are an important
driver of the medium term margin guidance. As a result of ongoing productivity initiatives,
HEINEKEN expects an organic decline in the total number of employees in 2015.
Input cost prices are expected to be slightly lower in 2015 (excluding a foreign currency
transactional effect).
Further margin expansion: HEINEKEN continues to target a year on year improvement in
consolidated operating profit (beia) margin of around 40bps in the medium term. This will
continue to be supported by tight cost management, effective revenue management and the
anticipated faster growth of higher margin developing markets. In 2015 consolidated operating
profit (beia) margin will be adversely impacted by approximately 25bps from the disposal of
EMPAQUE, the Mexican packaging business, announced on 1 September 2014 and expected to
complete in Q1. HEINEKEN expects to partially but not fully offset this, such that in 2015
consolidated operating profit (beia) margin expansion will be somewhat below the 40bps
medium term level.
Foreign currency movements: Assuming spot rates as of 6 February 2015, the calculated
positive currency translational impact on consolidated operating profit (beia) would be
approximately €130 million, and €80 million at net profit (beia). However the foreign exchange
markets are very volatile.
Improved financial flexibility: HEINEKEN remains focused on cash flow generation and
disciplined working capital management, with a commitment to a long-term target net debt/
EBITDA (beia) ratio of below 2.5x. In 2015, capital expenditure related to property, plant and
equipment is expected to be approximately €1.6 billion (2014: €1.5 billion). A cash conversion
ratio of below 100% is expected in 2015 (2014: 79%).
Interest rate: HEINEKEN forecasts a stable average interest rate of c.3.7% in 2015 (2014: 3.7%)
Effective tax rate: HEINEKEN expects the effective tax rate (beia) for 2015 to be broadly in line
with the prior year (2014: 29.7%).
P.O. Box 28 – 1000 AA Amsterdam – The Netherlands
Office address - Tweede Weteringplantsoen 21 – 1017 ZD Amsterdam
Heineken N.V. - Registered Office at Amsterdam – Trade Register Amsterdam No. 33011433
Page 3 of 49
MEDIA RELEASE
GROUP OPERATIONAL REVIEW
Despite an increasingly volatile global macroeconomic backdrop HEINEKEN delivered healthy
organic revenue and operating profit growth in 2014. As expected growth was more moderate
in H2, with group revenue and group operating profit (beia) on an organic basis, up 2.1% and
3.6% respectively. The deliberate strategy of higher commercial investments to enhance brand
equity and drive effective execution in the marketplace delivered further market share gains
across key markets. Innovation was an important competitive advantage. HEINEKEN continues
to invest early in key developing growth markets, and added capacity in several countries
including Ethiopia, Cambodia, China, Vietnam and Indonesia. A continued focus on revenue
management and disciplined cost management delivered improved revenue per hectolitre as
well as operating margin expansion.
Notably at the recent Cannes Lions International Festival of Creativity the Company won the
prestigious ‘Marketer of the Year’ award for 2015. This is a tribute to HEINEKEN's strong
momentum in brand management, innovation and creativity.
Organically group revenue grew 3.3%, benefiting from both positive pricing and positive sales
mix, driving a 1.4% increase in group revenue per hectolitre. Organically, group beer volume
was 2.0% higher for the full year, stronger in H1 due to favourable weather and the football
World Cup and a soft comparable prior period. Most regions in H2 saw softer group volume
growth due to unseasonably wet weather particularly in Europe combined with tough Q3
comparatives. However, in Asia Pacific volume growth was higher in H2, recovering from
pressure in H1 from higher excise duties.
Group operating profit (beia) grew 7.8% on an organic basis, benefiting from higher revenues
and improved cost efficiencies partly offset by higher marketing and selling expenses. Group
operating profit (beia) in developing markets grew 10% organically, reflecting strong profit
contributions from Mexico, Nigeria, Brazil and Vietnam, partly offset by lower profitability in
Poland and Compañía Cervecerías Unidas S.A. (CCU). Group operating profit (beia) margins
expanded by 80 basis points to 15.9%.
Heineken® (in mhl or %)
4Q14 Organic growth
%
FY14 Organic growth
%
Heineken® in premium segment 7.5 4.4 29.5 5.1
Africa Middle East 1.1 7.1 3.8 7.8 Americas 2.3 3.4 8.9 4.0
Asia Pacific 1.7 3.8 6.3 1.5 Central & Eastern Europe 0.6 6.5 2.5 5.5
Western Europe 1.8 3.8 8.0 7.8
Heineken® volume in the premium segment grew by 5.1% in 2014 and by 4.4% when excluding
the January 2013 excise related destocking effect in France. The brand saw positive growth
P.O. Box 28 – 1000 AA Amsterdam – The Netherlands
Office address - Tweede Weteringplantsoen 21 – 1017 ZD Amsterdam
Heineken N.V. - Registered Office at Amsterdam – Trade Register Amsterdam No. 33011433
Page 4 of 49
MEDIA RELEASE
across all regions, with particularly strong double digit growth in Brazil, China, France, the UK
and Mexico. The brand was also strong in Spain, Taiwan, Thailand, Russia, Singapore and
Germany, with positive growth more than offsetting weaker brand volumes in Vietnam and
Greece. Encouragingly in the U.S. Heineken® regular delivered positive volume growth in Q4, in
addition to seeing improved Heineken® Light trends in this market. ‘The City’ campaign
launched in May positively enhanced brand equity, combined with continued brand activation
through innovation and social media.
Volume of the global brands Desperados, Affligem and Sol Premium delivered double digit
growth in the year, reflecting the successful focus of the broader premium portfolio strategy.
Desperados, the high margin tequila-flavoured beer, saw volumes up 19%, with particularly
strong growth in the UK, France, Poland and Brazil. The brand is now available in 85 markets.
Affligem, the Belgian abbey beer brand, delivered volumes up 16%, with strong growth in
Western Europe, particularly in France. Affligem is currently available in 31 markets with further
roll outs planned in 2015. The UK, Brazil, New Zealand and CCU markets were key drivers of Sol
Premium volume growth, which was up firmly double digits.
Cider volumes were broadly stable for the full year with gains across several focus markets
offset by lower volume in South Africa. During the year HEINEKEN expanded its cider brand
portfolio, with the addition of Strongbow and Bulmers flavour extensions and the introduction
of Old Mout and Blind Pig in the UK and Cidrerie Stassen in Belgium. In the USA, the launch of
Strongbow Gold Apple and Honey & Apple hard ciders contributed to strong cider growth
momentum in the country.
HEINEKEN’s focus on innovation delivered €1.5 billion revenue and the innovation rate
increased to 7.7%, considerably ahead of the 5.9% rate in 2013 and above the 2020 6% target.
The company’s worldwide scale supported the roll out of global and local brand innovations
across multiple markets, with offerings addressing the important theme of moderation and also
improving the quality of the draught offer. ‘Radler’ beers which are now present in 41 markets
(31 in 2013) across all 5 regions continue to be an innovation highlight, with the launches of
the 2% and 0.0% variants as well as new flavours all driving positive growth. THE SUB®, the
draught beer appliance to capture share in the growing at home draught beer market, was
launched in 4 markets and is already showing positive signs.
With an exciting pipeline for the coming year, we are confident on continuing the strong
innovation momentum, and firmly view innovation as a key competitive advantage.
HEINEKEN announced with H1 results that the TCM 2 cost savings program had completed ahead of
schedule and delivered above the original target (€637 million compared to target €625 million). The
company continues to realise further ongoing productivity improvements across the global supply
chain function, as well as focusing on rightsizing and restructuring initiatives to optimise the cost
structure.
Global Business Services continues to leverage global scale and deliver cost savings. HEINEKEN Global
Procurement (HGP) is delivering considerable cost benefits through the central negotiation and
P.O. Box 28 – 1000 AA Amsterdam – The Netherlands
Office address - Tweede Weteringplantsoen 21 – 1017 ZD Amsterdam
Heineken N.V. - Registered Office at Amsterdam – Trade Register Amsterdam No. 33011433
Page 5 of 49
MEDIA RELEASE
purchasing of both product and non-product related spend areas. Similarly, the transition of the
transactional finance activity to HEINEKEN Global Shared Services (HGSS) supports primarily cost
efficiencies. At the end of 2014, 22 European operating companies had successfully completed the
transition to HGSS. HEINEKEN is currently expanding the scope of activities carried out by HGSS,
primarily related to order to cash and standard reporting activities. All operating companies in Europe
will have transitioned these further activities to HGSS by the end of 2015.
At the end of 2014 upfront cumulative GBS costs incurred were €203 million, in line with budget, of
which €160 million was recognised as an operating expense and €43 million capitalised.
CHANGE IN POLICY AND PROPOSED 2014 DIVIDEND
Following the strong results of 2014 and to reflect confidence in future strong and sustainable
cash flow generation HEINEKEN has decided to widen the pay-out ratio for its annual dividend
from 30%-35% to 30%-40% of Net profit (beia). For 2014 a payment of a total cash dividend of
€1.10 per share of €1.60 nominal value for 2014 (total dividend 2013: €0.89) will be proposed
at the forthcoming AGM. If approved, a final dividend of €0.74 per share will be paid on 6 May
2015, as an interim dividend of €0.36 per share was paid on 2 September 2014. The payment
will be subject to a 15% Dutch withholding tax. The ex-final dividend date for Heineken N.V.
shares will be 27 April 2015.
DEFINITIONS
Organic growth excludes the effect of foreign currency translational effects, consolidation changes,
accounting policy changes, exceptional items and amortisation of acquisition-related intangibles.
Beia refers to financials before exceptional items and amortisation of acquisition-related intangibles.
Group figures include HEINEKEN’s attributable share of joint ventures and associates. The license fee
for the Heineken® brand has been increased since 1 January 2014. To facilitate a meaningful financial
and margin comparison compared to last year, the regional impact is reported as a consolidation
change in 2014.
ENQUIRIES
Media Investors
John Clarke Sonya Ghobrial
Head of External Communication Director of Investor Relations
Christine van Waveren Aarti Narain / Gabriela Malczynska
Financial Communications Manager Investor Relations Manager/Analyst
E-mail: [email protected] E-mail: [email protected]
Tel: +31-20-5239355 Tel: +31-20-5239590
P.O. Box 28 – 1000 AA Amsterdam – The Netherlands
Office address - Tweede Weteringplantsoen 21 – 1017 ZD Amsterdam
Heineken N.V. - Registered Office at Amsterdam – Trade Register Amsterdam No. 33011433
Page 6 of 49
MEDIA RELEASE
HEINEKEN INVESTOR CALENDAR
Trading update for Q1 2015 22 April 2015
Annual General Meeting (AGM) 23 April 2015
Half Year 2015 Results 3 August 2015
Trading update for Q3 2015 28 October 2015
Conference call details
HEINEKEN will host an analyst and investor conference call in relation to its full year 2014
results today at 10:00 CET/ 9:00 GMT. The call will be audio cast live via the Company’s
website: www.theheinekencompany.com/investors/webcasts. An audio replay service will also
be made available after the conference call at the above web address.
Analysts and investors can dial in using the following telephone numbers:
Netherlands United Kingdom
Local line: +31(0)20 716 8257 Local line: +44(0)20 3427 1914
National free phone: 0800 020 2577 National free phone: 0800 279 4841
United States
Local line: +1646 254 3362
National free phone: 1877 280 2342
Participation/ confirmation code for all countries: 1910072
Editorial information:
HEINEKEN is the world’s most international brewer. It is the leading developer and marketer of premium beer and cider
brands. Led by the Heineken® brand, the Group has a powerful portfolio of more than 250 international, regional, local
and specialty beers and ciders. We are committed to innovation, long-term brand investment, disciplined sales
execution and focused cost management. Through “Brewing a Better World”, sustainability is embedded in the business
and delivers value for all stakeholders. HEINEKEN has a well-balanced geographic footprint with leadership positions in
both developed and developing markets. We employ 81,000 people and operate more than 160 breweries in 70
countries. Heineken N.V. and Heineken Holding N.V. shares trade on the NYSE Euronext in Amsterdam. HEINEKEN has
two sponsored level 1 American Depositary Receipt (ADR) programmes: Heineken N.V. (OTCQX: HEINY) and Heineken
Holding N.V. (OTCQX: HKHHY). Most recent information is available on HEINEKEN's website:
www.theHEINEKENcompany.com and follow us via @HEINEKENCorp.
Disclaimer:
This press release contains forward-looking statements with regard to the financial position and results of HEINEKEN’s
activities. These forward-looking statements are subject to risks and uncertainties that could cause actual results to
differ materially from those expressed in the forward-looking statements. Many of these risks and uncertainties relate
to factors that are beyond HEINEKEN’s ability to control or estimate precisely, such as future market and economic
conditions, the behaviour of other market participants, changes in consumer preferences, the ability to successfully
integrate acquired businesses and achieve anticipated synergies, costs of raw materials, interest-rate and exchange-
rate fluctuations, changes in tax rates, changes in law, pension costs, the actions of government regulators and weather
conditions. These and other risk factors are detailed in HEINEKEN’s publicly filed annual reports. You are cautioned not
to place undue reliance on these forward-looking statements, which are only relevant as of the date of this press
release. HEINEKEN does not undertake any obligation to release publicly any revisions to these forward-looking
statements to reflect events or circumstances after the date of these statements. Market share estimates contained in
this press release are based on outside sources, such as specialised research institutes, in combination with
management estimates.
P.O. Box 28 – 1000 AA Amsterdam – The Netherlands
Office address - Tweede Weteringplantsoen 21 – 1017 ZD Amsterdam
Heineken N.V. - Registered Office at Amsterdam – Trade Register Amsterdam No. 33011433
Page 7 of 49
MEDIA RELEASE
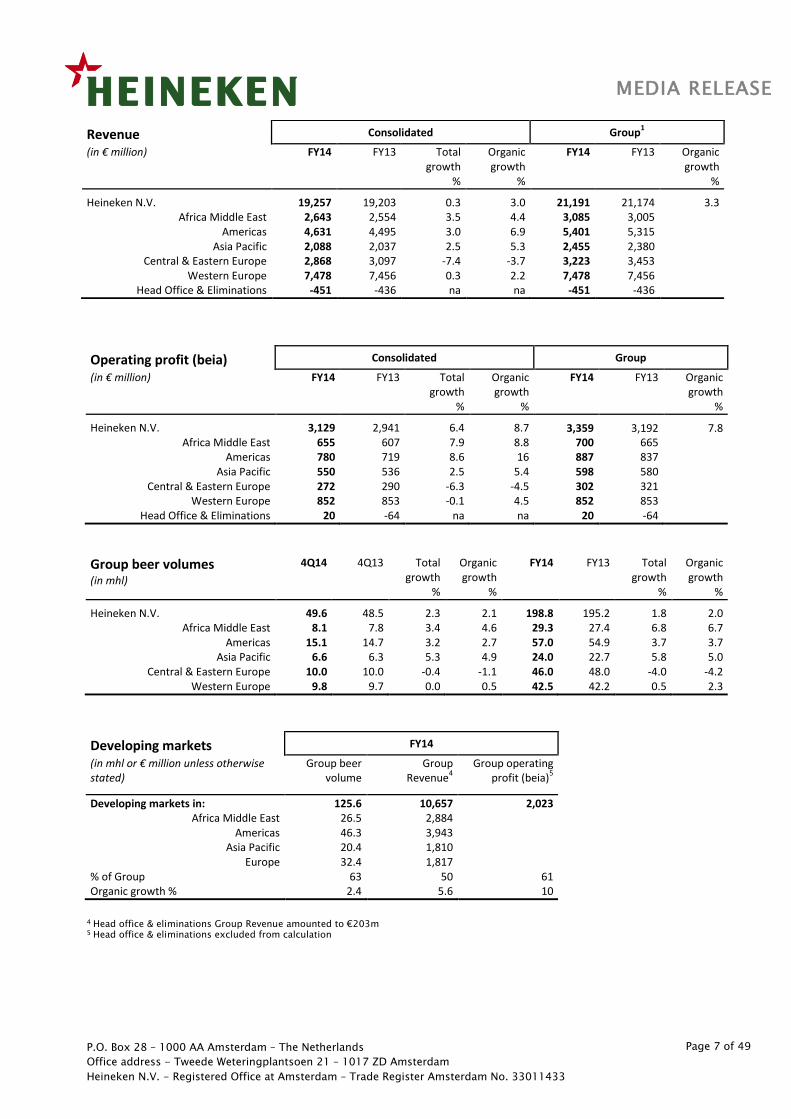
Operating profit (beia) Consolidated Group
(in € million) FY14 FY13 Total growth
%
Organic growth
%
FY14 FY13 Organic growth
%
Heineken N.V. 3,129 2,941 6.4 8.7 3,359 3,192 7.8 Africa Middle East 655 607 7.9 8.8 700 665
Americas 780 719 8.6 16 887 837 Asia Pacific 550 536 2.5 5.4 598 580
Central & Eastern Europe 272 290 -6.3 -4.5 302 321 Western Europe 852 853 -0.1 4.5 852 853
Head Office & Eliminations 20 -64 na na 20 -64
Group beer volumes (in mhl)
4Q14 4Q13 Total growth
%
Organic growth
%
FY14 FY13 Total growth
%
Organic growth
%
Heineken N.V. 49.6 48.5 2.3 2.1 198.8 195.2 1.8 2.0 Africa Middle East 8.1 7.8 3.4 4.6 29.3 27.4 6.8 6.7
Americas 15.1 14.7 3.2 2.7 57.0 54.9 3.7 3.7 Asia Pacific 6.6 6.3 5.3 4.9 24.0 22.7 5.8 5.0
Central & Eastern Europe 10.0 10.0 -0.4 -1.1 46.0 48.0 -4.0 -4.2 Western Europe 9.8 9.7 0.0 0.5 42.5 42.2 0.5 2.3
Developing markets FY14
(in mhl or € million unless otherwise stated)
Group beer volume
Group Revenue
4
Group operating profit (beia)
5
Developing markets in: 125.6 10,657 2,023 Africa Middle East 26.5 2,884
Americas 46.3 3,943 Asia Pacific 20.4 1,810
Europe 32.4 1,817 % of Group 63 50 61 Organic growth % 2.4 5.6 10
4 Head office & eliminations Group Revenue amounted to €203m 5 Head office & eliminations excluded from calculation
Revenue Consolidated Group1
(in € million) FY14 FY13 Total growth
%
Organic growth
%
FY14 FY13 Organic growth
%
Heineken N.V. 19,257 19,203 0.3 3.0 21,191 21,174 3.3 Africa Middle East 2,643 2,554 3.5 4.4 3,085 3,005
Americas 4,631 4,495 3.0 6.9 5,401 5,315 Asia Pacific 2,088 2,037 2.5 5.3 2,455 2,380
Central & Eastern Europe 2,868 3,097 -7.4 -3.7 3,223 3,453 Western Europe 7,478 7,456 0.3 2.2 7,478 7,456
Head Office & Eliminations -451 -436 na na -451 -436
P.O. Box 28 – 1000 AA Amsterdam – The Netherlands
Office address - Tweede Weteringplantsoen 21 – 1017 ZD Amsterdam
Heineken N.V. - Registered Office at Amsterdam – Trade Register Amsterdam No. 33011433
Page 8 of 49
MEDIA RELEASE
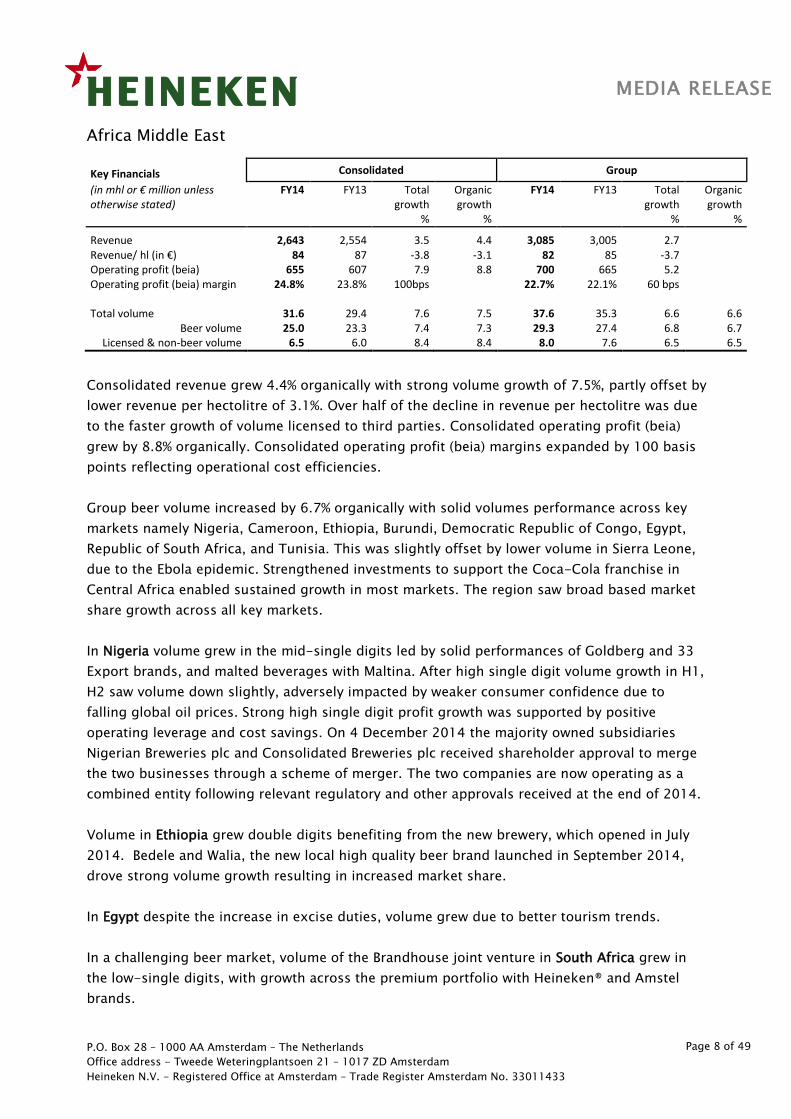
Africa Middle East
Key Financials Consolidated Group
(in mhl or € million unless otherwise stated)
FY14 FY13 Total growth
%
Organic growth
%
FY14 FY13 Total growth
%
Organic growth
%
Revenue 2,643 2,554 3.5 4.4 3,085 3,005 2.7 Revenue/ hl (in €) 84 87 -3.8 -3.1 82 85 -3.7 Operating profit (beia) 655 607 7.9 8.8 700 665 5.2 Operating profit (beia) margin 24.8% 23.8% 100bps 22.7% 22.1% 60 bps Total volume 31.6 29.4 7.6 7.5 37.6 35.3 6.6 6.6
Beer volume 25.0 23.3 7.4 7.3 29.3 27.4 6.8 6.7 Licensed & non-beer volume 6.5 6.0 8.4 8.4 8.0 7.6 6.5 6.5
Consolidated revenue grew 4.4% organically with strong volume growth of 7.5%, partly offset by
lower revenue per hectolitre of 3.1%. Over half of the decline in revenue per hectolitre was due
to the faster growth of volume licensed to third parties. Consolidated operating profit (beia)
grew by 8.8% organically. Consolidated operating profit (beia) margins expanded by 100 basis
points reflecting operational cost efficiencies.
Group beer volume increased by 6.7% organically with solid volumes performance across key
markets namely Nigeria, Cameroon, Ethiopia, Burundi, Democratic Republic of Congo, Egypt,
Republic of South Africa, and Tunisia. This was slightly offset by lower volume in Sierra Leone,
due to the Ebola epidemic. Strengthened investments to support the Coca-Cola franchise in
Central Africa enabled sustained growth in most markets. The region saw broad based market
share growth across all key markets.
In Nigeria volume grew in the mid-single digits led by solid performances of Goldberg and 33
Export brands, and malted beverages with Maltina. After high single digit volume growth in H1,
H2 saw volume down slightly, adversely impacted by weaker consumer confidence due to
falling global oil prices. Strong high single digit profit growth was supported by positive
operating leverage and cost savings. On 4 December 2014 the majority owned subsidiaries
Nigerian Breweries plc and Consolidated Breweries plc received shareholder approval to merge
the two businesses through a scheme of merger. The two companies are now operating as a
combined entity following relevant regulatory and other approvals received at the end of 2014.
Volume in Ethiopia grew double digits benefiting from the new brewery, which opened in July
2014. Bedele and Walia, the new local high quality beer brand launched in September 2014,
drove strong volume growth resulting in increased market share.
In Egypt despite the increase in excise duties, volume grew due to better tourism trends.
In a challenging beer market, volume of the Brandhouse joint venture in South Africa grew in
the low-single digits, with growth across the premium portfolio with Heineken® and Amstel
brands.
P.O. Box 28 – 1000 AA Amsterdam – The Netherlands
Office address - Tweede Weteringplantsoen 21 – 1017 ZD Amsterdam
Heineken N.V. - Registered Office at Amsterdam – Trade Register Amsterdam No. 33011433
Page 9 of 49
MEDIA RELEASE
Americas
Key Financials Consolidated Group
(in mhl or € million unless otherwise stated)
FY14 FY13 Total growth
%
Organic growth
%
FY14 FY13 Total growth
%
Organic growth
%
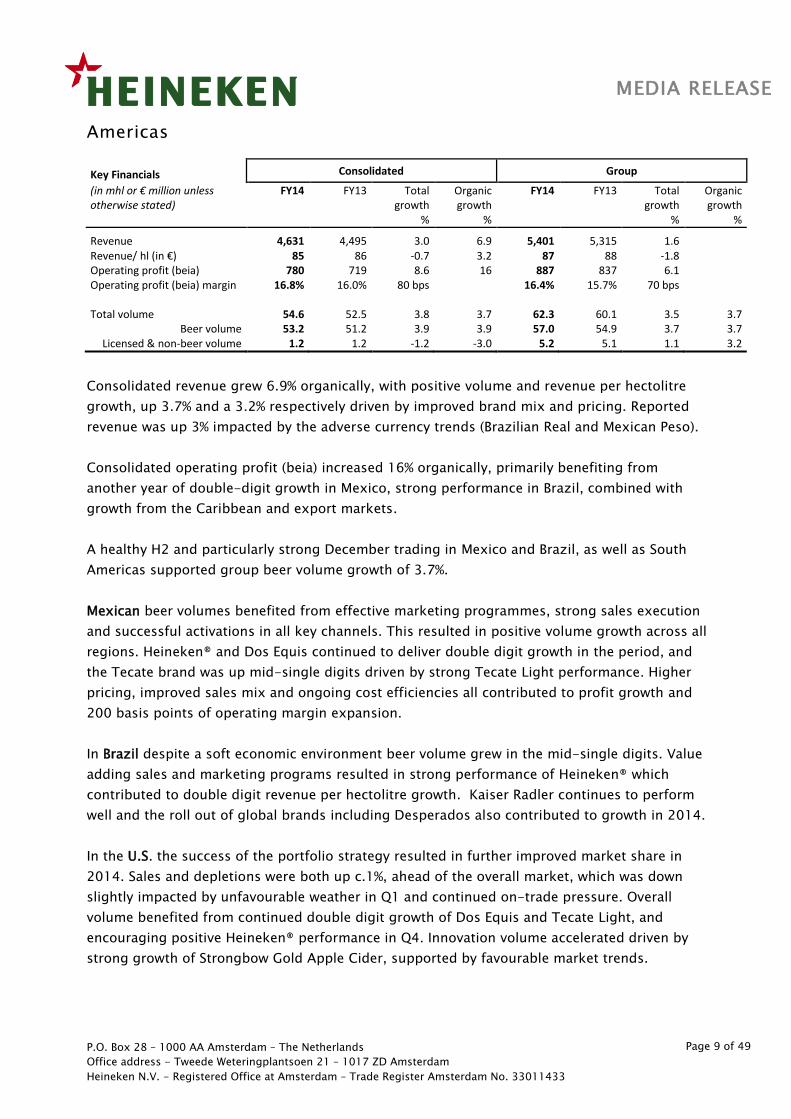
Revenue 4,631 4,495 3.0 6.9 5,401 5,315 1.6 Revenue/ hl (in €) 85 86 -0.7 3.2 87 88 -1.8 Operating profit (beia) 780 719 8.6 16 887 837 6.1 Operating profit (beia) margin 16.8% 16.0% 80 bps 16.4% 15.7% 70 bps Total volume 54.6 52.5 3.8 3.7 62.3 60.1 3.5 3.7
Beer volume 53.2 51.2 3.9 3.9 57.0 54.9 3.7 3.7 Licensed & non-beer volume 1.2 1.2 -1.2 -3.0 5.2 5.1 1.1 3.2
Consolidated revenue grew 6.9% organically, with positive volume and revenue per hectolitre
growth, up 3.7% and a 3.2% respectively driven by improved brand mix and pricing. Reported
revenue was up 3% impacted by the adverse currency trends (Brazilian Real and Mexican Peso).
Consolidated operating profit (beia) increased 16% organically, primarily benefiting from
another year of double-digit growth in Mexico, strong performance in Brazil, combined with
growth from the Caribbean and export markets.
A healthy H2 and particularly strong December trading in Mexico and Brazil, as well as South
Americas supported group beer volume growth of 3.7%.
Mexican beer volumes benefited from effective marketing programmes, strong sales execution
and successful activations in all key channels. This resulted in positive volume growth across all
regions. Heineken® and Dos Equis continued to deliver double digit growth in the period, and
the Tecate brand was up mid-single digits driven by strong Tecate Light performance. Higher
pricing, improved sales mix and ongoing cost efficiencies all contributed to profit growth and
200 basis points of operating margin expansion.
In Brazil despite a soft economic environment beer volume grew in the mid-single digits. Value
adding sales and marketing programs resulted in strong performance of Heineken® which
contributed to double digit revenue per hectolitre growth. Kaiser Radler continues to perform
well and the roll out of global brands including Desperados also contributed to growth in 2014.
In the U.S. the success of the portfolio strategy resulted in further improved market share in
2014. Sales and depletions were both up c.1%, ahead of the overall market, which was down
slightly impacted by unfavourable weather in Q1 and continued on-trade pressure. Overall
volume benefited from continued double digit growth of Dos Equis and Tecate Light, and
encouraging positive Heineken® performance in Q4. Innovation volume accelerated driven by
strong growth of Strongbow Gold Apple Cider, supported by favourable market trends.
P.O. Box 28 – 1000 AA Amsterdam – The Netherlands
Office address - Tweede Weteringplantsoen 21 – 1017 ZD Amsterdam
Heineken N.V. - Registered Office at Amsterdam – Trade Register Amsterdam No. 33011433
Page 10 of 49
MEDIA RELEASE
Asia Pacific
Key Financials Consolidated Group
(in mhl or € million unless otherwise stated)
FY14 FY13 Total growth
%
Organic growth
%
FY14 FY13 Total growth
%
Organic growth
%
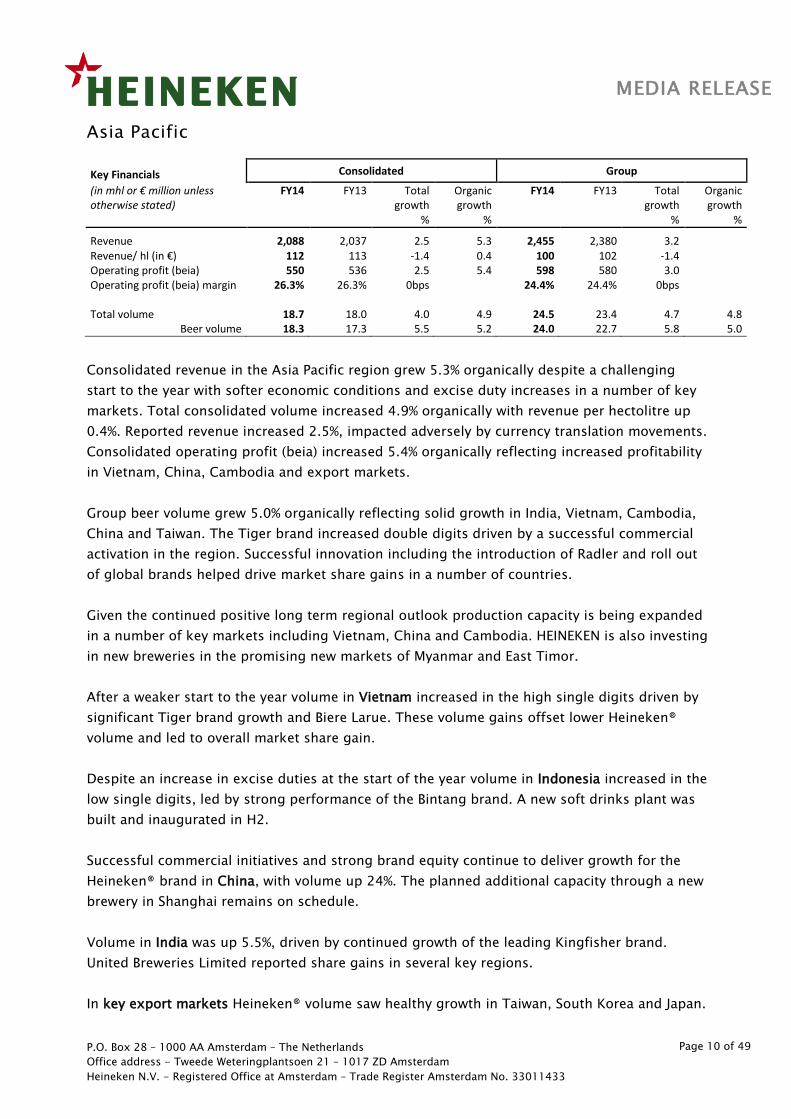
Revenue 2,088 2,037 2.5 5.3 2,455 2,380 3.2
Revenue/ hl (in €) 112 113 -1.4 0.4 100 102 -1.4 Operating profit (beia) 550 536 2.5 5.4 598 580 3.0 Operating profit (beia) margin 26.3% 26.3% 0bps 24.4% 24.4% 0bps Total volume 18.7 18.0 4.0 4.9 24.5 23.4 4.7 4.8
Beer volume 18.3 17.3 5.5 5.2 24.0 22.7 5.8 5.0
Consolidated revenue in the Asia Pacific region grew 5.3% organically despite a challenging
start to the year with softer economic conditions and excise duty increases in a number of key
markets. Total consolidated volume increased 4.9% organically with revenue per hectolitre up
0.4%. Reported revenue increased 2.5%, impacted adversely by currency translation movements.
Consolidated operating profit (beia) increased 5.4% organically reflecting increased profitability
in Vietnam, China, Cambodia and export markets.
Group beer volume grew 5.0% organically reflecting solid growth in India, Vietnam, Cambodia,
China and Taiwan. The Tiger brand increased double digits driven by a successful commercial
activation in the region. Successful innovation including the introduction of Radler and roll out
of global brands helped drive market share gains in a number of countries.
Given the continued positive long term regional outlook production capacity is being expanded
in a number of key markets including Vietnam, China and Cambodia. HEINEKEN is also investing
in new breweries in the promising new markets of Myanmar and East Timor.
After a weaker start to the year volume in Vietnam increased in the high single digits driven by
significant Tiger brand growth and Biere Larue. These volume gains offset lower Heineken®
volume and led to overall market share gain.
Despite an increase in excise duties at the start of the year volume in Indonesia increased in the
low single digits, led by strong performance of the Bintang brand. A new soft drinks plant was
built and inaugurated in H2.
Successful commercial initiatives and strong brand equity continue to deliver growth for the
Heineken® brand in China, with volume up 24%. The planned additional capacity through a new
brewery in Shanghai remains on schedule.
Volume in India was up 5.5%, driven by continued growth of the leading Kingfisher brand.
United Breweries Limited reported share gains in several key regions.
In key export markets Heineken® volume saw healthy growth in Taiwan, South Korea and Japan.
P.O. Box 28 – 1000 AA Amsterdam – The Netherlands
Office address - Tweede Weteringplantsoen 21 – 1017 ZD Amsterdam
Heineken N.V. - Registered Office at Amsterdam – Trade Register Amsterdam No. 33011433
Page 11 of 49
MEDIA RELEASE
Central & Eastern Europe
Key Financials Consolidated Group
(in mhl or € million unless otherwise stated)
FY14 FY13 Total growth
%
Organic growth
%
FY14 FY13 Total growth
%
Organic growth
%
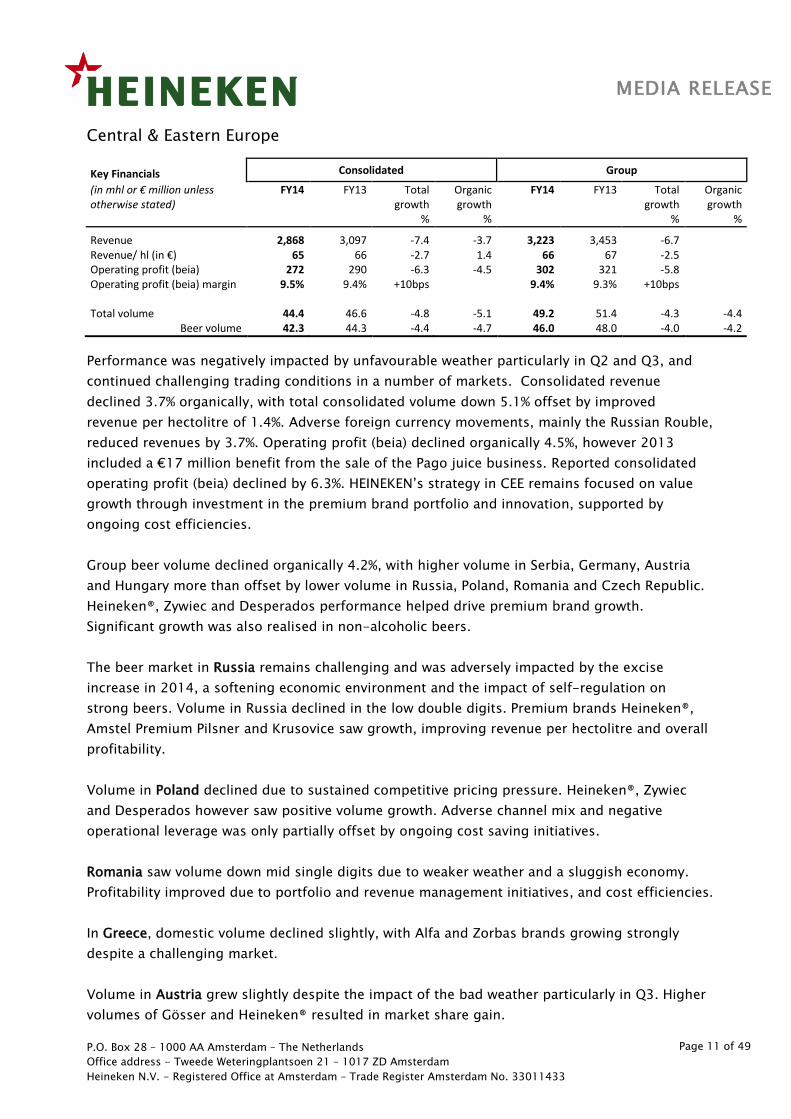
Revenue 2,868 3,097 -7.4 -3.7 3,223 3,453 -6.7 Revenue/ hl (in €) 65 66 -2.7 1.4 66 67 -2.5 Operating profit (beia) 272 290 -6.3 -4.5 302 321 -5.8 Operating profit (beia) margin 9.5% 9.4% +10bps 9.4% 9.3% +10bps Total volume 44.4 46.6 -4.8 -5.1 49.2 51.4 -4.3 -4.4
Beer volume 42.3 44.3 -4.4 -4.7 46.0 48.0 -4.0 -4.2
Performance was negatively impacted by unfavourable weather particularly in Q2 and Q3, and
continued challenging trading conditions in a number of markets. Consolidated revenue
declined 3.7% organically, with total consolidated volume down 5.1% offset by improved
revenue per hectolitre of 1.4%. Adverse foreign currency movements, mainly the Russian Rouble,
reduced revenues by 3.7%. Operating profit (beia) declined organically 4.5%, however 2013
included a €17 million benefit from the sale of the Pago juice business. Reported consolidated
operating profit (beia) declined by 6.3%. HEINEKEN’s strategy in CEE remains focused on value
growth through investment in the premium brand portfolio and innovation, supported by
ongoing cost efficiencies.
Group beer volume declined organically 4.2%, with higher volume in Serbia, Germany, Austria
and Hungary more than offset by lower volume in Russia, Poland, Romania and Czech Republic.
Heineken®, Zywiec and Desperados performance helped drive premium brand growth.
Significant growth was also realised in non-alcoholic beers.
The beer market in Russia remains challenging and was adversely impacted by the excise
increase in 2014, a softening economic environment and the impact of self-regulation on
strong beers. Volume in Russia declined in the low double digits. Premium brands Heineken®,
Amstel Premium Pilsner and Krusovice saw growth, improving revenue per hectolitre and overall
profitability.
Volume in Poland declined due to sustained competitive pricing pressure. Heineken®, Zywiec
and Desperados however saw positive volume growth. Adverse channel mix and negative
operational leverage was only partially offset by ongoing cost saving initiatives.
Romania saw volume down mid single digits due to weaker weather and a sluggish economy.
Profitability improved due to portfolio and revenue management initiatives, and cost efficiencies.
In Greece, domestic volume declined slightly, with Alfa and Zorbas brands growing strongly
despite a challenging market.
Volume in Austria grew slightly despite the impact of the bad weather particularly in Q3. Higher
volumes of Gösser and Heineken® resulted in market share gain.
P.O. Box 28 – 1000 AA Amsterdam – The Netherlands
Office address - Tweede Weteringplantsoen 21 – 1017 ZD Amsterdam
Heineken N.V. - Registered Office at Amsterdam – Trade Register Amsterdam No. 33011433
Page 12 of 49
MEDIA RELEASE
Western Europe
Key Financials Consolidated & Group
(in mhl or € million unless otherwise stated)
FY14 FY13 Total growth
%
Organic growth
%
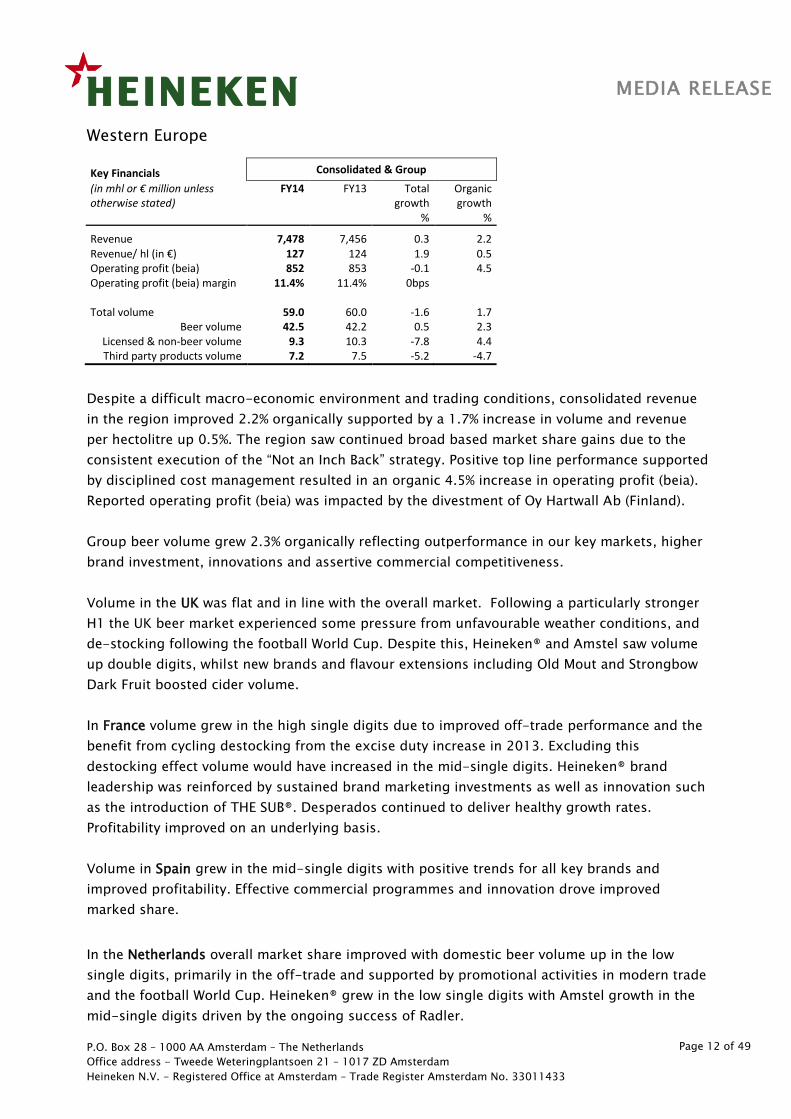
Revenue 7,478 7,456 0.3 2.2 Revenue/ hl (in €) 127 124 1.9 0.5 Operating profit (beia) 852 853 -0.1 4.5 Operating profit (beia) margin 11.4% 11.4% 0bps Total volume 59.0 60.0 -1.6 1.7
Beer volume 42.5 42.2 0.5 2.3 Licensed & non-beer volume 9.3 10.3 -7.8 4.4 Third party products volume 7.2 7.5 -5.2 -4.7
Despite a difficult macro-economic environment and trading conditions, consolidated revenue
in the region improved 2.2% organically supported by a 1.7% increase in volume and revenue
per hectolitre up 0.5%. The region saw continued broad based market share gains due to the
consistent execution of the “Not an Inch Back” strategy. Positive top line performance supported
by disciplined cost management resulted in an organic 4.5% increase in operating profit (beia).
Reported operating profit (beia) was impacted by the divestment of Oy Hartwall Ab (Finland).
Group beer volume grew 2.3% organically reflecting outperformance in our key markets, higher
brand investment, innovations and assertive commercial competitiveness.
Volume in the UK was flat and in line with the overall market. Following a particularly stronger
H1 the UK beer market experienced some pressure from unfavourable weather conditions, and
de-stocking following the football World Cup. Despite this, Heineken® and Amstel saw volume
up double digits, whilst new brands and flavour extensions including Old Mout and Strongbow
Dark Fruit boosted cider volume.
In France volume grew in the high single digits due to improved off-trade performance and the
benefit from cycling destocking from the excise duty increase in 2013. Excluding this
destocking effect volume would have increased in the mid-single digits. Heineken® brand
leadership was reinforced by sustained brand marketing investments as well as innovation such
as the introduction of THE SUB®. Desperados continued to deliver healthy growth rates.
Profitability improved on an underlying basis.
Volume in Spain grew in the mid-single digits with positive trends for all key brands and
improved profitability. Effective commercial programmes and innovation drove improved
marked share.
In the Netherlands overall market share improved with domestic beer volume up in the low
single digits, primarily in the off-trade and supported by promotional activities in modern trade
and the football World Cup. Heineken® grew in the low single digits with Amstel growth in the
mid-single digits driven by the ongoing success of Radler.
P.O. Box 28 – 1000 AA Amsterdam – The Netherlands
Office address - Tweede Weteringplantsoen 21 – 1017 ZD Amsterdam
Heineken N.V. - Registered Office at Amsterdam – Trade Register Amsterdam No. 33011433
Page 13 of 49
MEDIA RELEASE
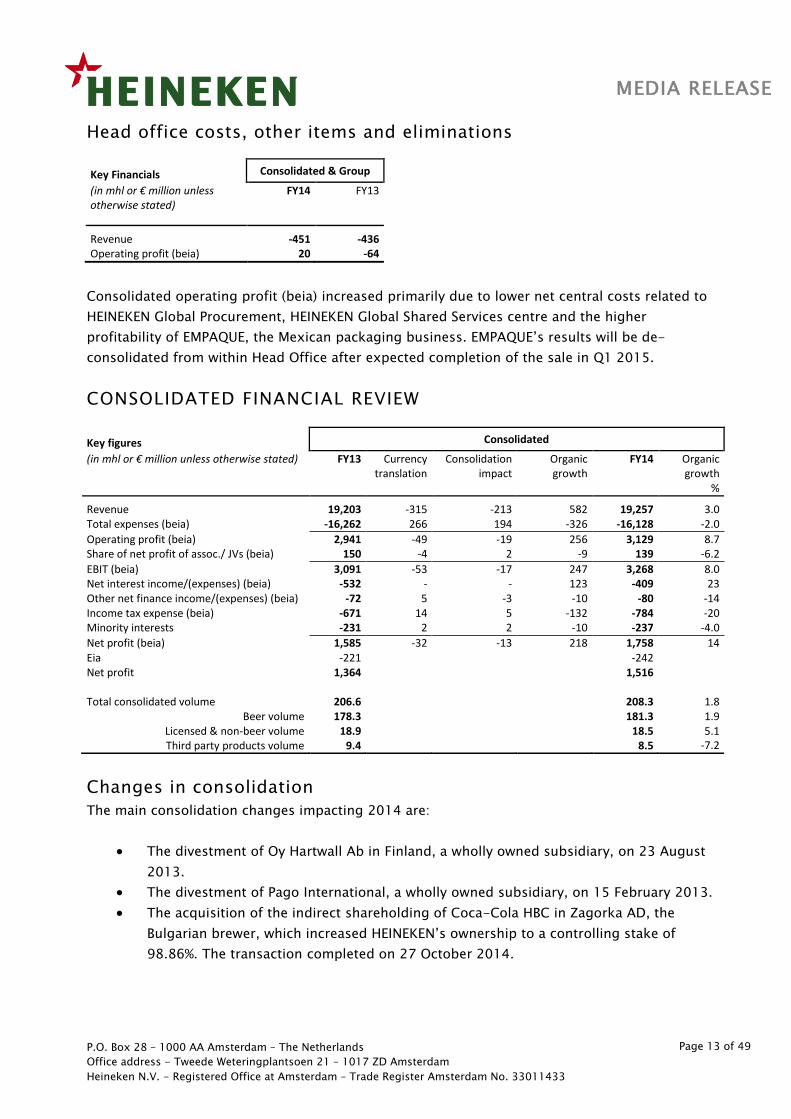
Head office costs, other items and eliminations
Key Financials Consolidated & Group
(in mhl or € million unless otherwise stated)
FY14 FY13
Revenue -451 -436 Operating profit (beia) 20 -64
Consolidated operating profit (beia) increased primarily due to lower net central costs related to
HEINEKEN Global Procurement, HEINEKEN Global Shared Services centre and the higher
profitability of EMPAQUE, the Mexican packaging business. EMPAQUE’s results will be de-
consolidated from within Head Office after expected completion of the sale in Q1 2015.
CONSOLIDATED FINANCIAL REVIEW
Changes in consolidation
The main consolidation changes impacting 2014 are:
The divestment of Oy Hartwall Ab in Finland, a wholly owned subsidiary, on 23 August
2013.
The divestment of Pago International, a wholly owned subsidiary, on 15 February 2013.
The acquisition of the indirect shareholding of Coca-Cola HBC in Zagorka AD, the
Bulgarian brewer, which increased HEINEKEN’s ownership to a controlling stake of
98.86%. The transaction completed on 27 October 2014.
Key figures Consolidated
(in mhl or € million unless otherwise stated) FY13 Currency translation
Consolidation impact
Organic growth
FY14 Organic growth
%
Revenue 19,203 -315 -213 582 19,257 3.0 Total expenses (beia) -16,262 266 194 -326 -16,128 -2.0
Operating profit (beia) 2,941 -49 -19 256 3,129 8.7 Share of net profit of assoc./ JVs (beia) 150 -4 2 -9 139 -6.2
EBIT (beia) 3,091 -53 -17 247 3,268 8.0 Net interest income/(expenses) (beia) -532 - - 123 -409 23 Other net finance income/(expenses) (beia) -72 5 -3 -10 -80 -14 Income tax expense (beia) -671 14 5 -132 -784 -20 Minority interests -231 2 2 -10 -237 -4.0
Net profit (beia) 1,585 -32 -13 218 1,758 14 Eia -221 -242 Net profit 1,364 1,516 Total consolidated volume 206.6 208.3 1.8
Beer volume 178.3 181.3 1.9 Licensed & non-beer volume 18.9 18.5 5.1 Third party products volume 9.4 8.5 -7.2
P.O. Box 28 – 1000 AA Amsterdam – The Netherlands
Office address - Tweede Weteringplantsoen 21 – 1017 ZD Amsterdam
Heineken N.V. - Registered Office at Amsterdam – Trade Register Amsterdam No. 33011433
Page 14 of 49
MEDIA RELEASE
The divestiture of an 80% shareholding of Brasserie Lorraine in Martinique on 10
September 2014. HEINEKEN retains a 20% shareholding in the business.
In 2015 the following events will impact consolidation changes:
The disposal of the Mexican packaging business EMPAQUE announced on 1 September
is pending relevant regulatory approvals and closing formalities, and is expected to
complete in Q1 2015.
On 4 December majority owned subsidiaries Nigerian Breweries Plc and Consolidated Breweries
Plc received shareholder approval to merge their respective businesses through a court
approved scheme of merger. Following the receipt of the relevant court and regulatory
approvals, the merger was completed with effect from 31 December 2014. As the shareholding
in the respective companies was at a similar level this will not have a material impact on the
consolidation changes.
Revenue
Revenue grew 0.3% to €19,257 million, reflecting a 1.1% negative net consolidation impact
(€213 million), mostly attributable to the divestment of Hartwall in Finland in 2013.
Unfavourable foreign currency movements drove a €315 million decrease in revenues (or -1.6%),
largely driven by the depreciation of the Mexican Pesos, Indonesian Rupiah, Russian Rouble,
Papua New Guinean Kina and Brazilian Real. An organic revenue increase of 3% is made up of a
total consolidated volume growth of 1.8% and a 1.2% increase in revenue per hectolitre (net of a
flat country mix effect).
Total expenses (beia)
Total expenses (beia) were €16,128 million, increasing 2% organically. Input costs increased
organically by 1.8% and were 0.2% lower on a per hectolitre basis. Energy and water costs were
stable at organic level. Marketing and selling expenses (beia) increased organically 3.5% to
€2,447 million, representing 12.7% of revenues (2013: 12.6%).
Operating profit (beia)
Operating profit (beia) grew by 6.4% to €3,129 million. Strong organic growth at 8.7% was
partially offset by a negative consolidation impact of €19 million (or -0.6%) and an unfavourable
foreign currency translational effect of €49 million (or -1.7%).
Organic growth was supported by higher revenue and benefitted from continued costs savings
programs.
Share of net profit of associates and joint ventures (beia)
Share of net profit of associates and joint ventures (beia) decreased 7.3% (of which 6.2%
organically) from €150 million to €139 million, mainly reflecting a lower contribution from joint
ventures in South America and South Africa, which were only partially offset by higher profits in
India and in Germany.
P.O. Box 28 – 1000 AA Amsterdam – The Netherlands
Office address - Tweede Weteringplantsoen 21 – 1017 ZD Amsterdam
Heineken N.V. - Registered Office at Amsterdam – Trade Register Amsterdam No. 33011433
Page 15 of 49
MEDIA RELEASE
Net finance expenses (beia)
Net interest expenses (beia) decreased by €123 million, reflecting a lower average effective interest
rate on outstanding debts. The average interest rate in 2014 was 3.7%, compared with 4.4% in 2013.
Other net finance expenses (beia) amounted to €80 million, primarily due to the interest expense on
the net pension liability being presented in other net finance income/(expenses). Other net finance
expenses increased by €8million, with the organic increase partially offset by the impact of
favourable foreign currency transactional movements.
Income tax expense (beia)
The effective tax rate (beia) was 29.7% (2013: 28.7%). Under IFRS, HEINEKEN is required to
provide for withholding taxes that will be incurred upon future dividends received from our
foreign investments. The annual contribution to the provision has structurally increased due to
expected higher dividends payable from certain investments, explaining primarily the increase
of the effective tax rate (beia).
Net profit and net profit (beia)
Net profit increased 11% to €1,516 million. This includes net exceptional items and
amortization costs of €242 million (2013: €221 million).
Net profit (beia) increased €173 million to €1,758 million, up 14% organically. Adverse currency
translational movements and a negative consolidation impact reduced net profit (beia) by €45
million (-2.8%).
Foreign exchange rate movements
Unfavourable foreign currency translational movements decreased operating profit (beia) by €49
million. This was largely due to the depreciation of the Mexican Peso (-4%), the Papua New Guinean
Kina (-11%) and the Indonesian Rupiah (-12%). At the net profit level, translational foreign currency
movements had a negative impact of €32 million.
HEINEKEN delays the impact of the U.S. Dollar fluctuations versus the Euro by hedging the net cash
inflow of U.S. Dollars from exports for up to 18 months in advance.
The average EUR/USD exchange rate inclusive of hedging was 1.31 in 2014, versus 1.31 in 2013. For
the full year 2015, the net dollar inflow is forecasted at US$529 million, of which 90% has been
hedged at EUR/USD 1.34.
For 2016, the net dollar inflow is forecast at approximately US$503 million of which 43% is hedged at
EUR/USD 1.21 as of 6 February 2015.
Capital expenditure and cash flow
Capital expenditure related to property, plant and equipment increased to €1,494 million in
2014 (2013: €1,369 million) representing 7.8% of revenue (2013: 7.1%). This primarily reflected
capacity expansion in several markets, including Vietnam, and a greenfield in Ethiopia as well
as a soft drinks plant in Indonesia.
P.O. Box 28 – 1000 AA Amsterdam – The Netherlands
Office address - Tweede Weteringplantsoen 21 – 1017 ZD Amsterdam
Heineken N.V. - Registered Office at Amsterdam – Trade Register Amsterdam No. 33011433
Page 16 of 49
MEDIA RELEASE
Free operating cash flow increased to €1,574 million (from €1,518 million) primarily due to
higher cash flow from operations and the benefit from working capital only partly offset by
higher capex.
Financial structure
Total gross debt amounts to €11,757 million (from €12,170 million at 31 December 2013). Net debt
increased to €11,076 million (from €10,868 million at 31 December 2013). Free operating cash flow
exceeded dividends paid and outflow from acquisitions, but net debt expressed in Euros increased
due to the strong appreciation of the U.S. dollar in the second half of 2014 as 29% of net debt is U.S.
dollar-related.
Despite the impact of the strong appreciation of the U.S. dollar a net debt/EBITDA (beia) of 2.5x was
achieved at the end of 2014 (2013: 2.6x). The anticipated proceeds of the EMPAQUE divestment will
provide further flexibility.
Average number of shares
In the calculation of basic EPS, the weighted average number of shares outstanding in 2014 was
574,945,645. In the calculation of diluted EPS, shares held in treasury related to the employee
incentive programme are added to the weighted average shares outstanding. The weighted average
diluted number of shares outstanding in 2014 was 576,002,613 (equal to 2013).
MEDIA RELEASE
P.O. Box 28 – 1000 AA Amsterdam – The Netherlands
Office address - Tweede Weteringplantsoen 21 – 1017 ZD Amsterdam
Heineken N.V. - Registered Office at Amsterdam – Trade Register Amsterdam No. 33011433
Page 17 of 49
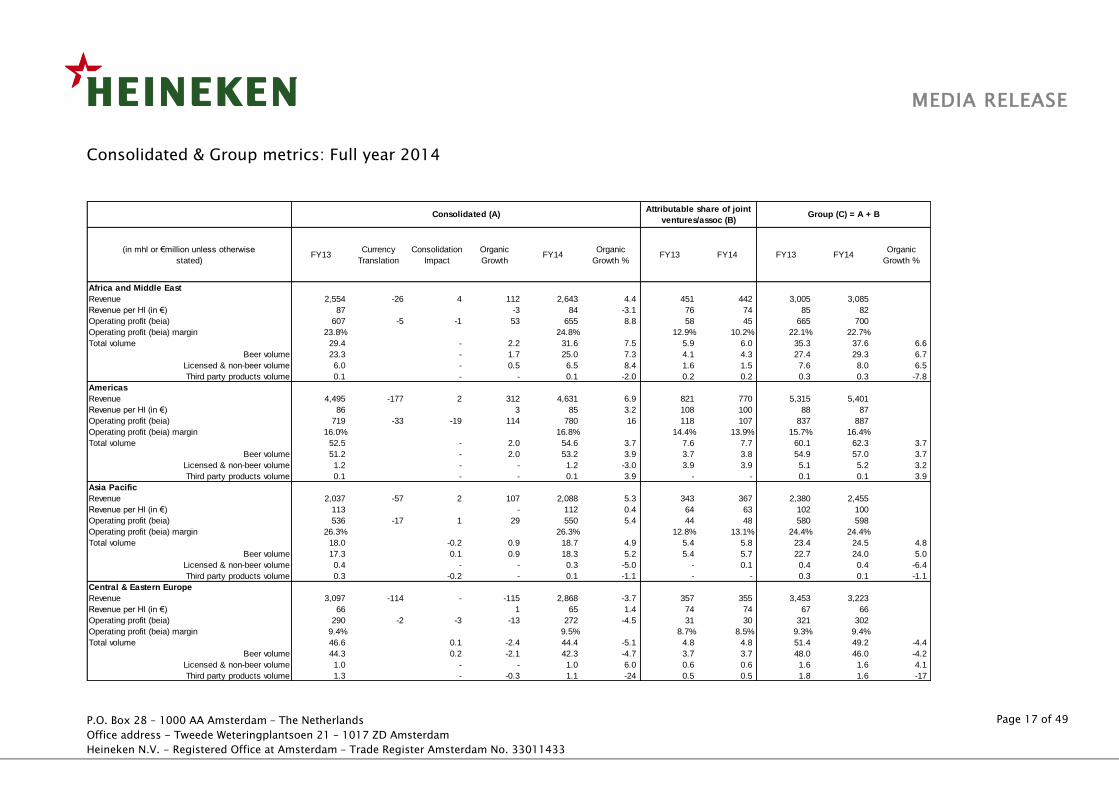
Consolidated & Group metrics: Full year 2014
(in mhl or €million unless otherwise
stated)FY13
Currency
Translation
Consolidation
Impact
Organic
GrowthFY14
Organic
Growth %FY13 FY14 FY13 FY14
Organic
Growth %
Africa and Middle East
Revenue 2,554 -26 4 112 2,643 4.4 451 442 3,005 3,085 4.7
Revenue per Hl (in €) 87 -3 84 -3.1 76 74 85 82 -1.9
Operating profit (beia) 607 -5 -1 53 655 8.8 58 45 665 700 5.9
Operating profit (beia) margin 23.8% 24.8% 12.9% 10.2% 22.1% 22.7%
Total volume 29.4 - 2.2 31.6 7.5 5.9 6.0 35.3 37.6 6.6
Beer volume 23.3 - 1.7 25.0 7.3 4.1 4.3 27.4 29.3 6.7
Licensed & non-beer volume 6.0 - 0.5 6.5 8.4 1.6 1.5 7.6 8.0 6.5
Third party products volume 0.1 - - 0.1 -2.0 0.2 0.2 0.3 0.3 -7.8
Americas
Revenue 4,495 -177 2 312 4,631 6.9 821 770 5,315 5,401 6.9
Revenue per Hl (in €) 86 3 85 3.2 108 100 88 87 3.2
Operating profit (beia) 719 -33 -19 114 780 16 118 107 837 887 13.6
Operating profit (beia) margin 16.0% 16.8% 14.4% 13.9% 15.7% 16.4%
Total volume 52.5 - 2.0 54.6 3.7 7.6 7.7 60.1 62.3 3.7
Beer volume 51.2 - 2.0 53.2 3.9 3.7 3.8 54.9 57.0 3.7
Licensed & non-beer volume 1.2 - - 1.2 -3.0 3.9 3.9 5.1 5.2 3.2
Third party products volume 0.1 - - 0.1 3.9 - - 0.1 0.1 3.9
Asia Pacific
Revenue 2,037 -57 2 107 2,088 5.3 343 367 2,380 2,455 5.9
Revenue per Hl (in €) 113 - 112 0.4 64 63 102 100 1.1
Operating profit (beia) 536 -17 1 29 550 5.4 44 48 580 598 6.1
Operating profit (beia) margin 26.3% 26.3% 12.8% 13.1% 24.4% 24.4%
Total volume 18.0 -0.2 0.9 18.7 4.9 5.4 5.8 23.4 24.5 4.8
Beer volume 17.3 0.1 0.9 18.3 5.2 5.4 5.7 22.7 24.0 5.0
Licensed & non-beer volume 0.4 - - 0.3 -5.0 - 0.1 0.4 0.4 -6.4
Third party products volume 0.3 -0.2 - 0.1 -1.1 - - 0.3 0.1 -1.1
Central & Eastern Europe
Revenue 3,097 -114 - -115 2,868 -3.7 357 355 3,453 3,223 -3.3
Revenue per Hl (in €) 66 1 65 1.4 74 74 67 66 1.1
Operating profit (beia) 290 -2 -3 -13 272 -4.5 31 30 321 302 -4.2
Operating profit (beia) margin 9.4% 9.5% 8.7% 8.5% 9.3% 9.4%
Total volume 46.6 0.1 -2.4 44.4 -5.1 4.8 4.8 51.4 49.2 -4.4
Beer volume 44.3 0.2 -2.1 42.3 -4.7 3.7 3.7 48.0 46.0 -4.2
Licensed & non-beer volume 1.0 - - 1.0 6.0 0.6 0.6 1.6 1.6 4.1
Third party products volume 1.3 - -0.3 1.1 -24 0.5 0.5 1.8 1.6 -17
Consolidated (A)Attributable share of joint
ventures/assoc (B)Group (C) = A + B
MEDIA RELEASE
P.O. Box 28 – 1000 AA Amsterdam – The Netherlands
Office address - Tweede Weteringplantsoen 21 – 1017 ZD Amsterdam
Heineken N.V. - Registered Office at Amsterdam – Trade Register Amsterdam No. 33011433
Page 18 of 49
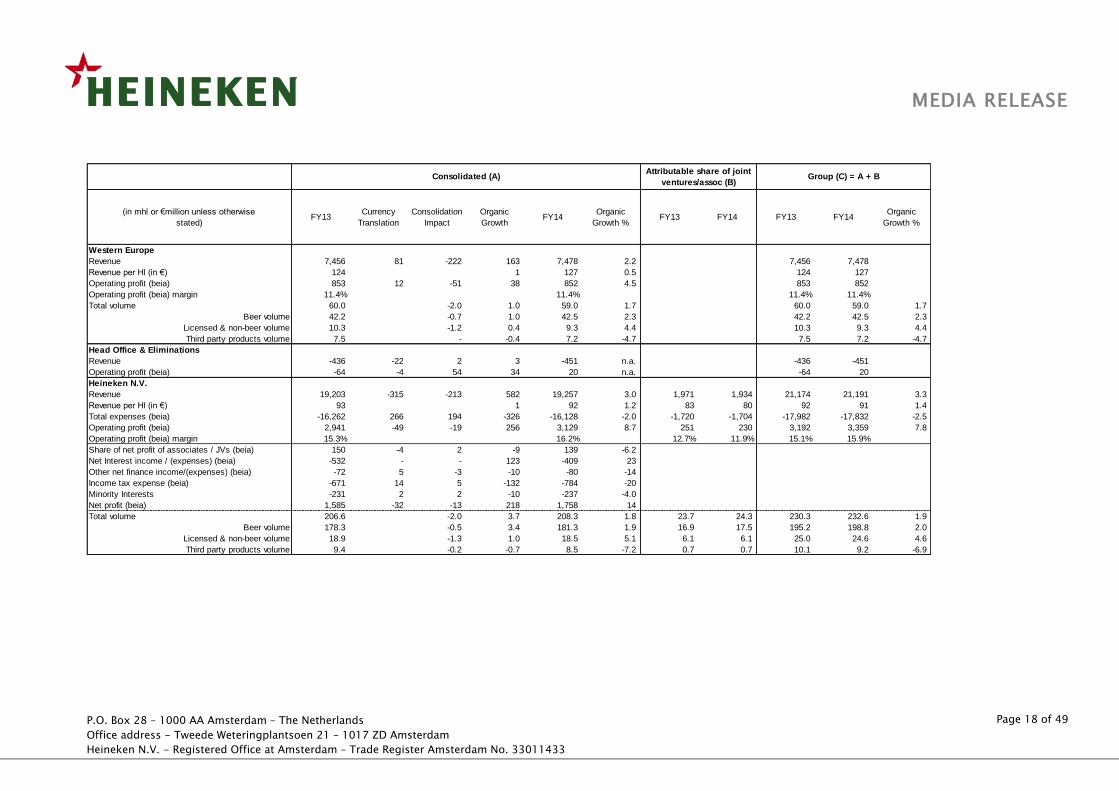
(in mhl or €million unless otherwise
stated)FY13
Currency
Translation
Consolidation
Impact
Organic
GrowthFY14
Organic
Growth %FY13 FY14 FY13 FY14
Organic
Growth %
Western Europe
Revenue 7,456 81 -222 163 7,478 2.2 7,456 7,478 2.2
Revenue per Hl (in €) 124 1 127 0.5 124 127 0.5
Operating profit (beia) 853 12 -51 38 852 4.5 853 852 4.5
Operating profit (beia) margin 11.4% 11.4% 11.4% 11.4%
Total volume 60.0 -2.0 1.0 59.0 1.7 60.0 59.0 1.7
Beer volume 42.2 -0.7 1.0 42.5 2.3 42.2 42.5 2.3
Licensed & non-beer volume 10.3 -1.2 0.4 9.3 4.4 10.3 9.3 4.4
Third party products volume 7.5 - -0.4 7.2 -4.7 7.5 7.2 -4.7
Head Office & Eliminations
Revenue -436 -22 2 3 -451 n.a. - - -436 -451 0.7
Operating profit (beia) -64 -4 54 34 20 n.a. - - -64 20 52.6
Heineken N.V.
Revenue 19,203 -315 -213 582 19,257 3.0 1,971 1,934 21,174 21,191 3.3
Revenue per Hl (in €) 93 1 92 1.2 83 80 92 91 1.4
Total expenses (beia) -16,262 266 194 -326 -16,128 -2.0 -1,720 -1,704 -17,982 -17,832 -2.5
Operating profit (beia) 2,941 -49 -19 256 3,129 8.7 251 230 3,192 3,359 7.8
Operating profit (beia) margin 15.3% 16.2% 12.7% 11.9% 15.1% 15.9%
Share of net profit of associates / JVs (beia) 150 -4 2 -9 139 -6.2
Net Interest income / (expenses) (beia) -532 - - 123 -409 23
Other net finance income/(expenses) (beia) -72 5 -3 -10 -80 -14
Income tax expense (beia) -671 14 5 -132 -784 -20
Minority Interests -231 2 2 -10 -237 -4.0
Net profit (beia) 1,585 -32 -13 218 1,758 14
Total volume 206.6 -2.0 3.7 208.3 1.8 23.7 24.3 230.3 232.6 1.9
Beer volume 178.3 -0.5 3.4 181.3 1.9 16.9 17.5 195.2 198.8 2.0
Licensed & non-beer volume 18.9 -1.3 1.0 18.5 5.1 6.1 6.1 25.0 24.6 4.6
Third party products volume 9.4 -0.2 -0.7 8.5 -7.2 0.7 0.7 10.1 9.2 -6.9
Group (C) = A + BConsolidated (A)Attributable share of joint
ventures/assoc (B)
MEDIA RELEASE
P.O. Box 28 – 1000 AA Amsterdam – The Netherlands
Office address - Tweede Weteringplantsoen 21 – 1017 ZD Amsterdam
Heineken N.V. - Registered Office at Amsterdam – Trade Register Amsterdam No. 33011433
Page 19 of 49
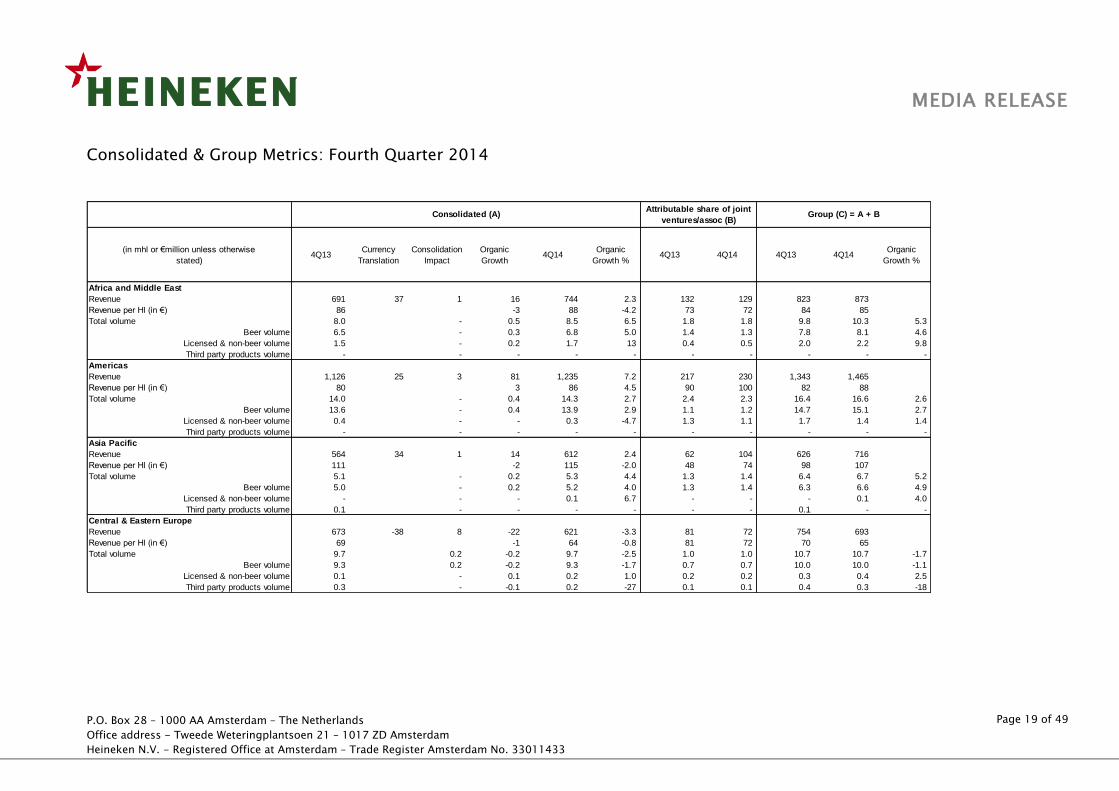
Consolidated & Group Metrics: Fourth Quarter 2014
(in mhl or €million unless otherwise
stated)4Q13
Currency
Translation
Consolidation
Impact
Organic
Growth4Q14
Organic
Growth %4Q13 4Q14 4Q13 4Q14
Organic
Growth %
Africa and Middle East
Revenue 691 37 1 16 744 2.3 132 129 823 873 1.8
Revenue per Hl (in €) 86 -3 88 -4.2 73 72 84 85 -3.5
Total volume 8.0 - 0.5 8.5 6.5 1.8 1.8 9.8 10.3 5.3
Beer volume 6.5 - 0.3 6.8 5.0 1.4 1.3 7.8 8.1 4.6
Licensed & non-beer volume 1.5 - 0.2 1.7 13 0.4 0.5 2.0 2.2 9.8
Third party products volume - - - - - - - - - -
Americas
Revenue 1,126 25 3 81 1,235 7.2 217 230 1,343 1,465 7.0
Revenue per Hl (in €) 80 3 86 4.5 90 100 82 88 4.4
Total volume 14.0 - 0.4 14.3 2.7 2.4 2.3 16.4 16.6 2.6
Beer volume 13.6 - 0.4 13.9 2.9 1.1 1.2 14.7 15.1 2.7
Licensed & non-beer volume 0.4 - - 0.3 -4.7 1.3 1.1 1.7 1.4 1.4
Third party products volume - - - - - - - - - -
Asia Pacific
Revenue 564 34 1 14 612 2.4 62 104 626 716 7.5
Revenue per Hl (in €) 111 -2 115 -2.0 48 74 98 107 2.3
Total volume 5.1 - 0.2 5.3 4.4 1.3 1.4 6.4 6.7 5.2
Beer volume 5.0 - 0.2 5.2 4.0 1.3 1.4 6.3 6.6 4.9
Licensed & non-beer volume - - - 0.1 6.7 - - - 0.1 4.0
Third party products volume 0.1 - - - - - - 0.1 - -
Central & Eastern Europe
Revenue 673 -38 8 -22 621 -3.3 81 72 754 693 -3.5
Revenue per Hl (in €) 69 -1 64 -0.8 81 72 70 65 -1.8
Total volume 9.7 0.2 -0.2 9.7 -2.5 1.0 1.0 10.7 10.7 -1.7
Beer volume 9.3 0.2 -0.2 9.3 -1.7 0.7 0.7 10.0 10.0 -1.1
Licensed & non-beer volume 0.1 - 0.1 0.2 1.0 0.2 0.2 0.3 0.4 2.5
Third party products volume 0.3 - -0.1 0.2 -27 0.1 0.1 0.4 0.3 -18
Consolidated (A)Attributable share of joint
ventures/assoc (B)Group (C) = A + B
MEDIA RELEASE
P.O. Box 28 – 1000 AA Amsterdam – The Netherlands
Office address - Tweede Weteringplantsoen 21 – 1017 ZD Amsterdam
Heineken N.V. - Registered Office at Amsterdam – Trade Register Amsterdam No. 33011433
Page 20 of 49
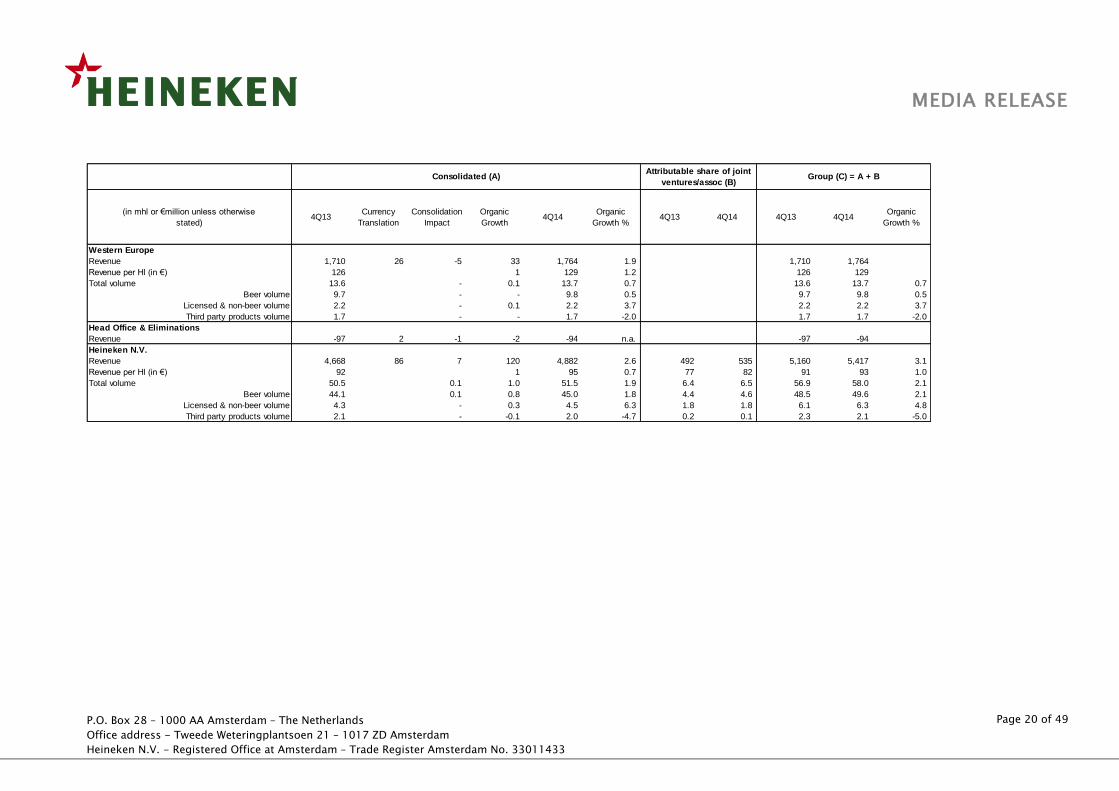
(in mhl or €million unless otherwise
stated)4Q13
Currency
Translation
Consolidation
Impact
Organic
Growth4Q14
Organic
Growth %4Q13 4Q14 4Q13 4Q14
Organic
Growth %
Western Europe
Revenue 1,710 26 -5 33 1,764 1.9 1,710 1,764 1.9
Revenue per Hl (in €) 126 1 129 1.2 126 129 1.2
Total volume 13.6 - 0.1 13.7 0.7 13.6 13.7 0.7
Beer volume 9.7 - - 9.8 0.5 9.7 9.8 0.5
Licensed & non-beer volume 2.2 - 0.1 2.2 3.7 2.2 2.2 3.7
Third party products volume 1.7 - - 1.7 -2.0 1.7 1.7 -2.0
Head Office & Eliminations
Revenue -97 2 -1 -2 -94 n.a. -0.0 -0.0 -97 -94 n.a.
Heineken N.V.
Revenue 4,668 86 7 120 4,882 2.6 492 535 5,160 5,417 3.1
Revenue per Hl (in €) 92 1 95 0.7 77 82 91 93 1.0
Total volume 50.5 0.1 1.0 51.5 1.9 6.4 6.5 56.9 58.0 2.1
Beer volume 44.1 0.1 0.8 45.0 1.8 4.4 4.6 48.5 49.6 2.1
Licensed & non-beer volume 4.3 - 0.3 4.5 6.3 1.8 1.8 6.1 6.3 4.8
Third party products volume 2.1 - -0.1 2.0 -4.7 0.2 0.1 2.3 2.1 -5.0
Group (C) = A + BConsolidated (A)Attributable share of joint
ventures/assoc (B)
MEDIA RELEASE
P.O. Box 28 – 1000 AA Amsterdam – The Netherlands
Office address - Tweede Weteringplantsoen 21 – 1017 ZD Amsterdam
Heineken N.V. - Registered Office at Amsterdam – Trade Register Amsterdam No. 33011433
Page 21 of 49
APPENDICES
1. Consolidated income statement
2. Consolidated statement of comprehensive income
3. Consolidated statement of financial position
4. Consolidated statement of cash flows
5. Consolidated statement of changes in equity
6. Earnings per share
7. Dividends
8. Operating segments
9. Acquisitions and disposals of subsidiaries and non-controlling interests
10. Raw materials, consumables and services
11. Loans and borrowings
12. Non-GAAP measures
13. Notes to the appendices
14. Glossary
MEDIA RELEASE
P.O. Box 28 – 1000 AA Amsterdam – The Netherlands
Office address - Tweede Weteringplantsoen 21 – 1017 ZD Amsterdam
Heineken N.V. - Registered Office at Amsterdam – Trade Register Amsterdam No. 33011433
Page 22 of 49
A P P E N D I X 1
CONSOLIDATED INCOME STATEMENT
For the year ended 31 December
In millions of EUR 2014 2013 Revenue 19,257 19,203
Other income 93 226
Raw materials, consumables and services (12,053) (12,186)
Personnel expenses (3,080) (3,108)
Amortisation, depreciation and impairments (1,437) (1,581)
Total expenses (16,570) (16,875)
Results from operating activities 2,780 2,554
Interest income 48 47
Interest expenses (457) (579)
Other net finance income/(expenses) (79) (61)
Net finance expenses (488) (593)
Share of profit of associates and joint ventures
and impairments thereof (net of income tax) 148 146
Profit before income tax 2,440 2,107
Income tax expense (732) (520)
Profit 1,708 1,587
Attributable to:
Equity holders of the Company (net profit) 1,516 1,364
Non-controlling interests 192 223
Profit 1,708 1,587
Weighted average number of shares – basic 574,945,645 575,062,357
Weighted average number of shares – diluted 576,002,613 576,002,613
Basic earnings per share (EUR) 2.64 2.37
Diluted earnings per share (EUR) 2.63 2.37
MEDIA RELEASE
P.O. Box 28 – 1000 AA Amsterdam – The Netherlands
Office address - Tweede Weteringplantsoen 21 – 1017 ZD Amsterdam
Heineken N.V. - Registered Office at Amsterdam – Trade Register Amsterdam No. 33011433
Page 23 of 49
A P P E N D I X 2
CONSOLIDATED STATEMENT OF COMPREHENSIVE INCOME
For the year ended 31 December
In millions of EUR 2014 2013
Profit 1,708 1,587
Other comprehensive income:
Items that will not be reclassified to profit or loss:
Actuarial gains and losses (344) 197
Items that may be subsequently reclassified to profit or loss:
Currency translation differences 697 (1,282)
Recycling of currency translation differences to profit or loss - 1
Effective portion of net investment hedges (5) 13
Effective portion of changes in fair value of cash flow hedges (99) 16
Effective portion of cash flow hedges transferred to profit or loss (3) (4)
Net change in fair value available-for-sale investments (1) (53)
Share of other comprehensive income of associates/joint ventures (7) 5
Other comprehensive income, net of tax 238 (1,107)
Total comprehensive income 1,946 480
Attributable to:
Equity holders of the Company 1,686 336
Non-controlling interests 260 144
Total comprehensive income 1,946 480
MEDIA RELEASE
P.O. Box 28 – 1000 AA Amsterdam – The Netherlands
Office address - Tweede Weteringplantsoen 21 – 1017 ZD Amsterdam
Heineken N.V. - Registered Office at Amsterdam – Trade Register Amsterdam No. 33011433
Page 24 of 49
A P P E N D I X 3
CONSOLIDATED STATEMENT OF FINANCIAL POSITION
As at 31 December
In millions of EUR 2014 2013
Assets
Property, plant and equipment 8,718 8,454
Intangible assets 16,341 15,934
Investments in associates and joint ventures 2,033 1,883
Other investments and receivables 737 762
Advances to customers 254 301
Deferred tax assets 661 508
Total non-current assets 28,744 27,842
Inventories 1,634 1,512
Other investments 13 11
Trade and other receivables 2,743 2,427
Prepayments and accrued income 317 218
Income tax receivables 23 -
Cash and cash equivalents 668 1,290
Assets classified as held for sale 688 37
Total current assets 6,086 5,495
Total assets 34,830 33,337
MEDIA RELEASE
P.O. Box 28 – 1000 AA Amsterdam – The Netherlands
Office address - Tweede Weteringplantsoen 21 – 1017 ZD Amsterdam
Heineken N.V. - Registered Office at Amsterdam – Trade Register Amsterdam No. 33011433
Page 25 of 49
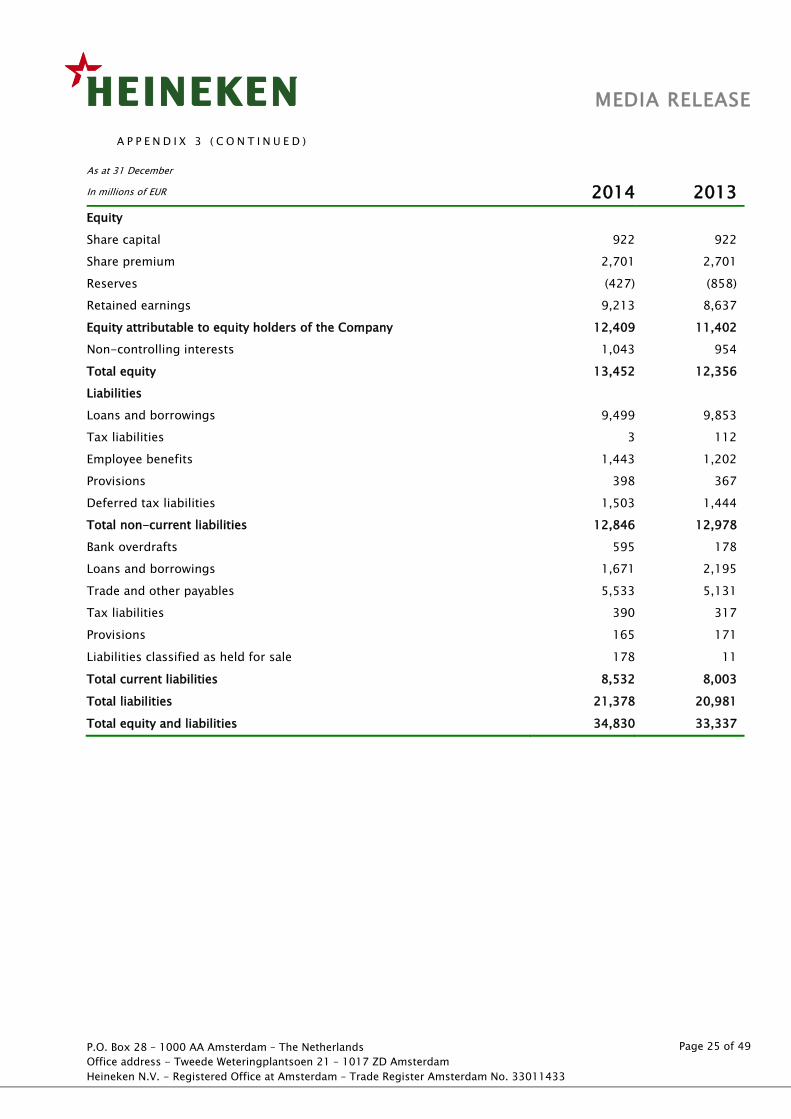
A P P E N D I X 3 ( C O N T I N U E D )
As at 31 December
In millions of EUR 2014 2013
Equity
Share capital 922 922
Share premium 2,701 2,701
Reserves (427) (858)
Retained earnings 9,213 8,637
Equity attributable to equity holders of the Company 12,409 11,402
Non-controlling interests 1,043 954
Total equity 13,452 12,356
Liabilities
Loans and borrowings 9,499 9,853
Tax liabilities 3 112
Employee benefits 1,443 1,202
Provisions 398 367
Deferred tax liabilities 1,503 1,444
Total non-current liabilities 12,846 12,978
Bank overdrafts 595 178
Loans and borrowings 1,671 2,195
Trade and other payables 5,533 5,131
Tax liabilities 390 317
Provisions 165 171
Liabilities classified as held for sale 178 11
Total current liabilities 8,532 8,003
Total liabilities 21,378 20,981
Total equity and liabilities 34,830 33,337
MEDIA RELEASE
P.O. Box 28 – 1000 AA Amsterdam – The Netherlands
Office address - Tweede Weteringplantsoen 21 – 1017 ZD Amsterdam
Heineken N.V. - Registered Office at Amsterdam – Trade Register Amsterdam No. 33011433
Page 26 of 49
A P P E N D I X 4
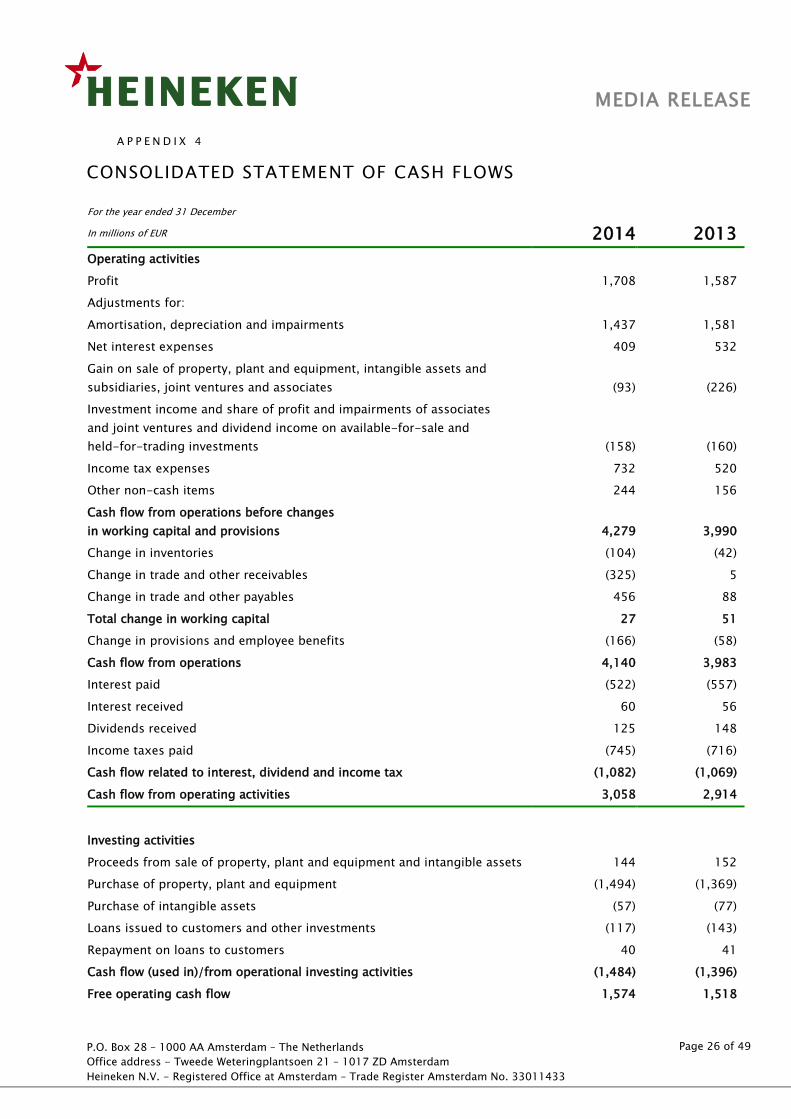
CONSOLIDATED STATEMENT OF CASH FLOWS
For the year ended 31 December
In millions of EUR 2014 2013
Operating activities
Profit 1,708 1,587
Adjustments for:
Amortisation, depreciation and impairments 1,437 1,581
Net interest expenses 409 532
Gain on sale of property, plant and equipment, intangible assets and
subsidiaries, joint ventures and associates (93) (226)
Investment income and share of profit and impairments of associates
and joint ventures and dividend income on available-for-sale and
held-for-trading investments (158) (160)
Income tax expenses 732 520
Other non-cash items 244 156
Cash flow from operations before changes
in working capital and provisions 4,279 3,990
Change in inventories (104) (42)
Change in trade and other receivables (325) 5
Change in trade and other payables 456 88
Total change in working capital 27 51
Change in provisions and employee benefits (166) (58)
Cash flow from operations 4,140 3,983
Interest paid (522) (557)
Interest received 60 56
Dividends received 125 148
Income taxes paid (745) (716)
Cash flow related to interest, dividend and income tax (1,082) (1,069)
Cash flow from operating activities 3,058 2,914
Investing activities
Proceeds from sale of property, plant and equipment and intangible assets 144 152
Purchase of property, plant and equipment (1,494) (1,369)
Purchase of intangible assets (57) (77)
Loans issued to customers and other investments (117) (143)
Repayment on loans to customers 40 41
Cash flow (used in)/from operational investing activities (1,484) (1,396)
Free operating cash flow 1,574 1,518
MEDIA RELEASE
P.O. Box 28 – 1000 AA Amsterdam – The Netherlands
Office address - Tweede Weteringplantsoen 21 – 1017 ZD Amsterdam
Heineken N.V. - Registered Office at Amsterdam – Trade Register Amsterdam No. 33011433
Page 27 of 49
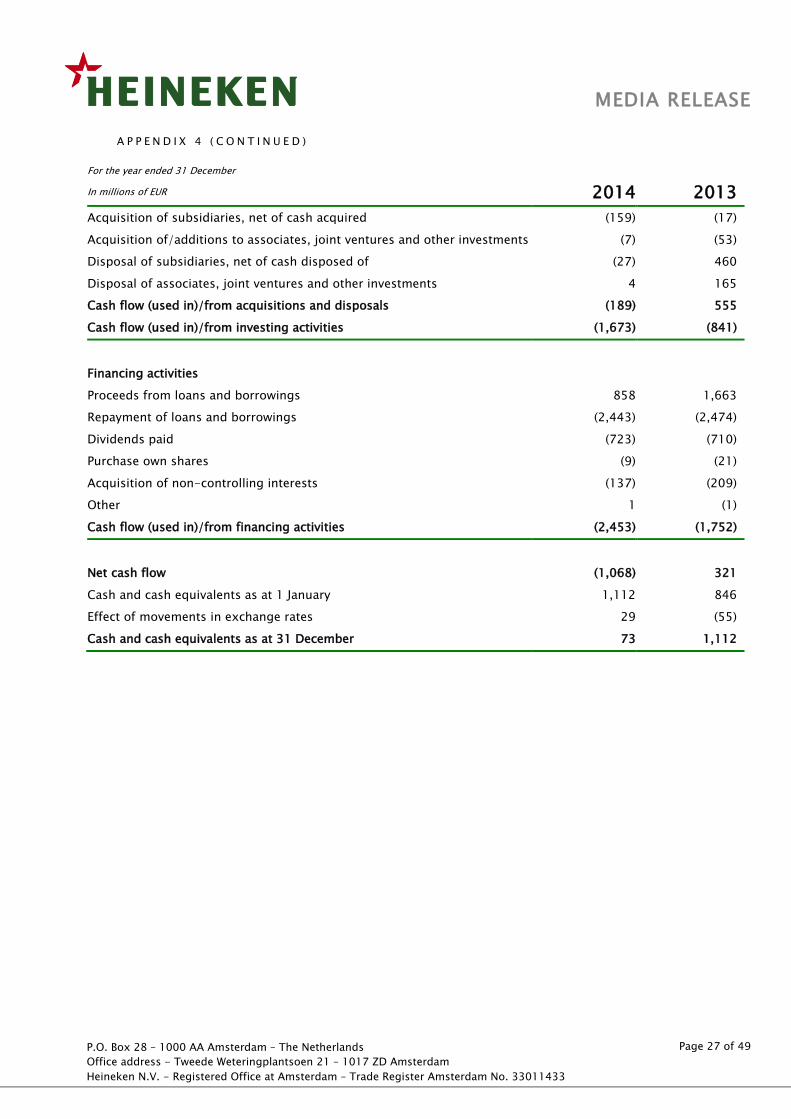
A P P E N D I X 4 ( C O N T I N U E D )
For the year ended 31 December
In millions of EUR 2014 2013
Acquisition of subsidiaries, net of cash acquired (159) (17)
Acquisition of/additions to associates, joint ventures and other investments (7) (53)
Disposal of subsidiaries, net of cash disposed of (27) 460
Disposal of associates, joint ventures and other investments 4 165
Cash flow (used in)/from acquisitions and disposals (189) 555
Cash flow (used in)/from investing activities (1,673) (841)
Financing activities
Proceeds from loans and borrowings 858 1,663
Repayment of loans and borrowings (2,443) (2,474)
Dividends paid (723) (710)
Purchase own shares (9) (21)
Acquisition of non-controlling interests (137) (209)
Other 1 (1)
Cash flow (used in)/from financing activities (2,453) (1,752)
Net cash flow (1,068) 321
Cash and cash equivalents as at 1 January 1,112 846
Effect of movements in exchange rates 29 (55)
Cash and cash equivalents as at 31 December 73 1,112

MEDIA RELEASE
P.O. Box 28 – 1000 AA Amsterdam – The Netherlands
Office address - Tweede Weteringplantsoen 21 – 1017 ZD Amsterdam
Heineken N.V. - Registered Office at Amsterdam – Trade Register Amsterdam No. 33011433
Page 28 of 49
A P P E N D I X 5
CONSOLIDATED STATEMENT OF CHANGES IN EQUITY
In millions of EUR
Share capital
Share
premium
Translation
reserve
Hedging
reserve
Fair value
reserve
Other legal
reserves
Reserve
for own
shares
Retained
earnings
Equity attributable to
equity holders of
the Company
Non-
controlling
interests
Total
equity
Balance as at 1 January 2014 922 2,701 (1,721) 2 97 805 (41) 8,637 11,402 954 12,356
Profit - - - - - 174 - 1,342 1,516 192 1,708
Other comprehensive income - - 624 (101) (1) - - (352) 170 68 238
Total comprehensive income - - 624 (101) (1) 174 - 990 1,686 260 1,946
Transfer to retained earnings - - - - - (236) - 236 - - -
Dividends to shareholders - - - - - - - (512) (512) (224) (736)
Purchase/reissuance own/non-controlling shares - - - - - - (33) - (33) 32 (1)
Own shares delivered - - - - - - 4 (4) - - -
Share-based payments - - - - - - - 47 47 1 48
Acquisition of non-controlling interests without
a change in control - - - - - - - (181) (181) 20 (161)
Balance as at 31 December 2014 922 2,701 (1,097) (99) 96 743 (70) 9,213 12,409 1,043 13,452
MEDIA RELEASE
P.O. Box 28 – 1000 AA Amsterdam – The Netherlands
Office address - Tweede Weteringplantsoen 21 – 1017 ZD Amsterdam
Heineken N.V. - Registered Office at Amsterdam – Trade Register Amsterdam No. 33011433
Page 29 of 49
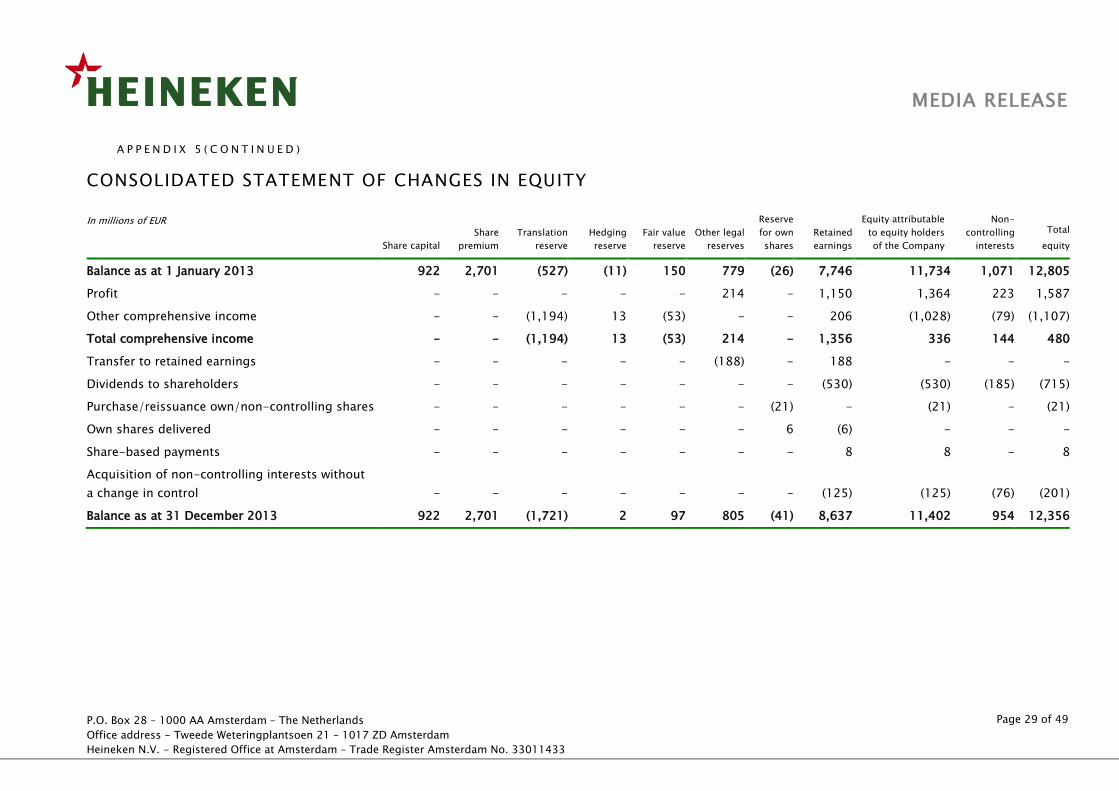
A P P E N D I X 5 ( C O N T I N U E D )
CONSOLIDATED STATEMENT OF CHANGES IN EQUITY
In millions of EUR
Share capital
Share
premium
Translation
reserve
Hedging
reserve
Fair value
reserve
Other legal
reserves
Reserve
for own
shares
Retained
earnings
Equity attributable
to equity holders
of the Company
Non-
controlling
interests
Total
equity
Balance as at 1 January 2013 922 2,701 (527) (11) 150 779 (26) 7,746 11,734 1,071 12,805
Profit - - - - - 214 - 1,150 1,364 223 1,587
Other comprehensive income - - (1,194) 13 (53) - - 206 (1,028) (79) (1,107)
Total comprehensive income - - (1,194) 13 (53) 214 - 1,356 336 144 480
Transfer to retained earnings - - - - - (188) - 188 - - -
Dividends to shareholders - - - - - - - (530) (530) (185) (715)
Purchase/reissuance own/non-controlling shares - - - - - - (21) - (21) - (21)
Own shares delivered - - - - - - 6 (6) - - -
Share-based payments - - - - - - - 8 8 - 8
Acquisition of non-controlling interests without
a change in control - - - - - - - (125) (125) (76) (201)
Balance as at 31 December 2013 922 2,701 (1,721) 2 97 805 (41) 8,637 11,402 954 12,356
P.O. Box 28 – 1000 AA Amsterdam – The Netherlands
Office address - Tweede Weteringplantsoen 21 – 1017 ZD Amsterdam
Heineken N.V. - Registered Office at Amsterdam – Trade Register Amsterdam No. 33011433
Page 30 of 49
Page 30 of 49
MEDIA RELEASE
A P P E N D I X 6
EARNINGS PER SHARE
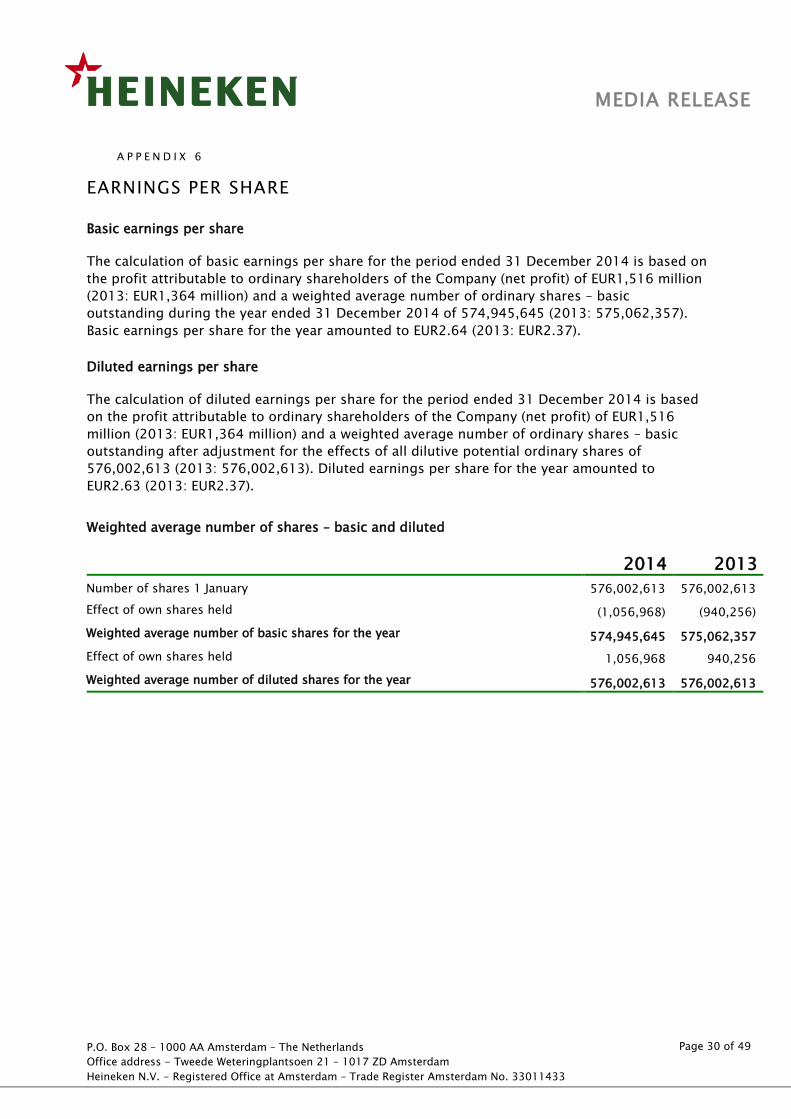
Basic earnings per share
The calculation of basic earnings per share for the period ended 31 December 2014 is based on
the profit attributable to ordinary shareholders of the Company (net profit) of EUR1,516 million
(2013: EUR1,364 million) and a weighted average number of ordinary shares – basic
outstanding during the year ended 31 December 2014 of 574,945,645 (2013: 575,062,357).
Basic earnings per share for the year amounted to EUR2.64 (2013: EUR2.37).
Diluted earnings per share
The calculation of diluted earnings per share for the period ended 31 December 2014 is based
on the profit attributable to ordinary shareholders of the Company (net profit) of EUR1,516
million (2013: EUR1,364 million) and a weighted average number of ordinary shares – basic
outstanding after adjustment for the effects of all dilutive potential ordinary shares of
576,002,613 (2013: 576,002,613). Diluted earnings per share for the year amounted to
EUR2.63 (2013: EUR2.37).
Weighted average number of shares – basic and diluted
2014 2013
Number of shares 1 January 576,002,613 576,002,613
Effect of own shares held (1,056,968) (940,256)
Weighted average number of basic shares for the year 574,945,645 575,062,357
Effect of own shares held 1,056,968 940,256
Weighted average number of diluted shares for the year 576,002,613 576,002,613
P.O. Box 28 – 1000 AA Amsterdam – The Netherlands
Office address - Tweede Weteringplantsoen 21 – 1017 ZD Amsterdam
Heineken N.V. - Registered Office at Amsterdam – Trade Register Amsterdam No. 33011433
Page 31 of 49
Page 31 of 49
MEDIA RELEASE
A P P E N D I X 7
DIVIDENDS
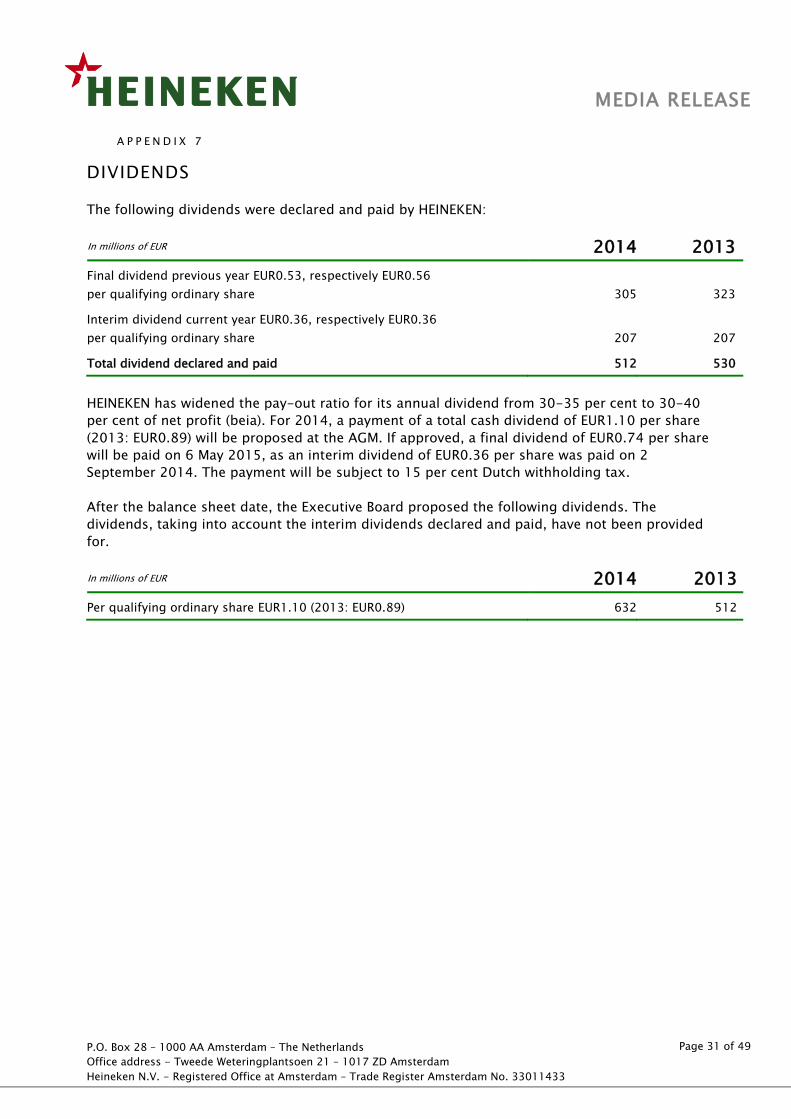
The following dividends were declared and paid by HEINEKEN:
In millions of EUR 2014 2013
Final dividend previous year EUR0.53, respectively EUR0.56
per qualifying ordinary share 305 323
Interim dividend current year EUR0.36, respectively EUR0.36
per qualifying ordinary share 207 207
Total dividend declared and paid 512 530
HEINEKEN has widened the pay-out ratio for its annual dividend from 30-35 per cent to 30-40
per cent of net profit (beia). For 2014, a payment of a total cash dividend of EUR1.10 per share
(2013: EUR0.89) will be proposed at the AGM. If approved, a final dividend of EUR0.74 per share
will be paid on 6 May 2015, as an interim dividend of EUR0.36 per share was paid on 2
September 2014. The payment will be subject to 15 per cent Dutch withholding tax.
After the balance sheet date, the Executive Board proposed the following dividends. The
dividends, taking into account the interim dividends declared and paid, have not been provided
for.
In millions of EUR 2014 2013
Per qualifying ordinary share EUR1.10 (2013: EUR0.89) 632 512
MEDIA RELEASE
P.O. Box 28 – 1000 AA Amsterdam – The Netherlands
Office address - Tweede Weteringplantsoen 21 – 1017 ZD Amsterdam
Heineken N.V. - Registered Office at Amsterdam – Trade Register Amsterdam No. 33011433
Page 32 of 49
A P P E N D I X 8
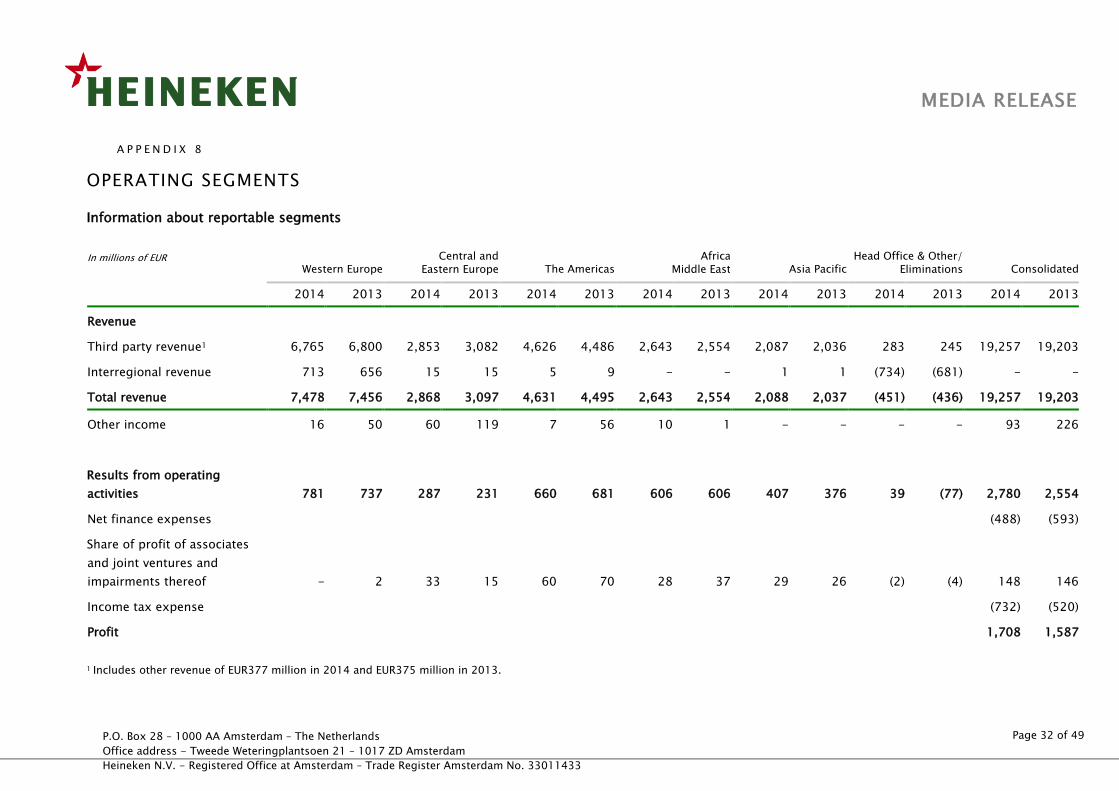
OPERATING SEGMENTS
Information about reportable segments
In millions of EUR Western Europe
Central and
Eastern Europe The Americas Africa
Middle East Asia Pacific Head Office & Other/
Eliminations Consolidated
2014 2013 2014 2013 2014 2013 2014 2013 2014 2013 2014 2013 2014 2013
Revenue
Third party revenue1 6,765 6,800 2,853 3,082 4,626 4,486 2,643 2,554 2,087 2,036 283 245 19,257 19,203
Interregional revenue 713 656 15 15 5 9 - - 1 1 (734) (681) - -
Total revenue 7,478 7,456 2,868 3,097 4,631 4,495 2,643 2,554 2,088 2,037 (451) (436) 19,257 19,203
Other income 16 50 60 119 7 56 10 1 - - - - 93 226
Results from operating
activities 781 737 287 231 660 681 606 606 407 376 39 (77) 2,780 2,554
Net finance expenses (488) (593)
Share of profit of associates
and joint ventures and
impairments thereof - 2 33 15 60 70 28 37 29 26 (2) (4) 148 146
Income tax expense (732) (520)
Profit 1,708 1,587
1 Includes other revenue of EUR377 million in 2014 and EUR375 million in 2013.
MEDIA RELEASE
P.O. Box 28 – 1000 AA Amsterdam – The Netherlands
Office address - Tweede Weteringplantsoen 21 – 1017 ZD Amsterdam
Heineken N.V. - Registered Office at Amsterdam – Trade Register Amsterdam No. 33011433
Page 33 of 49
A P P E N D I X 8 ( C O N T I N U E D )
In millions of EUR Western Europe
Central and
Eastern Europe The Americas Africa
Middle East Asia Pacific Head Office & Other/
Eliminations Consolidated
2014 2013 2014 2013 2014 2013 2014 2013 2014 2013 2014 2013 2014 2013
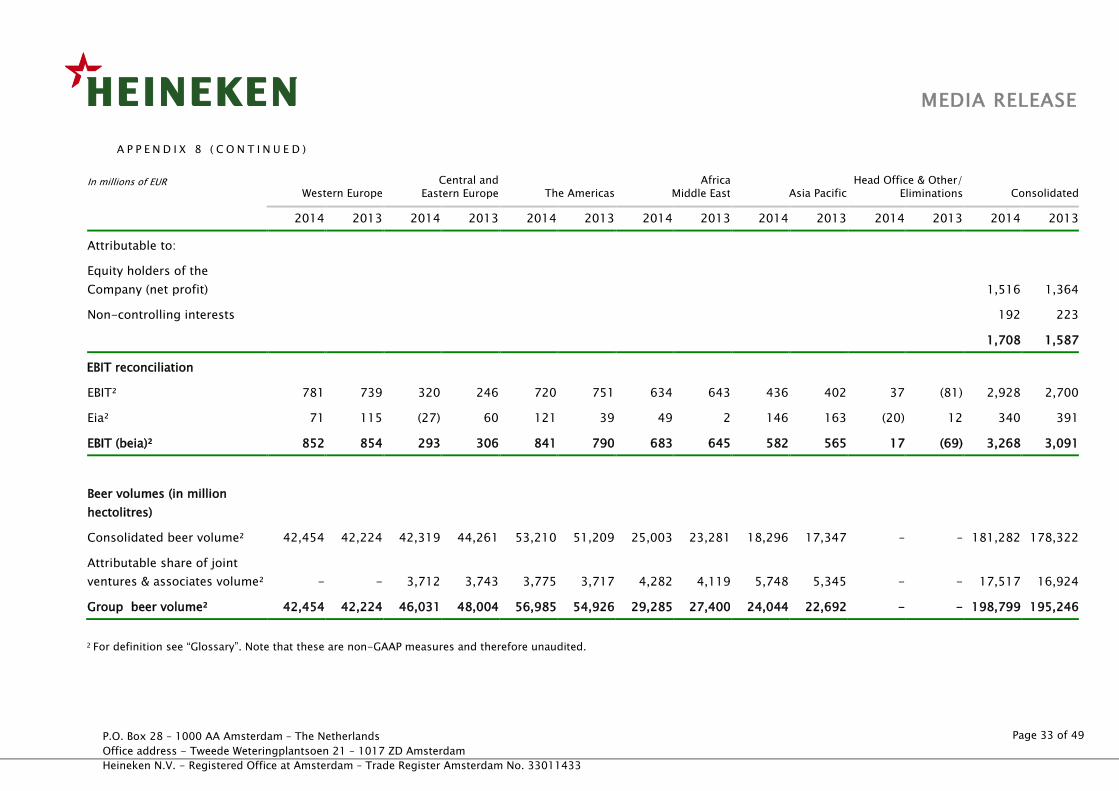
Attributable to:
Equity holders of the
Company (net profit) 1,516 1,364
Non-controlling interests 192 223
1,708 1,587
EBIT reconciliation
EBIT² 781 739 320 246 720 751 634 643 436 402 37 (81) 2,928 2,700
Eia² 71 115 (27) 60 121 39 49 2 146 163 (20) 12 340 391
EBIT (beia)² 852 854 293 306 841 790 683 645 582 565 17 (69) 3,268 3,091
Beer volumes (in million
hectolitres)
Consolidated beer volume² 42,454 42,224 42,319 44,261 53,210 51,209 25,003 23,281 18,296 17,347 – – 181,282 178,322
Attributable share of joint
ventures & associates volume² - - 3,712 3,743 3,775 3,717 4,282 4,119 5,748 5,345 - - 17,517 16,924
Group beer volume² 42,454 42,224 46,031 48,004 56,985 54,926 29,285 27,400 24,044 22,692 - - 198,799 195,246
2 For definition see “Glossary”. Note that these are non-GAAP measures and therefore unaudited.
MEDIA RELEASE
P.O. Box 28 – 1000 AA Amsterdam – The Netherlands
Office address - Tweede Weteringplantsoen 21 – 1017 ZD Amsterdam
Heineken N.V. - Registered Office at Amsterdam – Trade Register Amsterdam No. 33011433
Page 34 of 49
A P P E N D I X 8 ( C O N T I N U E D )
In millions of EUR Western Europe
Central and
Eastern Europe The Americas Africa
Middle East Asia Pacific Head Office & Other/
Eliminations Consolidated
2014 2013 2014 2013 2014 2013 2014 2013 2014 2013 2014 2013 2014 2013
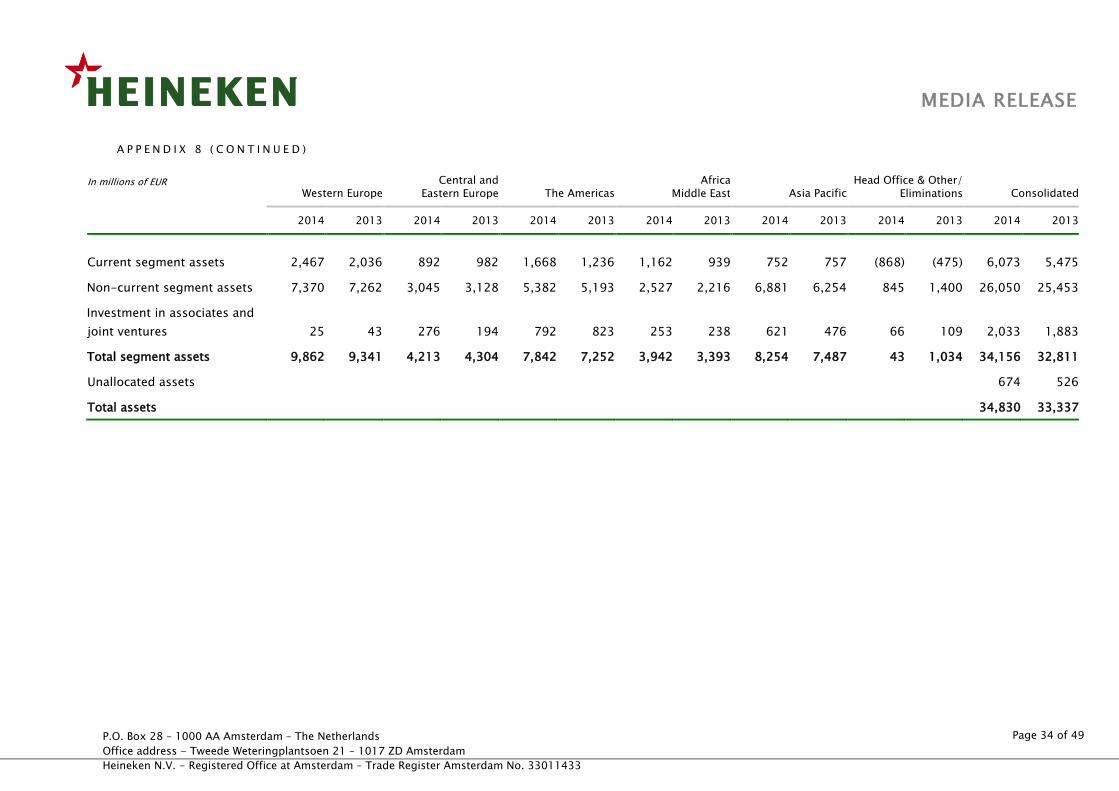
Current segment assets 2,467 2,036 892 982 1,668 1,236 1,162 939 752 757 (868) (475) 6,073 5,475
Non-current segment assets 7,370 7,262 3,045 3,128 5,382 5,193 2,527 2,216 6,881 6,254 845 1,400 26,050 25,453
Investment in associates and
joint ventures 25 43 276 194 792 823 253 238 621 476 66 109 2,033 1,883
Total segment assets 9,862 9,341 4,213 4,304 7,842 7,252 3,942 3,393 8,254 7,487 43 1,034 34,156 32,811
Unallocated assets 674 526
Total assets 34,830 33,337
MEDIA RELEASE
P.O. Box 28 – 1000 AA Amsterdam – The Netherlands
Office address - Tweede Weteringplantsoen 21 – 1017 ZD Amsterdam
Heineken N.V. - Registered Office at Amsterdam – Trade Register Amsterdam No. 33011433
Page 35 of 49
A P P E N D I X 8 ( C O N T I N U E D )
In millions of EUR Western Europe
Central and
Eastern Europe The Americas Africa
Middle East Asia Pacific Head Office & Other/
Eliminations Consolidated
2014 2013 2014 2013 2014 2013 2014 2013 2014 2013 2014 2013 2014 2013
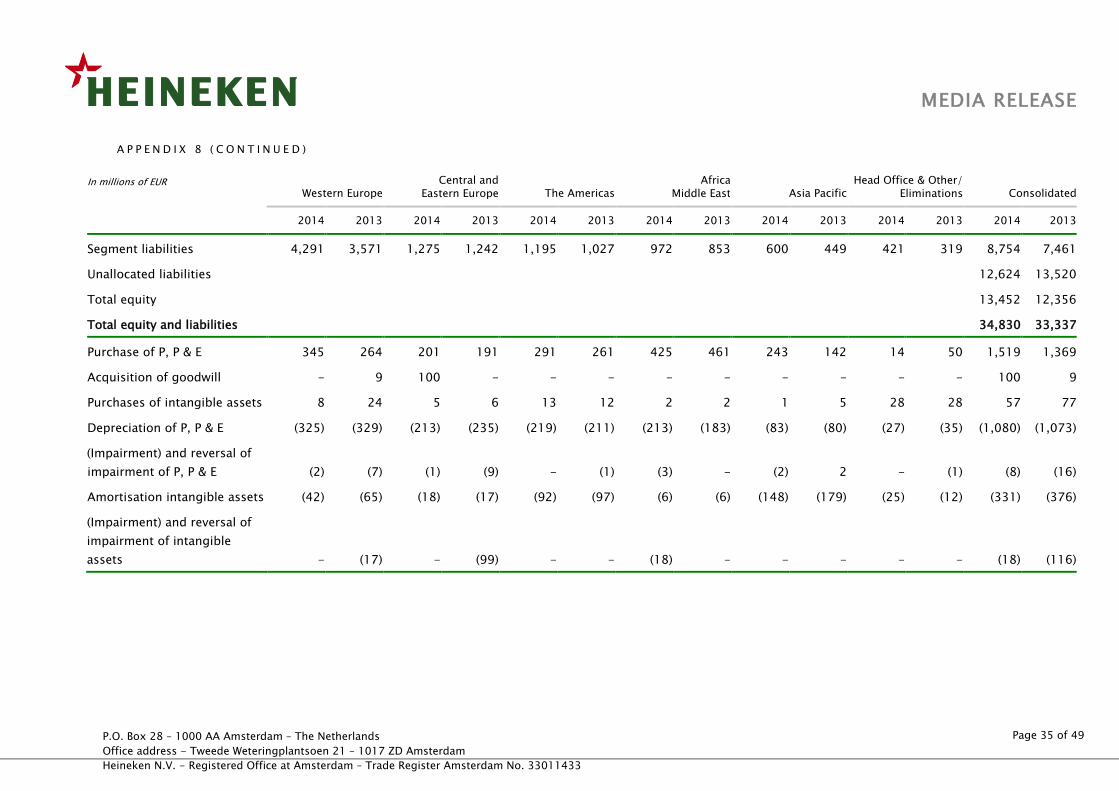
Segment liabilities 4,291 3,571 1,275 1,242 1,195 1,027 972 853 600 449 421 319 8,754 7,461
Unallocated liabilities 12,624 13,520
Total equity 13,452 12,356
Total equity and liabilities 34,830 33,337
Purchase of P, P & E 345 264 201 191 291 261 425 461 243 142 14 50 1,519 1,369
Acquisition of goodwill - 9 100 - - - - - - - - - 100 9
Purchases of intangible assets 8 24 5 6 13 12 2 2 1 5 28 28 57 77
Depreciation of P, P & E (325) (329) (213) (235) (219) (211) (213) (183) (83) (80) (27) (35) (1,080) (1,073)
(Impairment) and reversal of
impairment of P, P & E (2) (7) (1) (9) - (1) (3) - (2) 2 - (1) (8) (16)
Amortisation intangible assets (42) (65) (18) (17) (92) (97) (6) (6) (148) (179) (25) (12) (331) (376)
(Impairment) and reversal of
impairment of intangible
assets - (17) - (99) - - (18) - - - - - (18) (116)
P.O. Box 28 – 1000 AA Amsterdam – The Netherlands
Office address - Tweede Weteringplantsoen 21 – 1017 ZD Amsterdam
HEINEKEN - Registered Office at Amsterdam – Trade Register Amsterdam No. 33011433
Page 36 of 49
MEDIA RELEASE
A P P E N D I X 9
ACQUISITIONS AND DISPOSALS OF SUBSIDIARIES AND NON-
CONTROLLING INTERESTS
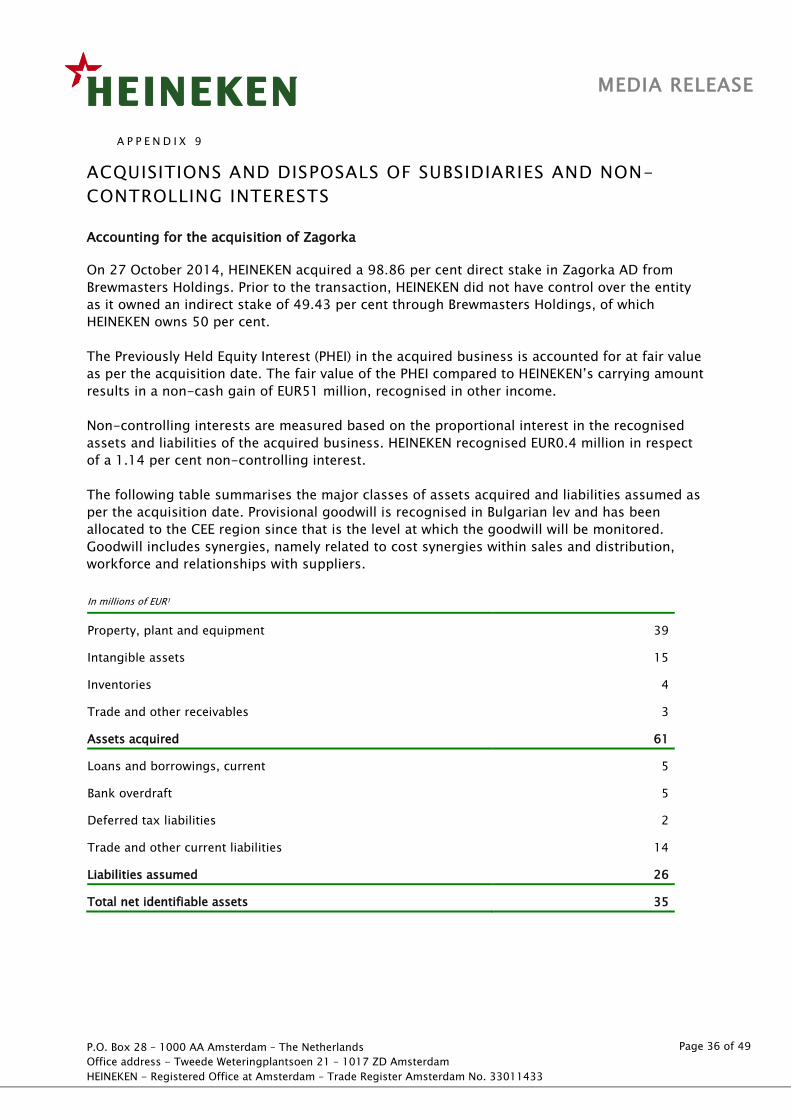
Accounting for the acquisition of Zagorka
On 27 October 2014, HEINEKEN acquired a 98.86 per cent direct stake in Zagorka AD from
Brewmasters Holdings. Prior to the transaction, HEINEKEN did not have control over the entity
as it owned an indirect stake of 49.43 per cent through Brewmasters Holdings, of which
HEINEKEN owns 50 per cent.
The Previously Held Equity Interest (PHEI) in the acquired business is accounted for at fair value
as per the acquisition date. The fair value of the PHEI compared to HEINEKEN’s carrying amount
results in a non-cash gain of EUR51 million, recognised in other income.
Non-controlling interests are measured based on the proportional interest in the recognised
assets and liabilities of the acquired business. HEINEKEN recognised EUR0.4 million in respect
of a 1.14 per cent non-controlling interest.
The following table summarises the major classes of assets acquired and liabilities assumed as
per the acquisition date. Provisional goodwill is recognised in Bulgarian lev and has been
allocated to the CEE region since that is the level at which the goodwill will be monitored.
Goodwill includes synergies, namely related to cost synergies within sales and distribution,
workforce and relationships with suppliers.
In millions of EUR1
Property, plant and equipment 39
Intangible assets 15
Inventories 4
Trade and other receivables 3
Assets acquired 61
Loans and borrowings, current 5
Bank overdraft 5
Deferred tax liabilities 2
Trade and other current liabilities 14
Liabilities assumed 26
Total net identifiable assets 35
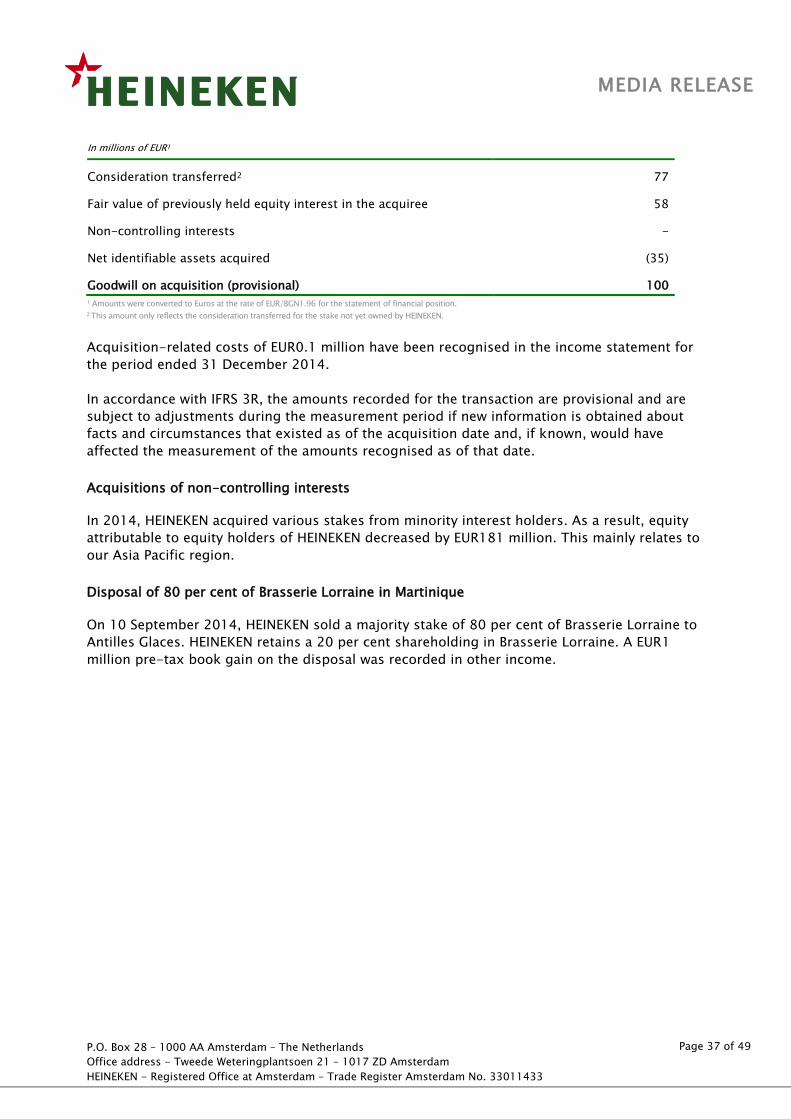
P.O. Box 28 – 1000 AA Amsterdam – The Netherlands
Office address - Tweede Weteringplantsoen 21 – 1017 ZD Amsterdam
HEINEKEN - Registered Office at Amsterdam – Trade Register Amsterdam No. 33011433
Page 37 of 49
MEDIA RELEASE
In millions of EUR1
Consideration transferred2 77
Fair value of previously held equity interest in the acquiree 58
Non-controlling interests -
Net identifiable assets acquired (35)
Goodwill on acquisition (provisional) 100 1 Amounts were converted to Euros at the rate of EUR/BGN1.96 for the statement of financial position. 2 This amount only reflects the consideration transferred for the stake not yet owned by HEINEKEN.
Acquisition-related costs of EUR0.1 million have been recognised in the income statement for
the period ended 31 December 2014.
In accordance with IFRS 3R, the amounts recorded for the transaction are provisional and are
subject to adjustments during the measurement period if new information is obtained about
facts and circumstances that existed as of the acquisition date and, if known, would have
affected the measurement of the amounts recognised as of that date.
Acquisitions of non-controlling interests
In 2014, HEINEKEN acquired various stakes from minority interest holders. As a result, equity
attributable to equity holders of HEINEKEN decreased by EUR181 million. This mainly relates to
our Asia Pacific region.
Disposal of 80 per cent of Brasserie Lorraine in Martinique
On 10 September 2014, HEINEKEN sold a majority stake of 80 per cent of Brasserie Lorraine to
Antilles Glaces. HEINEKEN retains a 20 per cent shareholding in Brasserie Lorraine. A EUR1
million pre-tax book gain on the disposal was recorded in other income.
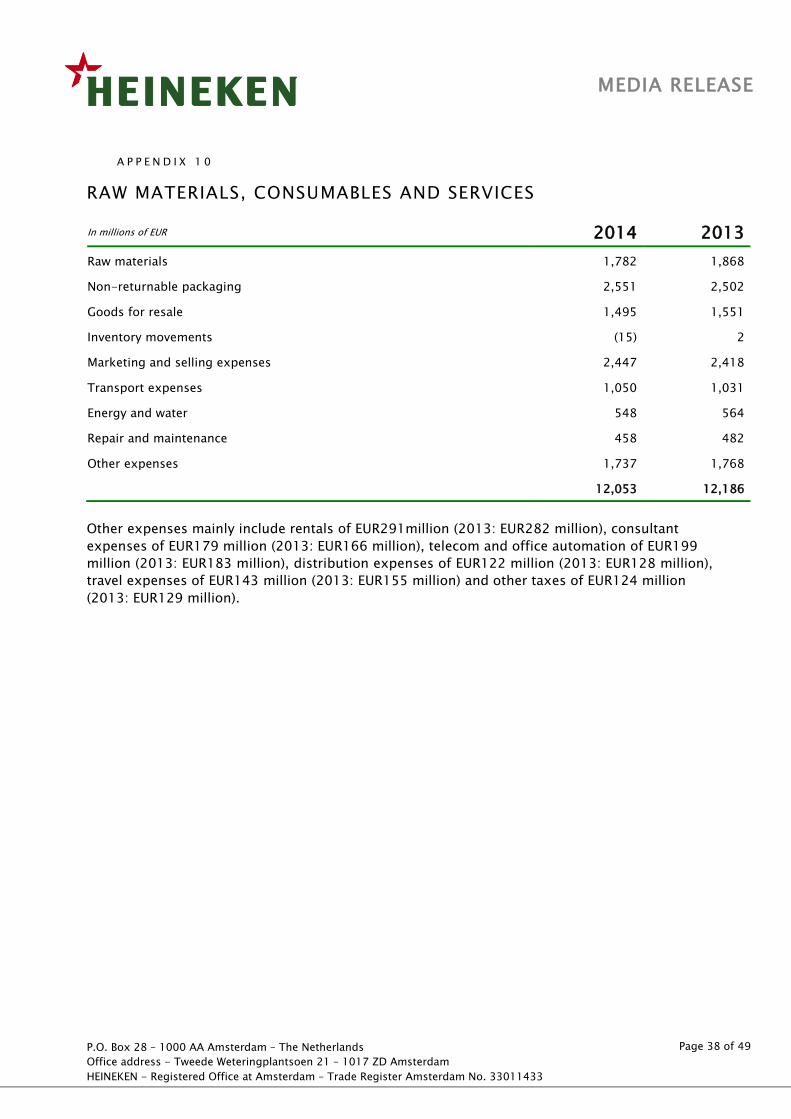
P.O. Box 28 – 1000 AA Amsterdam – The Netherlands
Office address - Tweede Weteringplantsoen 21 – 1017 ZD Amsterdam
HEINEKEN - Registered Office at Amsterdam – Trade Register Amsterdam No. 33011433
Page 38 of 49
MEDIA RELEASE
A P P E N D I X 1 0
RAW MATERIALS, CONSUMABLES AND SERVICES
In millions of EUR 2014 2013
Raw materials 1,782 1,868
Non-returnable packaging 2,551 2,502
Goods for resale 1,495 1,551
Inventory movements (15) 2
Marketing and selling expenses 2,447 2,418
Transport expenses 1,050 1,031
Energy and water 548 564
Repair and maintenance 458 482
Other expenses 1,737 1,768
12,053 12,186
Other expenses mainly include rentals of EUR291million (2013: EUR282 million), consultant
expenses of EUR179 million (2013: EUR166 million), telecom and office automation of EUR199
million (2013: EUR183 million), distribution expenses of EUR122 million (2013: EUR128 million),
travel expenses of EUR143 million (2013: EUR155 million) and other taxes of EUR124 million
(2013: EUR129 million).
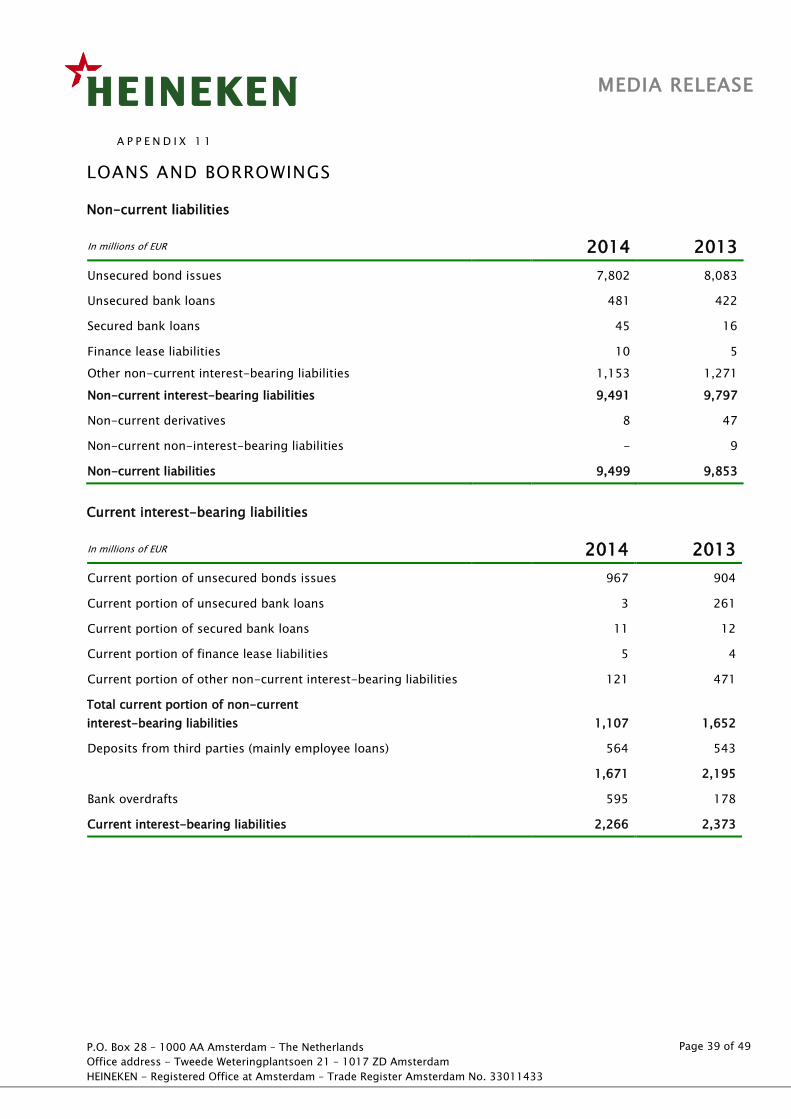
P.O. Box 28 – 1000 AA Amsterdam – The Netherlands
Office address - Tweede Weteringplantsoen 21 – 1017 ZD Amsterdam
HEINEKEN - Registered Office at Amsterdam – Trade Register Amsterdam No. 33011433
Page 39 of 49
MEDIA RELEASE
A P P E N D I X 1 1
LOANS AND BORROWINGS
Non-current liabilities
In millions of EUR 2014 2013
Unsecured bond issues 7,802 8,083
Unsecured bank loans 481 422
Secured bank loans 45 16
Finance lease liabilities 10 5
Other non-current interest-bearing liabilities 1,153 1,271
Non-current interest-bearing liabilities 9,491 9,797
Non-current derivatives 8 47
Non-current non-interest-bearing liabilities - 9
Non-current liabilities 9,499 9,853
Current interest-bearing liabilities
In millions of EUR 2014 2013
Current portion of unsecured bonds issues 967 904
Current portion of unsecured bank loans 3 261
Current portion of secured bank loans 11 12
Current portion of finance lease liabilities 5 4
Current portion of other non-current interest-bearing liabilities 121 471
Total current portion of non-current
interest-bearing liabilities 1,107 1,652
Deposits from third parties (mainly employee loans) 564 543
1,671 2,195
Bank overdrafts 595 178
Current interest-bearing liabilities 2,266 2,373
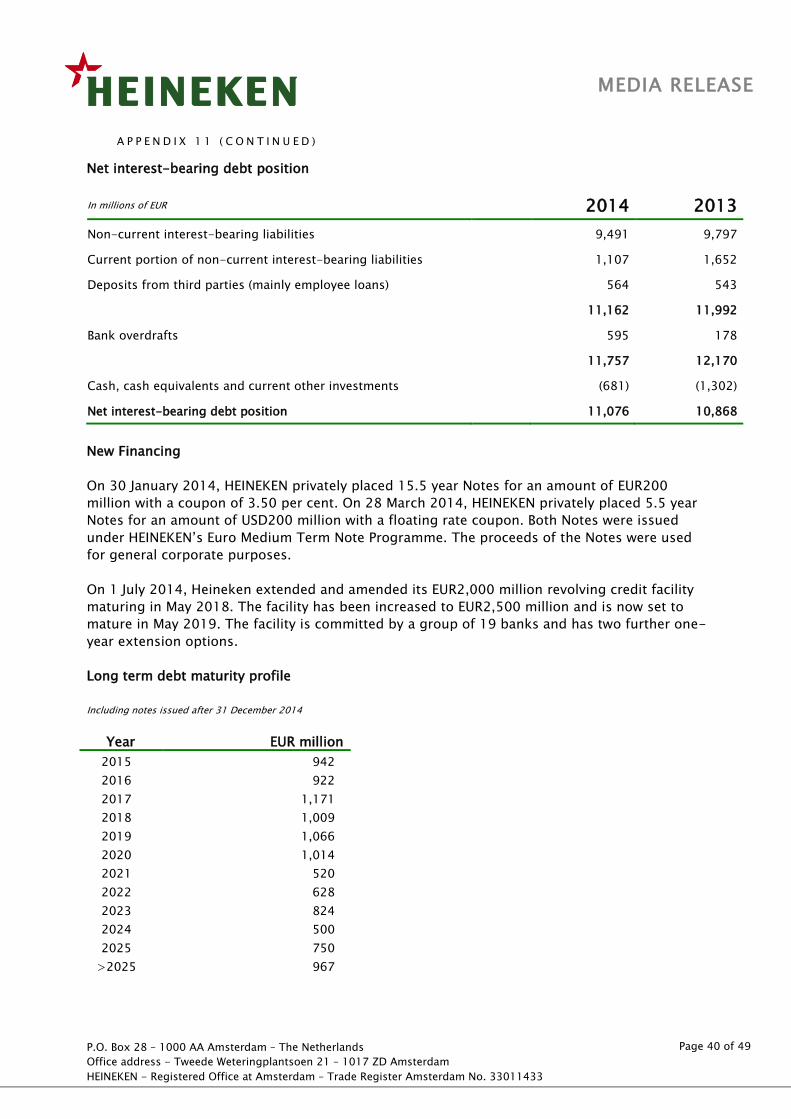
P.O. Box 28 – 1000 AA Amsterdam – The Netherlands
Office address - Tweede Weteringplantsoen 21 – 1017 ZD Amsterdam
HEINEKEN - Registered Office at Amsterdam – Trade Register Amsterdam No. 33011433
Page 40 of 49
MEDIA RELEASE
A P P E N D I X 1 1 ( C O N T I N U E D )
Net interest-bearing debt position
In millions of EUR 2014 2013
Non-current interest-bearing liabilities 9,491 9,797
Current portion of non-current interest-bearing liabilities 1,107 1,652
Deposits from third parties (mainly employee loans) 564 543
11,162 11,992
Bank overdrafts 595 178
11,757 12,170
Cash, cash equivalents and current other investments (681) (1,302)
Net interest-bearing debt position 11,076 10,868
New Financing
On 30 January 2014, HEINEKEN privately placed 15.5 year Notes for an amount of EUR200
million with a coupon of 3.50 per cent. On 28 March 2014, HEINEKEN privately placed 5.5 year
Notes for an amount of USD200 million with a floating rate coupon. Both Notes were issued
under HEINEKEN’s Euro Medium Term Note Programme. The proceeds of the Notes were used
for general corporate purposes.
On 1 July 2014, Heineken extended and amended its EUR2,000 million revolving credit facility
maturing in May 2018. The facility has been increased to EUR2,500 million and is now set to
mature in May 2019. The facility is committed by a group of 19 banks and has two further one-
year extension options.
Long term debt maturity profile
Including notes issued after 31 December 2014
Year EUR million
2015 942
2016 922
2017 1,171
2018 1,009
2019 1,066
2020 1,014
2021 520
2022 628
2023 824
2024 500
2025 750
>2025 967
P.O. Box 28 – 1000 AA Amsterdam – The Netherlands
Office address - Tweede Weteringplantsoen 21 – 1017 ZD Amsterdam
HEINEKEN - Registered Office at Amsterdam – Trade Register Amsterdam No. 33011433
Page 41 of 49
MEDIA RELEASE
Financing Headroom1
As at 31 December 2014, no amounts were drawn on the existing revolving credit facility of
EUR2,500 million. This revolving credit facility was extended and amended in May 2014 and
now matures in 2019. The committed financing headroom at Group level was EUR2,169 million
as at 31 December 2014 and consisted of undrawn revolving credit facility and centrally
available cash, minus centrally managed overdraft balances.
Incurrence covenant1
HEINEKEN has an incurrence covenant in some of its financing facilities. This incurrence
covenant is calculated by dividing net debt by EBITDA (beia) (both based on proportional
consolidation of joint ventures and including acquisitions made in 2014 on a pro-forma basis).
As at 31 December 2014 this ratio was 2.4 (2013: 2.5). If the ratio would be beyond a level of
3.5, the incurrence covenant would prevent us from conducting further significant debt
financed acquisitions.
Non-GAAP measures: unaudited
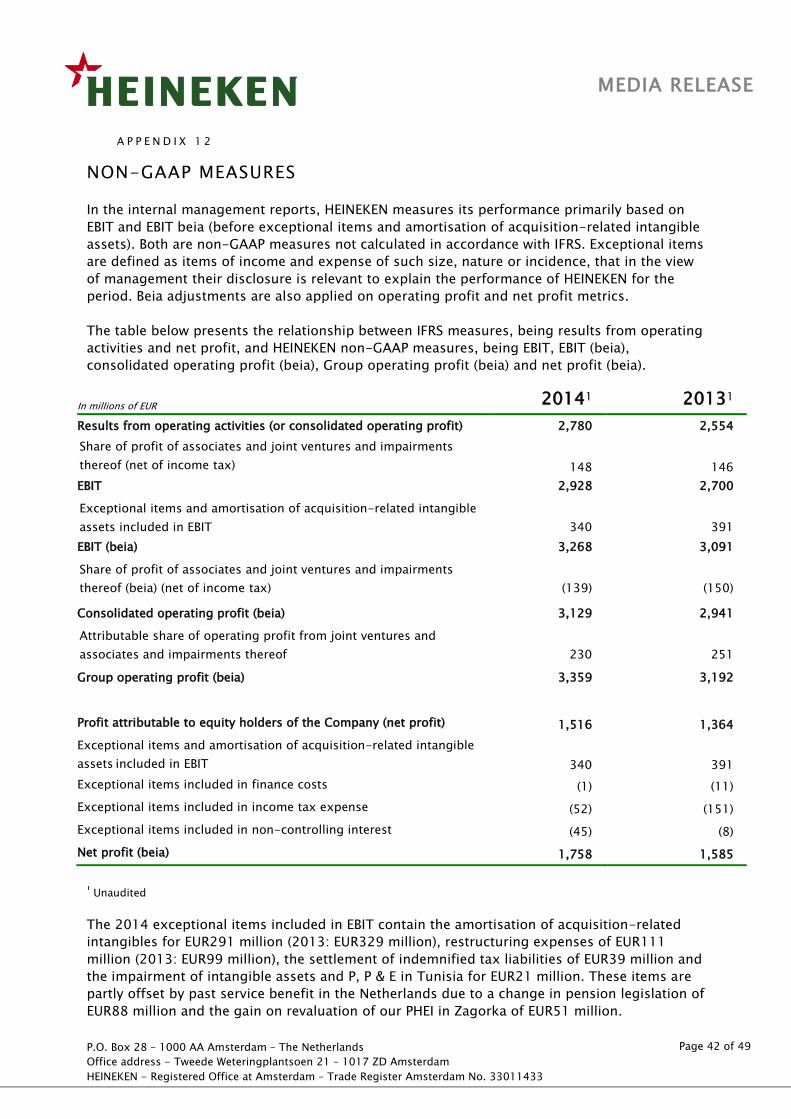
P.O. Box 28 – 1000 AA Amsterdam – The Netherlands
Office address - Tweede Weteringplantsoen 21 – 1017 ZD Amsterdam
HEINEKEN - Registered Office at Amsterdam – Trade Register Amsterdam No. 33011433
Page 42 of 49
MEDIA RELEASE
A P P E N D I X 1 2
NON-GAAP MEASURES
In the internal management reports, HEINEKEN measures its performance primarily based on
EBIT and EBIT beia (before exceptional items and amortisation of acquisition-related intangible
assets). Both are non-GAAP measures not calculated in accordance with IFRS. Exceptional items
are defined as items of income and expense of such size, nature or incidence, that in the view
of management their disclosure is relevant to explain the performance of HEINEKEN for the
period. Beia adjustments are also applied on operating profit and net profit metrics.
The table below presents the relationship between IFRS measures, being results from operating
activities and net profit, and HEINEKEN non-GAAP measures, being EBIT, EBIT (beia),
consolidated operating profit (beia), Group operating profit (beia) and net profit (beia).
In millions of EUR 20141 20131
Results from operating activities (or consolidated operating profit) 2,780 2,554
Share of profit of associates and joint ventures and impairments
thereof (net of income tax) 148 146
EBIT 2,928 2,700
Exceptional items and amortisation of acquisition-related intangible
assets included in EBIT
340
391
EBIT (beia) 3,268 3,091
Share of profit of associates and joint ventures and impairments
thereof (beia) (net of income tax)
(139)
(150)
Consolidated operating profit (beia) 3,129 2,941
Attributable share of operating profit from joint ventures and
associates and impairments thereof
230
251
Group operating profit (beia) 3,359 3,192
Profit attributable to equity holders of the Company (net profit) 1,516 1,364
Exceptional items and amortisation of acquisition-related intangible
assets included in EBIT
340
391
Exceptional items included in finance costs (1) (11)
Exceptional items included in income tax expense (52) (151)
Exceptional items included in non-controlling interest (45) (8)
Net profit (beia) 1,758 1,585
Unaudited
The 2014 exceptional items included in EBIT contain the amortisation of acquisition-related
intangibles for EUR291 million (2013: EUR329 million), restructuring expenses of EUR111
million (2013: EUR99 million), the settlement of indemnified tax liabilities of EUR39 million and
the impairment of intangible assets and P, P & E in Tunisia for EUR21 million. These items are
partly offset by past service benefit in the Netherlands due to a change in pension legislation of
EUR88 million and the gain on revaluation of our PHEI in Zagorka of EUR51 million.
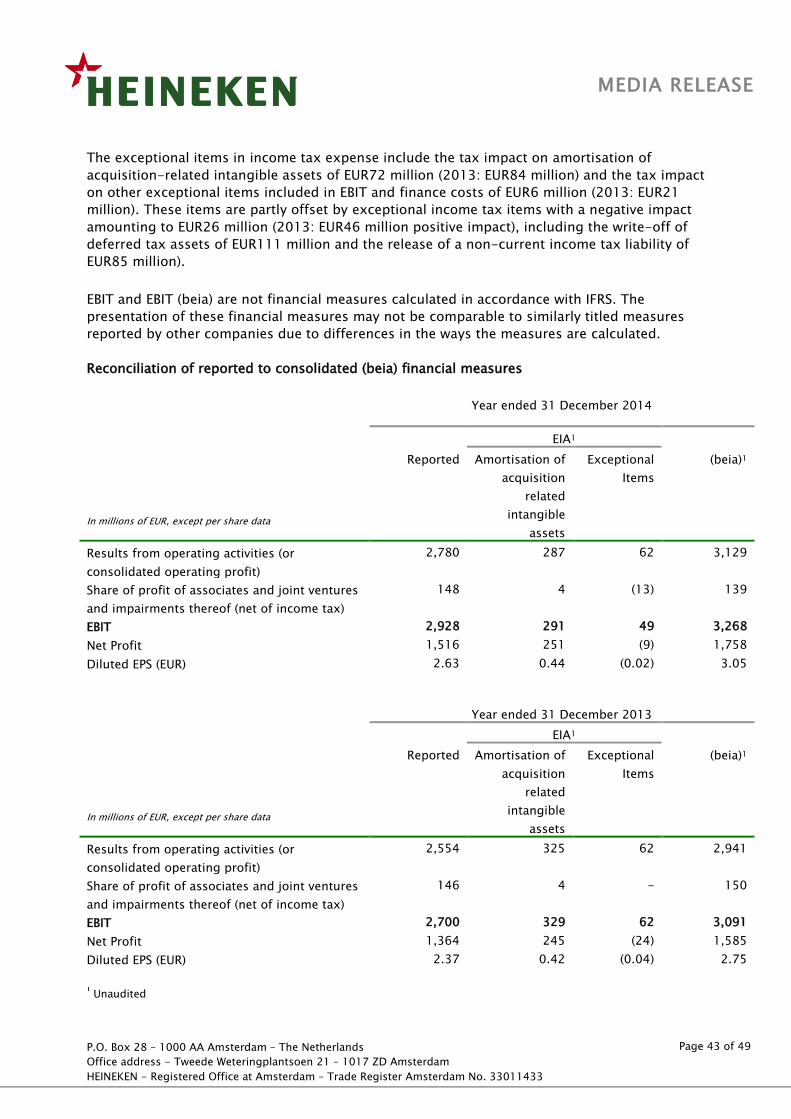
P.O. Box 28 – 1000 AA Amsterdam – The Netherlands
Office address - Tweede Weteringplantsoen 21 – 1017 ZD Amsterdam
HEINEKEN - Registered Office at Amsterdam – Trade Register Amsterdam No. 33011433
Page 43 of 49
MEDIA RELEASE
The exceptional items in income tax expense include the tax impact on amortisation of
acquisition-related intangible assets of EUR72 million (2013: EUR84 million) and the tax impact
on other exceptional items included in EBIT and finance costs of EUR6 million (2013: EUR21
million). These items are partly offset by exceptional income tax items with a negative impact
amounting to EUR26 million (2013: EUR46 million positive impact), including the write-off of
deferred tax assets of EUR111 million and the release of a non-current income tax liability of
EUR85 million).
EBIT and EBIT (beia) are not financial measures calculated in accordance with IFRS. The
presentation of these financial measures may not be comparable to similarly titled measures
reported by other companies due to differences in the ways the measures are calculated.
Reconciliation of reported to consolidated (beia) financial measures
Year ended 31 December 2014
EIA1
In millions of EUR, except per share data
Reported Amortisation of
acquisition
related
intangible
assets
Exceptional
Items
(beia)1
Results from operating activities (or
consolidated operating profit)
2,780 287 62 3,129
Share of profit of associates and joint ventures
and impairments thereof (net of income tax)
148 4 (13) 139
EBIT 2,928 291 49 3,268
Net Profit 1,516 251 (9) 1,758
Diluted EPS (EUR) 2.63 0.44 (0.02) 3.05
Year ended 31 December 2013
EIA1
In millions of EUR, except per share data
Reported Amortisation of
acquisition
related
intangible
assets
Exceptional
Items
(beia)1
Results from operating activities (or
consolidated operating profit)
2,554 325 62 2,941
Share of profit of associates and joint ventures
and impairments thereof (net of income tax)
146 4 - 150
EBIT 2,700 329 62 3,091
Net Profit 1,364 245 (24) 1,585
Diluted EPS (EUR) 2.37 0.42 (0.04) 2.75
Unaudited
P.O. Box 28 – 1000 AA Amsterdam – The Netherlands
Office address - Tweede Weteringplantsoen 21 – 1017 ZD Amsterdam
HEINEKEN - Registered Office at Amsterdam – Trade Register Amsterdam No. 33011433
Page 44 of 49
MEDIA RELEASE
A P P E N D I X 1 3
NOTES TO THE APPENDICES
Reporting entity
Heineken N.V. (the ‘Company’) is a company domiciled in the Netherlands. The address of the
Company’s registered office is Tweede Weteringplantsoen 21, Amsterdam. The financial
information contained in this document of the Company as at and for the year ended 31
December 2014 comprises the Company, its subsidiaries (together referred to as ‘HEINEKEN’
and individually as ‘HEINEKEN’ entities) and HEINEKEN’s interest in jointly controlled entities
and associates.
HEINEKEN is primarily involved in the brewing and selling of beer.
Accounting Policies
The accounting policies applied by HEINEKEN in these appendices are the same as the policies
applied by HEINEKEN in the consolidated financial statements for 2014.
The consolidated financial statements have been prepared in accordance with International
Financial Reporting Standards (IFRS) as endorsed by the EU and also comply with the financial
reporting requirements included in Part 9 of Book 2 of the Dutch Civil Code. All standards and
interpretations issued by the International Accounting Standards Board (IASB) and the
International Financial Reporting Interpretations Committee (IFRIC) effective year-end 2014
have been adopted by the EU. Consequently, the accounting policies applied
by the Company also comply fully with IFRS as issued by the IASB.
These appendices do not contain all the information required for a complete set of financial
statements, but are derived from the 2014 financial statements. The financial statements have not
yet been published and still have to be adopted by the Annual General Meeting. KPMG Accountants
N.V. has issued an unqualified auditor’s opinion on these financial statements. The financial
statements will be published on www.heinekenthecompany.com.
Outstanding shares
As at 31 December 2014 the issued share capital comprised 576,002,613 ordinary shares
(2013: 576,002,613). The ordinary shares have a par value of EUR1.60. All issued shares are
fully paid.
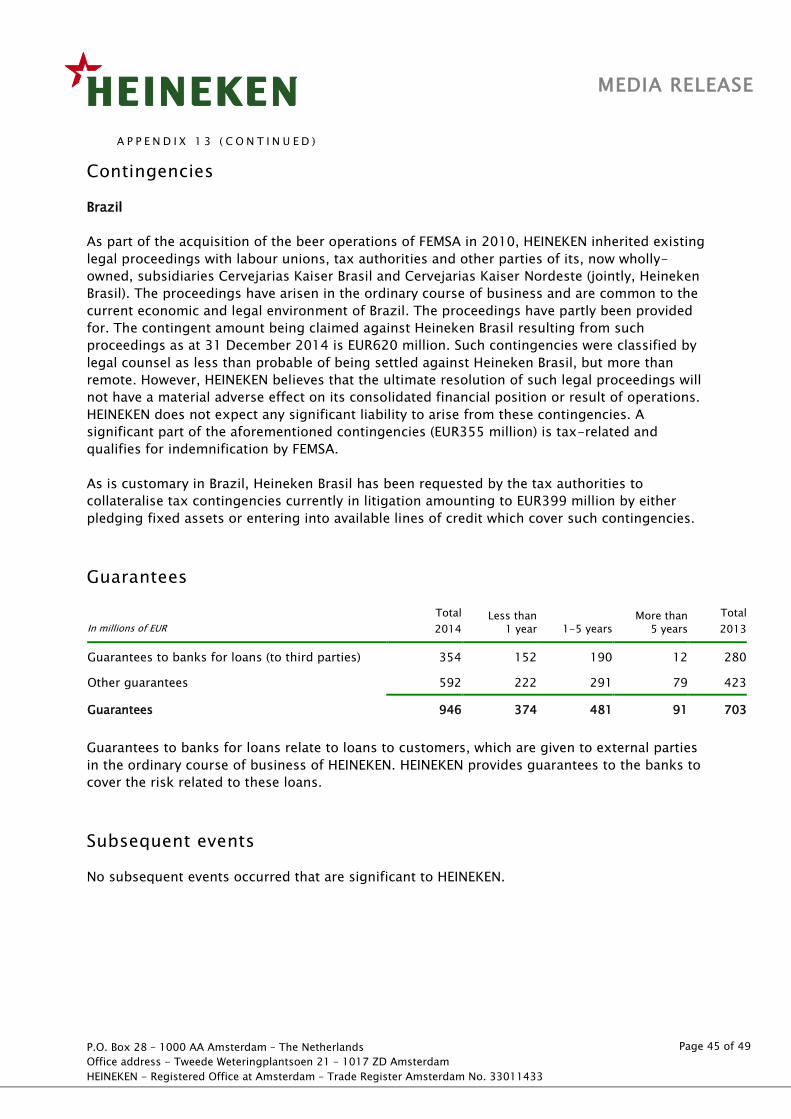
P.O. Box 28 – 1000 AA Amsterdam – The Netherlands
Office address - Tweede Weteringplantsoen 21 – 1017 ZD Amsterdam
HEINEKEN - Registered Office at Amsterdam – Trade Register Amsterdam No. 33011433
Page 45 of 49
MEDIA RELEASE
A P P E N D I X 1 3 ( C O N T I N U E D )
Contingencies
Brazil
As part of the acquisition of the beer operations of FEMSA in 2010, HEINEKEN inherited existing
legal proceedings with labour unions, tax authorities and other parties of its, now wholly-
owned, subsidiaries Cervejarias Kaiser Brasil and Cervejarias Kaiser Nordeste (jointly, Heineken
Brasil). The proceedings have arisen in the ordinary course of business and are common to the
current economic and legal environment of Brazil. The proceedings have partly been provided
for. The contingent amount being claimed against Heineken Brasil resulting from such
proceedings as at 31 December 2014 is EUR620 million. Such contingencies were classified by
legal counsel as less than probable of being settled against Heineken Brasil, but more than
remote. However, HEINEKEN believes that the ultimate resolution of such legal proceedings will
not have a material adverse effect on its consolidated financial position or result of operations.
HEINEKEN does not expect any significant liability to arise from these contingencies. A
significant part of the aforementioned contingencies (EUR355 million) is tax-related and
qualifies for indemnification by FEMSA.
As is customary in Brazil, Heineken Brasil has been requested by the tax authorities to
collateralise tax contingencies currently in litigation amounting to EUR399 million by either
pledging fixed assets or entering into available lines of credit which cover such contingencies.
Guarantees
In millions of EUR
Total
2014
Less than
1 year 1-5 years More than
5 years
Total
2013
Guarantees to banks for loans (to third parties) 354 152 190 12 280
Other guarantees 592 222 291 79 423
Guarantees 946 374 481 91 703
Guarantees to banks for loans relate to loans to customers, which are given to external parties
in the ordinary course of business of HEINEKEN. HEINEKEN provides guarantees to the banks to
cover the risk related to these loans.
Subsequent events
No subsequent events occurred that are significant to HEINEKEN.
P.O. Box 28 – 1000 AA Amsterdam – The Netherlands
Office address - Tweede Weteringplantsoen 21 – 1017 ZD Amsterdam
HEINEKEN - Registered Office at Amsterdam – Trade Register Amsterdam No. 33011433
Page 46 of 49
MEDIA RELEASE
A P P E N D I X 1 4
GLOSSARY
Acquisition-related intangible assets
Acquisition-related intangible assets are assets that HEINEKEN only recognises as part of a
purchase price allocation following an acquisition. This includes amongst others brands,
customer-related and certain contract-based intangibles.
Beia
Before exceptional items and amortisation of acquisition-related intangible assets
Cash conversion ratio
Free operating cash flow/net profit (beia) before deduction of non-controlling interests
Depletions
Sales by distributors to the retail trade
Dividend payout
Proposed dividend as percentage of net profit (beia)
Earnings per share
Basic Net profit divided by the weighted average number of shares – basic – during the year
Diluted Net profit divided by the weighted average number of shares – diluted – during the year
EBIT
Earnings before interest, taxes and net finance expenses. EBIT includes HEINEKEN’s share in net
profit of joint ventures and associates.
EBITDA
Earnings before interest, taxes, net finance expenses, depreciation and amortisation. EBITDA
includes HEINEKEN’s share in net profit of joint ventures and associates.
Effective tax rate
Income tax expense expressed as a percentage of the profit before income tax, adjusted for
share of profit of associates and joint ventures and impairments thereof (net of income tax)
Eia
Exceptional items and amortisation of acquisition-related intangible assets
P.O. Box 28 – 1000 AA Amsterdam – The Netherlands
Office address - Tweede Weteringplantsoen 21 – 1017 ZD Amsterdam
HEINEKEN - Registered Office at Amsterdam – Trade Register Amsterdam No. 33011433
Page 47 of 49
MEDIA RELEASE
A P P E N D I X 1 4 ( C O N T I N U E D )
Free operating cash flow
This represents the total of cash flow from operating activities, and cash flow from operational
investing activities
Innovation rate
From 1 January 2013, the innovation rate is calculated as revenues generated from innovations
(introduced in the past 40 quarters for a new category, 20 quarters for a new brand and 12
quarters for all other innovations, excluding packaging renovations) divided by total revenue.
Net debt
Non-current and current interest-bearing loans and borrowings and bank overdrafts less
investments held for trading and cash
Net debt/EBITDA (beia) ratio
The ratio is based on a 12 month rolling calculation for EBITDA (beia)
Net profit
Profit after deduction of non-controlling interests (profit attributable to equity holders of the
Company)
Organic growth
Growth excluding the effect of foreign currency translational effects, consolidation changes,
exceptional items and amortisation of acquisition-related intangible assets
Organic volume growth
Growth in volume, excluding the effect of consolidation changes
Operating profit
Consolidated operating profit Results from operating activities
Group operating profit (beia) Consolidated operating profit (beia) plus attributable share of operating profit (beia) from joint
ventures and associates
Profit
Total profit of the Group before deduction of non-controlling interests
P.O. Box 28 – 1000 AA Amsterdam – The Netherlands
Office address - Tweede Weteringplantsoen 21 – 1017 ZD Amsterdam
HEINEKEN - Registered Office at Amsterdam – Trade Register Amsterdam No. 33011433
Page 48 of 49
MEDIA RELEASE
A P P E N D I X 1 4 ( C O N T I N U E D )
®
All brand names mentioned in this report, including those brand names not marked by an ®,
represent registered trademarks and are legally protected
Region
A region is defined as HEINEKEN’s managerial classification of countries into geographical units
Revenue
Consolidated revenue Net realised sales proceeds
Group revenue (beia) Consolidated revenue plus attributable share of revenue from joint ventures and associates
Volume
Consolidated beer volume
100 per cent of beer volume produced and sold by consolidated companies
Group beer volume Consolidated beer volume plus attributable share of beer volume from joint ventures and
associates
Group total volume
Total consolidated volume plus attributable share of volume from joint ventures and associates
Heineken® volume 100 per cent of beer volume sold of the Heineken® brand by consolidated companies, joint
ventures and associates and produced and sold under license by third parties
Heineken® volume in premium segment
Heineken® volume excluding Heineken® volume in the Netherlands
Licensed beer & non-beer volume
Cider, soft drink and non-beer volume sold in consolidated companies, joint ventures and
associates, as well as HEINEKEN’s brands produced and sold under license by third parties
Third party products volume Volume of third party products sold through consolidated companies, joint ventures and
associates
Total consolidated volume 100 per cent of volume produced and sold by consolidated companies (including beer, cider,
soft drinks and other beverages), volume of third party products and volume of HEINEKEN’s
brands produced and sold under license by third parties
P.O. Box 28 – 1000 AA Amsterdam – The Netherlands
Office address - Tweede Weteringplantsoen 21 – 1017 ZD Amsterdam
HEINEKEN - Registered Office at Amsterdam – Trade Register Amsterdam No. 33011433
Page 49 of 49
MEDIA RELEASE
A P P E N D I X 1 4 ( C O N T I N U E D )
Weighted average number of shares
Basic Weighted average number of outstanding shares
Diluted Weighted average number of outstanding shares and the number of Long-Term Variable award
shares held