gas market
TRANSCRIPT

UNDERSTANDING NATURAL GAS MARKETS
Mohammad NaserifardMSc student of Oil & Gas Economics at PUT
Fall 2015

Table of Contents

Understanding Natural Gas Markets 3
Overview
Natural Gas is an Important Source of Energy for the United States.
Natural gas is an attractive fuel because it is clean burning and efficient, andample supplies of natural gas are available from domestic resources.
Reason I
The prospect of ample natural gas supplies
Reason II
continued low pricesReason III
the favorable environmental and economic position of natural gas-fired electric generation plants
Growing U.S. demand for naturalgas, especially in the electric andindustrial sectors, and potentiallyfor export as liquefied natural gas(LNG).

Understanding Natural Gas Markets 4

Understanding Natural Gas Markets
The important trends now affecting the industry include the following:
‒ U.S. natural gas demand is increasingly served by domestic production from unconventional shale gassources rather than imported natural gas from Canada and other conventional supplies.
‒ Natural gas use for electricity generation is poised to increase due to low natural gas prices andexpectations that coal-fired power plants will continue to be retired due to environmental regulations.Low natural gas prices are also expected to drive demand growth in the industrial sector.
‒ The growth in shale gas production in shifting flows on the U.S. interstate pipeline network.
‒ The substantial production increases, and low prices in the U.S. relative to overseas, are leading to thedevelopment of both LNG and pipeline export projects. These projects could result in the U.S. becominga net exporter of natural gas, whereas historically the U.S. was a net importer due to its reliance onCanadian natural gas supplies in meeting domestic consumption.
5

Understanding Natural Gas Markets
Key points:
• The shale gas revolution has led to U.S. natural gas supply growth that has exceededdemand growth. As a result, Canadian imports and other conventional supplies havebeen displaced, prices have fallen substantially and price volatility has declined tosome extent.
• The last large price spike in the summer of 2008 gave way to a substantial price declineas shale gas production increased and the economic recession brought on by the globalfinancial crisis decreased the demand for natural gas.
• Demand has increased since 2009, domestic shale production has increased evenfaster. The result has been relatively low prices over the past several years, but not aslow as the prices experienced during most of the 1990s.
6

Understanding Natural Gas Markets 7

Understanding Natural Gas Markets
The North American Natural Gas Marketplace
8
Natural gas provides 27% of the marketable energy
consumed in the United States.
Natural gas use in applications including
cooking, residential and
commercial heating, industrial process feed stocks, and electricity
generation
CH4
CH4 CH4

Understanding Natural Gas Markets
Physical Structure of the U.S.
Natural Gas Industry:
‒ Exploration and Production
‒ Processing
‒ Transportation
‒ Storage
‒ Local Distribution
‒ Liquefied Natural Gas
9
PHYSICAL FLOW OF NATURAL GAS

Understanding Natural Gas Markets
The U.S. currently imports less than one percent of its natural gas in the form ofLNG (compared to a peak of three percent in 2007) primarily from the Everettterminal near Boston and the Elba Island terminal in Georgia, two of elevenexisting U.S. LNG import terminals.
The growth in shale gas production in the U.S. has resulted in proposals todevelop LNG export terminals to liquefy and ship natural gas produced in theU.S. to overseas markets.
10

Understanding Natural Gas Markets 11
SELECTED U.S.NATURAL GAS PRODUCING REGIONS AND PIPELINE FLOWS
4
Source: Recreated based on graphics from EIA.
5,000
4,0003,0002,0001,0000
2012 Flow Levels(Billion Cubic Feet)=Direction of the Flow=Bi-directional
OFFSHORE UNDISCOVERED TECHNICALLY RECOVERABLE FEDERAL OIL AND NATURAL GAS RESOURCES MAP
5
4.7 Bbl37.5 Tcf
Bbl= Billion BarrelsTcf= Trillion Cubic Feet
Source: API primer “Offshore Access to Oil and Natural Gas Resources," July 2014.
87%of federal
offshore acreage is offlimits to development

Understanding Natural Gas Markets
‒ Once natural gas is produced and processed, it is injectedinto pipelines for transmission to end-use customers andlocal distribution companies.
‒ Transmission and distribution costs are a significantportion of the total cost of delivered natural gas.
‒ The rates charged by both natural gas pipelines and localdistribution companies are regulated at the federal andstate level.
12

Understanding Natural Gas Markets
In recent years, the cost of the natural gas itself has decreased from 59% in 2007-2008 to 28% in 2011-2012 of the delivered natural gas cost paid by residential consumers during the heating season(November through March), while transmission and distribution charges have increased from 41% to72% of the consumer’s average heating season cost.
See Figure 6
13

Understanding Natural Gas Markets
Natural Gas Supply
• Shales are fine-grained sedimentary rocks that can be rich sources of petroleum and natural gas.
• Technically recoverable natural gas resources in the U.S. have been estimated at 2,431 Tcf currently, compared to 1,594 Tcf in 2005
• The largest shale production is from the Marcellus (35%), Haynesville (12%), Barnett (14%), and Eagle Ford (12%) shale formations (with all other shales combining to total roughly 27%).
14

Understanding Natural Gas Markets
Figure 7 shows the substantial growth in annual shale gas production from less than 5 Bcf/d inearly 2007 to nearly 30 Bcf/d more recently.
15
Understanding Natural Gas Markets
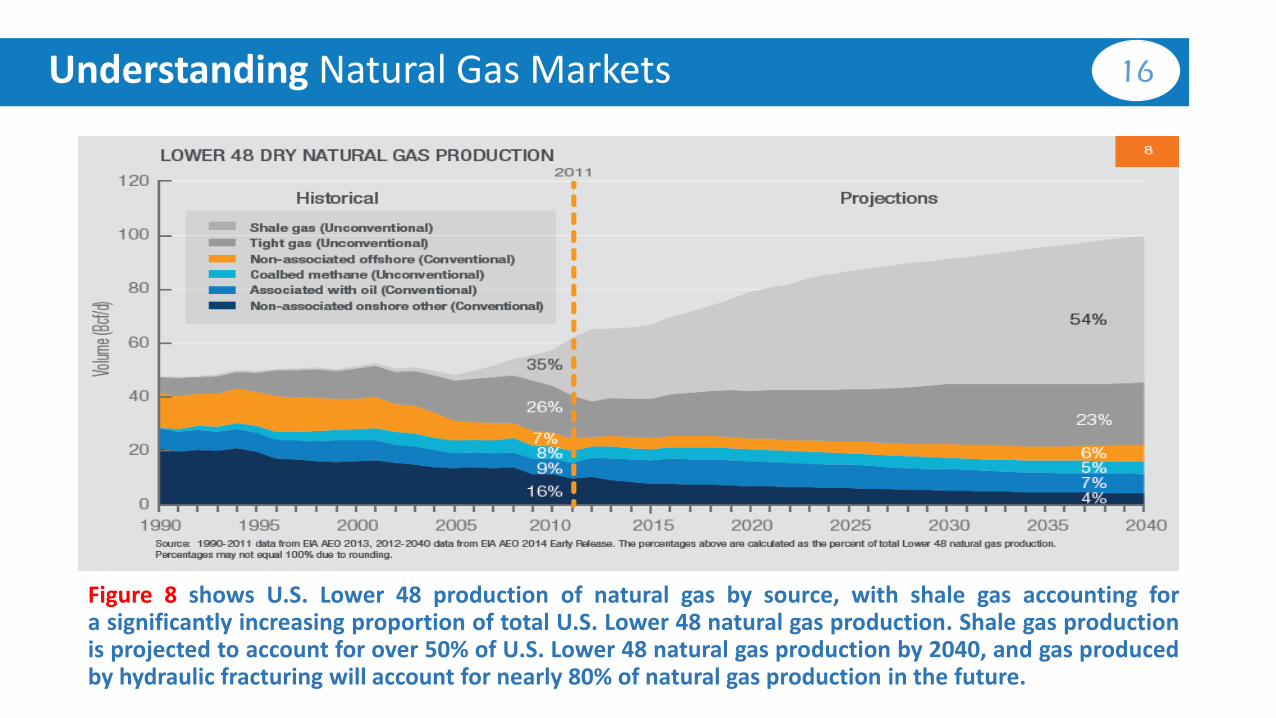
Figure 8 shows U.S. Lower 48 production of natural gas by source, with shale gas accounting fora significantly increasing proportion of total U.S. Lower 48 natural gas production. Shale gas productionis projected to account for over 50% of U.S. Lower 48 natural gas production by 2040, and gas producedby hydraulic fracturing will account for nearly 80% of natural gas production in the future.
16

Understanding Natural Gas Markets
Figure 9 show that total natural gas production has continued to grow even as rigs increasingly have been directed towards oil drilling and away from natural gas.
17

Understanding Natural Gas Markets
• An important factor that affects drilling activity in the U.S. is the price of natural gasliquids (NGLs) that are produced in some areas as a byproduct of natural gasproduction.
• NGLs are removed from the natural gas stream at natural gas processing andfractionation plants and sold separately.
• High NGL prices (which typically have followed the trends in oil rather than natural gasprices) make it profitable to separate NGLs from natural gas and sell them as aseparate product.
18

Understanding Natural Gas Markets
Figure 10 shows that Recent NGL prices have been high relative to natural gas prices, which hasprovided a strong incentive for producers to shift their focus from dry gas plays to liquids-rich gasplays.
19

Understanding Natural Gas Markets
Historically, U.S. natural gas consumption exceeded production, and the difference was made up by naturalgas imports by pipeline from Canada as well as a relatively small amount of LNG imports from overseaslocations. With the growth in domestic shale gas supplies, imports have been declining and forecastsindicate that the U.S. will become a net exporter of natural gas later this decade.
These exports will likely include pipeline exports to Mexico, and exports in the form of LNG. Net importsfrom Canada are likely to continue, but at substantially lower levels than in the past .
See Figure 11 & 12
20

Understanding Natural Gas Markets
Natural Gas Demand Recent declines in natural gas prices are also explained by the fact that the demand for natural gas has not grown
as rapidly as the growth in supplies.
overall consumption was flat or declining between 2000 and 2006, with some demand growth occurring in the 2007-2013 period.
Residential and commercial use of natural gas has been relatively steady over the 2000-2013 period.
Industrial natural gas demand generally declined during the 2000-2009 period in response to high and volatile gas prices, while natural gas demand for power generation increased during this period, offsetting the declines in industrial demand.
In 2012, natural gas use for power generation surged as a result of low natural gas prices. Low prices caused natural gas-fired electricity generating facilities to run more often and in some cases ahead of coal-fired plants.
Natural gas demand is highly “seasonal” in nature, with significant “peaks” in the winter heating season, as illustrated in Figure 14.
21

Understanding Natural Gas Markets 22

Understanding Natural Gas Markets
Figure 14 shows the pattern of natural gas production and storage. The relatively flat light blue line showsnatural gas production and imports into the United States. The figure shows production remains essentiallyflat throughout the year, but, as the darker blue line shows, consumption rises dramatically in the winter andfalls in the spring through the early fall.
23

Understanding Natural Gas Markets
The low natural gas prices are leading many analysts to believe that there will be substantialnatural gas demand growth in the future, especially in the electric and industrial sectors
24

Understanding Natural Gas Markets 25
• The combination of low natural gas prices and emerging environmental regulations is leading to the retirement of a significant amount of coal-fired generation capacity.
On the Electric side
• The low natural gas prices are also causing a resurgence in industrial activity that may lead to increased natural gas demand
On the industrial
side
The effects of the low prices of natural gas:
there will be substantial natural gas demand growth in the future
Understanding Natural Gas Markets
Natural Gas Exports Low natural gas prices in North America are leading to proposals for the development of large
LNG export projects. LNG export projects have been announced on the Gulf Coast, East Coast,and West Coast of the United States, as well as in Alaska and British Columbia.
How many of LNG export projects advance to the construction phase is uncertain:
– Uncertainty in how much LNG demand there will be from overseas countries.
– These projects require substantial capital
– These projects also require approval from regulatory bodies.
– Some projects also face certain infrastructure challenges that may put them at a disadvantage.
– It is expected that the U.S. also will export natural gas to Mexico and Canada
26

Understanding Natural Gas Markets
Figure 16 shows the relationship between U.S. natural gas prices at Henry Hub and oilprices as measured by the Brent benchmark world oil price. Starting around 2009, U.S.natural gas prices began to disconnect substantially from oil prices as a result of theincrease in shale gas production.
27

Understanding Natural Gas Markets
How Natural Gas is Traded• The natural gas industry in the United States is highly competitive, with literally thousands of
producers.
• Some producers have the ability to market their natural gas and may sell it directly to localdistribution companies or to large industrial buyers of natural gas.
• Other producers sell their gas to marketers who have the ability to aggregate natural gas intoquantities that fit the needs of different types of buyers and to transport gas to their buyers.
• Marketers may be large or small and sell to local distribution companies or to commercial orindustrial customers connected directly to pipelines or served by local distribution companies.
• Marketers and other buyers and sellers of natural gas are able to use financial instruments traded onexchanges to hedge the risks associated with price volatility.
28

Understanding Natural Gas Markets 29
Figure 17 shows schematically some of the types of natural gas transactions that take place as gasmakes its way from the fields where it is produced to end users’ burner tips.

Understanding Natural Gas Markets
• Most residential and commercialcustomers purchase natural gasfrom a local distribution company.
• Many industrial customers havethe option to purchase natural gasfrom a marketer or producerinstead of from the distributioncompany.
• Figure 18 shows some of thepoints where natural gas forphysical delivery is actively tradedin the continental United Statesand Canada.
30

Understanding Natural Gas Markets
Futures and Other Financial Contracts
• Natural gas derivatives are traded on the New York Mercantile Exchange.
• A NYMEX natural gas futures contract requires the seller to deliver (and the buyer totake delivery of) natural gas at the contractually agreed price, in a specified futuremonth, at the Henry Hub.
• Derivatives such as the NYMEX futures contract make it possible for marketparticipants to reduce the risk that results from highly volatile natural gas prices in thephysical market.
31

Understanding Natural Gas Markets
Figure 19 shows the number of natural gas contracts traded on the NYMEX each year between 1990 and 2013.
32

Understanding Natural Gas Markets
• Figure 20 shows some of the recentmovement in natural gas futures pricesat different points in time over the pastfew years.
• Each line in the figure shows prices fornatural gas to be delivered in each ofthe next 36 months.
• In June 2008, before shale suppliesstarted coming on line in substantialquantities, the market was expectingrelatively high prices with significantpeaks during the winter period versusthe summer period. More recently, aslarger quantities of shale productionhave come on line, market participantsexpected lower prices to prevail thathave less of a winter peak than was thecase historically.
33

Understanding Natural Gas Markets
Conclusion: A New Era For U.S. Natural Gas Markets
– The U.S. natural gas industry has changed dramatically as a result of technological advancements that haveresulted in increasing domestic production, especially from shale resources.
– These new supplies of natural gas have resulted in lower prices and reduced price volatility, and expectationsof increasing demand.
– Natural gas use for electricity generation is expected to grow, in part due to the expected retirement of somecoal-fired generation capacity.
– Industrial consumption of natural gas is also expected to increase due to a resurgence of petrochemicalplants, especially in the U.S. Gulf Coast.
– Low domestic prices relative to the prices available in world markets are also leading to proposals to exportnatural gas as LNG.
– The emergence of shale gas in abundance has profoundly changed the market for natural gas in the U.S. inrecent years, and perhaps for the foreseeable future.
34

Understanding Natural Gas Markets 34
Thanks for your listening