gc nirvana - software development conference · gc nirvana high throughput, ... ─ our appliances...
TRANSCRIPT
Gil Tene, CTO & Co-Founder Azul systems
GC Nirvana High throughput, low latency, and lots of state, all at the same time
©2010 Azul Systems, Inc.
2 2
About the speaker Gil Tene (CTO), Azul Systems
• At Azul, we deal with concurrent GC on a daily basis
• Azul makes Java scalable thru virtualization ─ We make physical (Vega™) and Virtual (Zing™) appliances ─ Our appliances power JVMs on Linux, Solaris, AIX, HPUX, … ─ Production installations ranging from 1GB to 300GB+ of heap
─ Zing VM instances smoothly scale to 100s of GB, 10s of cores
• Concurrent GC has always been a must in our space ─ It’s now a must in everyone’s space - can’t scale without it
• Focused on concurrent GC for the past 8 years ─ Azul’s GPGC designed for robustness, low sensitivity
©2010 Azul Systems, Inc.
3 3
Azul Systems Java For a Virtualized World
• Founded in 2002, Zing is Azul’s 4th generation product • Privately held with offices around the globe • Numerous industry firsts:
─ Segmented JVM, pauseless GC, Elastic memory
• Proven, mission-critical deployments in >70 global 2000 accounts
• Recognized innovator with award-winning technology ─ 28 patents issued, 23 pending
©2010 Azul Systems, Inc.
4 4
The GC Trifecta – Latency, Throughput, Size
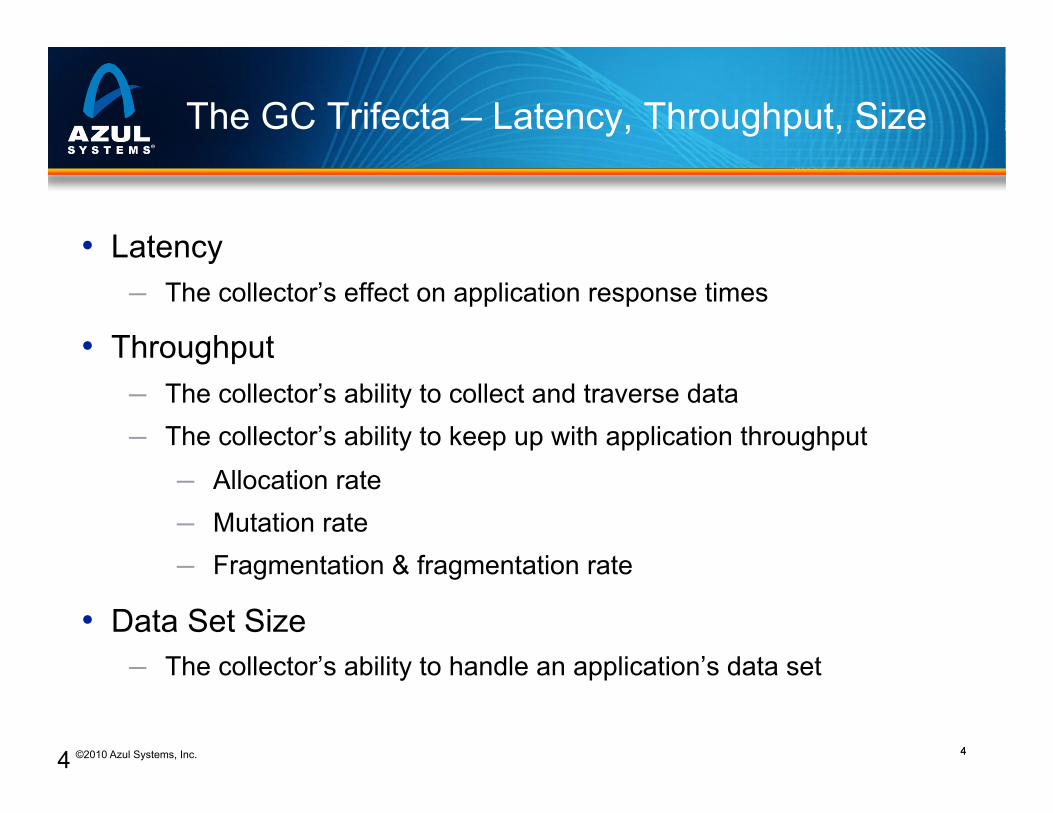
• Latency ─ The collector’s effect on application response times
• Throughput ─ The collector’s ability to collect and traverse data ─ The collector’s ability to keep up with application throughput
─ Allocation rate ─ Mutation rate ─ Fragmentation & fragmentation rate
• Data Set Size ─ The collector’s ability to handle an application’s data set
4
©2010 Azul Systems, Inc.
5
Application memory
©2010 Azul Systems, Inc.
6 6
Memory.
F How many of you use heap sizes of:
F Larger than ½ GB?
F Larger than 1 GB?
F Larger than 2 GB?
F Larger than 4 GB?
F Larger than 10 GB?
F Larger than 20 GB?
F Larger than 100 GB?
©2010 Azul Systems, Inc.
7 7
Why ~2-4GB? It’s all about GC (and only GC)
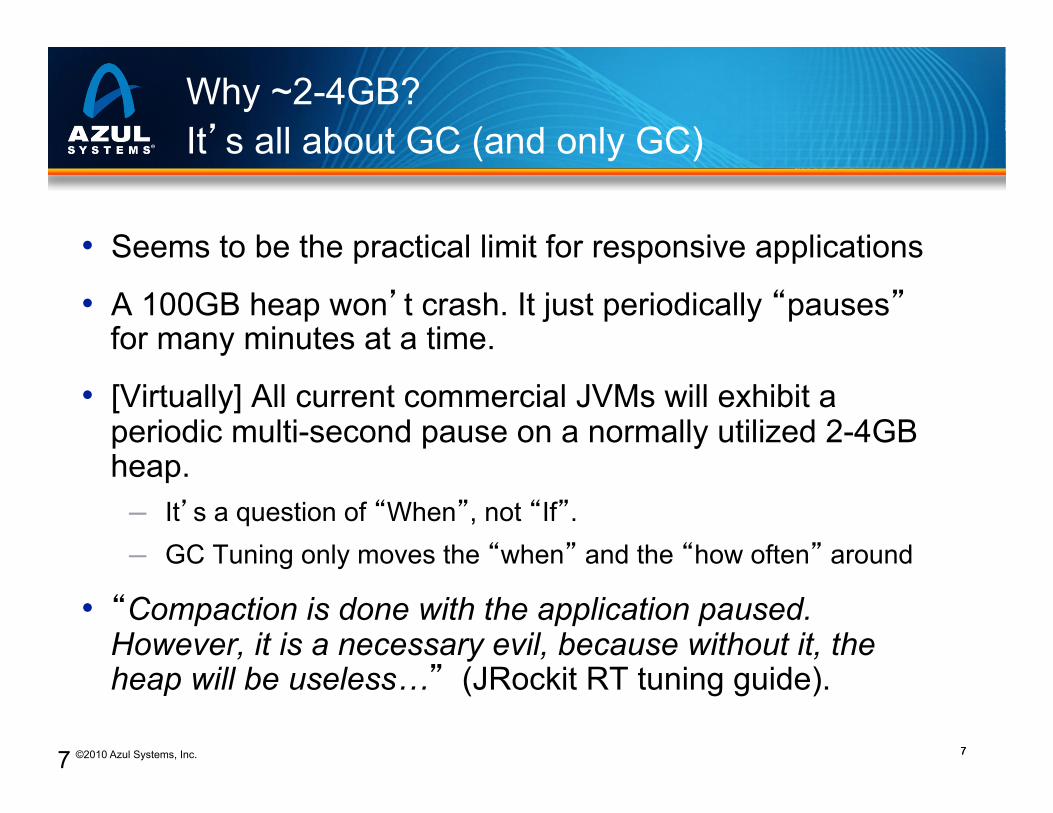
• Seems to be the practical limit for responsive applications
• A 100GB heap won’t crash. It just periodically “pauses” for many minutes at a time.
• [Virtually] All current commercial JVMs will exhibit a periodic multi-second pause on a normally utilized 2-4GB heap. ─ It’s a question of “When”, not “If”. ─ GC Tuning only moves the “when” and the “how often” around
• “Compaction is done with the application paused. However, it is a necessary evil, because without it, the heap will be useless…” (JRockit RT tuning guide).
7
©2010 Azul Systems, Inc.
8 8
Maybe 2-4GB is simply enough?
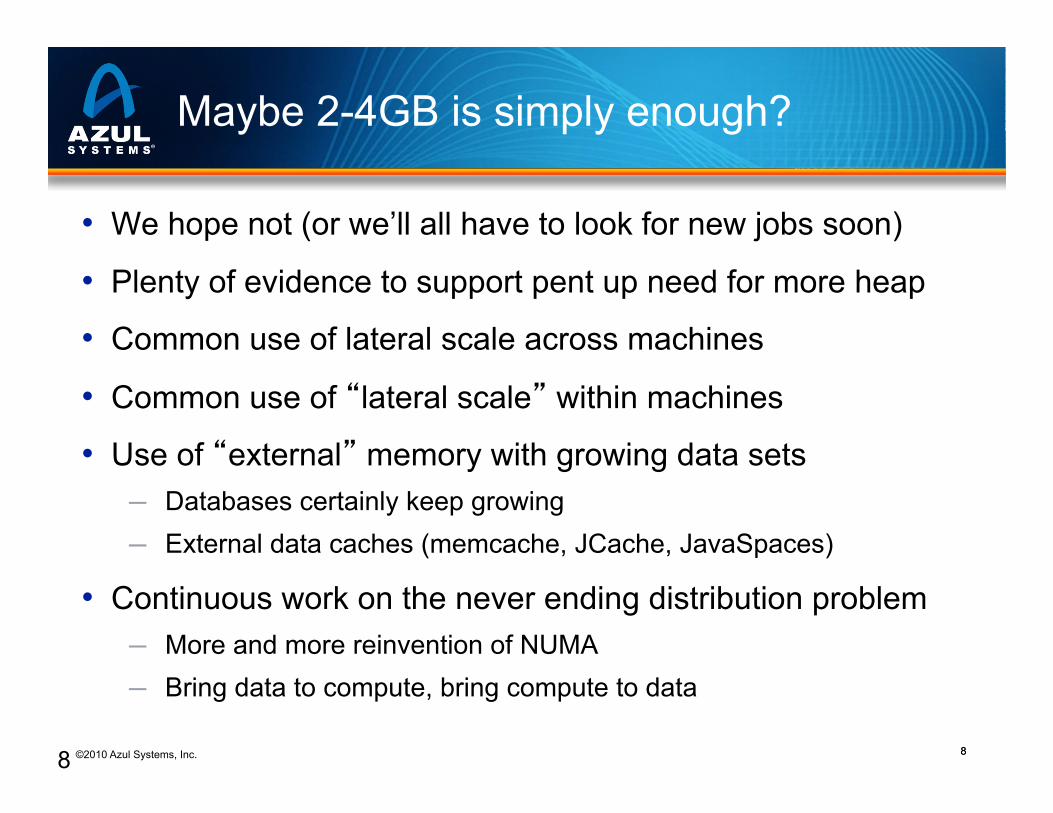
• We hope not (or we’ll all have to look for new jobs soon)
• Plenty of evidence to support pent up need for more heap
• Common use of lateral scale across machines
• Common use of “lateral scale” within machines
• Use of “external” memory with growing data sets ─ Databases certainly keep growing ─ External data caches (memcache, JCache, JavaSpaces)
• Continuous work on the never ending distribution problem ─ More and more reinvention of NUMA ─ Bring data to compute, bring compute to data
8
©2010 Azul Systems, Inc.
9 9
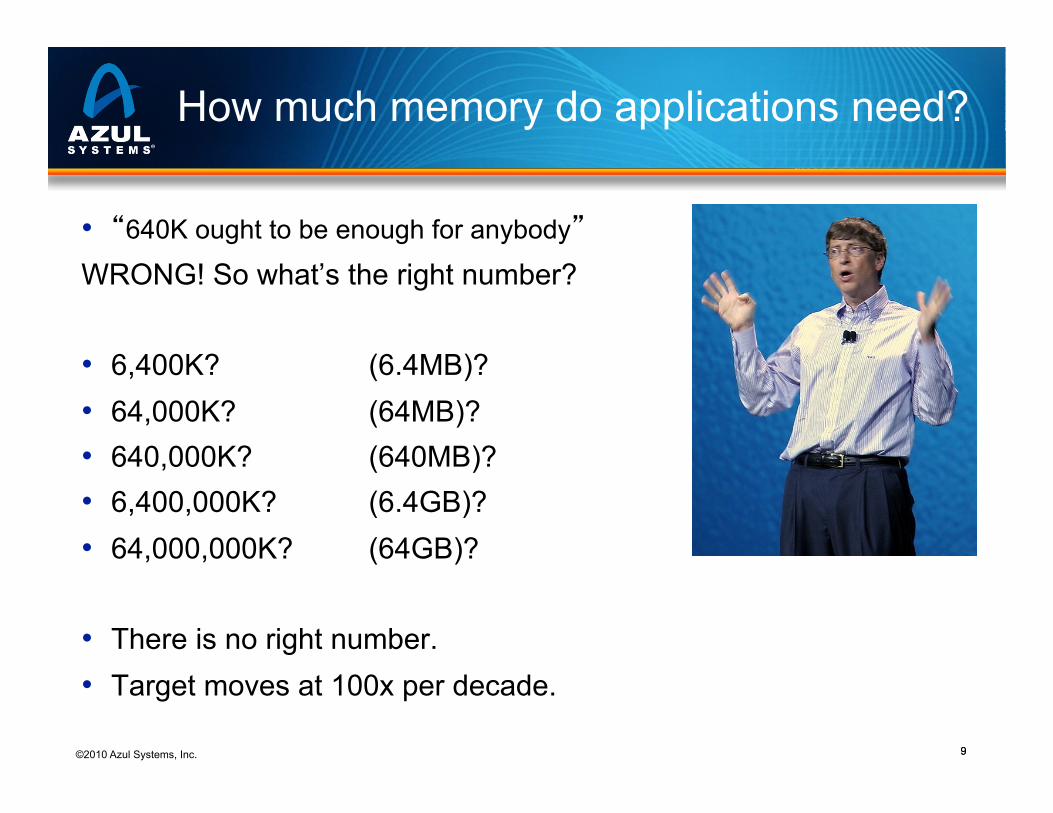
How much memory do applications need?
• “640K ought to be enough for anybody” WRONG! So what’s the right number?
• 6,400K? (6.4MB)? • 64,000K? (64MB)? • 640,000K? (640MB)? • 6,400,000K? (6.4GB)? • 64,000,000K? (64GB)?
• There is no right number. • Target moves at 100x per decade.
©2010 Azul Systems, Inc.
10 10 10
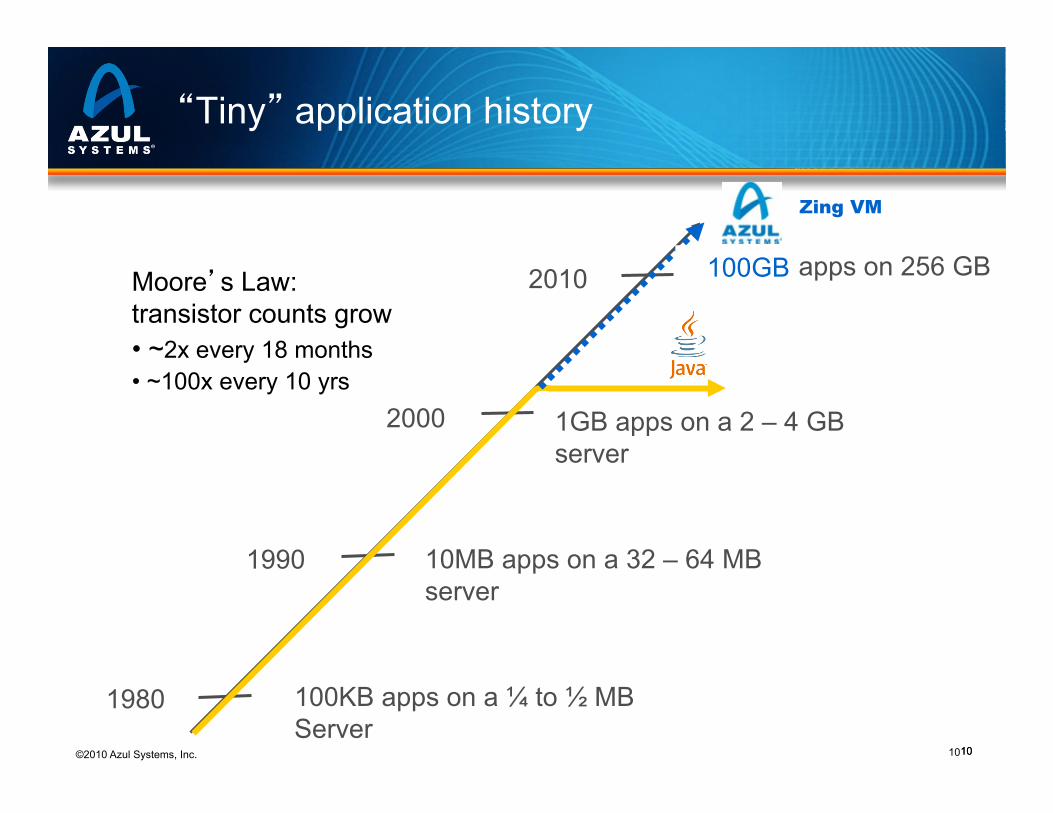
“Tiny” application history
1980
1990
2000
2010
100KB apps on a ¼ to ½ MB Server
10MB apps on a 32 – 64 MB server
1GB apps on a 2 – 4 GB server
??? GB apps on 256 GB Moore’s Law: transistor counts grow • ~2x every 18 months • ~100x every 10 yrs
100GB
Zing VM
©2010 Azul Systems, Inc.
11 11
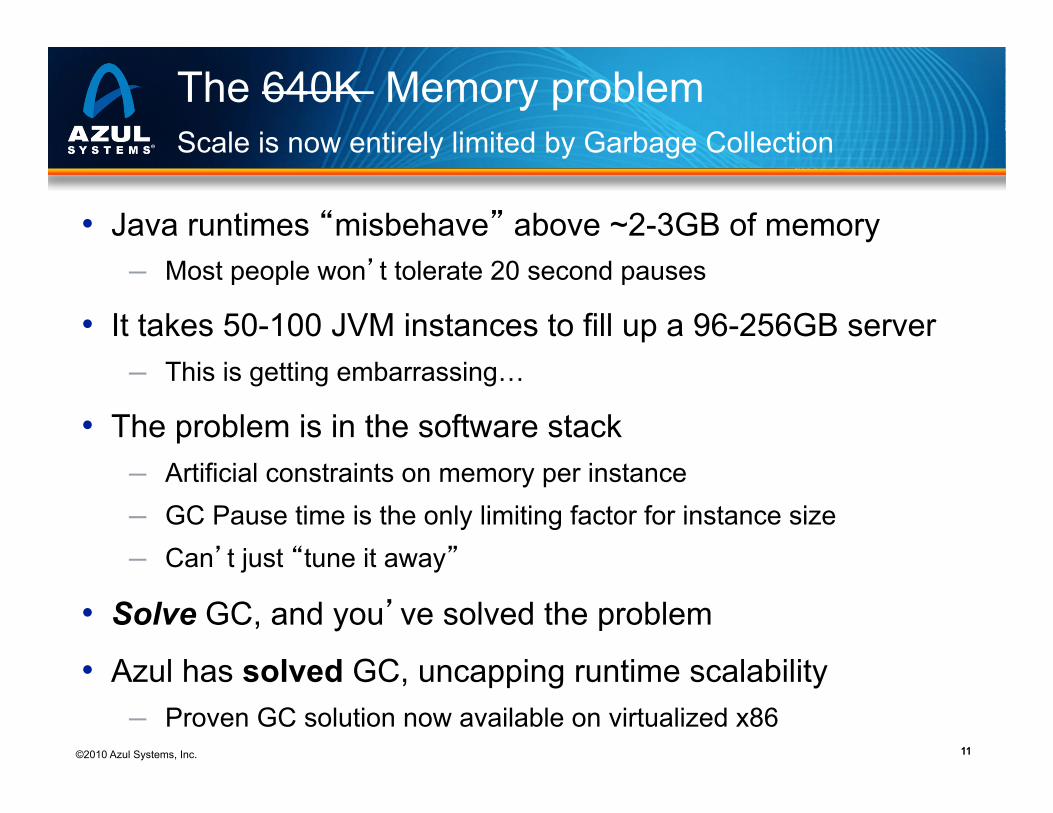
The 640K Memory problem Scale is now entirely limited by Garbage Collection
• Java runtimes “misbehave” above ~2-3GB of memory ─ Most people won’t tolerate 20 second pauses
• It takes 50-100 JVM instances to fill up a 96-256GB server ─ This is getting embarrassing…
• The problem is in the software stack ─ Artificial constraints on memory per instance ─ GC Pause time is the only limiting factor for instance size ─ Can’t just “tune it away”
• Solve GC, and you’ve solved the problem
• Azul has solved GC, uncapping runtime scalability ─ Proven GC solution now available on virtualized x86

©2010 Azul Systems, Inc.
12
Some Terminology
©2010 Azul Systems, Inc.
13 13
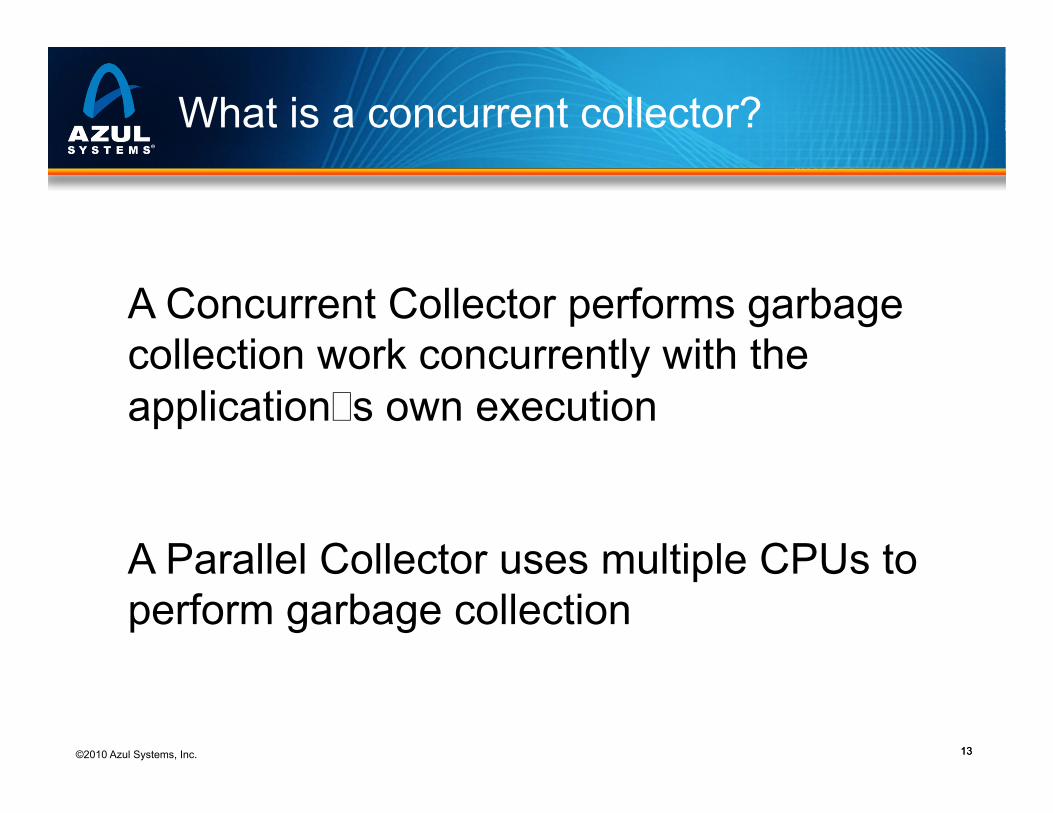
What is a concurrent collector?
A Concurrent Collector performs garbage collection work concurrently with the application’s own execution
A Parallel Collector uses multiple CPUs to perform garbage collection
©2010 Azul Systems, Inc.
14
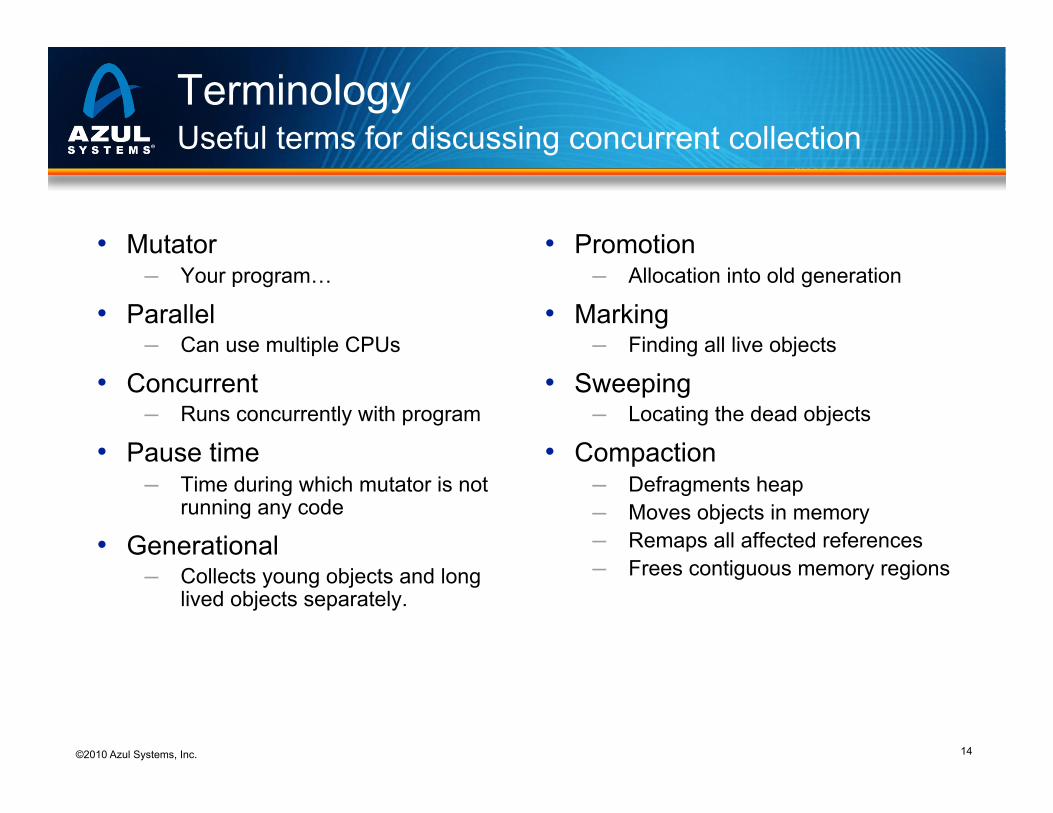
Terminology Useful terms for discussing concurrent collection
• Mutator ─ Your program…
• Parallel ─ Can use multiple CPUs
• Concurrent ─ Runs concurrently with program
• Pause time ─ Time during which mutator is not
running any code
• Generational ─ Collects young objects and long
lived objects separately.
• Promotion ─ Allocation into old generation
• Marking ─ Finding all live objects
• Sweeping ─ Locating the dead objects
• Compaction ─ Defragments heap ─ Moves objects in memory ─ Remaps all affected references ─ Frees contiguous memory regions
©2010 Azul Systems, Inc.
15
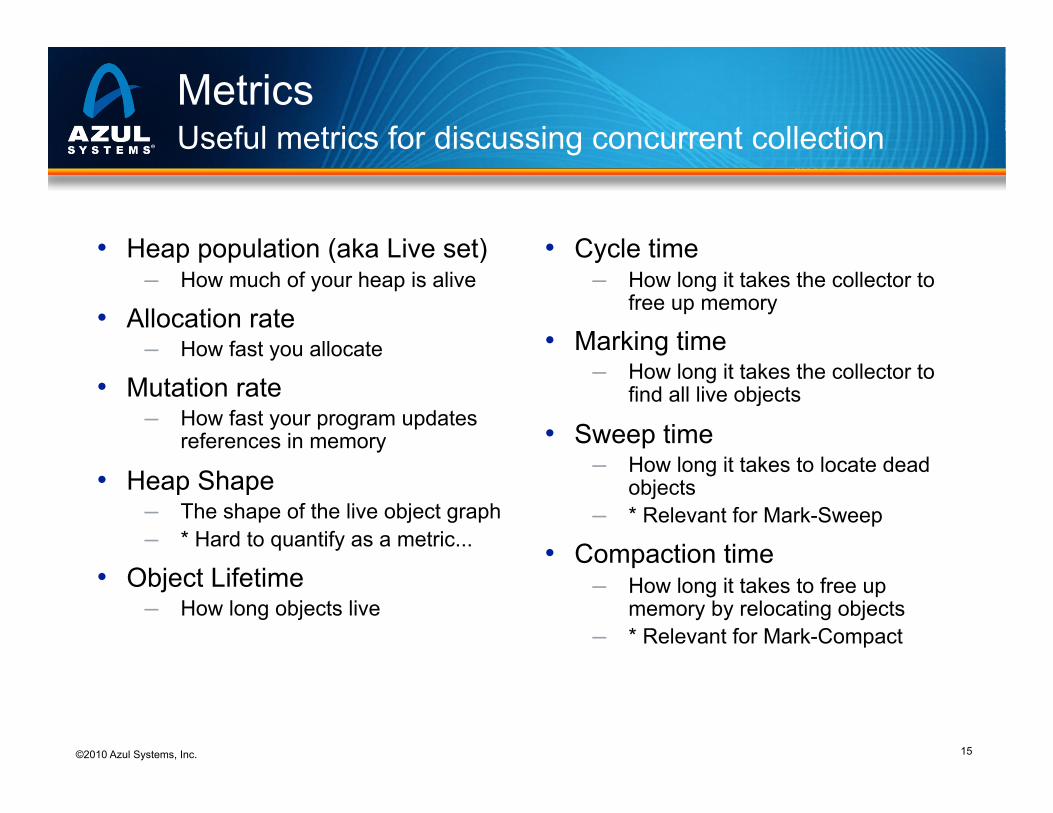
Metrics Useful metrics for discussing concurrent collection
• Heap population (aka Live set) ─ How much of your heap is alive
• Allocation rate ─ How fast you allocate
• Mutation rate ─ How fast your program updates
references in memory
• Heap Shape ─ The shape of the live object graph ─ * Hard to quantify as a metric...
• Object Lifetime ─ How long objects live
• Cycle time ─ How long it takes the collector to
free up memory
• Marking time ─ How long it takes the collector to
find all live objects
• Sweep time ─ How long it takes to locate dead
objects ─ * Relevant for Mark-Sweep
• Compaction time ─ How long it takes to free up
memory by relocating objects ─ * Relevant for Mark-Compact
©2010 Azul Systems, Inc.
16 16
The “hard” things to do in GC
• Robust concurrent marking ─ Refs keep changing ─ Multi-pass marking sensitive to mutation rate ─ Weak, Soft, Final refs “hard” to deal with concurrently
• [Concurrent] Compaction… ─ Its not the moving of the objects… ─ It’s the fixing of all those refs that point to them ─ How do you deal with a mutator looking at a stale ref? ─ If you can’t, then remapping is a STW operation
• Without solving Compaction, GC won’t be solved.
©2010 Azul Systems, Inc.
17 17
Can’t ignore “bad” GC Compaction? What Compaction?
©2010 Azul Systems, Inc.
18 18
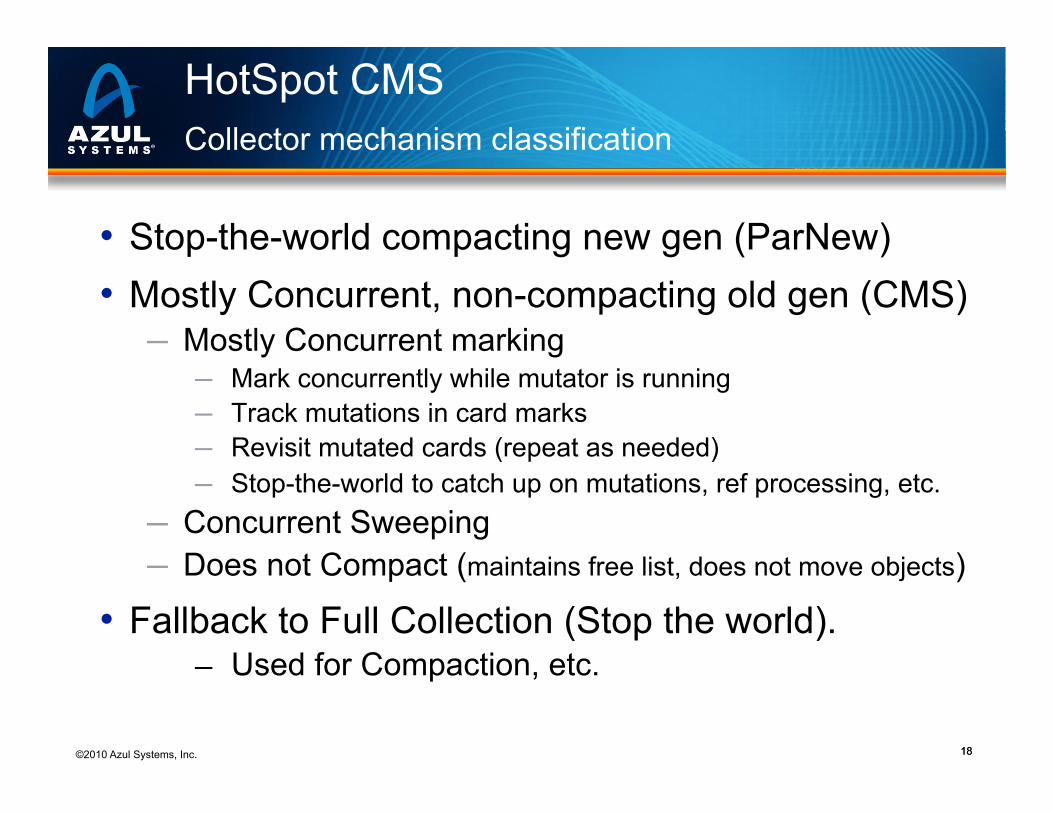
HotSpot CMS Collector mechanism classification
• Stop-the-world compacting new gen (ParNew) • Mostly Concurrent, non-compacting old gen (CMS)
─ Mostly Concurrent marking ─ Mark concurrently while mutator is running ─ Track mutations in card marks ─ Revisit mutated cards (repeat as needed) ─ Stop-the-world to catch up on mutations, ref processing, etc.
─ Concurrent Sweeping ─ Does not Compact (maintains free list, does not move objects)
• Fallback to Full Collection (Stop the world). ─ Used for Compaction, etc.
©2010 Azul Systems, Inc.
19 19
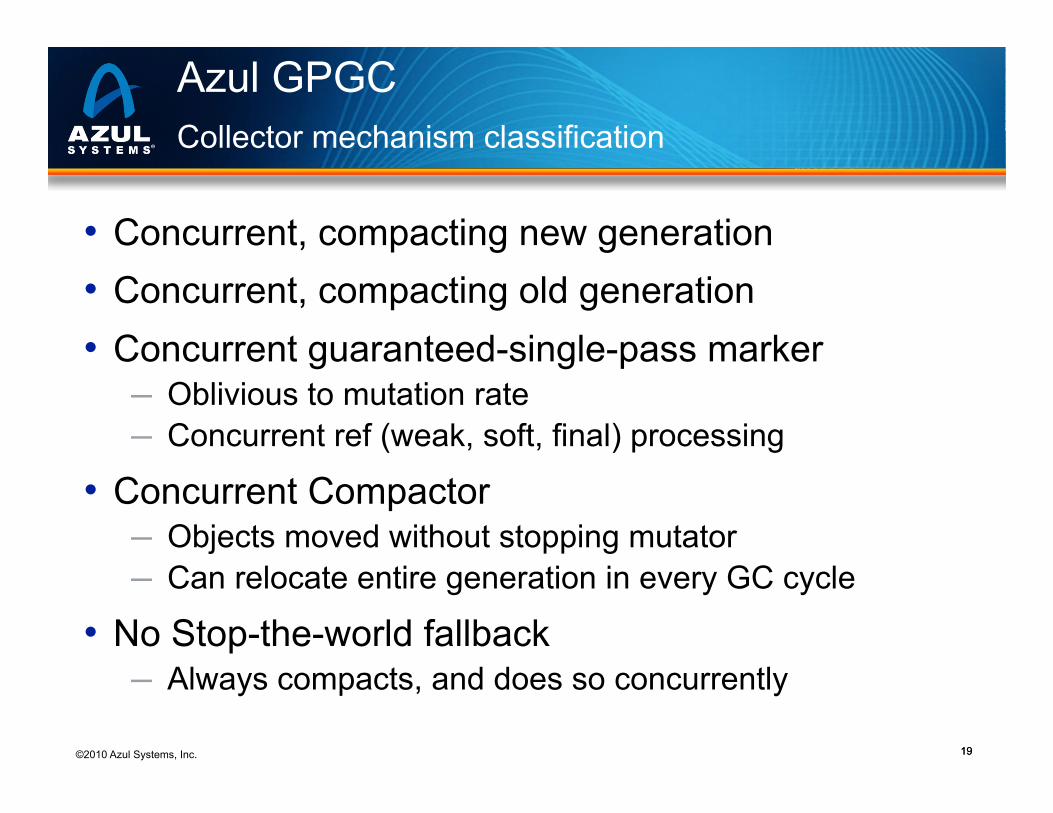
Azul GPGC Collector mechanism classification
• Concurrent, compacting new generation • Concurrent, compacting old generation • Concurrent guaranteed-single-pass marker
─ Oblivious to mutation rate ─ Concurrent ref (weak, soft, final) processing
• Concurrent Compactor ─ Objects moved without stopping mutator ─ Can relocate entire generation in every GC cycle
• No Stop-the-world fallback ─ Always compacts, and does so concurrently
©2010 Azul Systems, Inc.
20
Problems, Solutions
©2010 Azul Systems, Inc.
21 21
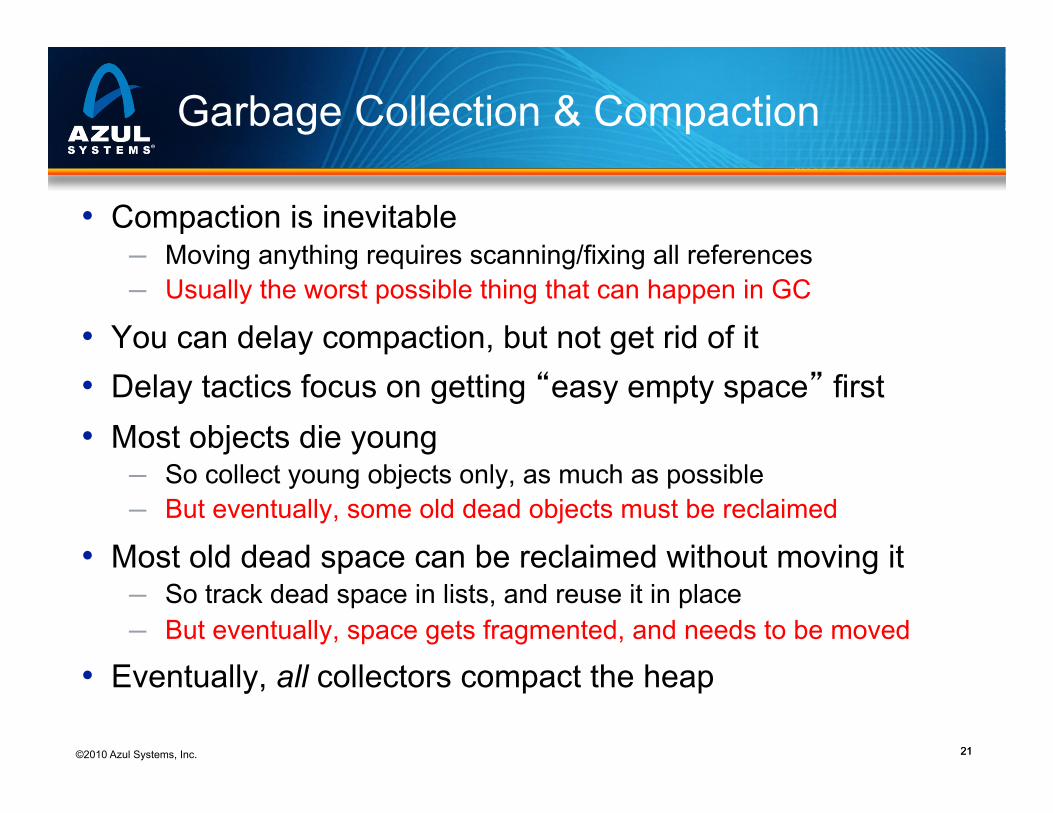
Garbage Collection & Compaction
• Compaction is inevitable ─ Moving anything requires scanning/fixing all references ─ Usually the worst possible thing that can happen in GC
• You can delay compaction, but not get rid of it • Delay tactics focus on getting “easy empty space” first • Most objects die young
─ So collect young objects only, as much as possible ─ But eventually, some old dead objects must be reclaimed
• Most old dead space can be reclaimed without moving it ─ So track dead space in lists, and reuse it in place ─ But eventually, space gets fragmented, and needs to be moved
• Eventually, all collectors compact the heap
©2010 Azul Systems, Inc.
22 22
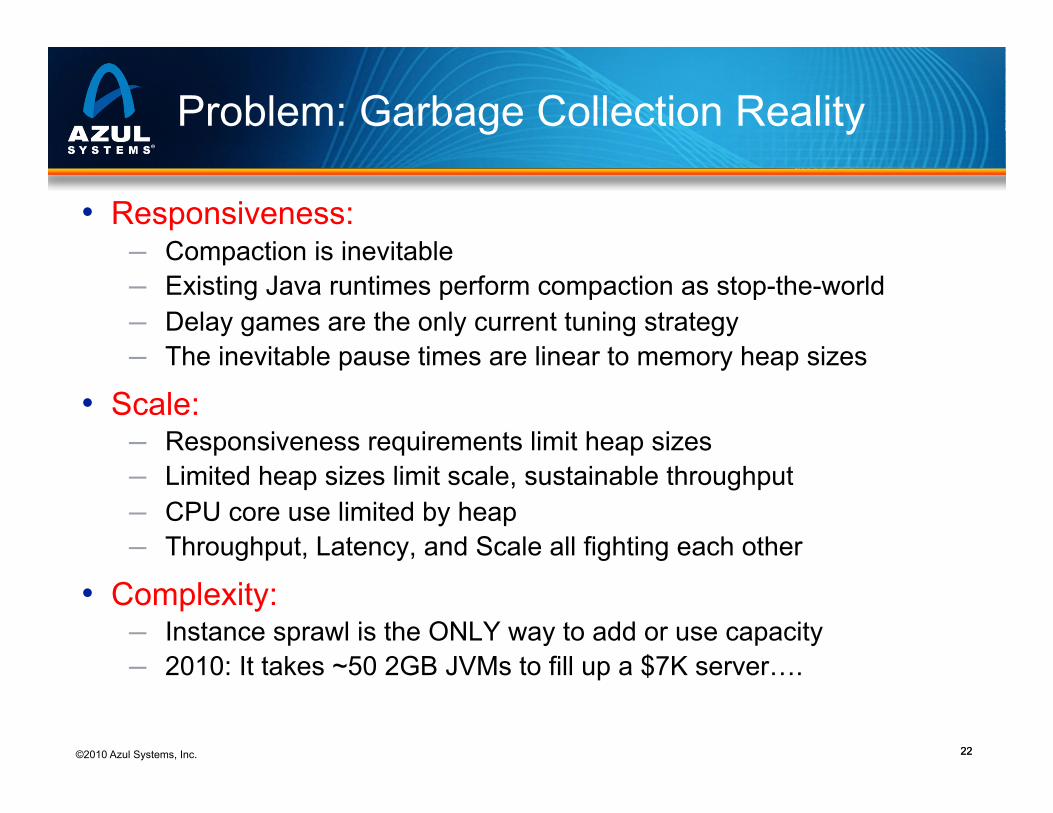
Problem: Garbage Collection Reality
• Responsiveness: ─ Compaction is inevitable ─ Existing Java runtimes perform compaction as stop-the-world ─ Delay games are the only current tuning strategy ─ The inevitable pause times are linear to memory heap sizes
• Scale: ─ Responsiveness requirements limit heap sizes ─ Limited heap sizes limit scale, sustainable throughput ─ CPU core use limited by heap ─ Throughput, Latency, and Scale all fighting each other
• Complexity: ─ Instance sprawl is the ONLY way to add or use capacity ─ 2010: It takes ~50 2GB JVMs to fill up a $7K server….
©2010 Azul Systems, Inc.
23 23
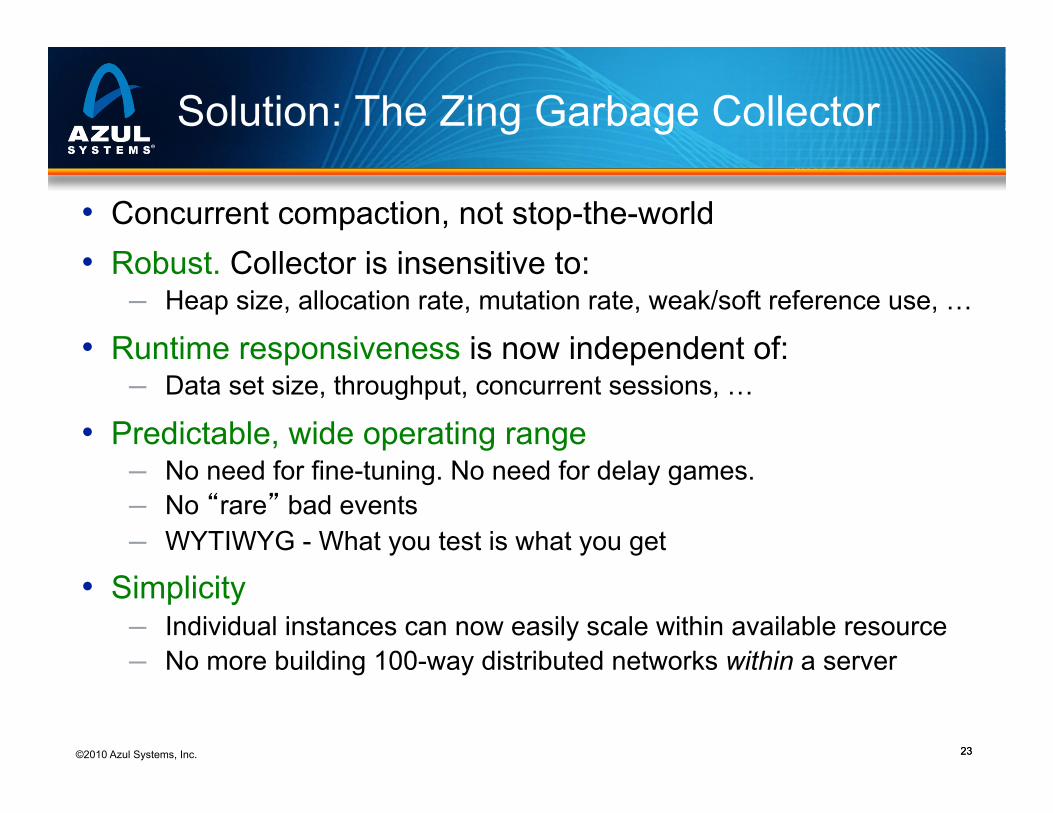
Solution: The Zing Garbage Collector
• Concurrent compaction, not stop-the-world • Robust. Collector is insensitive to:
─ Heap size, allocation rate, mutation rate, weak/soft reference use, …
• Runtime responsiveness is now independent of: ─ Data set size, throughput, concurrent sessions, …
• Predictable, wide operating range ─ No need for fine-tuning. No need for delay games. ─ No “rare” bad events ─ WYTIWYG - What you test is what you get
• Simplicity ─ Individual instances can now easily scale within available resource ─ No more building 100-way distributed networks within a server
©2010 Azul Systems, Inc.
24
So, How do we do it?
©2010 Azul Systems, Inc.
25 25
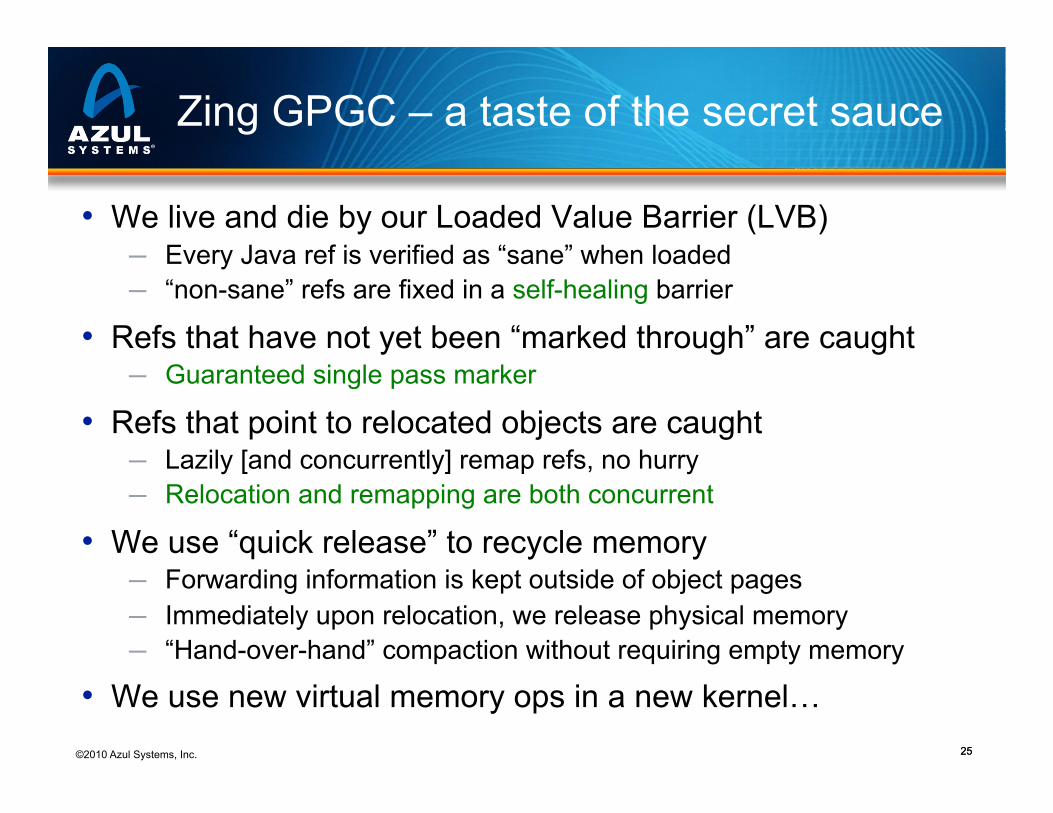
Zing GPGC – a taste of the secret sauce
• We live and die by our Loaded Value Barrier (LVB) ─ Every Java ref is verified as “sane” when loaded ─ “non-sane” refs are fixed in a self-healing barrier
• Refs that have not yet been “marked through” are caught ─ Guaranteed single pass marker
• Refs that point to relocated objects are caught ─ Lazily [and concurrently] remap refs, no hurry ─ Relocation and remapping are both concurrent
• We use “quick release” to recycle memory ─ Forwarding information is kept outside of object pages ─ Immediately upon relocation, we release physical memory ─ “Hand-over-hand” compaction without requiring empty memory
• We use new virtual memory ops in a new kernel…
©2010 Azul Systems, Inc.
26 26
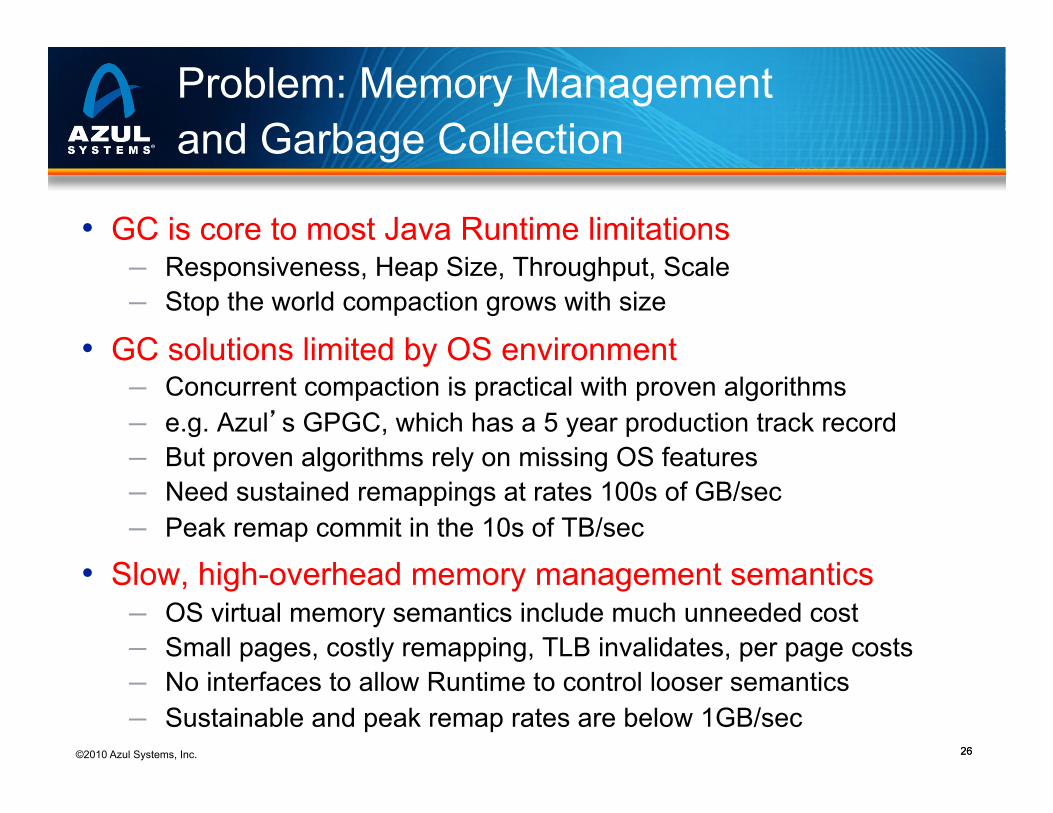
Problem: Memory Management and Garbage Collection
• GC is core to most Java Runtime limitations ─ Responsiveness, Heap Size, Throughput, Scale ─ Stop the world compaction grows with size
• GC solutions limited by OS environment ─ Concurrent compaction is practical with proven algorithms ─ e.g. Azul’s GPGC, which has a 5 year production track record ─ But proven algorithms rely on missing OS features ─ Need sustained remappings at rates 100s of GB/sec ─ Peak remap commit in the 10s of TB/sec
• Slow, high-overhead memory management semantics ─ OS virtual memory semantics include much unneeded cost ─ Small pages, costly remapping, TLB invalidates, per page costs ─ No interfaces to allow Runtime to control looser semantics ─ Sustainable and peak remap rates are below 1GB/sec
©2010 Azul Systems, Inc.
27 27
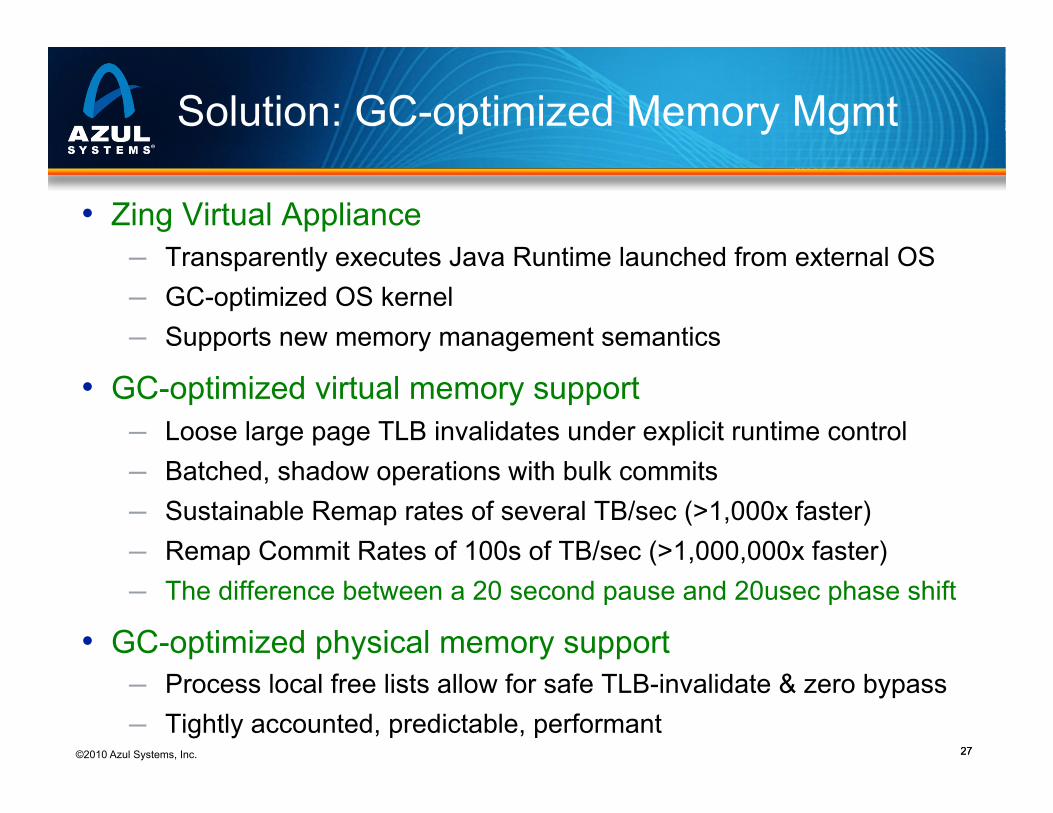
Solution: GC-optimized Memory Mgmt
• Zing Virtual Appliance ─ Transparently executes Java Runtime launched from external OS ─ GC-optimized OS kernel ─ Supports new memory management semantics
• GC-optimized virtual memory support ─ Loose large page TLB invalidates under explicit runtime control ─ Batched, shadow operations with bulk commits ─ Sustainable Remap rates of several TB/sec (>1,000x faster) ─ Remap Commit Rates of 100s of TB/sec (>1,000,000x faster) ─ The difference between a 20 second pause and 20usec phase shift
• GC-optimized physical memory support ─ Process local free lists allow for safe TLB-invalidate & zero bypass ─ Tightly accounted, predictable, performant
©2010 Azul Systems, Inc.
28 28
Java & Virtualization
F How many of you use virtualization? i.e. VMWare, KVM, Xen, desktop virtualization (Fusion, Parallels, VirtualBox, etc.)
F How many of you use it for production applications?
F How many of you think that virtualization will make your application run faster?
©2010 Azul Systems, Inc.
29 29
The Virtualization Tax
F Virtualization is universally considered a “tax”
F The Focus is on measuring and reducing overhead
F Everyone hopes to get to “virtually the same as non-virtualized”
F Plenty of infrastructure benefits
F But what are the application benefits?
©2010 Azul Systems, Inc.
30 30
Problem: Java Runtimes are already limited
Common Java Runtime Limitations
• Responsiveness
• Scale and complexity
• Rigid, non-elastic, and inefficient
• Sensitivity to load, fragility
• Poor production-time visibility
These are “pre-existing conditions”
©2010 Azul Systems, Inc.
31 31
Problem: Virtualization only makes things worse …
• Moving to virtualized environments: ─ Nobody expects applications to run faster or better ─ Best hope is that virtualization “won’t hurt too much”
• Common published virtualization best practices for Java: ─ Use one JVM process per Guest OS ─ Use the fewest cores you can get away with ─ Turn off ballooning, partition memory, avoid elasticity
• Tier-1 and some Tier-2 applications avoid virtualization ─ No Application benefits expected ─ Application behavior considered more important than
virtualization benefits to infrastructure
©2010 Azul Systems, Inc.
32 32
What if……
F What if we could do better?
F What if virtualization actually made applications better?
F What if virtualization was the way to solve the pre-existing Java limitations?
©2010 Azul Systems, Inc.
33 33
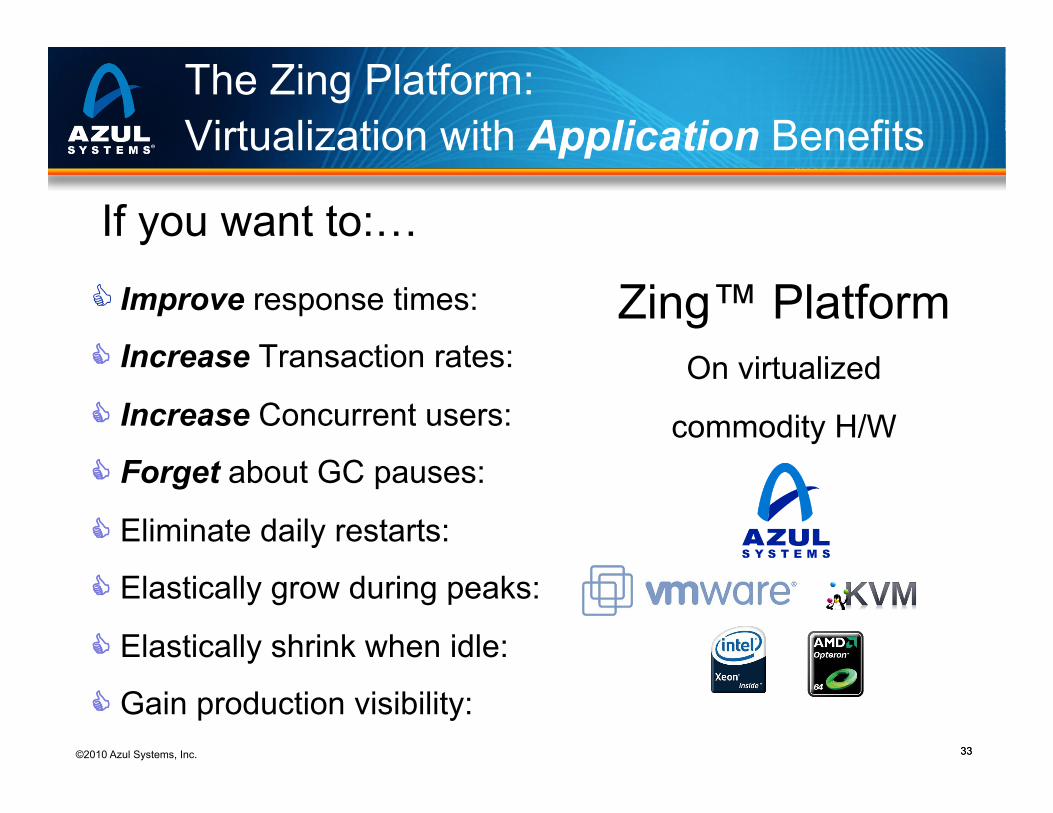
Improve response times:
C Increase Transaction rates:
C Increase Concurrent users:
C Forget about GC pauses:
C Eliminate daily restarts:
C Elastically grow during peaks:
C Elastically shrink when idle:
C Gain production visibility:
If you want to:…
The Zing Platform: Virtualization with Application Benefits
Zing™ Platform On virtualized
commodity H/W
©2010 Azul Systems, Inc.
34
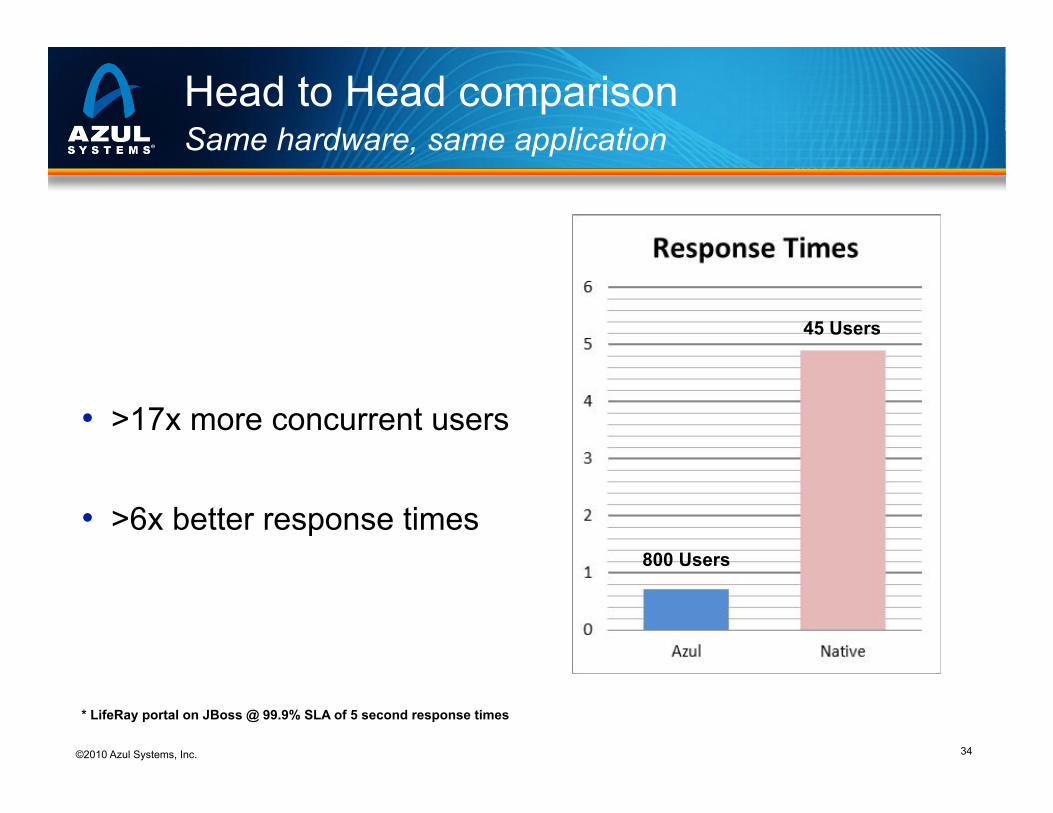
Head to Head comparison Same hardware, same application
• >17x more concurrent users
• >6x better response times
* LifeRay portal on JBoss @ 99.9% SLA of 5 second response times
800 Users
45 Users
©2010 Azul Systems, Inc.
35
Head to Head comparison Same hardware, same application
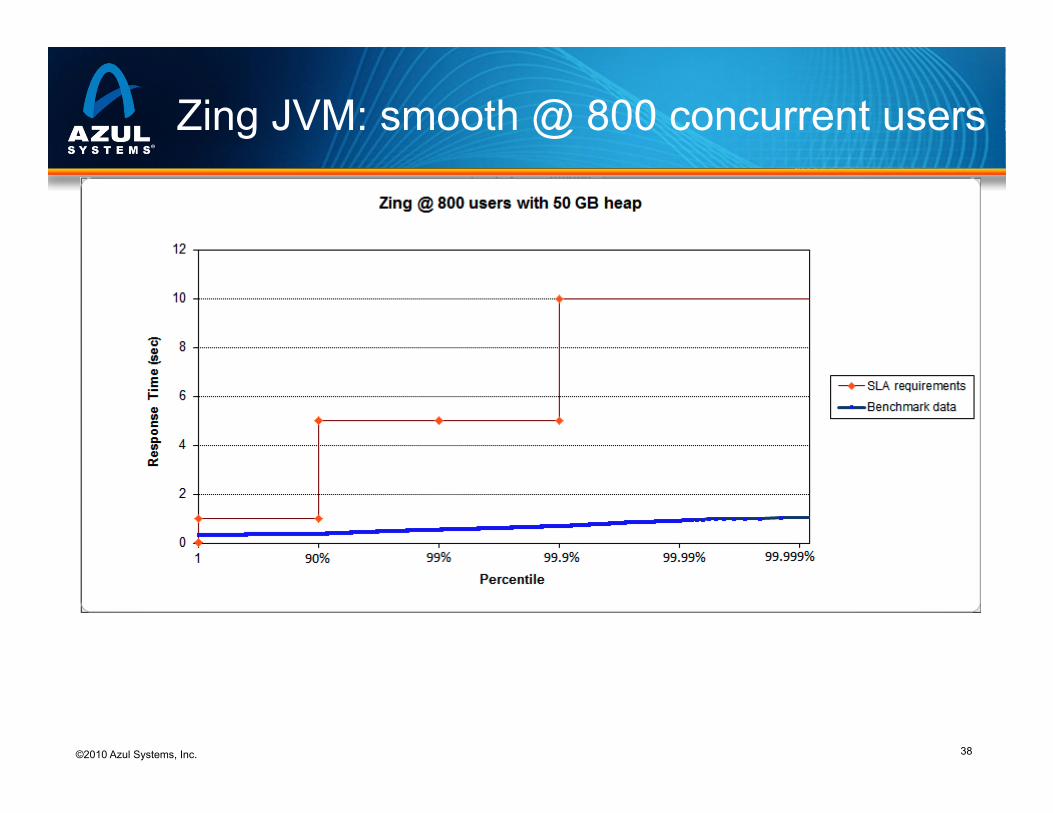
• LifeRay Portal on JBoss • Simple client load
─ ~10 sec. think times ─ ~40 MB temporary data generated per ~300ms transaction ─ ~20 MB session state ─ very slow churning LRU-like background load (@<20MB/sec)
• Sustainable SLA requirement: ─ Worst case < 10 sec. ─ 99.9% < 5 sec. ─ 90% < 1 sec. ─ Pushing pauses out of test window run not allowed.
©2010 Azul Systems, Inc.
36
Head to Head comparison Same hardware, same application
• Hardware ─ 2x Intel Xeon 5620 (12 cores), 96GB ─ ~$6,700 as of Oct. 2010… (~$1.75/GB/month)
• “Native” (aka “non-Virtualized”): ─ Fedora Core 12 ─ Native HotSpot JVM
• Virtualized: ─ VMWare ESX 4.0 ─ Zing Virtual Appliance ─ Fedora Core 12 (running as VMWare guest) ─ Zing JVM
©2010 Azul Systems, Inc.
37
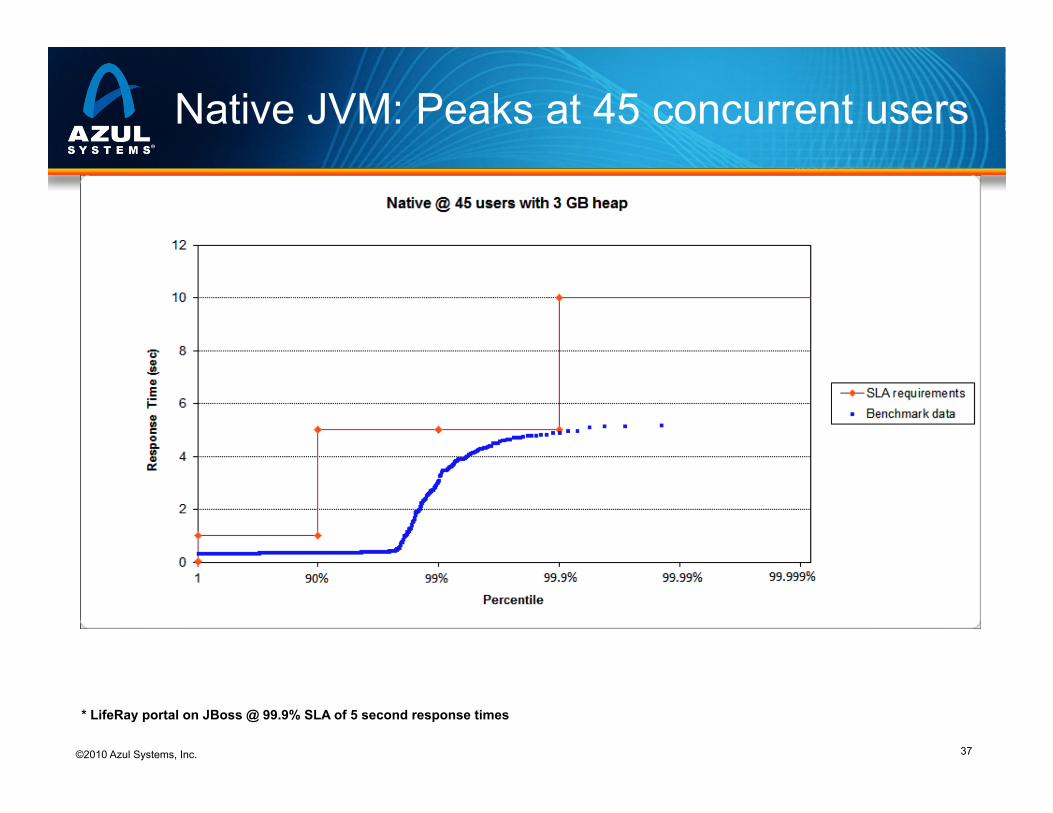
Native JVM: Peaks at 45 concurrent users
* LifeRay portal on JBoss @ 99.9% SLA of 5 second response times
©2010 Azul Systems, Inc.
38
Zing JVM: smooth @ 800 concurrent users
©2010 Azul Systems, Inc.
39 39
How to deliver a better runtime
• Java Runtimes are limited on existing platforms ─ Modern H/W is far more scalable than the runtimes are
• OS environment limitations are in the way ─ lack features to support pauseless GC, elasticity, etc.
• A better runtime needs a better place to run… ─ However, applications are strongly invested in OSs…
• So, how can we deliver: ─ A better runtime ─ A better place to run ─ All without changing the OS, or the application
• The Answer: Java Runtime Virtualization

©2010 Azul Systems, Inc.
40 40
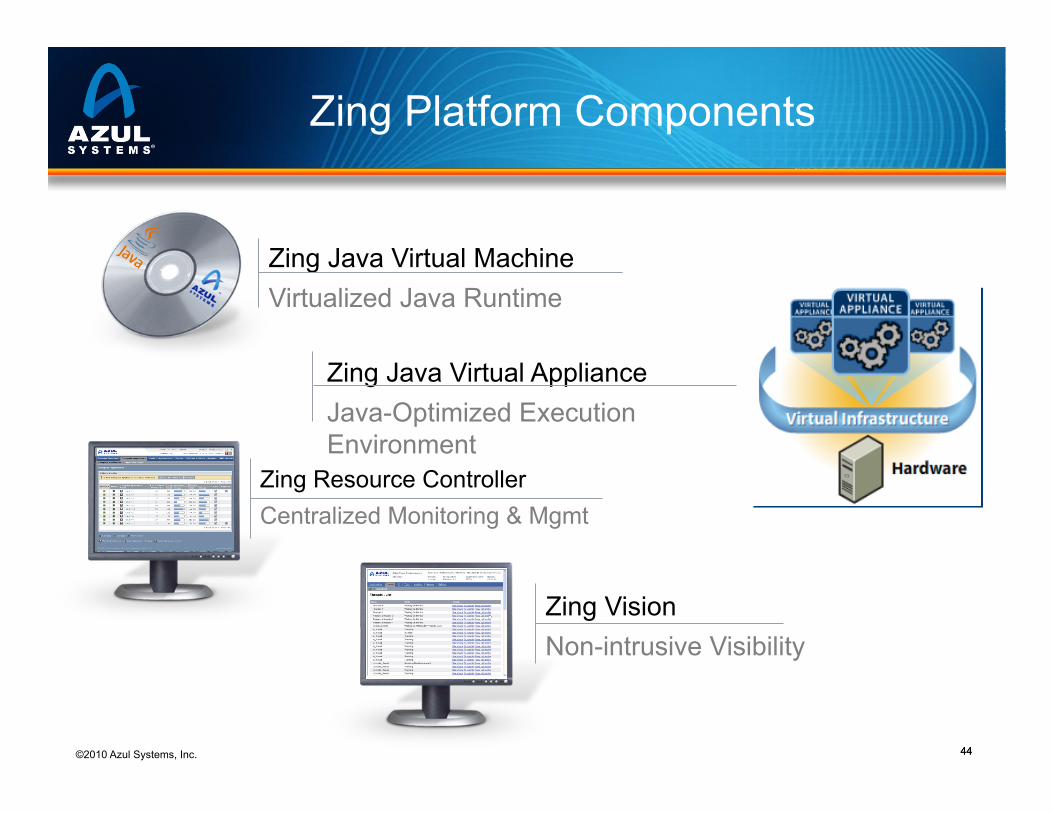
Zing Platform Components
Zing Java Virtual Appliance Java-Optimized Execution Environment
Zing Java Virtual Machine Virtualized Java Runtime
Zing Resource Controller Centralized Monitoring & Mgmt
Zing Vision Non-intrusive Visibility
©2010 Azul Systems, Inc.
41
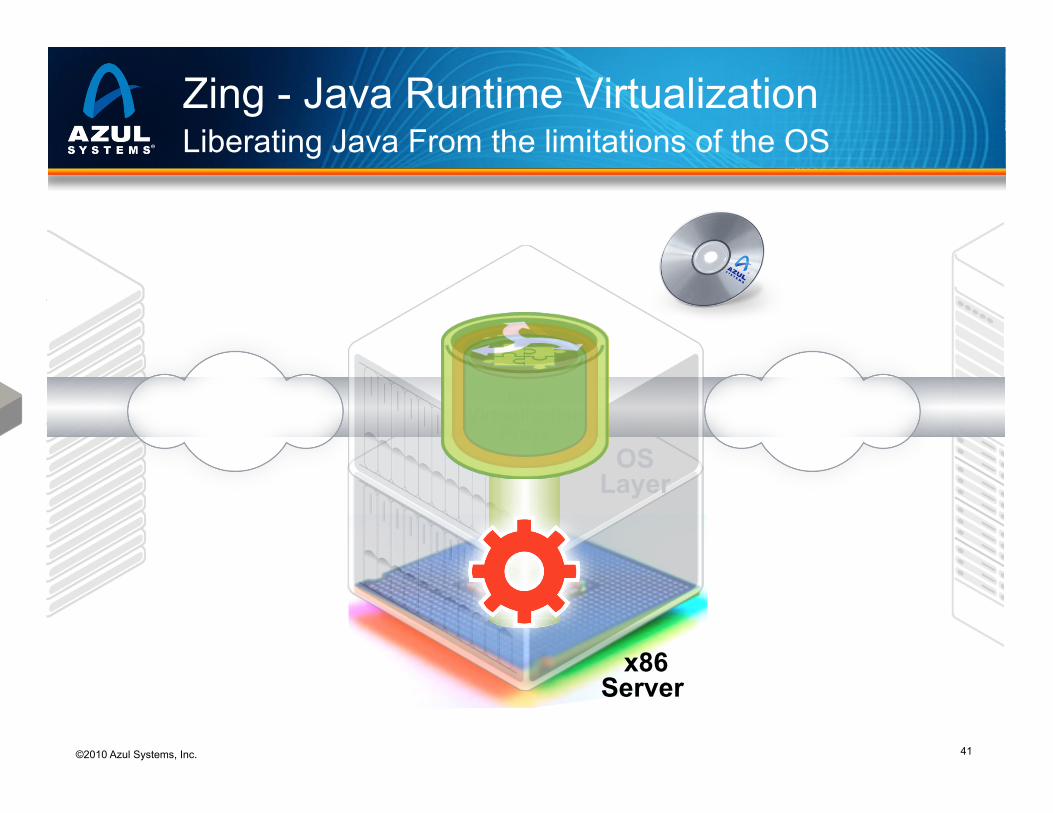
Java Virtualization
Proxy OS
Layer
x86 Server
Zing - Java Runtime Virtualization Liberating Java From the limitations of the OS
©2010 Azul Systems, Inc.
42 42
The Better Runtime: Zing JVM
• Completely solves the GC pause/instability problem… • Can make full use of modern hardware capacities • Smooth, wide operating range
─ Consistent response time ─ Insensitive to data size, concurrent sessions, throughput, … ─ Works well between 1GB and 1TB, 1 core and tens of cores
• Elastic footprint ─ Grows and shrinks memory footprint as needed ─ Can use shared ‘Insurance’ memory to survive peaks & leaks ─ Can use shared ‘Performance” memory to keep up with loads ─ No need to get sizing exactly right, saves tuning time
• Production-time visibility ─ Zero-overhead, deep drill-down detail on threads, memory, etc.
©2010 Azul Systems, Inc.
43 43
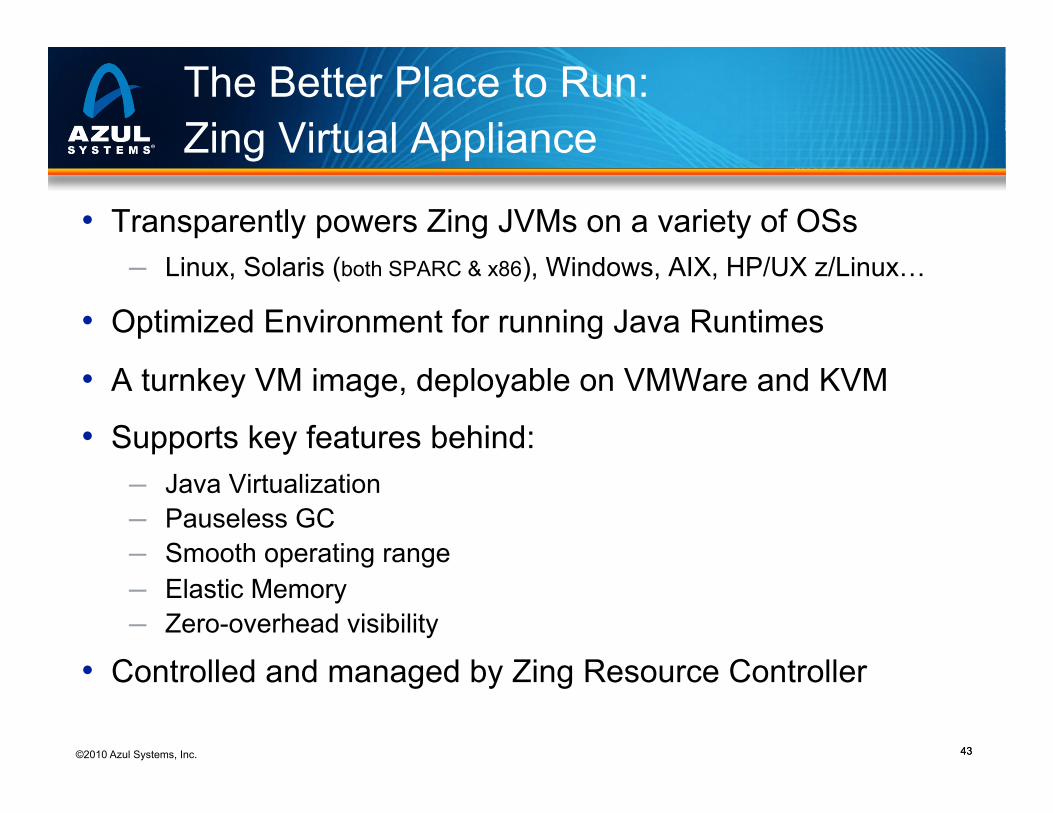
The Better Place to Run: Zing Virtual Appliance
• Transparently powers Zing JVMs on a variety of OSs ─ Linux, Solaris (both SPARC & x86), Windows, AIX, HP/UX z/Linux…
• Optimized Environment for running Java Runtimes
• A turnkey VM image, deployable on VMWare and KVM
• Supports key features behind: ─ Java Virtualization ─ Pauseless GC ─ Smooth operating range ─ Elastic Memory ─ Zero-overhead visibility
• Controlled and managed by Zing Resource Controller
©2010 Azul Systems, Inc.
44 44
Zing Platform Components
Zing Java Virtual Appliance Java-Optimized Execution Environment
Zing Java Virtual Machine Virtualized Java Runtime
Zing Resource Controller Centralized Monitoring & Mgmt
Zing Vision Non-intrusive Visibility
Gil Tene CTO, Azul Systems
Q & A
©2010 Azul Systems, Inc 46
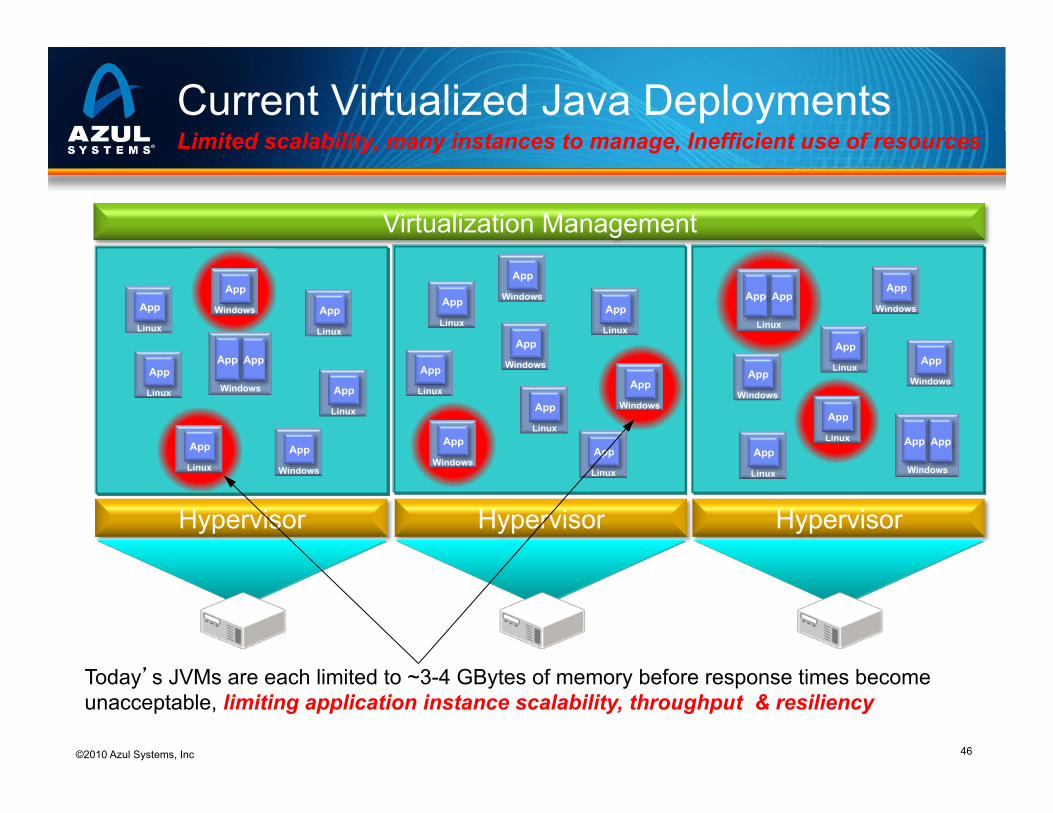
Hypervisor Hypervisor Hypervisor
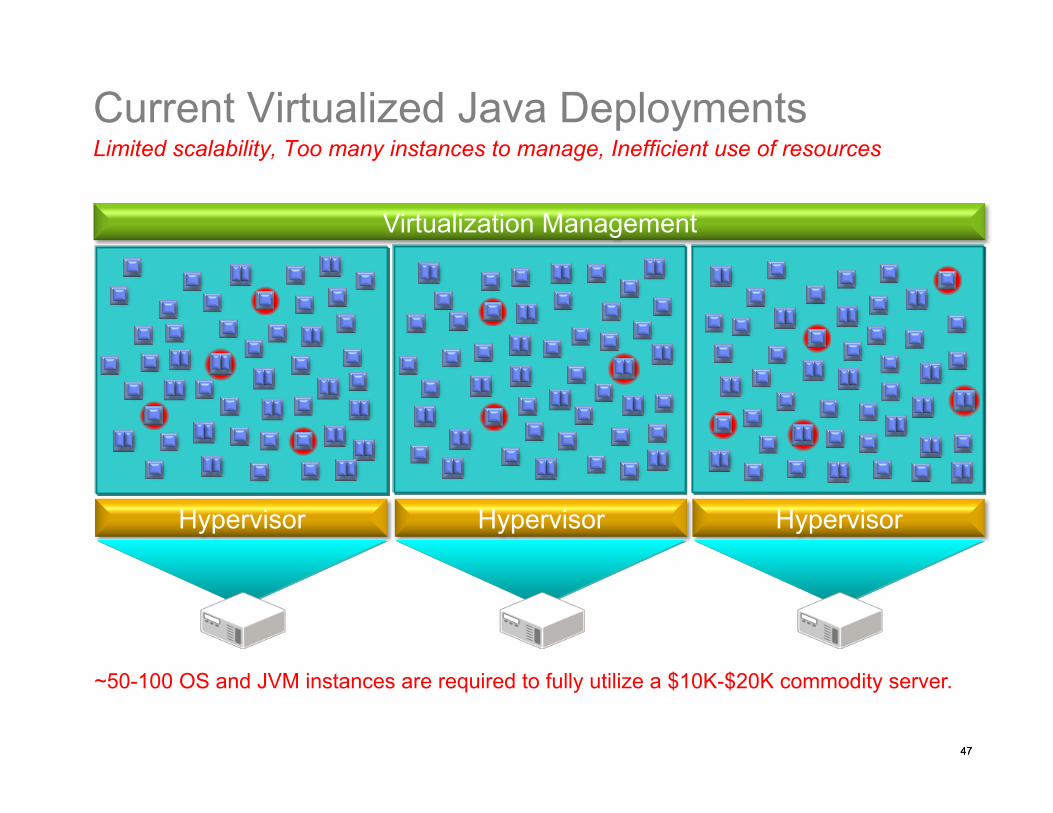
Current Virtualized Java Deployments Limited scalability, many instances to manage, Inefficient use of resources
Linux
App
Linux
App
Linux
App
Linux
App
Windows
App
Windows
App App
Linux
App
Windows
App
Windows
App
Windows
App
Linux
App Windows
App
Linux
App
Linux
App
Linux
App
Windows
App
Linux
App
Linux
App
Windows
App
Linux
App App
Windows
App App
Windows
App Linux
App
Windows
App
Linux
App
Today’s JVMs are each limited to ~3-4 GBytes of memory before response times become unacceptable, limiting application instance scalability, throughput & resiliency
Virtualization Management
47 47
Hypervisor Hypervisor Hypervisor
Virtualization Management
Current Virtualized Java Deployments Limited scalability, Too many instances to manage, Inefficient use of resources
~50-100 OS and JVM instances are required to fully utilize a $10K-$20K commodity server.
48 48
Hypervisor Hypervisor Hypervisor Solaris x86
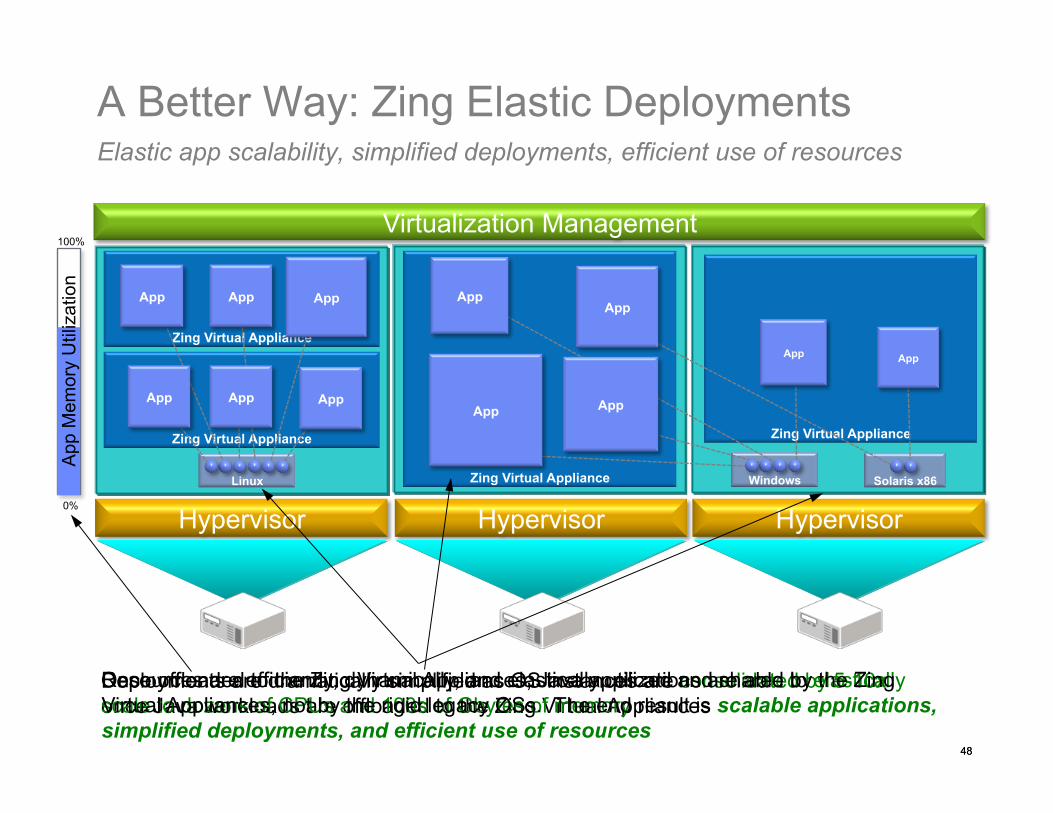
A Better Way: Zing Elastic Deployments Elastic app scalability, simplified deployments, efficient use of resources
Deployments are dramatically simplified as OS instances are consolidated by 5-10x once Java workloads are offloaded to the Zing Virtual Appliances
Linux
Zing Virtual Appliance
Zing Virtual Appliance
Zing Virtual Appliance Windows
Zing Virtual Appliance
App App
App App
App
App
App App
App
App App
App
Once offloaded to the Zing Virtual Appliances, Java applications are able to elastically scale to dozens of CPUs and 100s of Gbytes of memory Resources are efficiently, dynamically, and elastically utilized and shared by the Zing Virtual Appliances, not by the rigid legacy OSs. The end result is scalable applications, simplified deployments, and efficient use of resources
0%
100%
App
Mem
ory
Util
izat
ion
Virtualization Management