georgia department of revenue 2007dor.georgia.gov/.../document/adm/report/2007stats.pdf ·...
TRANSCRIPT

May 2008
CONSTITUTION
DOM
1 7 7 6
J US T IC E MODER
ATION
WI S
ST
AT
E OF G E O
RG
IA
Governor Sonny PerdueState Revenue Commissioner Bart L. Graham
Georgia Department of Revenue
2007STATISTICAL REPORTSTATISTICAL REPORT
May 5, 2008 The Honorable Sonny Perdue, Governor Members of the Georgia Legislature 100 State Capitol Atlanta, Georgia 30334 Dear Governor Perdue and Legislative Members: I am pleased to present to you the Annual Report of the Georgia Department of Revenue for the fiscal year ending June 30, 2007. Net collections for the past fiscal year totaled $17,567,794,839 compared to $16,341,090,102 for fiscal year 2006, a 7.5% increase. This provides further evidence of Georgia’s economic growth and highlights the Department’s continued compliance efforts. The report also highlights many of the Departments functions and improvements, including efforts to improve customer service through a redesigned web page and a more efficient customer call center, increased usage of electronic processes that allow for more efficient return and payment processing and improvements in hiring practices to recruit, train and retain a highly motivated and professional staff. This Annual Report is designed to provide a glimpse into the scope of work needed to accomplish our mission: To provide the best customer service and operational performance of any state taxing authority and the IRS. These results are directly attributable to the Department’s commitment to administer Georgia’s tax laws in a fair and equitable manner, the dedication of our employees and to the cooperation and support we receive from the executive and legislative branches. We look forward to serving you and all Georgians. Please let me know what additional or clarifying information may be of further assistance to you. Respectfully submitted, Bart L. Graham
Bart L. Graham
Commissioner
State of Georgia
Department of Revenue Suite 15300
1800 Century Blvd. Atlanta, Georgia 30345
(404) 417-2100


i
2007 Statistical Report
FOREWORD
The Georgia Department of Revenue (“DOR”) is responsible for the annual collection of taxesand fees, from both individuals and businesses, which together fund the daily operations ofstate government. The Department’s mission is to administer Georgia’s tax laws in a fair and equitable manner while providing a high level of customer service to ensure that everyGeorgia citizen pays their fair share of tax – and nothing more. In Fiscal Year 2007, the Department collected approximately $20.9 billion in gross tax revenues and distributed over $4.7 billion in sales tax revenues to counties and municipalities. Utilizing advanced technology, the Department processed over 4.1 million individual incometax returns and issued more than 3.0 million refunds (over 1.2 million of them electronically). In addition to the collection of revenue, the Department also performs a myriad of other tasks that include the regulation of alcohol and tobacco; managing the taxation of interstatetrucking; reviewing county property tax digests; administration of the unclaimed property program; and developing tax forms, instructions, and procedures with the goal of enhancingcompliance efforts – across all tax types – while at the same time making the reporting and collection of taxes less onerous for Georgia taxpayers.
All figures included in this publication are unaudited unless otherwise noted. Following is a list of tax types administered by the Department accompanied by a brief history of each one.
CORPORATE INCOME TAX Georgia’s Corporate Income Tax has been an important tax source since its inception in 1929and is currently assessed at a six (6%) percent tax rate which went into effect in 1969. InGeorgia, a large number of companies attempt to pay little or no annual corporate income tax by employing certain income shifting strategies that eliminate or minimize their Georgiataxable income. Georgia resolved a case in 2006 whereby a Georgia taxpayer settled withDOR covering tax years 2000, 2001 and 2002 for approximately $30 million in cash and $60 million in net operating loss carryover. A corporate net worth tax is administered inconjunction with the corporate income tax. Please refer to pages 1, 12, 13, 22, 23, & 52 for statistical information relating to these two tax types. INDIVIDUAL INCOME TAX Georgia’s Individual Income Tax began in 1929 with a graduated system tied to income levelsimplemented two years later. It was revised in 1937 to what is essentially the graduatedscale in effect today. Over the following seven decades additional refinements included thecreation of withholding tax, estimated tax, and new graduated schedules for certain types offilers. More than 4.1 million individual income tax returns – both paper and electronic – are filed annually. Georgia uses as the “starting point” for purposes of Individual Income Tax, ataxpayer’s Federal Adjusted Gross Income (“AGI”) based upon their Federal return.

ii
2007 Statistical Report
ALCOHOL TAXES The licensed sale of alcoholic beverages commenced in Georgia in the mid‐1930s upon the nationwide repeal of Prohibition. Georgia is a “local option” state for purposes of thelicensing and sale of alcoholic beverages. Thus, any city or county that wants to provide for the licensing and sale of distilled spirits can do so legally only after an affirmative vote of itscitizens. If a “no” vote, the question cannot be voted upon again for two years (one year if itwas a “by‐the‐drink” vote). Upon approval of the voters, the licensing, sale, and manufactureof distilled spirits will be permitted provided the manufacturer, wholesaler, or retailerobtains an alcohol beverage license from the Department of Revenue in addition to all “localordinance” licenses and requirements. Alcohol beverage statistics may be found on pages 1, 10, 15, 16, 22 & 35. MOTOR FUEL TAX One of ten states that inaugurated this tax source in 1921, motor fuel is the oldest major taxcurrently in use in Georgia. All 48 states had imposed motor fuel taxation by 1929, and it wasthe largest revenue producer in Georgia (and most states) until after World War II. Georgia’sleading revenue producer for three decades, motor fuel was eclipsed by the new three (3%)percent state sales tax during the 1950s and 1960s. It was relegated to number three in the1970s due to the individual income tax’s graduated scale and an accompanying inflationaryrise in incomes. Today, motor fuel generates as much revenue for the state of Georgia as the entire tax system did in the early 1950s. A rate of seven cents per gallon was in effect in January 1950. A three(3%) percent sales (excise) tax was added as a Second Motor Fuel Tax on July 1, 1979.Effective January 2004, this was replaced with a four (4%) percent Prepaid State Tax. It iscollected by a licensed distributor when sales are made to a non‐licensed distributor‐reseller. Effective January 2008, a Local Prepaid Sales Tax was imposed on the sale of motor fuel(only) based on the applicable tax rate in each taxing jurisdiction. The Prepaid Sales Taxrates on motor fuel are converted to cents‐per‐gallon based upon the average selling price for each fuel type. These Prepaid rates are recalculated every six months and become effective on January 1 and July 1 each year. Motor Fuel Tax data is presented on pages 1, 22, 23, 33, 35 & 38. MOTOR VEHICLE TAGS AND TITLES During the second year since the return of the Motor Vehicle Division on July 1, 2005, inconjunction with county tag offices, the Department processed over 2.7 million titleapplications and 9.4 million registration transactions. The Motor Vehicle license law wasinitiated in 1910 and a title law added in 1963. A motor vehicle title is akin to a deed for aparcel of real estate. Current Georgia law requires an individual to secure a title uponpurchase of a vehicle. Application for tags and/or decals for all vehicles, and payment of ad valorem taxes (a form ofproperty tax) to the county of registration, are made to the county tag agent. The county tag agent is typically the county tax commissioner or tax collector. The county tag agent issuesall tags and renewal decals except those for certain large trucks (International RegistrationPlan) which are issued by the Department of Revenue. Applications for titles may be
iii
2007 Statistical Report
submitted to the county tag agent or the Department of Revenue. Each registration and/or title application must be filed in the county of legal residence of thevehicle’s owner during their designated registration period. If the vehicle is titled in the name of a business enterprise located in another county, the license application must be filedin that county. Nonresidents who move to Georgia permanently, as opposed to those who are merelysojourning, must purchase a Georgia tag no later than thirty (30) days after establishing residency in Georgia. Persons employed on a temporary basis or just passing through are notrequired to register their vehicle if they remain in the state for less than thirty (30)consecutive days. Military personnel are not required to register vehicles in Georgia provided they display a valid license plate from their home state. Out‐of‐state students may use a vehicle registered in another state provided that state is a member of the Multi‐State Reciprocity Agreement. The Motor Vehicle Division encompasses several internal departments related to theadministration of tags and title for the State of Georgia. Those departments includeCommercial Vehicles, Title Processing, Research and Title Corrections, Title Print Shop,Special Tags, Motor Vehicle Inspections, Training, Citizens Call Center, Vehicle Valuation andAssessment, and County Tag Office Help Desk. PROPERTY TAX In the mid‐1800s, Georgia passed an Act allowing for the taxation of property or “advalorem.” The ad valorem has remained in effect since then and is the primary source ofrevenue for local county governments and municipalities in Georgia. In addition, a small amount of property tax revenue is deposited into the State Treasury. Although counties andmunicipalities administer the tax, the State Revenue Commissioner is charged with thesupervisory authority to ensure uniform administration throughout Georgia in accordancewith the law. Ad Valorem tax is based upon the “value” of real and personal property that is subject to the tax. The tax rate, or “millage,” in each county is determined annually by the Board of CountyCommissioners or other local administrative body. A tax rate of “one mill” represents anassessment of $1 per $1,000 of assessed value. The average county millage rate in Georgia in 2007 was approximately 26.86 mills. Counties remit one‐quarter mill of total revenue collected to the state. Pages 5, 6, 16, 23, 37, 38, 43‐46, & 47‐51 reflect property tax collections. Tables containing county property tax data begin on page 39. The Local Government Services Division prepares values for all properties owned andoperated by public utilities, and the flight equipment of airlines, for the Department ofRevenue. To arrive at a public utility’s property value in each tax jurisdiction, the Fair Market Value (“FMV”) of the utility system, the portion of the system located in Georgia, the portionin each jurisdiction, and the average level of assessment in each county is afforded closereview. The Division also prepares final assessed values for railroad equipment car

iv
2007 Statistical Report
companies based upon the value of the cars, the proportion of their use in Georgia, and theaverage level of assessment in each county. On April 15, 1999, House Bill 553 became law. It provides homeowners with property taxrelief for assessed county, school, and state property taxes. In 2005, it allocated theequivalent of an additional $8,000 homestead exemption to eligible property owners in theform of a Homestead Tax Relief Grant (“HTRG”). House Bill 1321, passed during the 2002Session of the General Assembly, permitted municipalities to extend HTRG to city residents.To calculate the tax savings for 2005, up to $8,000 is multiplied by the combined millage ratefor county, city, school, and city taxes. This amount is deducted directly from a homeowner’s property tax bill and reimbursed to the county and city by the State. The Department has been responsible for administration of the state’s Unclaimed PropertyProgram since 1973. The state serves as custodian, in perpetuity, for all unclaimed property and abandoned funds until claimed by the rightful owners or heirs. Common types ofunclaimed property include unclaimed wages, bank accounts, matured insurance policies,stocks and bonds, mutual funds, contents of safety deposit boxes, and various other unclaimed debts. The Unclaimed Property Section, which is part of the Local GovernmentServices Division, receives in excess of $80 million worth of abandoned property annually.The Program maintains an active website with current information concerning property and reporting requirements, plus a database where citizens can search for property that theybelieve to be rightfully theirs and which also allows them to file a claim request online. TheUnclaimed Property Program adds more than 100,000 owner properties in an average year and handles over 50,000 claim requests nationwide. SALES AND USE TAX Begun in April 1951 at a three (3%) percent statewide rate, Georgia was the 30th state toimplement this tax source. Forty‐five states currently have some type of state sales tax. This tax has been one of Georgia’s largest revenue sources from its inception and now producesone‐third of the state’s total revenue. Georgia’s state sales and use tax rate increased to four(4%) percent on April 1, 1989. Beginning in 1975, when the concept of local option taxation was conceived andimplemented in Georgia, several additional kinds of local option sales taxes have since beenput into effect. With the approval of county voters, municipalities have increased the maximum rate of county sales tax in Georgia (encompassing the four(4%) percent state rateplus various one (1%) percent local option sales taxes) to eight (8%) percent. Currently, all 159 Georgia counties impose some type of local option sales tax. Currently, only one municipality in Georgia (The City of Atlanta), at present, imposes sales tax based on the purchase price or rental charge of tangible personal property at the maximum rate of eight(8%) percent rate. During Fiscal Year 2007, the Department of Revenue made the following distributions to counties and municipalities:
More than $1.5 billion for Education Local Option Sales Tax (“ELOST”) to county andindependent school systems;

v
2007 Statistical Report
Over $1.2 billion for the 1% Local Option Sales Tax (“LOST”) to counties and municipal
governments; In excess of $1.3 billion for the 1% Special Purpose Local Option Sales Tax (“SPLOST”) to
county governments; More than $349 million for operation of the Metropolitan Atlanta Rapid Transit Authority
(“MARTA”); Over $115 million for the 1% Homestead Local Option Sales Tax (“HOST”) for DeKalb and
Rockdale counties; In excess of $122 million for Other Local Option Sales Tax to Towns County and the City of
Atlanta. TOBACCO TAXES State taxation of cigars and cigarettes began in 1923. The rate on cigarettes increased gradually to5 cents per pack in 1955. By 1971, it was 12 cents per pack. Effective July 1, 2003, the state excisetax on a pack of 20 cigarettes increased to the present rate of 37 cents. On a scale of 1 to 50 withthe former representing the highest rate of tax, Georgia currently ranks 41st nationwide. Also effective on July 1, 2003, the first‐ever state excise tax was imposed on loose and smokeless tobacco. It is based upon ten (10%) percent of the wholesale cost price. That same day, thefollowing rate changes also took effect: the tax rate on “little cigars” (weighing not more than 3pounds per thousand) increased from 2 mills to 2.5 mills each, and the tax on all other cigars increased from thirteen (13%) percent to twenty‐three (23%) percent of the wholesale cost price. COUNTY TAX DATA Personal income tax returns for 2005 have been tabulated by county and compiled in Table 12beginning on page 39. Table 13, beginning on page 43, contains assessed property values of the gross general digest, net general digest, and public utility digest, plus LOST, SPLOST, and ELOSTdistributions by county. Table 14, beginning on page 47, presents Georgia counties by population, net income tax, one (1%) percent sales tax distribution, and property tax digest information foundin the two preceding tables. The three right‐hand columns list each county based upon a per capitaamount so that an alternate method of comparison can be made. Property tax millage rates, by county, in both an alphabetic and numeric series are presented inTables 16 and 17. Both tables provide a method of quick reference to a given county’s rate and a method of comparing a given millage rate vis‐à‐vis other counties.

vi
2007 Statistical Report
Sources of Revenue Tax Dollars 1
Department of Revenue Directory 2‐3
Georgia Department of Revenue Organization Chart 4
Organization of the Department of Revenue by Division 5
Revenue Highlights for FY 2007 6‐7
Comparison of Net Collections & Population FY 2001 thru 2007 – Chart A 8
Number of DOR Employees by Category and Fiscal Year – Chart B 8
DOR Spending by Funding Source FY 2003 thru 2007 – Chart C 9
Delinquent Tax Collections by the Compliance Division FY 2001 thru 2007 – Chart D 9
Total Collections From Initiatives – Chart E 10
Cost of Collection Fees – Collections by Compliance Division – Accounts Processed – Chart F 10
Tax Returns Processed by Calendar Year – Chart G 11
Electronically Filed Returns, 2007: Paper and e‐File – Chart H 11
Corporate (Calendar) and Individual Returns (Fiscal) Filed by Year versus Collections – Charts I & J 12
Sales Tax Distribution & Net State Sales Tax Collections – Chart K 13
Annual Refund by Month for Year 2007 13
Motor Vehicle Production Report Performance Figures, FY 2007 – Chart L 14
Alcohol & Tobacco Division Performance Figures – Chart M 15
Alcohol & Tobacco Division Investigations, Collections, Enforcement – Chart N 15
Results and Performance Measures by Program: FY 2003 thru 2007 16‐17
Seminars, Presentations and Certification Programs 18‐20
Net Revenue Collections by Georgia Department of Revenue: FY 1940 to 2007 – Table H‐1 21
Monthly Revenue Department Collections, FY 2003 thru 2007 21
Changes in Major State Tax Revenues, FY 2005 thru 2007 – Chart 1 22
Net Revenue Collections by Tax Type for FY 2005, 2006 and 2007 – Table H‐2 23
Georgia State Tax Revenue by Major Sources, Ten‐Year Trend (FY 1998 thru 2007) – Chart 2 24
Georgia State Tax Revenue by Major Sources (FY 1996 thru 2007) – Table H‐3 25
Comparative Trends: Personal Income and State Income Tax Receipts (FY1996 thru 2007) – Table H‐4 25
Organization of the Revenue Department
Operations
State Revenue Collections and Trends
TABLE OF CONTENTS

vii
2007 Statistical Report
Georgia, Southeast Per Capita Personal Income as a Percent of U.S. Average – Chart 3 26
Per Capita Personal Income Percent Increase Comparisons by Period – Chart 4 26
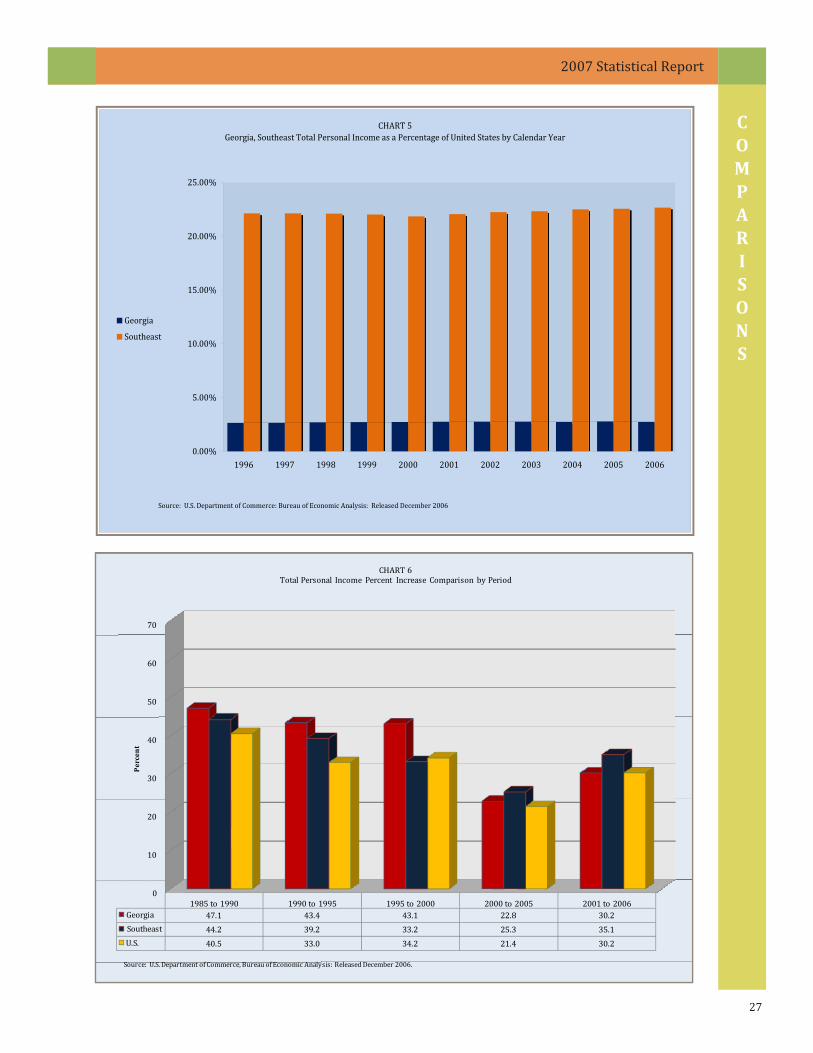
Georgia, Southeast Total Personal Income as a Percent of the U.S. – Chart 5 27
Total Personal Income Percent Increase Comparison by Period – Chart 6 27
Per Capita Comparison of Selected Financial Items for State and Local Governments – Chart 7 28
Selected State and Local Tax Collections to $1,000 Personal Income – Chart 8 29
Sales and Use Tax Revenues by Business Group, FYE June 30, 2006 and 2007 – Table 1 30
Sales and Use Tax Collections by Month: Calendar Years 2003 thru 2007 – Table 2 31
Growth Trend of Personal Income Tax – Table 3 32
Motor Fuel and Motor Carrier, Detailed Data for FY 2007 – Table 4 33
Georgia Personal Income – Calendar Year 2005 Tax Returns by Income Class – Table 5 34
Excise Taxes and Fees in Detail for FY 2006 – Table 6 35
Growth in Sales Tax Distributions for FY 2005, 2006 and 2007 – Table 7 36
Electronic Filing Results for FY 2007 – Table 8 36
Taxable Values of General Property and Public Utilities – Table 9 37
Net Property Tax Collections by Category for FY 2007 – Table 10 37
Taxable Value of General Property and Public Utilities by Class of Property, FY 2006 and 2007 – Table 11 38
Homestead Taxpayer Relief Grant Distribution, FY 2000 thru 2007 – Table 11A 38
2005 Personal Income Tax Data by County of Residence – Table 12 39‐42
Selected Tax Statistics and Estimates by County, Calendar Year 2006 – Table 13 43‐46
Three Economic Indicators by County with Rankings and Per Capita Amounts – Table 14 47‐51
Corporation Income Tax Returns by Taxable Income Class: Calendar Year 2005 Returns – Table 15 52
CY 2005‐2007 Millage Rates by County ‐ Alphabetically Listed – Table 16 53‐54
CY 2005‐2007 Millage Rates ‐ Numerical by CY 2007 Rate– Table 17 55‐56
Motor Vehicle Tag and Title Revenues for Fiscal Years 2006 and 2007 – Table 18 57
Motor Vehicle Tag and Title Volume for Calendar Years 2006 and 2007 – Table 19 57
INDEX 58
Selected Tax Data by Type and/or County
Georgia Comparisons of Region to U.S.
TABLE OF CONTENTS


O R G A N I Z A T I O N
1
2007 Statistical Report
$8,778,933
$5,903,918
$1,019,130
$468,390
$481,970
$161,031
$585,460
$242,950
$1,426
$0
$1,000,000
$2,000,000
$3,000,000
$4,000,000
$5,000,000
$6,000,000
$7,000,000
$8,000,000
$9,000,000
Thousands
Personal Income Tax
Sales and Use Tax
Corporation Income Tax
Prepaid Motor Fuel Sales Tax
Motor Fuel Tax
Alcohol Tax
Miscellaneous
Tobacco Tax
Estate Tax
Sources of Revenue Tax Dollars for Fiscal Year Ending June 30, 2007: $17,567,795 (Unaudited & in 000's)

O R G A N I Z A T I O N
2
2007 Statistical Report
DIRECTORY
1800 Century Boulevard Atlanta, Georgia 30345
All Phone Numbers in Century Center Begin with (404) 417 + Appropriate Suffix
ADMINISTRATIVE OFFICES Commissioner, Phone: 2100 Deputy Commissioner, Phone: 2100 Budget Office, Suite 17200, Phone: 2222 Central Accounting, Suite 17200, Phone: 2222 Electronic Funds Transfer, Suite 17235, Phone: 2220 Hearing Officer, Suite 15118, Phone: 2210 Internal Audit, Suite 4250, Phone: 2247 Human Resources, Suite 2225, Phone: 2140 Payroll, Suite 2225, Phone: 2140 Facilities Director, Suite 11216, Phone: 6092 Litigation & Investigations, Suite 11175, Phone: 2180 Public Information, Suite 15114, Phone: 2106 Tax Law & Policy, Suite 15311, Phone: 6649 Taxpayer Advocate, Suite 15300, Phone: 2100 Training Director, Suite 4305, Phone: 2262 Trust & Estate Section, Suite 15108, Phone: 2402 ALCOHOL & TOBACCO DIVISION Howard Tyler, Director, Suite 4235, Phone: 4900 David Dyal, Chief of Enforcement, Suite 4235, Phone: 4868 Scott Self, Suite 4235, Phone: 4868 Chief of Operations, Suite 4247, Phone: 4850 Enforcement Personnel are located at each: Revenue Regional Office Enforcement Supervisory Personnel: Albany, Gilbert Lyons, Special Agent in Charge Phone: 229‐430‐4404 Lithia Springs, Michael W. Earnest, Special Agent in Charge Phone: 770‐732‐5840 South Atlanta Metro, Malcolm S. Bennett, Special Agent in Charge Phone: 404‐968‐0401 Savannah, William A. Capps, Special Agent in Charge Phone: 912‐353‐3001
COMPLIANCE DIVISION Deputy Commissioner, Tax Administration, Suite 18100, Phone: 6400 Audit Administrator, Suite 18100, Phone: 6400 Collections Administrator, Suite 16200, Phone: 6400 Field Assistance, Suite 16200, Phone: 6340 OIC Program, Suite 15110, Phone: 2205 Private Collections Section, Suite 9200, Phone: 6700 Special Collections Program Unit, Suite 18300, Phone: 6336 Special Procedures Section, Suite 16206, Phone: 6344 Bankruptcy Section, Tradeport, 4245 Int'l Pkwy, Hapeville, 30354‐3903 Phone: 404‐968‐0410 Regional Offices Albany, 1105‐D W. Broad Ave., 31707 Bennie Butler, Mgr., P.O. Box 1357, 31702‐1357 Phone: 229‐430‐4241 Athens, 190 Ben Burton Circle, Bogart, GA 30622‐1790 Kerry Herndon, Mgr., P.O. Box 1843, 30603‐1843 Phone: 706‐542‐6058 Atlanta South Metro 4245 International Pkwy., Suite B, Hapeville, 30354‐3919 Christy Bowens, Mgr., P.O. Box 16749, 30321‐0749 Phone: 404‐968‐0480 Augusta, 130 Davis Rd., Martinez, GA 30907‐2386 John R. Coleman, Mgr., Phone: 706‐651‐7600 Columbus, 1501 13th Street, Suite A, 31901‐2344 Peggy Watson, Mgr., P.O. Box 1698, 31902‐1698, Phone: 706‐ 649‐7451 Douglas, North Point Plaza, Suite I, 1214 N. Paterson, 31533‐2835 Larry North, Mgr., P.O. Box 943, 31534‐0943, Phone: 912‐389‐4094

O R G A N I Z A T I O N
3
2007 Statistical Report
DIRECTORY 1800 Century Boulevard Atlanta, Georgia 30345
All Phone Numbers in Century Center Begin with (404) 417 + Appropriate Suffix
Lithia Springs, 351 Thornton Rd., Suite 101, 30122‐1589 Judy Stanley, Mgr., P.O. Box 1079‐30122‐7079, Phone: 770‐732‐5812 Macon, 630 North Ave., Suite B, 31211‐1493 Scott Purvis, Mgr., P.O. Box 4368, 31208‐4368 Phone: 478‐ 751‐6055 Northeast Metro 1800 Century Blvd, NE, Suite 2206, 30345‐3025 Jerry S. Sewell, Mgr., Phone: 404 417‐6605 Rome, 1401 Dean Street, Suite E, 30161‐6494 Randy Holland, Mgr., P.O. Box 6004, 30162‐6004 Phone: 706‐295‐6061 Savannah 6606 Abercorn St., Suite 220, 31405‐5831 Jon Galbraith, Mgr., P.O. Box 13547, 31416‐054 Phone: 912‐ 356‐2140 INFORMATION TECHNOLOGY DIVISION Division Director for Technology, Suite 6305, Phone: 6004 PROCESSING CENTER Tradeport, 1200 Tradeport Blvd., Atlanta 30354‐1200 Tim Shields, Director, Suite 1063, Phone: 404‐675‐1446 Assistant Director, Suite 1037, Phone: 404‐362‐2505 Assistant Director, Suite 1003, Phone: 404‐362‐4577 LOCAL GOVERNMENT SERVICES DIVISION 4245 International Pkwy, Suite A, Hapeville, 30354‐3918 Vicki Lambert, Director, Phone: 404‐968‐0710 Real & Personal Property Tax, Phone: 404‐968‐0707 Intangible Recording Tax, Phone: 404‐417‐2212 Real Estate Transfer Tax, Phone: 404‐417‐2212 Motor Vehicle Assessments, Phone: 404‐362‐6440 Unclaimed Property Section, Phone: 404‐968‐0490 Public Utility, Phone: 404‐968‐0750
Sales Tax Distribution, Phone: 404‐675‐1547 Homeowner Tax Relief Grants, Phone: 404‐968‐0707 Tax Officials Training, Phone: 404‐968‐0707 MOTOR VEHICLE DIVISION Tradeport, 1200 Tradeport Blvd., Atlanta 30354‐1200 J.D. Grant, Co‐Director, Suite 1114, Doug Hooper, Co‐Director, Suite 1114 Phone: 404‐362‐6440 Title Information, Suite 1153, Phone: 404‐362‐6500 Tag Information, Suite 1153, Phone: 404‐362‐6500 TAXPAYER SERVICES DIVISION Denise Samuel, Director, Suite 8100, Phone: 2400 Corporation Audit, Suite 8200, Phone: 2409 Individual Operations, Suite 7100, Phone: 2300 Motor Fuel Distributor Section, Suite 8200, Phone: 6710 Motor Carrier Section, Suite 8200, Phone: 6712 Refund Inquiry, Suite 3100, Phone: 4470 Registration & Licensing, Suite 3100, Phone: 4490 Sales Tax Contractor Section, Suite L‐200, Phone: 4490 Sales Tax Error Resolution Section, Suite 8300, Phone: 6601 Taxpayer Registration, Suite 3100, Phone: 4490 Taxpayer Services, Suite 3100, Phone: 4480 Withholding Tax, Suite 8300,

O R G A N I Z A T I O N
4
2007 Statistical Report

O R G A N I Z A T I O N
5
2007 Statistical Report
ORGANIZATION OF THE DEPARTMENT OF REVENUE
In addition to the offices of State Revenue Commissioner and Deputy Revenue Commissioner, the Department of Revenue is organized by Division.
ADMINISTRATIVE Provides administrative services for all Divisions within the Department. Included are the Taxpayer Advocate’s Office, Budget Office, Administrative Hearing Office, Internal Audit/Operations Analysis Unit, Human Resources, Payroll, Facilities Management, Procurement, Tax Law & Policy, Public Information Office, Cashiering, Accounting, Litigation & Investigations, and Training. ALCOHOL AND TOBACCO Enforces all laws and regulations pertaining to the manufacture, possession, transportation, and sale of legal and illegal alcoholic beverages, tobacco products, and the possession and operation of coin‐operated amusement machines within the State. The Division is charged with conducting licensing background investigations for the sale of alcoholic beverages, tobacco products, coin‐operated amusement machines, and is also charged with enforcing the Motor Fuel and Motor Carrier Laws. A criminal investigative staff performs specialized investigations for licensing violations, sales of alcoholic beverages and tobacco products to underage persons, excise tax evasion on alcohol, tobacco, and certain motor fuel products, and assists other state, local, and federal enforcement agencies in related investigative matters. COMPLIANCE Utilizes a staff of professional tax specialists to audit tax accounts (Income, Sales, Motor Fuel, Alcohol and other miscellaneous audits). Audits are performed nationwide, provides taxpayer information, and assistance at 11 regional office locations. Conducts taxpayer education seminars and workshops to enable taxpayers develop a better understanding of tax laws. Continually examines taxpayer registrations, compliance with filing deadlines, and collects delinquent accounts. INFORMATION TECHNOLOGY The Information Technology Division manages information technology systems for all areas of tax administration for the Revenue Department. The Division maintains, enhances, and develops new applications as requested. LOCAL GOVERNMENT SERVICES Administers all property tax laws and regulations as well as the distribution of sales and use taxes for local taxing authorities. This Division is charged with the administration of the ad valorem tax, including the approval of all county tax digests, training of local tax officials, proposed assessment of all public utility property, distribution of local sales taxes, payment of grants for homeowner tax relief, development of annual current use values and owner harvest timber values. The Division also administers the laws set forth in the Unclaimed Property Act.
MOTOR VEHICLE The Motor Vehicle Division (“MVD”) issues license plates, Georgia Certificate of Title, and record liens and security interest on all vehicles registered in Georgia. MVD monitors fraudulent title activity and examines legal documents for issuance of titles such as Georgia and Out‐of‐State Titles, court orders and judgments, title bonds, and salvage inspections. MVD transmits vehicle information to the National Crime Information Center system, and to other vendors as applicable.
Customers may receive instant title print services and title research at MVD – Tradeport in Hapeville, Georgia. The Motor Vehicle Inspection Unit operates in accordance with O.C.G.A.§ 40‐3‐7 to conduct an inspection for a “salvage,” “rebuilt,” “restored,” or any similar phrase. The International Registration Plan (“IRP”) Commercial Vehicle Unit is responsible for registering motor carriers operating motor vehicles weighing 26,001 pounds or more that travel in two (2) or more jurisdictions. The Commercial Vehicle Unit is also responsible for registering motor carriers operating under the International Fuel Tax Agreement (“IFTA”) by issuing IFTA decals to motor carriers in addition to intrastate permits such as Motor Carrier of Property Permit and the Class IE Permit. The Citizens’ Help Desk is a call center that receives over 1,000 calls daily and assists in interpreting and complying with State and Federal laws as it pertains to Georgia Title and Registration. PROCESSING CENTER Performs up‐front processing of tax documents and non‐electronically filed payments. This includes processing incoming and outgoing mail; capturing an image of all tax documents associated with a tax return for archival purposes; entering tax‐related data from tax documents into the Department’s various databases; and performing verification of data provided by taxpayers. Entering tax‐related data is done through keying, optical and intelligent character recognition (OCR/ICR), and two‐dimensional bar code technology (2D bar code). In addition, the Processing Center receives and processes all electronically filed returns. TAXPAYER SERVICES The Taxpayer Services Division registers all business and individual tax accounts and maintains a registration system of all taxpayers. This Division administers Accounts Receivable and Payable on all accounts for Income Tax, Corporate Tax, Withholding Tax, Tax Estimates, Sales Tax, and Motor Fuel Tax including the issuance of assessments and individual refunds.The Division also provides the Department’s primary customer service function. It administers laws and regulations pertaining to Individual Income Tax, Corporate Income Tax, Sales Tax, Motor Fuel Tax, and Withholding Tax.

O R G A N I Z A T I O N
6
2007 Statistical Report
REVENUE HIGHLIGHTS FOR FISCAL YEAR 2007 During Fiscal Year 2007, the Department collected a net unaudited amount of $17,567,794,839,representing an increase of $1,226,704,737 or 7.5% more than was collected in fiscal year 2006.The revenue collection amount of $17.5B in fiscal year 2007 is the highest one‐year collection amount in Department of Revenue history. Increases in tax collections during fiscal year 2007 are attributable primarily to a strengtheningeconomy and continued enforcement initiatives. Tax types that led the overall increases were as follows:
Individual Income Tax collections, which comprised approximately 49% of fiscal year 2007net tax collections, totaled $8,779M, an increase of $739M or 9.2% over fiscal year 2006collections of $8,040M.
Sales and Use Tax collections, which comprised approximately 34% of fiscal year 2007collections, totaled $5,904M, an increase of $181M or 3.2% over fiscal year 2006 collectionsof $5,723M.
Corporate Income Tax collections totaled $1,019M in fiscal year 2007, an increase of $156M or 19% over fiscal year 2006 collections of $863M.
Other Highlights for the past year: During 2007, the Georgia Department of Revenue continued its efforts to provide improvedcustomer and professional service to the taxpayers of Georgia. The Department took significant steps to support the Governor’s initiative to improve customer service in all state agencies.
The Department’s website was completely overhauled to improve its functionality andusefulness to taxpayers. The redesigned site is more visually appealing, has an improved search engine and improved navigational tools. Alcohol, Amusement, and International Fuel Tax Agreement licenses can now be renewed online.
The Motor Vehicle Division upgraded its walk‐in customer service area to a state‐of‐the‐art facility. The Division can now handle in a customer‐friendly environment, four times the number of customers it could compared to the old area.
New equipment was installed in the Department’s main customer service call center, which allows calls to be tracked from origination to finalization.
A second tier of more experienced employees was made available to forwarded callers who had complex questions or issues. This initiative resulted in more taxpayers being handled with only one call to the Department.
During 2007, the Department continued its ongoing customer‐service training designed to improve how Georgia taxpayers are handled when they need to interface with the Department.

O R G A N I Z A T I O N
7
2007 Statistical Report
To facilitate processing of individual income tax returns, automated mail extractors andscanners were installed at the Processing Center in Hapeville.
Additionally, Optical Character Recognition/Intelligent Character Recognition softwarewas introduced, which reduces the amount of manual data entry that has to be performedat the Processing Center. In 2008, both of these projects will be expanded to include other tax types.
Compliance and alcohol agents were provided with wireless tablets, which allow them todownload case information and records from the Department’s mainframe computer while theyare away from their office computer. This provides them with real‐time information while they are present at a business location.
The Department’s Bankruptcy Unit implemented a scanning system that allows its personnel tooperate in a paperless environment and communicate electronically with the court system.
The Department distributed $4.47 billion in sales and use tax and $425 million in Homeowner’s Tax Relief Grant revenue to local governments in 2007. In Tax Compliance, the Department achieved these results:
Conducted 2,343 motor fuel (dyed diesel) inspections and discovered 144 violations (130 vehicles and 24 retailers)
Conducted 3,551 underage alcohol investigations
Blocked 59,000 fraudulent refund claims totaling approximately $37 million
Obtained seven indictments for tax evasion, refund theft, and sales and use tax theft. Total revenue involved was approximately $92.8 million
The Unclaimed Property Section achieved the following results in 2007: Deposits received ‐ $95,743,458.28, Cash claims paid ‐ $10,591,716.35, Dividends paid ‐ $19,370.59, Stock proceeds ‐ $683,035.89, Shares paid – 65,454,2391, Claims paid – 3,791, and Safe deposit boxes received – 959.
In 2007, the Department joined twenty (20) other states in the Voluntary Compliance Program that was coordinated by the Multistate Tax Commission. The program provided a centralized repositoryfor taxpayers who participated in abusive tax shelters identified by the Internal Revenue Service toamend their state returns. The taxpayers were required to pay all tax and interest due on previously filed income tax returns. The Department collected approximately $5.2 million utilizing this project. In 2004, the Department began a program designed to reduce the amount of revenue due the statefrom individuals and businesses that have delinquent accounts. Since inception, the program collected approximately $356 million in delinquent accounts.

O P E R A T I O N S
8
2007 Statistical Report
$0
$3,000
$6,000
$9,000
$12,000
$15,000
$18,000
FY 2001 FY 2002 FY 2003 FY 2004 FY 2005 FY 2006 FY 2007
FY 2001 FY 2002 FY 2003 FY 2004 FY 2005 FY 2006 FY 2007Net Collections $13,934 $13,045 $12,710 $13,671 $14,710 $16,341 $17,568 Georgia Population 8,424 8,598 8,750 8,935 9,133 9,364 9,545
CHART AComparison of Net Collections (in $ millions) and Population (in 000's) by Fiscal Year
NOTE: ON July 1, 2001, the Motor Vehicle Division was transferred to the Department of Motor Vehicle Safety which was subsequently disbanded on June 30, 2005. The Motor Vehicle Division returned to DOR on July 1, 2005. Population estimates provided by U.S. Census Bureau: Released December 27, 2007.
Population (in 000's)
Net Collections (in $ millions)
0
200
400
600
800
1,000
1,200
1,400
1,600
1,800
FY 2002 FY 2003 FY 2004 FY 2005 FY 2006 FY 2007Temporary Employees 464 334 285 340 453 408Full‐Time Employees 979 1,010 943 936 1,214 1,267Total Employees 1,443 1,344 1,228 1,276 1,667 1,675
# of Employees
CHART BNumber of Department of Revenue Employees by Category and Fiscal Comparison of
Net Collections (in $ millions) and Population (in 000's) by Fiscal Year

O P E R A T I O N S
9
2007 Statistical Report
$0
$20,000
$40,000
$60,000
$80,000
$100,000
$120,000
$140,000
$160,000
FY 2003 FY 2004 FY 2005 FY 2006 FY 2007Other Funds $5,566 $5,016 $6,687 $9,529 $11,141Collection Fees $4,678 $8,038 $9,706 $10,985 $10,938Modernization $7,995 $7,317 $2,121 0 0State Funds $86,352 $82,869 $78,941 $109,512 $111,523
Spending in $ 000's
CHART CActual Department of Revenue Spending by Funding Source Fiscal Years 2003 thru 2007 (in 000's)
$0
$100,000
$200,000
$300,000
$400,000
$500,000
$600,000
$700,000
FY 2001FY 2002
FY 2003FY 2004
FY 2005FY 2006
FY 2007
Number of Accounts Processed
Collections by Compliance (in 000's)
FY 2001 FY 2002 FY 2003 FY 2004 FY 2005 FY 2006 FY 2007Collections by Compliance (in 000's) $138,998 $150,019 $169,848 $194,086 $216,972 $225,353 $231,296Number of Accounts Processed (Actual) 387,306 326,478 418,467 596,097 667,053 661,193 637,948
CHART DDelinquent Tax Collections by Compliance Division (in 000's) Compared to Number of Accounts Processed

O P E R A T I O N S
10
2007 Statistical Report
FY 2001FY 2002
FY 2003FY 2004
FY 2005FY 2006
FY 2007
$0
$2,000
$4,000
$6,000
$8,000
$10,000
$12,000
$14,000
Cost of Collection Fees (in000's)
$4,113 $3,558 $4,687 $8,038 $9,697 $10,989 $12,012
FY 2001 FY 2002 FY 2003 FY 2004 FY 2005 FY 2006 FY 2007
CHART F
Private Collection Agencies & Call Center, $102.3
Internet Listing of Delinquent Taxpayers, $41.9
Individual Income Tax, $16.9
Tax Incentive Examination $8.8
Alcohol Program, $51.4
Treasury ("IRS") Offset Program, $99.5
CHART ERevenue from Collection Initiatives: September 2003 thru June 30, 2007 (in $ millions)
Total $320,800,000

O P E R A T I O N S
11
2007 Statistical Report
0
1,000
2,000
3,000
4,000
5,000
6,000
7,000
8,000
9,000
10,000
Individual Income Tax
Individual Amended
Withholding Corporate Tax Sales & Use Tax Total of All Tax Types Processed
Calendar Year 2004 3,787 99 2,377 309 1,404 7,977Calendar Year 2005 3,886 123 2,589 326 1,313 8,236Calendar Year 2006 3,939 133 2,305 337 1,357 8,071Calendar Year 2007 4,196 183 3,238 239 1,267 9,134
NOTE: These numbers are for Individual Income Tax Only. The Department has begun to accept Sales & Use, Withholding, and Corporate returns electronically.
CHART GTax Returns Processed in Department of Revenue by Type and Calendar Year (in 000's)
0
500
1,000
1,500
2,000
Paper ReturnsPaper 2D Barcode
Total Scanned Returns Electronic Filing
Total Electronic Returns
Paper Returns Paper 2D Barcode Total Scanned Returns Electronic Filing Total Electronic ReturnsTAX DUE or Zero Balance 449 163 612 361 361REFUND 816 306 1,122 2,118 25,118
NOTE: These numbers are for Individual Income Tax Only. The Department has begun to accept Sales & Use, Withholding, and Corporate returns electronically.
CHART HElectronic Filing Results vs Paper Returns for Year Ending 2007 (in 000's)

O P E R A T I O N S
12
2007 Statistical Report
$0
$200
$400
$600
$800
$1,000
$1,200
19971998
19992000
20012002
20032004
20052006
2007
1997 1998 1999 2000 2001 2002 2003 2004 2005 2006 2007Corporate Tax Collections $707 $749 $800 $667 $690 $565 $470 $450 $679 $812 $1,019 Corporate Tax Returns Processed 167 188 205 207 216 219 229 234 237 241 250
NOTE: Return and collection figures for Fiscal Year 2005 thru Fiscal Year 2007 are estimated and unaudited
CHART INumber of Corporate Income Tax Returns Processed Annually Compared to Corporate Tax Collections (in 000's)
1997 1998 1999 2000 2001 2002 2003 2004 2005 2006 2007Net Individual Income Tax Collections $4,755 $5,334 $5,701 $6,364 $6,923 $6,714 $6,272 $6,830 $7,210 $8,040 $8,779 Number of Individual Returns Processed 3,130 3,337 3,526 3,629 3,650 3,659 3,690 3,776 3,816 3,861 4,084
0
500
1,000
1,500
2,000
2,500
3,000
3,500
4,000
4,500
$0
$1,000
$2,000
$3,000
$4,000
$5,000
$6,000
$7,000
$8,000
$9,000
$10,000
Processed$ Collections
CHART JNumber of Individual Income Tax Returns Processed by Fiscal Year (in 000's)
Compared to Net Individual Income Tax Collections (in $ millions)
NOTE: Return and collection figures for Fiscal Year 2005 thru Fiscal Year 2007 are estimated and unaudited.

O P E R A T I O N S
13
2007 Statistical Report
$0
$1,000
$2,000
$3,000
$4,000
$5,000
$6,000
FY 1997 FY 1998 FY 1999 FY 2000FY 2001
FY 2002 FY 2003
FY 2004FY 2005
FY 2006 FY 2007
FY 1997 FY 1998 FY 1999 FY 2000 FY 2001 FY 2002 FY 2003 FY 2004 FY 2005 FY 2006 FY 2007Net State Collections $4,079 $4,143 $4,486 $4,814 $5,126 $5,026 $4,985 $5,081 $5,282 $5,745 $5,949Distributions $1,571 $2,245 $2,843 $3,105 $3,242 $3,181 $3,175 $3,398 $3,745 $4,311 $4,725
CHART KComparison of Sales Tax Paid to the State Treasury and Sales Tax Distribution Fiscal Year 1997 thru 2007
(Unaudited and in $ millions)
NOTE: Return and collection figures for Fiscal Year 2006 and 2007 are estimated and unaudited.
$‐
$100,000
$200,000
$300,000
$400,000
$500,000
$600,000
$700,000
$800,000
$900,000
January February March April May June July August September October November DecemberIndividual Refunds $94,164 $415,916 $351,967 $401,819 $140,995 $153,813 $108,818 $38,709 $28,179 $60,454 $47,836 $37,490 Number of Individual Accounts 230,454 844,133 565,338 656,368 239,336 295,111 145,307 42,316 30,621 53,302 36,344 26,917 Corporate Refunds $12,661 $43,003 $16,313 $8,336 $21,927 $12,879 $6,016 $13,883 $6,304 $12,608 $10,323 $17,918 Number of Corporate Accounts 989 737 988 549 591 919 1,103 1,401 900 2,835 669 1,337 Other (Sales Taxes) Refunds $4,025 $4,900 $4,403 $5,900 $19,683 $19,303 $4,983 $7,055 $6,301 $14,341 $6,759 $4,334 Number of Other (Sales Taxes) Accounts 340 528 436 497 663 374 574 644 522 583 476 596
Refunds
REFUND HISTORY FOR 2007 BY MONTH

O P E R A T I O N S
14
2007 Statistical Report
# of Phone Calls # of Written Correspondence # Email CorrespondenceReceived Annually Received and/or Sent Received and/or Sent
Title Processing 16,261 43,128 0IRP 43,084 22,524 782Quality Assurance 2,254 23,502 0Citizens Help Desk 432,521 0 0County Help Desk 168,493 0 3,225Help Desk Administration 450 154 0Administrative Hearings 250 200 0GRATIS Training 14598 15,000 485Special Tags 300 0 0Research 4,560 464,350 473
Grand Totals 682,771 568,858 4,965
CHART L - FY 2007 Motor Vehicle Division Production Report-Tradeport Facility
Division/Section/Unit
NOTE: The Department of Revenue (Motor Vehicle Division) obtained a new queueing system installed in 2007. The data converted for lobby customers seen at Tradeport was established using the new system, therefore, data reported may not reflect accurately. Department of Revenue - Motor Vehicle Division did not have a call system with the ability to report exact call volume. The data reported has been obtained using estimated call volumes.
Ar r ived
Ti tles Salvage & Bonds ADA Commer cial Ti tles Resear ch Qual i ty Assur ance Commer cial Vehicles Commer cial Vehicles
Commer cial Vehicles IFTA Accounting Insur ance & Help Desk DOT Dealer Tags Par k - Resear ch
Arrived23,60326,992
51368,41612,535
4,69113,04715,032
4,4886,676
1441,514
228,8671,903
188,443Grand Totals 180,039 23338:48:38
Park - Research 1,127 72:03:00
DOT 17 1:13:04Dealer Tags 5,321 212:48:44
Accounting 109 11:09:02Insurance & Help Desk 1,464 184:46:52
Commercial Vehicles 3 4,079 730:57:16IFTA 6,426 961:37:34
Commercial Vehicles 1 12,769 1504:16:16Commercial Vehicles 2 14,216 1298:30:10
Research 12,089 1138:37:56Quality Assurance 4,558 540:47:12
ADA 483 47:12:34Commercial Titles 67,903 6362:53:10
Titles 22,959 2783:07:30Salvage & Bonds 26,519 7488:48:18
Lobby Customers at Tradeport Facility Customer Service Category Served Workload Time

O P E R A T I O N S
15
2007 Statistical Report
Category 2002 2003 2004 2005 2006 2007Number of Alcohol Agents 32 33 28 32 30 30 Alcohol Inspections 4,761 4,921 3,761 3,247 3,630 3,561 Alcohol Investigations 1,203 1,351 1,184 1,334 1,377 1,499 Alcohol Citations 1,066 1,320 1,691 1,861 1,659 1,716
Underage Alcohol Investigations 1,944 1,982 1,970 1,851 2,530 2,556 Underage Alcohol Citations 502 396 306 284 537 774 Liquor License Investigations 1,344 2,145 2,096 1,921 2,530 2,652 Still Seizures 2 4 7 2 4 ‐
Tobacco Inspections 3,261 3,612 2,773 2,049 2,552 2,456 Tobacco Investigations 29 10 12 4 9 9 Tobacco Citations 42 34 27 18 25 23 Underage Tobacco Investigations 937 1,232 717 553 1,008 1,568
Executive Orders 914 1,355 1,469 1,663 1,658 1,372 Game Inspections 16,356 11,803 9,676 8,764 8,312 2,130 Felony Arrests 5 7 5 13 9 3 Misdemeanor Arrests 380 325 239 202 260 196
Dyed Fuel Inspections ‐ ‐ ‐ ‐ 2006 4349Dyed Fuel Violations ‐ ‐ ‐ ‐ 115 158
CHART MAlcohol & Tobacco Division Performance Figures
$0
$2,000
$4,000
$6,000
$8,000
$10,000
$12,000
FY 2003
FY 2004
FY 2005
FY 2006
FY 2007
Delinquent Tax Collections $5,181 $9,169 $6,900 $5,869 $10,385Fee Collections $284 $278 $142 $123 $118Executive Orders/Administrative Penalties/Fines $508 $600 $733 $576 $520Total Collections & Fines Paid $5,972 $10,047 $7,776 $6,567 $11,023
CHART NTax & Fee Collections by the Enforcement Unit of the Alcohol & Tobacco Division by Fiscal Year (in 000's)
Delinquent Tax Collections as a result of enforcement activity, citations, background investigations.Fees collected in the investigation of coin‐operated amusement machines or alcohol licenses.Executive Orders/Administrative Penalties/Fines ‐ Administrative penalties and fines issued by the Administrative Hearing OfficerTotal Collections & Fines Paid ‐ Total Collections by the Alcohol & Tobacco Division's Enforcement Unit

O P E R A T I O N S
16
2007 Statistical Report
AdministrationTax Law & Policy
Number of legislative bills analyzed and summarized ‐ ‐ 144 110 195 Number of Tax Guidance letters drafted ‐ ‐ 82 70 130 Number of consolidated return applications processed ‐ ‐ 53 50 76 Number of Sales Tax exemption applications reviewed and processed ‐ ‐ 442 400 719 Number of Regulations updated or released ‐ ‐ 98 123 135
Litigation & InvestigationsSuspected fraudulent returns reviewed prior to release of funds ‐ ‐ 9,237 55,464 98,588 Number of fraudulent returns detected prior to release of funds ‐ ‐ 2,138 32,987 66,700 Funds not released (in millions) due to detection of fraud ‐$ ‐$ 2.8$ 26.9$ 42.0$
Customer Service Call Handling and Tracking
Number of individual refund calls received (thousands) 246 384 763 330 220 Number of individual refund calls answered (thousands) 117 170 238 240 220
Correspondence ManagementNumber of protests received in response to individual income tax assessment notices (thousands) ‐ 22 48 49 21 Percent of unresolved protests 120 days after filing ‐ 77% 34% 30% 10%
Education and Assistance Number of Education Seminars held 140 140 199 200 30
Unclaimed PropertyValue of unclaimed property returned to rightful owners or heirs (in $ millions) 11.0$ 8.0$ 6.8$ 8.0$ 12.0$
Grants and DistributionLocal Sales Tax Distribution
Number of local sales taxes collected 434 440 456 457 467 Total returns (SUT) processed (in $ millions) 1.3 1.2 1.4 1.4 1.2 Distribution of sales tax revenues to local governments (in $ billions) 3.2$ 3.4$ 3.7$ 3.7$ 4.7$
Homeowners Tax Relief Grants (HTRG)Value of HTRG grants distributed (in $ millions) 374$ 392$ 412$ 418$ 425$ Number of local taxing jurisdictions receiving grants 428 418 419 430 430 Number of homesteads qualifying for grants (in millions) 6 6 6 7 7
Industry RegulationAmusement Machines
Number of amusement machines reviewed annually for compliance ‐ ‐ 8,764 8,312 2,130 Number of amusement machines seized due to non‐compliance ‐ ‐ 301 193 197
Law EnforcementNumber of citations issued 1,367 1,718 1,880 1,684 1,739 Percent of alcohol inspections where the operator is not in compliance with applicable law 15% 17% 18% 15% 12%
Licenses & PermitsNumber of alcohol license investigations conducted 1,361 1,196 1,338 1,387 1,499 Number of executive orders served after administrative hearings 1,355 1,469 1,663 1,658 1,372
Underage InvestigationNumber of investigations of illegal alcohol sales to underagepersons that lead to a sanction of some kind. 559 429 285 448 774Percent of retail vendors investigated who make illegal tobacco sales to underage persons. 18% 15% 16% 18% 12%
Revenue ProcessingError Resolution
Number of sales tax returns processed through Error Resolution (thousands) 673 686 787 700 572 Percent of sales tax returns processed through Error Resolution 52.5% 56.4% 56.3% 50.0% 48.0%Total Number of Error Resolution staff (all tax types) ‐ 109 100 90 82
Money DepositsAverage time lapse in days between receipt and deposit of check in a coupon payment
2 2 2.5 2 2.5 Average time lapse in days between receipt and deposit of check in a non‐coupon payment 8 7 12.3 10 9.0 Amount of gross revenue collections deposited through electronic funds transfers (in $ billions) 11$ 12$ 12.5$ 13$ 17.3$
Returns ProcessingNumber of documents processed (millions) 7 7 7.9 7.9 7.9 Number of images created (millions) 53 53 52.6 54 54.0 Percent of Individual Income tax non‐paper returns processed (electronic, 2‐D barcode, or telefile) filings 42% 49% 59.8% 60% 68.2%
FY 2006 FY 2007Results and Performance Measures by Program FY 2003 FY 2004 FY 2005

O P E R A T I O N S
17
2007 Statistical Report
Salvage InspectionSalvage Inspection
Number of rebuilt salvage vehicle reinspections 26,822 28,130 22,618 23,208 20,991 Tag and Title RegistrationCommercial Truck Registration
Number of interstate commercial vehicle registrations ‐ ‐ ‐ 45,102 45,526 Motor Vehicle Registration
Number of motor vehicles tag registrations processed (in $ millions) ‐ ‐ ‐ 8.2 8.4 Number of internet on‐line motor vehicle title registrations ‐ ‐ ‐ 140,000 366,833
TitlesAmount of revenue generated from the issuance of motor vehicle tags and titles (in $ millions) ‐ ‐ ‐ 250 294
Tax ComplianceAssessments
Number of proposed assessments issued 371,273 237,456 240,000 230,000 245,012 Collections received during assessment phase ($ millions) 156 134 136 140 136
AuditsAverage revenue per audit hour (all tax types) 962$ 1,131$ 2,006$ 1,771$ 1,899$ Percent of audits that find businesses not in compliance with the tax laws. 43% 45% 38% 42% 39%
CollectionsTrust tax (sales and withholding) accounts collection cycle in days 480 165 165 165 165 Collections on delinquent and deficient accounts ($ millions) 285$ 243$ 392$ 235$ 357$
State Board of EqualizationState Board of Equalization
Number of appeals received 3 9 9 9 22 Number of decisions settled 2 4 3 5 22
FY 2006 FY 2007Results and Performance Measures by Program FY 2003 FY 2004 FY 2005

O P E R A T I O N S
18
2007 Statistical Report
Courses Date Location
1 Certification for Assessors July 10‐14, 2006 Coastal Georgia Center, Savannah1A Assessment Fundamentals July 24‐28, 2006 North Metro Tech, AcworthIVB Valuation of Rural Land July 24‐28, 2006 South Atlanta Metro Office ‐ DOR, HapevilleWinGAP Basic Data Entry August 7‐11, 2006 Moultrie Tech, MoultrieII Income Approach to Value August 14‐18, 2006 South Atlanta Metro Office ‐ DOR, HapevilleGA Assessment Administration August 14‐18, 2006 Georgia Southern University, Statesboro1 Certification for Assessors August 21‐25, 2006 Augusta Tech, AugustaIII Valuation of Personal Property August 21‐25, 2006 Augusta Tech, AugustaV Cost Approach to Value August 21‐25, 2006 Gwinnett Justice Center, LawrencevilleWinGAP Adv Tech August 28 ‐ September 1, 2006 South Atlanta Metro Office ‐ DOR, Hapeville1A Assessment Fundamentals August 28 ‐ September 1, 2006 Old Douglas County Courthouse, DouglasvilleAssessor Recertification September 12‐14, 2006 South Atlanta Metro Office ‐ DOR, HapevilleReview of Income Approach September 13‐15, 2006 North Metro Tech, AcworthManufactured Housing Valuation September 25‐27, 2006 South Atlanta Metro Office ‐ DOR, HapevilleWinGAP Technical September 25‐29, 2006 South Atlanta Metro Office ‐ DOR, HapevilleBasic Mapping October 2‐6, 2006 South Atlanta Metro Office ‐ DOR, Hapeville1A Assessment Fundamentals October 2‐6, 2006 Moultrie Tech, TiftonRegional Exams October 10‐11, 2006 North Metro Tech, AcworthAppeals Procedure October 10‐12, 2006 South Atlanta Metro Office ‐ DOR, HapevilleII Income Approach to Value October 16‐20, 2006 Gwinnett Justice Center, LawrencevilleGA Assessment Administration October 23‐27, 2006 North GA State University, DahlonegaWinGAP Personal Property October 24‐26, 2006 South Atlanta Metro Office ‐ DOR, HapevilleTimber Regs October 31 ‐ November 2, 2006 Days Inn & Suites, Jekyll Island1 Certification for Assessors November 13‐17, 2006 Short Course ‐ UGA, Athens1A Assessment Fundamentals November 13‐17, 2006 Short Course ‐ UGA, AthensIII Valuation of Personal Property November 13‐17, 2006 Short Course ‐ UGA, AthensVI Management Development November 13‐17, 2006 Short Course ‐ UGA, AthensWinGAP Technical November 13‐17, 2006 UGA, Short CourseAssessor Recertification November 28‐30, 2006 Moultrie Tech, TiftonV Cost Approach to Value December 4‐8, 2006 Heart of Georgia Tech, DublinReview of Income Approach December 13‐15, 2006 Moultrie Tech, TiftonWinGAP Basic Data Entry January 15‐19, 2007 South Atlanta Metro Office ‐ DOR, Hapeville1 Certification for Assessors January 22‐26, 2007 South Atlanta Metro Office ‐ DOR, Hapeville1A Assessment Fundamentals January 22‐26, 2007 Darton College, AlbanyII Income Approach to Value January 22‐26, 2007 Darton College, AlbanyIII Valuation of Personal Property January 22‐26, 2007 South Atlanta Metro Office ‐ DOR, HapevilleV Cost Approach to Value January 29‐February 2, 2007 South Atlanta Metro Office ‐ DOR, HapevilleGA Assessment Administration February 5‐9, 2007 South Atlanta Metro Office ‐ DOR, HapevilleExempt Properties February 12‐14, 2007 South Atlanta Metro Office ‐ DOR, HapevilleSpecialized Assessments February 14‐16, 2007 South Atlanta Metro Office ‐ DOR, Hapeville1 Certification for Assessors February 19‐23, 2007 Darton College, AlbanyManufactured Housing Valuation February 20‐22, 2007 Moultrie Tech, TiftonWinGAP Residential Pricing Schedules February 27 ‐ March 1, 2007 South Atlanta Metro Office ‐ DOR, Hapeville1A Assessment Fundamentals March 5‐9, 2007 Augusta Tech, AugustaReview of Income Approach March 7‐9, 2007 Augusta Tech, AugustaWinGAP Commercial Pricing Schedules March 27‐29, 2007 South Atlanta Metro Office ‐ DOR, HapevilleRegional Exams March 28‐29, 2007 Macon State, Macon1 Certification for Assessors April 9‐13, 2007 North Georgia College, Dahlonega1A Assessment Fundamentals April 9‐13, 2007 Coastal GA Community College, BrunswickIVB Valuation of Rural Land April 23‐27, 2007 Moultrie Tech ‐ TiftonGA Assessment Administration April 23‐27, 2007 Moultrie Tech ‐ TiftonExempt Properties April 30 ‐ May 2, 2007 Augusta Tech, AugustaSpecialized Assessments May 2‐4, 2007 Augusta Tech, AugustaCAVEAT May 7‐9, 2007 UGA, AthensIVA Valuation of Urban Land May 14‐18, 2007 South Atlanta Metro Office ‐ DOR, HapevilleAssessor Recertification May 15‐17, 2007 Georgia Southern University, StatesboroIII Valuation of Personal Property May 21‐25, 2007 Coastal Georgia Community Center, BrunswickBasic Accounting May 21‐25, 2007 Coastal Georgia Center, SavannahWinGAP Technical May 28 ‐ June 1, 2007 Heart of Georgia Tech, Dublin1 Certification for Assessors June 4‐8, 2007 Georgia Southern University, StatesboroV Cost Approach to Value June 4‐8, 2007 Coastal Georgia Center, SavannahBasic Mapping June 4‐8, 2007 Coastal Georgia Center, SavannahReview of Income Approach June 6‐8, 2007 South Atlanta Metro Office ‐ DOR, HapevilleVI Management Development June 11‐15, 2007 South Atlanta Metro Office ‐ DOR, HapevilleAppeals Procedure June 12‐14, 2007 North Georgia State University, DahlonegaAdvanced Auditing June 18‐22, 2007 Heart of Georgia Tech, DublinIVB Valuation of Rural Land June 25‐29, 2007 North Georgia College & State University, DahlonegaRegional Exams June 27‐28, 2007 South Atlanta Metro Office ‐ DOR, Hapeville
Local Government Services Division PresentationsOffered in Fiscal Year 2007

O P E R A T I O N S
19
2007 Statistical Report
Courses Date Location
Title Documents July 17, 2006 TradeportGRATIS System July 18, 2006 TradeportWeb Renewal July 25, 2006 TradeportMVD Training July 26, 2006 TradeportTitle Documents August 14, 2006 TradeportGRATIS System August 15, 2006 TradeportWeb Renewal August 22, 2006 TradeportMVD Training August 23, 2006 TradeportMVD Training August 29, 2006 Ware CountyMVD Training August 30, 2006 Emanuel CountyTitle Documents September 11, 2006 TradeportGRATIS System September 12, 2006 TradeportWeb Renewal September 19, 2006 TradeportMVD Training September 20, 2006 TradeportMVD Training September 26, 2006 Lumpkin CountyMVD Training September 27, 2006 Floyd CountyMVD Training October 11, 2006 Quitman CountyMVD Training October 12, 2006 Irwin CountyTitle Documents October 16, 2006 TradeportGRATIS System October 17, 2006 TradeportMVD Training October 25, 2006 TradeportWeb Renewal October 26, 2006 TradeportMVD Training November 7, 2006 Douglas CountyMVD Training November 8, 2006 Meriwether CountyTitle Documents November 13, 2006 TradeportGRATIS System November 14 ‐ 16, 2006 TradeportWeb Renewal November 28, 2006 TradeportTitle Documents December 11, 2006 TradeportGRATIS System December 12 ‐ 14, 2006 TradeportWeb Renewal December 19, 2006 TradeportWeb Renewal December 19, 2006 TradeportMVD Training January 10, 2007 Lincoln CountyMVD Training January 11, 2007 Putnam CountyTitle Documents January 22, 2007 TradeportGRATIS System January 23, 2007 TradeportWeb Renewal January 30, 2007 TradeportMVD Training February 6, 2007 Ware CountyMVD Training February 7, 2007 Laurens CountyTitle Documents February 12, 2007 TradeportGRATIS System February 21, 2007 TradeportWeb Renewal February 27, 2007 TradeportMVD Training March 6, 2007 Lowndes CountyMVD Training March 7, 2007 Quitman CountyTitle Documents March 12, 2007 TradeportGRATIS System March 13, 2007 TradeportMVD Training March 21, 2007 TradeportWeb Renewal March 28, 2007 TradeportMVD Training April 3, 2007 Walker CountyMVD Training April 4, 2007 White CountyTitle Documents April 9, 2007 TradeportGRATIS System April 10, 2007 TradeportMVD Training April 18, 2007 TradeportWeb Renewal April 25, 2007 TradeportGATO May 30, 2007 UGA, AthensMVD Training May 30, 2007 TradeportMVD Training June 5, 2007 Crisp CountyMVD Training June 6, 2007 Bibb CountyTitle Documents June 11, 2007 TradeportGRATIS System June 12, 2007 TradeportMVD Training June 20, 2007 TradeportWeb Renewal June 26, 2007 Tradeport
Motor Vehicle Division SeminarsOffered in Fiscal Year 2007

O P E R A T I O N S
20
2007 Statistical Report
Courses Date Location
Automotive Presentation July 14, 2006 AtlantaManufacturing Presentation August 14, 2006 ThomastonManufacturing Presentation September 13, 2006 AtlantaGovernor's Tourism Conference September 14, 2006 ColumbusGeorgia Automobile Dealers September 20, 2006 MaconGeorgia Automobile Dealers September 21, 2006 Atlanta
National Association of Attorneys General ("NAAG") States' Association of Bankruptcy Attorneys ("SABA") October 19, 2006 Santa FeIPT November 13, 2006 AtlantaGeorgia Society of Certified Public Accountants January 6, 2007 AtlantaHospitality Financial & Technology Professionals February 20, 2007 AtlantaMTC Litigation Committee Winter Meeting March 27, 2007 San DiegoMTC State Tax Attorney Teleconference Series May 22, 2007 AtlantaTax Executives Institute June 11, 2007 Atlanta
Tax Law & Policy SeminarsOffered in Fiscal Year 2007

C O L L E C T I O N S A N D T R E N D S
21
2007 Statistical Report
MONTH FY 2003 FY 2004 FY 2005 FY 2006 FY 2007
July 898,993 837,429 923,170 1,125,295 1,176,085August 962,576 1,008,251 1,240,527 1,293,514 1,275,942September 1,138,661 1,256,951 1,365,677 1,413,635 1,564,037October 1,034,960 1,091,048 1,181,617 1,341,544 1,360,901November 1,064,161 1,119,279 1,184,588 1,220,490 1,278,362December 1,106,994 1,142,875 1,408,275 1,528,212 1,634,397January 1,362,525 1,458,811 1,555,050 1,811,584 1,978,077February 990,809 923,714 771,545 797,282 961,225March 833,900 937,196 1,127,440 1,248,194 1,174,222April 956,831 1,304,267 1,276,168 1,324,724 1,309,159May 1,293,337 1,394,347 1,443,257 1,696,667 2,140,232June 1,272,147 1,344,916 1,523,000 1,589,510 1,681,040
Monthly Department Collections (in 000's)
Source: Central Accounting, Georgia Department of Revenue ("DOR").NOTE: As of July 1, 2005, the Motor Vehicle Division returned to DOR.
Fiscal Year Amount Fiscal Year Amount Fiscal Year Amount1940 44,170 1963 422,533 1986 4,739,0231941 40,380 1964 468,243 1987 5,090,6221942 57,062 1965 523,599 1988 5,532,6601943 55,259 1966 585,584 1989 6,086,7811944 56,906 1967 641,167 1990 6,802,4021945 58,347 1968 703,270 1991 6,861,6311946 75,483 1969 795,125 1992 6,992,5171947 92,519 1970 904,279 1993 7,826,8611948 101,588 1971 949,146 1994 8,444,8641949 102,947 1972 1,145,094 1995 9,115,2431950 117,894 1973 1,298,984 1996 9,928,5081951 145,305 1974 1,454,888 1997 10,543,1061952 220,505 1975 1,485,597 1998 11,090,7771953 210,038 1976 1,607,948 1999 12,068,4781954 216,092 1977 1,826,490 2000 13,041,6551955 226,226 1978 2,094,166 2001 13,934,1261956 283,154 1979 2,353,857 2002 13,044,9471957 300,953 1980 2,624,813 2003 12,709,7991958 303,953 1981 2,911,453 2004 13,670,6381959 321,702 1982 3,161,548 2005 14,709,9131960 352,008 1983 3,389,303 2006 16,341,0901961 374,423 1984 3,818,550 2007 17,567,7951962 383,718 1985 4,373,972
TABLE H‐1Net Revenue Collections by Georgia Department of Revenuefor Fiscal Years 1940 thru 2007 (Unaudited & in 000's)
(Net of Commissions and Refunds)

C
O
L
L
E
C
T
I
O
N
S
A
N
D
T
R
E
N
D
S
22
2007 Statistical Report
2005 2006 2007 '05 ‐ '06 '06 ‐ '07 '05 ‐ '06 '06 ‐ '07
Net Revenue Collections 14,710$ 16,341$ 17,568$ 11.09% 7.51% 1,631 1,227
General Sales and Use Tax 5,315 5,723 5,904 7.68% 3.16% 408 181
Motor Fuel Tax 519 473 482 ‐8.86% 1.90% (46) 9
Prepaid Motor Fuel Sales Tax 336 371 468 10.42% 26.15% 35 97
Personal Income Tax 7,210 8,040 8,779 11.51% 9.19% 830 739
Corporate Income Tax 679 812 1,019 19.59% 25.49% 133 207
Liquor, Beer & Wine Tax 151 157 161 3.97% 2.55% 6 4
Cigar and Cigarette Tax 249 244 243 ‐2.01% ‐0.41% (5) (1)
Motor Vehicle Fees ‐ 253 294 ‐ 16.21% 253 41
Other Revenues 587 270 211 ‐54.00% ‐21.85% (317) (59)
Collections in Millions Percentage Changes Absolute Changes
0 2,000,000 4,000,000 6,000,000 8,000,000 10,000,000 12,000,000 14,000,000 16,000,000 18,000,000
Net Revenue Collections
General Sales and Use Tax
Motor Fuel Tax
Prepaid Motor Fuel Sales Tax
Personal Income Tax
Corporate Income Tax
Liquor, Beer & Wine Tax
Cigar and Cigarette Tax
Motor Vehicle Fees
Other Revenues
T housands
CHART 1 - CHANGES IN MAJOR STATE TAX REVENUES FOR FISCAL YEARS 2005, 2006 and 2007 (in 000's and Unaudited)
2005
2006
2007

C O L L E C T I O N S A N D T R E N D S
23
2007 Statistical Report
TABLE H‐2 Revenue Collections by Tax Type for Fiscal Years 2005, 2006 and 2007Dollar amounts for fiscal years ending June 30 (in 000's)
Motor Fuel Excise Tax 518,831 473,062 481,970 Cigar and Cigarette Tax 249,057 243,542 242,950 Liquor 44,062 44,024 48,731 Beer 82,697 86,953 86,556 Wine 24,091 25,853 25,744
SELECTIVE SALES (EXCISE) TAXES 918,738 873,434 885,902 GENERAL SALES AND USE TAX 5,315,000 5,723,211 5,903,918 PREPAID MOTOR FUEL SALES TAX (1) 336,459 371,160 468,390 PERSONAL INCOME TAXES 7,210,446 8,039,731 8,778,933
Financial Institutions Occupations Tax 15,102 16,139 16,347 Corporation Net Worth Tax 29,948 35,188 27,874 Corporate Income Tax 679,001 811,536 974,909
CORPORATION INCOME AND LICENSE TAXES 724,051 862,863 1,019,130 Tags and Registration Fees ‐ 252,548 294,467
MOTOR VEHICLE FEES (2) ‐ 252,548 294,467 ESTATE TAXES 42,657 10,316 1,426
General Property Digest (Real and Tangible) 63,263 4,398 75,170 Public Utilities, Ad Valorem Tax (128) (34) 52 Public Service Commission (Utility Fees) 1,100 1,050 1,048 Intangibles, Recording Fees 1,812 169 (1,821) Interest and Other Property Tax Revenues 570 19 267
PROPERTY TAXES 66,618 5,602 74,716 Motor Carrier Collections & Distributions (33,422) (32,909) (26,665) Motor Carrier Decals, Citations & Temp Permits 341 14,652 205
MOTOR CARRIER FUEL TAXES AND FEES (3) (33,081) (18,257) (26,460) Coin‐Operated Amusement Machines, Licenses 1,257 775 1,856 Liquor Dealers, Licenses 493 238 354 Beer Dealers, Licenses 610 281 444 Cigar and Cigarette Dealers, Licenses 14 (231) 11 Wine Dealers, Licenses 505 221 396 Commercial Bus Licenses ‐ 33,430 29,863 Contractors Fees 5 ‐ ‐ Peace Officers & Prosecutors Training Fund ‐ ‐ ‐ Unclaimed Property 71,736 73,869 84,272 State Children's Trust Fund ‐ ‐ ‐ Local Sales Tax 1% Collection Fees 37,700 43,673 47,195 Other Collections (4) 16,705 68,226 47,203
OTHER TAXES OR FEES 129,024 220,482 211,594 TOTAL NET REVENUE COLLECTIONS (5) 14,709,913 16,341,090 17,567,795
(1) Collection of Prepaid Motor Fuel Sales Tax began January 1, 2004, 2nd Motor Fuel Tax collected prior to this date in FY 2004 is included(2) Tag and Title Registration returned to DOR on July 1, 2005.(3) Amounts for Motor Carrier Fuel (IFTA) Tax are included in "Motor Fuel Taxes" amounts as shown in Chart 1(4) Commissions authorized by law for collecting and assessing totaled $65,101 in FY 2004, $63,033 in FY 2005, and $70,477 in FY 2006. Refunds paid through the Department of Administrative Services totaled $1,987,771 in FY 2004, $1,843,039 in FY 2005 and $2,129,743 in FY 2006.(5) Total are unaudited and include commissions paid to counties, compensation paid to vendors, and reimbursement to the budget fund
Note: All the information provided in this table is taken from preliminary unaudited figures provided by the State Accounting Office

C
O
L
L
E
C
T
I
O
N
S
A
N
D
T
R
E
N
D
S
24
2007 Statistical Report
$0
$1,000,000
$2,000,000
$3,000,000
$4,000,000
$5,000,000
$6,000,000
$7,000,000
$8,000,000
$9,000,000
$10,000,000
1998 1999 2000 2001 2002 2003 2004 2005 2006 2007
CHART 2 - Ten-Year Trend in Georgia's State Tax Revenues by Major Sources (Fiscal Year Ended June 30 of Year Shown - in 000's)
Other Sources Selective Sales Taxes
General Sales and Use Tax Personal & Corporate Income Tax
(Includes Motor Fuel Excise Tax and all Tobacco and Alcohol Taxes)

C O L L E C T I O N S A N D T R E N D S
25
2007 Statistical Report
General Sales and Use
Selective Sales Taxes
Income Taxes (2)
Other Taxes or Fees
1996 9,929 350 10,279 3,951 827 4,930 571 1997 10,543 376 10,919 4,067 849 5,462 541 1998 11,091 393 11,484 4,006 871 6,083 524 1999 12,068 392 12,460 4,479 876 6,501 834 2000 13,041 409 13,450 4,807 958 7,032 653 2001 13,934 411 14,345 5,139 957 7,613 636 2002 13,128 467 13,595 4,621 1,013 7,279 682 2003 12,777 476 13,253 4,992 1,070 6,742 449 2004 13,671 509 14,180 4,902 1,223 7,279 776 2005 14,710 523 15,233 5,315 1,251 7,889 778 2006 16,341 567 16,908 5,723 1,216 8,852 550 2007 17,568 596 18,164 5,904 1,228 9,754 682
1996 96.6% 3.4% 100% 38.4% 8.0% 48.0% 5.6%2007 96.7% 3.3% 100.0% 32.5% 6.8% 53.7% 3.8%
TABLE H‐3Trend in Georgia's State Tax Revenues by Major Sources Fiscal Years 1996 thru 2007
(Unaudited and in $ millions)Breakdown of Grand Total by Major Source
Fiscal Year Department of Revenue
Other Agencies
Grant Total (1)
Amount (millions of $)
Change from Prior Year (%)
Net Amount ($000's)
Change from Prior Year (%)
1996 159,800 9.92 4,233,297 10.3 1.0371997 172,935 8.22 4,754,777 12.3 1.4991998 183,757 6.26 5,333,762 12.2 1.9461999 200,104 8.90 5,700,758 6.88 0.7732000 212,081 5.99 6,364,428 11.64 1.9452001 230,356 8.62 6,922,895 8.77 1.0182002 240,616 4.45 6,714,191 ‐3.01 ‐0.6772003 244,957 6.34 6,271,693 ‐9.41 ‐1.4842004 251,612 4.57 6,829,822 1.72 0.3772005 265,199 8.26 7,210,446 14.97 1.8112006 282,979 12.47 8,039,731 17.72 1.4212007 299,885 13.08 8,778,932 21.75 1.663
(i) Personal Income amounts are for immediately preceding calendar year.(ii) Ratio of the percentage change in tax receipts to percentage change in personal income. This is a measure of the sensitivity of personal income tax revenue to changes in personal income. A ratio of 1,000 would indicate an identical rate of change for income and tax yield. Source: U.S. Department of Commerce, Office of Economics: Georgia Department of Revenue.
TABLE H‐4Comparative Trends in Georgia's Personal Income and State Income Tax Receipts,
Fiscal Years Ending 1996 thru 2007 (Unaudited)Total Personal Income Personal Income Tax Receipts
Fiscal Year Ending June 30 (i)
"Income Elasticity Ratio (ii)"

C O M P A R I S O N S
26
2007 Statistical Report
‐
10.0
20.0
30.0
40.0
50.0
60.0
1985 to 19901990 to 1995
1995 to 20002000 to 2005
2001 to 2006
Percentage Increase
1985 to 1990 1990 to 1995 1995 to 2000 2000 to 2005 2001 to 2006Georgia 34.8 24.3 26.9 11.4 12.0 Southeast 36.3 25.1 27.3 17.5 21.3 United States 34.1 22.1 26.3 15.6 19.8
Source: U.S Department of Commerce, Bureau of Economic Analysis: Published December 2006
CHART 4 Per Capita Personal Income Percent Increase Comparisons by Five‐Years Periods (in Calendar Years)
1996 1997 1998 1999 2000 2001 2002 2003 2004 2005 2006Georgia 23.1 23.9 25.4 26.4 28.0 30.6 28.5 28.3 29.9 31.3 33.2Southeast 22.1 23.0 24.2 25.0 26.5 27.3 27.7 28.7 29.6 31.1 32.0U.S. 24.3 25.4 26.9 27.9 29.8 30.6 30.8 31.5 33.1 34.7 36.6
0.0
5.0
10.0
15.0
20.0
25.0
30.0
35.0
40.0Per Capita Incom
e in 000's
CHART 3Georgia, Southeast and United States Per Capita Income (Calendar Years and in $000's)
Source: U.S. Department of Commerce, Bureau of Economic Analysis: Released December 2006.
C O M P A R I S O N S
27
2007 Statistical Report
0
10
20
30
40
50
60
70
1985 to 1990 1990 to 1995 1995 to 2000 2000 to 2005 2001 to 2006Georgia 47.1 43.4 43.1 22.8 30.2Southeast 44.2 39.2 33.2 25.3 35.1U.S. 40.5 33.0 34.2 21.4 30.2
Percent
CHART 6Total Personal Income Percent Increase Comparison by Period
Source: U.S. Department of Commerce, Bureau of Economic Analysis: Released December 2006.
CHART 5 Georgia, Southeast Total Personal Income as a Percentage of United States by Calendar Year
0.00%
5.00%
10.00%
15.00%
20.00%
25.00%
1996 1997 1998 1999 2000 2001 2002 2003 2004 2005 2006
Source: U.S. Department of Commerce: Bureau of Economic Analysis: Released December 2006
Georgia
Southeast

C O M P A R I S O N S
28
2007 Statistical Report
$0
$500
$1,000
$1,500
$2,000
$2,500
U.S. AVG.
AL
FLGA
NC
SCTN
TOTAL TAX REVENUE
$2,373
$1,855
$2,056
$1,819
$2,326
$1,796
$1,764
SALES & GROSS RECEIPTS
$757
$483
$1,149
$620
$945
$737
$1,328
LICENSES
$151
$105
$105
$58
$139
$100
$195
OTHER TAXES
$1,465
$1,267
$802
$1,142
$1,242
$958
$241
TOTAL TAX REVENUE
SALES & GROSS RECEIPTS
LICENSES
OTHER TAXES
CHART7
Per Capita Com
parison of State Tax Collections: Calendar Year 2006
Source:U.S. Department of Com
merce, Bureau of Economic Analysis: Released Decem
ber 2006
C O M P A R I S O N S
29
2007 Statistical Report
U.S. A
VG.
AL
FLGA
NC
SCTN
TOTA
L TA
X REVENUE
$65
$60
$56
$57
$72
$60
$55
SALES & GRO
SS RECEIPTS
$30
$30
$42
$25
$29
$33
$41
LICENSES
$4
$3
$3
$2
$4
$3
$6
INCO
ME & OTH
ER TAXES
$30
$27
$12
$30
$38
$24
$7
$0
$10
$20
$30
$40
$50
$60
$70
$80
TOTA
L TA
X REVENUE
SALES & GRO
SS RECEIPTS
LICENSES
INCO
ME & OTH
ER TAXES
Source: U..S.Department of Com
merce, Bureau of Economic Analysis: Released Decem
ber 2006
CHART 8
Selected State Tax Collections to $1,000 Personal Incom
e Calendar Year2006

S E L E C T E D T A X D A T A
30
2007 Statistical Report
Food14.3%
Manufacturers5.1%
Utilities11.6%
Miscellaneous10.7%
Lumber10.3% Home
9.2% Automotive 14.9%
Apparel3.5%
General Merchandise13.0%
Services7.5%
TOTAL ALL GROUPS $5,908,875
Accounting Adjustments Net
TOTAL "NET COLLECTIONS" $5,903,918
Vendor Discount $53,077
Adjusted Total Revenue $5,956,995
NOTE: Data is for State tax only; excludes local taxes.
Fiscal Year Ended June 30, 2006 (Unaudited & in 000’s)
TOTAL ALL GROUPS $5,740,809
Accounting Adjustments Net ($17,598)
TOTAL "NET COLLECTIONS" $5,723,211
Vendor Discount $51,064
Adjusted Total Revenue $5,774,275
NOTE: Data is for State tax only; excludes local taxes.
Food13.9%
Manufacturers5.1%
Utilities12.0%
Miscellaneous10.8%
Services7.5% General
Merchandise13.1%
Apparel3.6%
Automotive 15.2%
Home9.0%
Lumber9.9%
BUSINESS GROUP COLLECTIONS PERCENT Food $819,633 14.3% Apparel $198,801 3.5% General Merchandise $747,109 13.0% Automotive $852,560 14.9% Home $526,192 9.2% Lumber $591,547 10.3% Service $431,632 7.5% Manufacturers $293,166 5.1% Utilities $664,579 11.6% Miscellaneous $615,590 10.7% Total $5,740,809
BUSINESS GROUP COLLECTIONS PERCENT Food $819,441 13.9% Apparel $213,481 3.6% General Merchandise $774,009 13.1% Automotive $896,204 15.2% Home $533,673 9.0% Lumber $587,397 9.9% Service $442,189 7.5% Manufacturers $299,505 5.1% Utilities $707,998 12.0% Miscellaneous $634,977 10.8% Total $5,908,875
TABLE 1 ‐ Sales and Use Tax Revenues by Business Group Fiscal Year Ended June 30, 2007 (Unaudited and in 000's)

S E L E C T E D T A X D A T A
31
2007 Statistical Report
0
200,000
400,000
600,000
800,000
J F M A M J J A S O N D
Sales & Use Tax Collection Comparison By Month and Year (in 000's)
2003200420052006
Month CY 2003 CY 2004 CY 2005 CY 2006
January 428,415 461,515 526,457 656,558
February 491,600 450,029 455,396 416,312
March 398,698 400,865 471,240 496,289
April 408,081 428,148 465,015 466,796
May 502,456 442,890 480,289 461,208
June 436,958 527,921 536,350 570,688
July 373,836 401,711 486,030 484,663
August 382,919 501,059 532,524 519,675
September 415,877 439,098 483,671 487,446
October 452,126 456,524 456,114 511,183
November 390,804 442,556 477,256 429,190
December 407,146 434,347 516,136 582,516
Total $5,088,916 $5,386,663 $5,886,478 $6,082,524
TABLE 2 ‐ Sales and Use Tax Collections byMonth: Calendar Years 2003 thru 2006 (in 000's)

S E L E C T E D T A X D A T A
32
2007 Statistical Report
CY of EarningsNumber of
Returns (000's)Adjusted Gross Income
Reported (in 000's)Taxable Net Income
Reported (000's) Tax Liability (000's)
1994 2,964 96,300,663 65,123,187 3,559,1311995 3,076 104,219,482 69,551,937 3,899,8051996 3,166 112,437,195 79,372,476 4,357,8591997 3,130 118,870,445 84,667,727 4,665,7201998 3,337 132,507,265 93,022,750 5,125,9911999 3,526 152,855,648 107,079,738 5,829,9152000 3,629 157,455,921 117,845,448 6,361,2642001 3,650 150,635,841 111,049,521 6,043,4492002 3,659 149,204,721 108,276,684 5,879,8922003 3,690 153,771,193 112,028,551 6,104,8442004 3,776 165,421,204 122,448,097 6,712,6802005 3,836 172,975,112 129,060,396 7,100,396
CY of Earnings Number of Returns (000's)
Adjusted Gross Income Reported (in 000's)
Taxable Net Income Reported (000's)
Tax Liability (000's)
1994 109 8,339,229 4,324,818 222,2811995 112 7,918,819 4,428,749 340,6731996 90 8,217,713 9,820,539 458,0541997 -37 6,433,250 5,295,252 307,8611998 207 13,636,821 8,355,023 460,2711999 189 20,348,382 14,056,988 703,9242000 104 4,600,273 10,765,710 531,3492001 21 -6,820,079 -6,795,927 -317,8142002 8 -1,431,121 -2,772,836 -163,5572003 31 4,566,472 3,751,867 224,9522004 87 11,650,011 10,419,546 607,8362005 57 7,553,908 6,612,299 388,244
CY of EarningsNumber of
Returns (000's)Adjusted Gross Income
Reported (in 000's)Taxable Net Income
Reported (000's) Tax Liability (000's)
1994 3.83% 9.48% 7.11% 6.66%1995 3.78% 8.22% 6.80% 9.57%1996 2.94% 7.89% 14.12% 11.75%1997 -1.16% 5.72% 6.67% 7.06%1998 6.63% 11.47% 9.87% 9.86%1999 5.65% 15.36% 15.11% 13.73%2000 2.94% 3.01% 10.05% 9.11%2001 0.58% -4.33% -5.77% -5.00%2002 0.23% -0.95% -2.50% -2.71%2003 0.85% 3.06% 3.47% 3.83%2004 2.35% 7.58% 9.30% 9.96%2005 1.57% 4.57% 5.40% 5.78%
TABLE 3 - Growth Trend of Personal Income Tax by Calendar Year (in 000's)
Annual Numerical Increase
Annual Percentage Increase

S E L E C T E D T A X D A T A
33
2007 Statistical Report
GROSS TAXABLE GALLONAGE BY PRODUCTGasoline 5,016,695,269 Diesel Fuel 1,744,579,705 Special Fuel 16,491,614 Aviation Gasoline 8,650,205 Other: Propane (LPG) 1,865,399
Total Motor Fuel Gallons Gallons = 6,788,282
TAX REVENUES BY PRODUCT (Dollars)Gasoline 385,644 Diesel Fuel 134,448Special Fuel 2,000Aviation Gasoline 83 Other (Undistributed by Fuel Type) (31,906)
Penalties & Interest ‐ Motor Fuel 442 Subtotal Motor Fuel Collections 490,712$
LESS ‐ EXPENSE TO COLLECTVendors Compensation (6,602)
LESS ‐ REFUNDS (Retail Dealer and Agriculture)Motor Fuel Refunds (Agricultural & Retail Dealers) (2,140)Distributor Refunds & AdjustmentsSub‐total Refunds (2,140)Total Expenses and Refunds (8,742)
MOTOR FUEL TAX REVENUE, MOTOR FUELS(Net of Commissions and Refunds) 481,970$
PREPAID STATE TAXPrepaid State Tax (i) 468,390
468,390$
SOURCE AND AMOUNT OF REVENUE (Dollars)Motor Carrier Mileage Tax 11,764 IFTA Jurisdictional Distributions (38,429)Subtotal Motor Carrier Collections & Distributions (26,665)
MOTOR FUEL TRUCK REGISTRATION FEESAdjustments, Net (Citations) (1) IFTA Registrations Fees 206 Subtotal Motor Fuel Truck Registration Fees 205
TOTAL MOTOR CARRIER TAX & REGISTRATION FEES (26,460)$
(i)
MOTOR CARRIER
TABLE 4Motor Fuel and Motor Carrier Detailed Revenue Data for Fiscal Year 2007 (Unaudited and in 000's)
MOTOR FUEL
PREPAID MOTOR FUEL STATE TAX
Effective January 1, 2004, all licensed motor fuel distributors (suppliers) in the State of Georgia must collect a PrepaidState Tax on all motor fuel sold to any purchaser not licensed as a Georgia distributor.
The 2003 General Assembly, through House Bill 43 (Act 343) changed the method of collecting andremitting the three (3%) percent Second Motor Fuel Tax and the one (1%) percent State Sales & UseTax on sales or use of motor fuel.
The Prepaid State Tax combines these two percentage taxes and is collected at the time of sale by thelicensed distributor.The new Prepaid State Tax rate for each fuel type is based on indexed retail sales price converted to acent per gallon rate.

S E L E C T E D T A X D A T A
34
2007 Statistical Report
Over
MILLION
7
0.18%
17,723,362
13.73%
2,504
1,061,631
150,011
7
Over
500,000
11
0.28%
6,290,185
4.87%
590
374,754
35,178
12
Over
100,000
312
8.12%
39,477,344
30.59%
127
2,289,828
7,351
346
Over
50,000
647
16.87%
31,134,206
24.12%
48
1,710,975
2,645
606
Over
30,000
618
16.12%
14,996,704
11.62%
24
762,204
1,233
510
Over
25,000
234
6.09%
3,650,022
2.83%
16
169,462
725
213
Over
20,000
268
6.98%
3,182,737
2.47%
12
136,413
510
245
Over
15,000
296
7.70%
2,373,740
1.84%
8
88,772
300
260
Over
14,000
64
1.66%
359,205
0.28%
6
11,774
185
56
Over
13,000
63
1.64%
305,546
0.24%
5
9,532
152
54
Over
12,000
64
1.68%
259,253
0.20%
4
7,599
118
55
Over
11,000
72
1.87%
217,425
0.17%
3
5,974
83
67
Over
10,000
66
1.73%
176,859
0.14%
3
4,559
69
52
Over
9,000
65
1.70%
149,620
0.12%
2
3,486
53
44
Over
8,000
67
1.74%
111,146
0.09%
2
2,293
34
42
Over
7,000
76
1.97%
87,540
0.07%
1
1,577
21
44
Over
6,000
67
1.75%
55,114
0.04%
1
816
12
30
Over
5,000
68
1.78%
20,315
0.02%
0
202
3
26
Over
4,000
68
1.78%
344
0.00%
0
5
0
23
Over
3,000
68
1.78%
65
0.00%
0
1
0
20
Over
2,000
66
1.72%
55
0.00%
0
3
0
16
Over
1,000
61
1.59%
25
0.00%
0
1
0
11
To1,000
510
13.29%
8,489,584
6.58%
17
458,963
900
272
Totals
3,836
129,060,396
3,373
7,100,824
1,851
3,011
FED. AGI
3,781
284,291,265
TOTAL RETUR
NS
148
ADJ TO FED
42438,514
TOTAL TAX
41287,293
ADJ TO FED
616
‐9,874,647
CR TOTAL WITHHELD
102
177,986
GA. AGI
3,371
172,975,112
TOTAL PEN
ALTY
11959
DEDUCTION
S1,396
29,621,647
ITEMIZED
2,109
5,188,096
W
ITHHELD
3,282
6,642,731
CR FRO
M EST
180
1,334,615
JOINT
1,350
133
LOW
INCOME CRE
1,018
24,595
SEPAR
ATE
7011
TOTAL CREDIT
4,480
8,001,847
SINGLE
1,373
87 TP OVER 65
332
HEAD OF HOU
SEHOLD
784
28
TABLE 5 ‐ Georgia Personal Incom
e ‐ 2005 Returns by Income Class
NUM
BER OF
RETURN
S (000's)
% TOTAL
RETURN
S
NUM
BER
(in 000's)
NET INCOME
(in 000's)
% TOTAL
INCOME
AVERAGE NTI
(in 000's)
TOTAL TAX
(in 000's)
RESIDENT
NON
‐RESIDEN
T
INCOME LEVEL
TITLE OF FIELD
$ AM
OUNT
(in 000's)
FOR OTHER YEARS
$ AM
OUNT
(in 000's)
AVERAGE TAX
(in 000's)
EXEM
PTIONS
(in 000's)
NUM
BER

S E L E C T E D T A X D A T A
35
2007 Statistical Report
BEERBeer Taxes 85,956Fines and Forfeitures 603Refunds (3)Total 86,556$
TOBACCOStamp Sales 242,805Fines and Forfeitures 150Refunds (6)Total 242,950$
LIQUORLiquor Taxes 48,385Fines and Forfeitures 58Refunds (1)Pre‐License Investigations 289Total 48,731$
MOTOR FUELS (Table 4) 481,970$
WINEWine Taxes 25,733Fines and Forfeitures 13Refunds (2)Total 25,744$
TOTAL SELECTIVE EXCISE TAXES 885,902$
BEER DEALERS License and Brand Registration (161) 1Wholesaler Licenses (74) 21Retailer Licenses (20,491) 397Special Permits (367) 26Total 444$
CIGAR AND CIGARETTE DEALERSWholesaler, Manufacturer & Importer Licenses 11Manufacturer Representative Licenses 0Total 11$
LIQUOR DEALERSLicense and Brand Registration (324) 20Wholesaler Licenses & Permits (46) 47Retailer Licenses (7,317) 253Special Permits (214) 32Retail In‐Room Service License Fees 2Total 354$
WINE DEALERSLicense and Brand Registration (1,317) 1Wholesaler Licenses & Permits (101) 31Retailer Licenses (11,855) 349Special Permits (260) 14Total 396$
COIN‐OPERATED AMUSEMENT MACHINESAnnual Licenses and Permit Fees 1,855Refunds (‐) 0Total 1,855$
COMMERCIAL BUS LICENSESLicenses 39,733Refunds (‐) (9,870)Total 29,863$
TOTAL, BUSINESS LICENSE FEES 32,923$
(Number of Licensees) ($ Amounts in 000's)
TABLE 5Revenue From Selective Excise Taxes and Business License Fees
Fiscal Year 2007
BUSINESS LICENSES FEES

S E L E C T E D T A X D A T A
36
2007 Statistical Report
RETURN TYPE TOTAL
Paper Returns 449 816 1,265
2D Barcode 163 306 469
Total Scanned Returns 612 1,122 1,734
Electronic Filing 361 2,118 2,479
Total Electronic Returns 361 2,118 2,479
Total All Returns 973 3,240 4,213
TAXES DUE REFUND
TABLE 8 Electronic Filing Results for Fiscal Year 2007 (in 000's)
$1,698,403 5.7%
Growth in Sales & Use Tax Distributions to the General Fund and 1% to CountiesTABLE 7
Growth in Sales & Use Tax Deposits Paid to the State Treasury (in 000's)
Growth in Distribution of One (1%) Local Option Sales Tax Paid to Counties (in 000's)
$5,948,545 3.5%$5,281,929 $5,745,409
$1,433,330 $1,606,221
FY 2005 FY 2006 FY 2007 % Chg 06 ‐ 07
FY 2005 FY 2006 FY 2007 % Chg 06 ‐ 07

S E L E C T E D T A X D A T A
37
2007 Statistical Report
FY State Rate Grand Total 10 Yr 20 Yr Public Utilities 10 Yr 20 Yr(Per $1000 value) Growth Rate Growth Rate Growth Rate Growth Rate
1910 5.00 766,889 77% 124,337 175%1920 5.00 1,346,889 76% 212% 165,410 33% 266%1930 5.00 1,303,462 -3% 70% 216,232 31% 74%1940 5.00 917,612 -30% -32% 165,146 -24% 0%1950 5.00 1,487,323 62% 14% 247,148 50% 14%1960 0.25 3,031,881 104% 230% 423,707 71% 157%1970 0.25 9,148,736 202% 515% 1,157,333 173% 368%1980 0.25 39,169,215 328% 1192% 3,834,604 231% 805%1990 0.25 104,270,104 166% 1040% 8,068,762 110% 597%2000 0.25 201,251,237 93% 414% 10,313,948 28% 169%2004 0.25 272,207,115 35% 161% 11,330,385 10% 40%2005 0.25 291,219,580 7% 45% 11,549,924 2% 12%2006 0.25 318,095,398 9% 17% 12,135,793 5% 7%
General Property (net of exemptions) (in 000's)
Net Taxable Values (in 000's)Grand Total Public Utilities
Total 10 Yr 20 Yr 10 Yr 20 Yr Personal 10 Yr
FY Growth Rate Growth Rate Growth Rate Growth Rate Property Growth Rate1910 642,551 66% 389,394 64% 253,156 69%1920 1,181,476 84% 205% 714,151 83% 201% 467,322 85%1930 1,087,229 -8% 69% 776,073 9% 99% 311,155 -33%1940 752,466 -31% -36% 500,610 -35% -30% 251,857 -19%1950 1,240,174 65% 14% 669,405 34% -14% 570,769 127%1960 2,608,171 110% 247% 1,560,867 133% 212% 1,047,301 83%1970 7,991,398 206% 544% 6,945,928 345% 938% 1,045,457 0%1980 35,334,601 342% 1255% 25,323,247 265% 1522% 10,011,336 858%1990 96,201,335 172% 1104% 71,614,692 183% 931% 24,586,632 146%2000 190,937,287 98% 440% 146,053,491 104% 477% 44,883,790 83%2004 260,876,732 37% 171% 217,607,321 49% 204% 43,269,408 -4%2005 279,669,656 7% 46% 236,646,531 9% 62% 43,023,125 -1%2006 305,959,605 10% 17% 251,602,699 11% 21% 54,356,906 -1%
Real Property
General Property (net of exemptions) (in 000's)
TABLE 9 Taxable Values and Tax Rates, State of Georgia for General Property and Public Utilities, Selected Years: Fiscal Year 1910 thru 2006
TABLE 10 Summary of Net Property Tax Collections by Category,
Fiscal Year 2007 (State Taxes Only, Net of Refunds and Commissions in 000's)
PROPERTY TAX CATEGORY DOLLARSGeneral Property (Real and Tangible Personal) $75,170Public Utilities, Ad Valorem Tax ‐‐ Railroad Companies 52Intangible Recording Fees (1,821)Interest and Other Property Tax Revenue 267Public Service Commission (Utility Fees) 1,048
Total 74,716
NOTE: In previous Statistical reports, the above years represented distribution by Digest year, which was the prior calendar year.

S E L E C T E D T A X D A T A
38
2007 Statistical Report
TABLE 11 Values of General Property, Public Utilities Dollars by Class of Property
Fiscal Years 2006 and 2007
Fiscal Year 2006 (000's)
Fiscal Year 2007 (000's)
General Property Real Estate 604,168,858 672,012,711 67,843,853 Motor Vehicles 52,602,433 51,793,246 (809,187) Other Personal Tangible Property 90,187,088 93,390,207 3,203,119 Total, Gross Value 746,958,379 817,196,164 70,237,785Exemptions, Homestead, Agriculture and Freeport 47,784,238 52,297,151 4,512,913Total Net Taxable General Property 699,174,141 764,899,013 65,724,872
Public Utilities ‐ Gross (1) Market Value Railroads 2,131,241 2,109,463 (21,778) Telephones 6,931,501 6,054,613 (876,888) Electric 18,469,029 19,257,801 788,772 Gas 1,335,712 1,336,950 1,238 Pipeline 821,463 877,890 56,427 Flight Equipment 1,841,534 1,929,916 88,382Total Taxable Public Utilities 31,530,479 31,566,635 36,153
Grand Total Taxable Value 730,704,621 796,465,646 65,761,025
FAIR MARKET VALUESCLASS OF PROPERTY
NET CHANGE FISCAL YEAR 2006 to 2007
Year Payment to Counties2000 $75,5752001 157,8232002 243,7102003 374,2122004 392,3942005 412,8262006 419,3642007 424,625
$2,500,529
TABLE 11AHomestead Taxpayer Relief Grant Distribution ("HTRG")
by Fiscal Year (in 000's)
NOTE: In previo us s ta tis tica l repo rts , the abo ve years repres ented dis tributio n by Diges t year, which was the prio r ca lendar year

S E L E C T E D T A X D A T A
39
2007 Statistical Report
TOTAL (Actual)
PER 100 RESIDENTS (Actual)
TOTAL (000's)
AVERAGE PER RETURN (Actual $$)
TOTAL (in 000's)
AVERAGE PER RETURN (Actual
$$)
Appling 17,892 6,589 37 208,310 31,615 132,983 6,941 1,053 203Atkinson 7,965 2,740 34 72,785 26,564 44,429 2,217 809 223Bacon 10,418 3,788 36 116,564 30,772 75,397 3,909 1,032 214Baker 4,137 1,263 31 37,140 29,406 24,601 1,278 1,012 210Baldwin 45,314 16,204 36 545,354 33,656 351,091 18,417 1,137 186Banks 16,101 6,737 42 239,515 35,552 157,720 8,335 1,237 446Barrow 59,920 23,975 40 973,934 40,623 653,354 34,973 1,459 428Bartow 89,049 35,992 40 1,488,844 41,366 991,066 53,190 1,478 331Ben Hill 17,369 6,537 38 207,748 31,780 140,517 7,375 1,128 187Berrien 16,735 6,158 37 196,642 31,933 133,631 7,016 1,139 216Bibb 154,381 58,371 38 2,115,388 36,240 1,448,167 78,004 1,336 141Bleckley 12,210 4,529 37 159,849 35,294 109,101 5,808 1,282 199Brantley 15,474 5,622 36 178,497 31,750 118,338 6,166 1,097 318Brooks 16,269 5,731 35 162,463 28,348 107,179 5,536 966 250Bryan 28,575 10,916 38 530,924 48,637 379,674 20,848 1,910 498Bulloch 62,011 20,730 33 776,353 37,451 529,037 28,495 1,375 312Burke 23,154 8,703 38 260,674 29,952 166,817 8,611 989 209Butts 22,837 8,610 38 319,775 37,140 204,653 10,844 1,259 305Calhoun 6,025 1,935 32 56,067 28,975 35,782 1,843 952 177Camden 45,751 15,131 33 530,945 35,090 370,548 19,666 1,300 385Candler 10,352 3,678 36 117,113 31,842 75,537 3,977 1,081 265Carroll 104,386 39,526 38 1,622,027 41,037 1,132,488 61,251 1,550 282Catoosa 60,736 22,036 36 846,788 38,427 594,287 31,803 1,443 306Charlton 10,714 3,086 29 99,522 32,250 66,739 3,495 1,132 234Chatham 238,039 96,641 41 4,393,840 45,466 3,163,320 174,165 1,802 233Chattahoochee 12,406 1,335 11 27,934 20,925 18,559 911 682 163Chattooga 26,499 9,630 36 284,605 29,554 190,881 9,837 1,021 179Cherokee 184,360 77,774 42 4,553,753 58,551 3,246,447 180,513 2,321 572Clarke 111,661 38,420 34 1,537,261 40,012 1,096,266 59,616 1,552 227Clay 3,232 1,072 33 28,865 26,927 18,531 949 885 209Clayton 266,614 98,761 37 3,088,773 31,275 1,815,922 92,701 939 179Clinch 6,992 2,320 33 72,245 31,140 46,794 2,431 1,048 199Cobb 663,528 269,131 41 16,281,819 60,498 12,089,806 678,748 2,522 288Coffee 39,588 13,778 35 462,804 33,590 307,854 16,266 1,181 254Colquitt 43,886 15,669 36 499,148 31,856 333,762 17,543 1,120 216Columbia 103,490 42,529 41 2,327,925 54,737 1,708,068 94,831 2,230 410Cook 16,311 5,990 37 186,114 31,071 121,889 6,326 1,056 223Coweta 109,769 40,554 37 1,627,853 40,140 1,099,403 58,894 1,452 340Crawford 12,837 4,577 36 153,644 33,569 98,396 5,140 1,123 324Crisp 21,884 8,178 37 259,110 31,684 169,450 8,939 1,093 212Dade 16,129 5,464 34 189,704 34,719 133,865 7,097 1,299 290Dawson 19,825 7,930 40 412,560 52,025 292,239 16,157 2,037 559Decatur 28,412 10,177 36 329,500 32,377 215,458 11,358 1,116 218DeKalb 713,679 272,244 38 13,244,876 48,651 9,402,178 518,804 1,906 218Dodge 19,521 7,026 36 215,005 30,601 142,847 7,462 1,062 210Dooly 11,703 4,381 37 122,596 27,984 76,898 3,940 899 217Dougherty 94,998 35,747 38 1,255,880 35,132 825,496 44,047 1,232 159Douglas 112,914 47,018 42 2,019,735 42,957 1,346,023 72,514 1,542 291
TABLE 12Calendar Year 2005 Personal Income Tax Data by County of Residence
TOTAL AGI GROWTH INDEX
1987 = 100
COUNTY
2005 RESIDENT POPULATION ESTIMATE (Actual)
NET TAXABLE INCOME (in 000's)
AMOUNT OF TAX LIABILITYNUMBER OF RETURNS TABULATED
ADJUSTED GROSS INCOME LESS DEFICIT

S E L E C T E D T A X D A T A
40
2007 Statistical Report
TOTAL (Actual)
PER 100 RESIDENTS (Actual)
TOTAL (000's)
AVERAGE PER RETURN (Actual $$)
TOTAL (in 000's)
AVERAGE PER RETURN (Actual $$)
Early 12,068 4,220 35 132,316 31,354 88,413 4,653 1,103 180Echols 4,207 1,044 25 31,088 29,778 20,388 1,056 1,012 369Effingham 46,842 18,248 39 802,702 43,988 553,693 29,908 1,639 474Elbert 20,741 8,166 39 260,450 31,894 173,595 9,098 1,114 192Emanuel 22,186 8,428 38 234,501 27,824 143,187 7,339 871 194Evans 11,354 4,159 37 136,802 32,893 91,386 4,833 1,162 249Fannin 21,812 8,494 39 299,387 35,247 202,536 10,873 1,280 322Fayette 104,186 40,557 39 2,755,915 67,952 2,009,616 113,595 2,801 378Floyd 94,362 36,586 39 1,477,972 40,397 1,028,292 55,776 1,525 203Forsyth 140,804 52,766 37 4,187,493 79,360 3,128,869 177,660 3,367 1,073Franklin 21,560 9,063 42 289,772 31,973 193,693 10,254 1,131 237Fulton 934,242 327,696 35 25,587,478 78,083 20,114,711 1,153,377 3,520 297Gilmer 27,349 10,121 37 382,478 37,791 259,312 13,932 1,377 400Glascock 2,670 974 36 31,646 32,491 20,603 1,073 1,101 194Glynn 71,639 30,420 42 1,567,128 51,516 1,148,114 63,930 2,102 279Gordon 50,227 20,224 40 752,456 37,206 510,056 27,095 1,340 253Grady 24,508 8,311 34 277,427 33,381 188,913 10,002 1,203 248Greene 15,570 6,229 40 353,911 56,817 259,390 14,558 2,337 437Gwinnett 726,790 286,410 39 15,620,795 54,540 10,907,183 603,274 2,106 395Habersham 39,621 15,111 38 580,824 38,437 393,459 21,091 1,396 266Hall 166,302 67,511 41 3,342,965 49,517 2,323,657 127,626 1,890 366Hancock 9,713 3,278 34 90,192 27,514 52,460 2,606 795 197Haralson 28,335 10,619 37 377,372 35,537 253,037 13,460 1,268 244Harris 27,697 11,288 41 587,752 52,069 409,804 22,562 1,999 437Hart 23,953 9,619 40 320,299 33,299 216,548 11,489 1,194 241Heard 11,336 3,910 34 132,736 33,948 85,388 4,448 1,138 842Henry 168,204 70,732 42 3,380,602 47,795 2,223,451 120,642 1,706 602Houston 125,576 50,568 40 2,053,614 40,611 1,443,689 77,856 1,540 264Irwin 10,227 3,582 35 116,309 32,470 78,349 4,122 1,151 255Jackson 52,357 21,256 41 914,711 43,033 619,833 33,484 1,575 423Jasper 13,144 5,367 41 206,699 38,513 133,155 7,076 1,318 353Jeff Davis 13,082 5,275 40 162,327 30,773 103,938 5,395 1,023 193Jefferson 16,783 6,842 41 195,620 28,591 119,420 6,082 889 175Jenkins 8,715 2,991 34 83,891 28,048 52,673 2,687 898 187Johnson 9,522 2,902 30 82,324 28,368 51,092 2,604 897 169Jones 26,744 10,830 40 459,666 42,444 312,183 16,831 1,554 324Lamar 16,605 6,585 40 220,963 33,555 142,703 7,492 1,138 245Lanier 7,521 2,554 34 72,682 28,458 46,482 2,391 936 248Laurens 46,939 18,893 40 652,302 34,526 431,300 22,853 1,210 223Lee 31,137 10,748 35 512,272 47,662 354,604 19,284 1,794 478Liberty 60,688 16,386 27 501,071 30,579 322,029 16,725 1,021 355Lincoln 8,283 3,178 38 108,221 34,053 73,187 3,896 1,226 237Long 11,122 2,872 26 82,741 28,810 51,568 2,633 917 361Lowndes 96,756 35,673 37 1,327,044 37,200 921,485 49,581 1,390 257Lumpkin 24,529 9,622 39 380,684 39,564 260,611 14,025 1,458 439Macon 13,725 3,853 28 106,254 27,577 65,737 3,325 863 142Madison 27,442 10,623 39 368,419 34,681 246,093 13,003 1,224 245Marion 7,222 2,418 33 76,883 31,796 49,803 2,587 1,070 254
TABLE 12Calendar Year 2005 Personal Income Tax Data by County of Residence
TOTAL AGI GROWTH INDEX
1987 = 100
COUNTY
2005 RESIDENT POPULATION ESTIMATE (Actual)
NET TAXABLE INCOME (in 000's)
AMOUNT OF TAX LIABILITYNUMBER OF RETURNS TABULATED
ADJUSTED GROSS INCOME LESS DEFICIT

S E L E C T E D T A X D A T A
41
2007 Statistical Report
TOTAL (Actual)
PER 100 RESIDENTS (Actual)
TOTAL (000's)
AVERAGE PER RETURN (Actual $$)
TOTAL (in 000's)
AVERAGE PER RETURN (Actual $$)
McDuffie 21,680 8,658 40 287,115 33,162 184,527 9,671 1,117 208McIntosh 11,000 4,237 39 143,323 33,827 93,147 4,929 1,163 282Meriwether 22,754 8,608 38 277,116 32,193 175,528 9,156 1,064 204Miller 6,161 2,149 35 69,572 32,374 46,242 2,439 1,135 181Mitchell 23,710 8,258 35 234,927 28,448 148,636 7,596 920 204Monroe 23,734 9,913 42 541,425 54,618 392,856 21,879 2,207 438Montgomery 8,938 2,905 33 90,432 31,130 57,870 3,002 1,033 233Morgan 17,524 7,236 41 361,964 50,023 254,044 14,034 1,940 377Murray 40,814 14,158 35 480,072 33,908 321,604 16,712 1,180 248Muscogee 185,799 70,590 38 2,883,371 40,847 2,022,236 110,212 1,561 215Newton 86,529 34,493 40 1,435,689 41,623 931,608 49,885 1,446 406Oconee 29,760 12,284 41 818,480 66,630 606,559 34,150 2,780 547Oglethorpe 13,601 5,266 39 192,327 36,523 130,096 6,898 1,310 315Paulding 112,566 46,445 41 2,169,623 46,714 1,463,699 79,124 1,704 699Peach 24,481 9,789 40 350,954 35,852 230,567 12,239 1,250 219Pickens 28,440 11,711 41 583,187 49,798 411,876 22,680 1,937 404Pierce 17,120 6,497 38 230,745 35,516 155,615 8,281 1,275 296Pike 16,073 6,689 42 279,810 41,831 182,835 9,815 1,467 372Polk 40,436 15,324 38 497,482 32,464 330,809 17,338 1,131 194Pulaski 9,757 3,415 35 118,438 34,682 78,937 4,190 1,227 209Putnam 19,703 8,205 42 362,188 44,142 252,983 13,824 1,685 375Quitman 2,461 741 30 20,898 28,203 13,896 721 973 294Rabun 16,265 6,307 39 254,827 40,404 175,386 9,534 1,512 333Randolph 7,282 2,556 35 69,476 27,182 44,185 2,264 886 170Richmond 194,135 72,855 38 2,438,130 33,466 1,635,321 86,797 1,191 163Rockdale 78,398 31,099 40 1,372,394 44,130 912,316 49,408 1,589 246Schley 4,101 1,477 36 55,581 37,631 39,041 2,087 1,413 262Screven 15,288 5,705 37 164,131 28,770 103,334 5,316 932 189Seminole 9,191 3,386 37 106,698 31,512 69,000 3,636 1,074 203Spalding 61,262 24,611 40 848,557 34,479 544,903 28,792 1,170 190Stephens 25,044 9,855 39 319,530 32,423 216,905 11,495 1,166 177Stewart 4,878 1,587 33 41,753 26,309 26,736 1,359 856 150Sumter 32,507 11,407 35 388,849 34,089 258,321 13,679 1,199 191Talbot 6,639 2,572 39 81,455 31,670 50,512 2,620 1,019 224Taliaferro 1,835 665 36 16,188 24,342 9,711 485 730 157Tattnall 23,181 6,888 30 211,441 30,697 137,242 7,148 1,038 216Taylor 8,826 3,189 36 98,855 30,999 63,201 3,298 1,034 199Telfair 13,341 4,073 31 109,392 26,858 66,865 3,401 835 162Terrell 10,684 3,724 35 126,912 34,080 84,191 4,462 1,198 200Thomas 44,643 16,989 38 717,528 42,235 515,024 28,126 1,656 243Tift 40,731 15,445 38 541,387 35,053 357,211 18,964 1,228 217Toombs 27,169 9,895 36 328,715 33,220 214,688 11,358 1,148 198Towns 10,281 4,125 40 164,585 39,899 118,047 6,461 1,566 419Treutlen 6,734 2,239 33 61,959 27,673 37,853 1,926 860 200Troup 62,632 24,186 39 935,506 38,680 630,282 33,809 1,398 206Turner 9,436 3,538 37 97,973 27,692 60,676 3,122 883 195Twiggs 10,273 3,801 37 115,883 30,487 74,731 3,850 1,013 216Union 20,079 7,565 38 298,476 39,455 209,811 11,437 1,512 452
TABLE 12Calendar Year 2005 Personal Income Tax Data by County of Residence
TOTAL AGI GROWTH INDEX
1987 = 100
COUNTY
2005 RESIDENT POPULATION ESTIMATE (Actual)
NET TAXABLE INCOME (in 000's)
AMOUNT OF TAX LIABILITYNUMBER OF RETURNS TABULATED
ADJUSTED GROSS INCOME LESS DEFICIT

S E L E C T E D T A X D A T A
42
2007 Statistical Report
TOTAL (Actual)
PER 100 RESIDENTS (Actual)
TOTAL (000's)
AVERAGE PER RETURN (Actual $$)
TOTAL (in 000's)
AVERAGE PER RETURN (Actual $$)
Upson 27,660 10,533 38 334,365 31,745 222,477 11,654 1,106 175Walker 63,812 24,106 38 810,602 33,627 561,580 29,658 1,230 196Walton 75,670 30,076 40 1,421,293 47,257 963,073 52,472 1,745 477Ware 35,353 13,290 38 420,377 31,631 282,447 14,922 1,123 168Warren 6,067 2,386 39 69,999 29,337 42,936 2,195 920 203Washington 19,998 7,617 38 298,783 39,226 204,565 11,031 1,448 220Wayne 28,536 9,789 34 332,949 34,013 217,178 11,477 1,172 226Webster 2,254 880 39 26,635 30,267 17,729 921 1,047 225Wheeler 6,703 1,709 25 47,302 27,678 28,344 1,434 839 191White 24,024 9,462 39 355,856 37,609 236,763 12,692 1,341 382Whitfield 91,099 36,955 41 1,688,550 45,692 1,188,023 64,624 1,749 225Wilcox 8,629 2,448 28 72,357 29,558 47,563 2,463 1,006 183Wilkes 10,480 4,045 39 207,119 51,204 163,096 9,132 2,258 259Wilkinson 10,094 4,050 40 126,498 31,234 80,188 4,143 1,023 155Worth 21,849 8,204 38 269,111 32,802 176,204 9,234 1,126 239Other 350,665 5,980,068 40,474 10,603,371 579,935 2,755 464
TOTAL 9,132,553 3,835,660 42 172,975,109 5,852,162 129,060,376 7,100,925 214,344 288
NOTE: The total AGI Growth Index is based on 1987 AGI.
TABLE 12Calendar Year 2005 Personal Income Tax Data by County of Residence
TOTAL AGI GROWTH INDEX
1987 = 100
COUNTY
2005 RESIDENT POPULATION ESTIMATE (Actual)
NET TAXABLE INCOME (in 000's)
AMOUNT OF TAX LIABILITYNUMBER OF RETURNS TABULATED
ADJUSTED GROSS INCOME LESS DEFICIT

S E L E C T E D T A X D A T A
43
2007 Statistical Report
Appling 297,615 278,151 329,363 3,409 3,413 3,409 10,231Atkinson 138,247 117,310 5,704 667 676 676 2,019Bacon 199,586 187,697 11,181 1,282 1,314 1,312 3,908Baker 121,469 112,913 5,794 258 255 257 770Baldwin 1,033,826 974,982 57,221 6,895 6,866 6,891 20,652Banks 648,855 517,369 18,592 3,303 3,267 3,312 9,882Barrow 1,921,840 1,704,666 44,332 9,506 9,280 9,240 28,026Bartow 2,819,996 2,685,032 208,344 21,724 21,690 21,594 65,008Ben Hill 376,052 333,731 15,722 2,525 2,548 2,512 7,585Berrien 393,452 293,292 13,941 1,724 1,722 1,721 5,167Bibb 3,955,352 3,743,284 116,646 32,090 31,066 24,985 88,141Bleckley 221,398 206,638 9,177 1,089 778 1,086 2,953Brantley 287,467 267,152 19,624 1,371 1,336 1,414 4,121Brooks 400,056 336,224 14,061 1,238 1,262 1,251 3,751Bryan 1,090,664 1,062,867 22,669 4,056 4,056 4,186 12,298Bulloch 1,523,371 1,348,807 42,845 10,413 10,378 10,398 31,189Burke 524,956 438,355 1,155,328 3,328 3,309 ‐ 6,637Butts 702,458 586,297 39,076 4,812 4,811 4,787 14,410Calhoun 98,095 91,289 7,399 449 450 449 1,348Camden 1,221,234 1,193,122 38,931 8,781 8,768 57 17,606Candler 218,427 194,354 9,011 1,436 1,416 1,413 4,265Carroll 2,695,480 2,497,770 91,992 16,780 16,775 16,722 50,277Catoosa 1,601,787 1,488,873 37,519 9,564 9,583 9,560 28,707Charlton 240,298 219,940 20,997 1,142 1,135 1,123 3,400Chatham 11,581,547 10,821,590 235,587 64,060 63,944 1 128,005Chattahoochee 52,135 49,638 4,515 461 444 453 1,358Chattooga 576,391 526,414 17,669 2,619 2,628 2,610 7,857Cherokee 7,592,199 7,227,600 132,572 ‐ 31,674 31,530 63,204Clarke 3,373,049 3,221,180 71,315 20,221 20,225 20,203 60,649Clay 96,177 82,971 6,468 356 358 359 1,073Clayton 7,749,763 7,401,862 903,746 55,251 55,235 55,306 165,792Clinch 151,628 137,664 14,382 763 774 770 2,307Cobb 29,795,709 28,102,924 490,700 ‐ 108,539 138,959 247,498Coffee 885,786 746,104 27,689 5,990 5,910 5,920 17,820Colquitt 730,391 680,687 30,875 5,821 5,833 5,822 17,476Columbia 3,542,744 3,343,599 54,301 16,111 16,068 16,055 48,234Cook 410,650 318,727 13,954 2,083 2,088 2,098 6,269Coweta 3,827,367 3,631,700 164,236 20,099 20,102 20,053 60,254Crawford 234,486 217,782 13,148 661 668 669 1,998Crisp 556,808 491,679 7,192 4,615 4,616 4,622 13,853Dade 452,351 418,410 15,422 2,575 2,567 2,571 7,713Dawson 1,295,324 1,186,364 19,417 5,872 5,858 5,840 17,570Decatur 748,673 656,838 31,138 4,982 4,984 4,997 14,963DeKalb 25,041,044 24,383,692 477,637 101,043 ‐ 108,595 209,638Dodge 421,405 354,053 20,113 2,125 2,124 2,126 6,375Dooly 269,017 227,027 12,670 1,528 1,527 1,520 4,575Dougherty 1,998,896 1,820,595 59,597 18,202 18,202 17,860 54,264Douglas 3,990,619 3,764,996 97,473 25,385 25,278 25,274 75,937Early 302,304 274,352 19,335 2,019 2,019 2,019 6,057Echols 110,531 103,060 4,710 157 155 155 467Effingham 1,280,022 1,203,375 126,664 8,288 8,294 8,409 24,991
TABLE 13 ‐ Selected Tax Statistics and Estimates by County, Calendar Year 2006
COUNTYASSESSED VALUE ($1,000'S) (1) COUNTY 1% TAX DISTRIBUTION ($1,000'S)
GENERAL PROPERTY NET PUBLIC UTILITY LOST SPLOST ELOST TOTAL
GROSS NET

S E L E C T E D T A X D A T A
44
2007 Statistical Report
Elbert 532,690 465,215 23,241 2,259 2,258 2,256 6,773Emanuel 474,871 398,723 18,048 2,751 2,769 2,768 8,288Evans 229,461 213,896 6,104 1,389 1,381 1,395 4,165Fannin 925,923 855,716 18,412 4,329 4,315 4,294 12,938Fayette 5,124,228 4,938,484 64,713 21,347 20,785 ‐ 42,132Floyd 2,637,851 2,446,218 361,006 16,608 804 16,524 33,936Forsyth 8,337,553 7,895,766 92,168 31,977 31,933 31,742 95,652Franklin 865,386 643,564 21,245 3,897 3,880 3,890 11,667Fulton 47,494,227 45,751,370 1,091,205 236,674 118,192 236,195 591,061Gilmer 1,299,098 1,126,097 26,953 5,065 5,026 5,003 15,094Glascock 62,710 59,389 3,580 219 220 223 662Glynn 4,838,644 4,648,977 74,841 21,397 21,394 ‐ 42,791Gordon 1,552,243 1,415,403 34,565 9,384 9,353 9,347 28,084Grady 698,199 561,889 15,877 2,845 2,828 2,845 8,518Greene 1,516,926 1,415,115 24,717 3,493 3,509 3,514 10,516Gwinnett 29,991,864 28,567,101 441,877 ‐ 155,272 155,097 310,369Habersham 1,299,112 1,154,889 49,839 6,411 6,365 6,373 19,149Hall 5,782,433 5,339,981 111,856 29,568 29,500 29,493 88,561Hancock 276,194 246,800 35,879 508 505 382 1,395Haralson 695,356 621,722 35,261 4,209 4,203 4,247 12,659Harris 918,963 880,824 74,419 2,657 2,653 2,651 7,961Hart 1,064,840 946,990 29,541 3,216 3,217 3,208 9,641Heard 299,466 254,540 119,228 5,718 5,713 5,708 17,139Henry 6,690,425 6,140,062 100,127 30,310 30,195 30,157 90,662Houston 3,336,990 3,120,112 79,474 20,889 20,820 20,845 62,554Irwin 209,489 176,366 14,420 659 655 657 1,971Jackson 1,999,523 1,780,560 53,826 9,830 9,675 9,762 29,267Jasper 560,715 404,241 25,291 1,135 879 1,130 3,144Jeff Davis 264,072 245,183 12,885 2,009 2,005 2,003 6,017Jefferson 461,699 375,285 24,927 2,196 2,188 2,182 6,566Jenkins 150,928 138,902 13,384 756 751 754 2,261Johnson 166,541 132,109 6,540 627 633 624 1,884Jones 591,589 550,131 44,955 2,498 2,500 2,490 7,488Lamar 444,003 391,313 17,294 1,597 1,596 1,594 4,787Lanier 102,669 97,659 6,624 582 563 574 1,719Laurens 1,275,750 1,104,158 39,698 8,686 8,570 8,685 25,941Lee 820,081 745,155 17,002 3,502 3,508 3,499 10,509Liberty 984,207 922,734 45,444 7,901 7,892 8,122 23,915Lincoln 293,024 257,238 5,873 870 863 867 2,600Long 132,801 125,732 9,166 450 450 470 1,370Lowndes 2,553,484 2,402,212 71,971 22,685 22,711 22,654 68,050Lumpkin 1,047,404 913,330 21,026 3,478 3,455 3,448 10,381Macon 333,344 284,494 19,905 1,301 1,305 1,309 3,915Madison 646,575 575,923 44,091 2,088 2,077 2,079 6,244Marion 208,798 184,462 8,791 486 479 484 1,449McDuffie 532,923 480,992 17,412 3,577 3,570 3,585 10,732McIntosh 437,297 419,581 14,589 1,675 1,675 1,685 5,035Meriwether 597,612 465,970 20,618 1,824 1,812 1,822 5,458Miller 170,211 143,400 5,561 637 640 581 1,858Mitchell 585,122 465,766 26,358 2,695 2,685 2,607 7,987Monroe 746,250 691,025 1,272,648 4,197 4,194 4,216 12,607Montgomery 163,921 145,882 8,007 672 670 669 2,011Morgan 941,850 708,663 20,007 3,762 3,739 3,742 11,243Murray 951,165 917,641 28,022 4,593 4,540 4,549 13,682
TABLE 13 ‐ Selected Tax Statistics and Estimates by County. Calendar Year 2006
COUNTYASSESSED VALUE ($1,000'S) (1) COUNTY 1% TAX DISTRIBUTION ($1,000'S)
GENERAL PROPERTY NET PUBLIC UTILITY LOST SPLOST ELOST TOTAL
GROSS NET

S E L E C T E D T A X D A T A
45
2007 Statistical Report
Muscogee 4,419,598 4,157,858 108,440 35,615 35,588 35,510 106,713Newton 2,841,136 2,559,588 51,325 10,996 10,972 10,918 32,886Oconee 1,515,542 1,311,277 24,505 5,519 5,488 5,470 16,477Oglethorpe 501,824 413,251 11,481 832 834 822 2,488Paulding 3,812,241 3,584,299 63,713 15,323 15,136 15,003 45,462Peach 553,100 511,454 15,257 3,710 3,705 2,973 10,388Pickens 1,267,625 1,212,302 29,800 4,469 4,428 4,392 13,289Pierce 364,530 333,214 15,548 1,946 1,947 1,964 5,857Pike 527,903 443,260 9,510 1,225 55 1,225 2,505Polk 909,017 827,458 87,361 4,905 4,893 3,975 13,773Pulaski 238,694 218,997 7,258 1,025 1,025 1,014 3,064Putnam 1,308,573 1,213,921 117,074 5,201 5,188 5,195 15,584Quitman 84,009 71,110 2,327 264 268 264 796Rabun 1,038,358 994,381 312,263 3,394 3,386 3,385 10,165Randolph 212,631 174,379 8,673 900 897 285 2,082Richmond 4,454,740 4,153,962 131,172 36,950 28,373 36,766 102,089Rockdale 2,739,481 2,643,488 59,023 16,086 17,313 17,471 50,870Schley 86,801 76,567 3,373 348 351 347 1,046Screven 427,997 376,663 19,006 1,337 1,340 1,348 4,025Seminole 243,684 206,027 9,621 1,078 1,079 1,077 3,234Spalding 1,541,578 1,390,630 29,564 9,497 5,240 9,450 24,187Stephens 743,628 666,023 28,708 3,651 3,642 3,646 10,939Stewart 135,238 125,622 7,062 398 397 395 1,190Sumter 754,193 656,063 31,341 4,188 4,172 4,178 12,538Talbot 255,614 208,324 16,557 609 608 608 1,825Taliaferro 81,518 66,154 3,367 121 119 119 359Tattnall 331,244 295,272 18,524 1,729 1,726 1,740 5,195Taylor 191,342 165,727 13,630 919 920 922 2,761Telfair 312,284 254,996 12,108 1,207 1,204 1,194 3,605Terrell 251,053 192,510 10,370 933 922 915 2,770Thomas 1,162,463 1,057,242 22,996 7,706 102 7,645 15,453Tift 1,107,609 903,931 34,251 9,099 9,088 9,078 27,265Toombs 557,139 502,564 25,375 4,707 4,709 4,657 14,073Towns 824,509 760,780 10,178 2,252 2,282 2,257 6,791Treutlen 136,521 112,727 6,003 451 453 450 1,354Troup 1,885,999 1,687,787 44,204 10,258 10,256 10,182 30,696Turner 207,901 160,915 10,955 937 936 940 2,813Twiggs 203,970 184,408 16,053 877 750 877 2,504Union 1,316,030 1,192,259 14,375 3,769 3,768 3,748 11,285Upson 682,690 601,656 25,399 3,448 3,407 1,284 8,139Walker 1,411,266 1,312,704 31,682 5,876 5,875 5,860 17,611Walton 2,770,027 2,558,417 64,936 10,465 10,412 10,392 31,269Ware 599,919 564,693 52,207 6,782 6,774 6,792 20,348Warren 180,934 152,170 11,692 560 556 562 1,678Washington 650,388 587,590 38,337 3,871 3,875 1,111 8,857Wayne 581,230 540,024 29,277 4,219 4,217 12 8,448Webster 56,748 51,611 3,713 163 168 166 497Wheeler 138,783 118,642 6,953 421 411 237 1,069White 960,355 872,337 23,781 3,331 3,314 3,314 9,959Whitfield 3,167,102 3,102,141 68,648 19,978 9,594 19,839 49,411Wilcox 149,061 129,701 8,702 467 465 464 1,396Wilkes 392,371 318,883 10,303 1,190 1,183 1,176 3,549
TABLE 13 ‐ Selected Tax Statistics and Estimates by County, Calendar Year 2006
COUNTYASSESSED VALUE ($1,000'S) (1) COUNTY 1% TAX DISTRIBUTION ($1,000'S)
GENERAL PROPERTY NET PUBLIC UTILITY LOST SPLOST ELOST TOTALGROSS NET

S E L E C T E D T A X D A T A
46
2007 Statistical Report
GROSS NET
Wilkinson 340,724 318,135 19,018 2,003 2,008 1,999 6,010Worth 492,477 394,135 17,285 1,642 1,644 1,641 4,927
STATE TOTAL 327,239,089 306,320,229 12,132,789 1,687,969 1,091,616 1,524,986 4,304,571
(1) Net Digest amounts reflect state homestead exemption requirements only. Some counties have expanded homestead exemptionsfor local taxing purposes. As of 1990, property values no longer include motor vehicle values. Beginning in 1991, assessed value includes public utilities in general property.(2) $101,043 in DeKalb HOST located in LOST Column.(3) $118,192 in OTHER LOST for Fulton (Municipal Option ST; MOST) is located in SPLOST Column.(4) $16,086 in HOST for Rockdale County located in LOST Column.(5) $2,282 in 2nd LOST for Towns County is located in SPLOST column.
TABLE 13 ‐ Selected Tax Statistics and Estimated by County Calendar Year 2006
GENERAL PROPERTYCOUNTY NET PUBLIC UTILITY
ASSESSED VALUE ($1,000'S) (1) COUNTY 1% TAX DISTRIBUTION ($1,000'S)
LOST SPLOST ELOST TOTAL

S E L E C T E D T A X D A T A
47
2007 Statistical Report
Thousand
Dollars
RANK
Thousand Dollars
RANK
Thousand
Dollars
RANK
1% ST
Distribution
Income
Reported
Net Digest
Fulton
934,242
1236,674
125,587,478
146,842,575
1253
27,388
50,140
Gwinnett
726,790
2155,272
215,620,795
329,008,978
2214
21,493
39,914
DeKalb
713,679
4101,043
413,244,876
424,861,329
4142
18,559
34,835
Cobb
663,528
3138,959
316,281,819
228,593,624
3209
24,538
43,093
Cla yton
266,614
655,251
63,088,773
108,305,608
6207
11,585
31,152
Chatham
238,039
564,060
54,393,840
611,057,177
5269
18,458
46,451
Richmond
194,135
1236,950
72,438,130
134,285,134
13190
12,559
22,073
Muscogee
185,799
1135,615
82,883,371
114,266,298
14192
15,519
22,962
Cherokee
184,360
731,674
114,553,753
57,360,172
8172
24,700
39,923
Henr y
168,204
930,310
123,380,602
86,240,189
9180
20,098
37,099
Hall
166,302
1029,568
133,342,965
95,451,837
10178
20,102
32,783
Bibb
154,381
1332,090
92,115,388
163,859,930
16208
13,702
25,003
Forsyth
140,804
831,977
104,187,493
77,987,934
7227
29,740
56,731
Houston
125,576
1720,889
192,053,614
173,199,586
21166
16,354
25,479
Dou glas
112,914
1525,385
142,019,735
183,862,469
15225
17,887
34,207
Pauldin g
112,566
2015,323
282,169,623
153,648,012
18136
19,274
32,408
Clarke
111,661
2220,221
201,537,261
233,292,495
20181
13,767
29,487
Coweta
109,769
1820,099
211,627,853
203,795,936
17183
14,830
34,581
Carroll
104,386
2416,780
241,622,027
212,589,762
28161
15,539
24,809
Fayette
104,186
1421,347
182,755,915
125,003,197
11205
26,452
48,022
Columbia
103,490
1916,111
262,327,925
143,397,900
19156
22,494
32,833
Lowndes
96,756
2522,685
151,327,044
292,474,183
29234
13,715
25,571
Dou gherty
94,998
3018,202
231,255,880
301,880,192
31192
13,220
19,792
Flo yd
94,362
2616,608
251,477,972
252,807,224
24176
15,663
29,750
Whitfield
91,099
2319,978
221,688,550
193,170,789
22219
18,535
34,806
Bartow
89,049
2121,724
161,488,844
242,893,376
23244
16,719
32,492
TABLE 14
Three Econom
ic Indicators by County with Rankings and Per Capita Amounts
Per Capita Amounts of Three Indicators
COUN
TY2005
Population
Estim
ates
Master
Econom
ic
Rank
2006 County 1%
Tax
Distribution
2005 Adjusted Gross Incom
e ("AGI") Reported (GA Returns)
2006 Net Property and
Utility Digest

S E L E C T E D T A X D A T A
48
2007 Statistical Report
Thousand
Dollars
RANK
Thousand Dollars
RANK
Thousand
Dollars
RANK
1% ST
Distribution
Income
Reported
Net Digest
New
ton
86,529
2810,996
291,435,689
262,610,913
27127
16,592
30,174
Rockdale
78,398
2716,086
271,372,394
282,702,511
25205
17,505
34,472
Walton
75,670
2910,465
301,421,293
272,623,353
26138
18,783
34,668
Glynn
71,639
1621,397
171,567,128
224,723,818
12299
21,875
65,939
Walker
63,812
395,876
48810,602
371,344,386
4192
12,703
21,068
Troup
62,632
3210,258
32935,506
321,731,991
34164
14,937
27,653
Bulloch
62,011
3610,413
31776,353
391,391,652
40168
12,520
22,442
Spalding
61,262
359,497
36848,557
341,420,194
39155
13,851
23,182
Catoosa
60,736
349,564
34846,788
351,526,392
36157
13,942
25,132
Liberty
60,688
487,901
42501,071
52968,178
57130
8,257
15,953
Barrow
59,920
339,506
35973,934
311,748,998
33159
16,254
29,189
Jackson
52,357
319,830
33914,711
331,834,386
32188
17,471
35,036
Gordon
50,227
379,384
37752,456
401,449,968
37187
14,981
28,868
Laurens
46,939
418,686
40652,302
421,143,856
52185
13,897
24,369
Effingham
46,842
388,288
41802,702
381,330,039
44177
17,136
28,394
Camden
45,751
428,781
39530,945
491,232,053
47192
11,605
26,930
Baldwin
45,314
466,895
44545,354
461,032,203
55152
12,035
22,779
Thom
as44,643
437,706
43717,528
411,080,238
54173
16,073
24,197
Colquitt
43,886
555,821
50499,148
53711,562
69133
11,374
16,214
Murray
40,814
574,593
60480,072
55945,663
59113
11,762
23,170
Tift
40,731
479,099
38541,387
48938,182
60223
13,292
23,034
Polk
40,436
564,905
56497,482
54914,819
62121
12,303
22,624
Habersham
39,621
446,411
46580,824
451,204,728
50162
14,659
30,406
Coffee
39,588
535,990
47462,804
56773,793
65151
11,691
19,546
Ware
35,353
596,782
45420,377
58616,900
79192
11,891
17,450
Sumter
32,507
644,188
66388,849
60687,404
72129
11,962
21,146
Lee
31,137
613,502
75512,272
51762,157
67112
16,452
24,478
Oconee
29,760
405,519
52818,480
361,335,782
42185
27,503
44,885
Bryan
28,575
544,056
67530,924
501,085,536
53142
18,580
37,989
Wayne
28,536
754,219
63332,949
71569,301
83148
11,668
19,950
Pickens
28,440
494,469
61583,187
441,242,102
46157
20,506
43,674
Decatur
28,412
634,982
55329,500
72687,976
71175
11,597
24,214
Haralson
28,335
664,209
64377,372
63656,983
74149
13,318
23,186
Harris
27,697
602,657
88587,752
43955,243
5896
21,221
34,489
Upson
27,660
783,448
78334,365
70627,055
75125
12,088
22,670
Madison
27,442
832,088
97368,419
64620,014
7876
13,425
22,594
TABLE 14
Three Econom
ic Indicators by County with Rankings and Per Capita Amounts
Per Capita Amounts of Three Indicators
COUN
TY2005
Population
Estim
ates
Master
Econom
ic
Rank
2006 County 1%
Tax
Distribution
2005 Adjusted Gross Incom
e ("AGI") Reported (GA Returns)
2006 Net Property and
Utility Digest

S E L E C T E D T A X D A T A
49
2007 Statistical Report
Thousand
Dollars
RANK
Thousand Dollars
RANK
Thousand
Dollars
RANK
1% ST
Distribution
Income
Reported
Net Digest
Gilmer
27,349
525,065
54382,478
611,153,050
51185
13,985
42,161
Toom
bs27,169
744,707
58328,715
73527,939
86173
12,099
19,432
Jones
26,744
812,498
92459,666
57595,086
8193
17,188
22,251
Chattooga
26,499
862,619
89284,605
82544,083
8499
10,740
20,532
Stephens
25,044
763,651
73319,530
76694,731
70146
12,759
27,740
Lumpkin
24,529
653,478
77380,684
62934,356
61142
15,520
38,092
Grady
24,508
852,845
85277,427
84577,766
82116
11,320
23,575
Peach
24,481
803,710
72350,954
69526,711
87152
14,336
21,515
White
24,024
713,331
81355,856
67896,118
63139
14,813
37,301
Hart
23,953
723,216
84320,299
74976,531
56134
13,372
40,769
Monroe
23,734
454,197
65541,425
471,963,673
30177
22,812
82,737
Mitchell
23,710
902,695
87234,927
92492,124
90114
9,908
20,756
Tattnall
23,181
103
1,729
104
211,441
97313,796
111
759,121
13,537
Burke
23,154
683,328
82260,674
871,593,683
35144
11,258
68,830
Butts
22,837
704,812
57319,775
75625,373
77211
14,002
27,384
Meriwether
22,754
941,824
103
277,116
85486,588
9280
12,179
21,385
Emanuel
22,186
932,751
86234,501
93416,771
98124
10,570
18,785
Crisp
21,884
824,615
59259,110
89498,871
88211
11,840
22,796
Worth
21,849
961,642
107
269,111
86411,420
9975
12,317
18,830
Fannin
21,812
674,329
62299,387
77874,128
64198
13,726
40,076
McDuffie
21,680
843,577
74287,115
81498,404
89165
13,243
22,989
Franklin
21,560
773,897
68289,772
80664,809
73181
13,440
30,835
Elbert
20,741
922,259
93260,450
88488,456
91109
12,557
23,550
Union
20,079
623,769
70298,476
791,206,634
48188
14,865
60,094
Washington
19,998
793,871
69298,783
78625,927
76194
14,941
31,299
Daw
son
19,825
505,872
49412,560
591,205,781
49296
20,810
60,821
Putnam
19,703
515,201
53362,188
651,330,995
43264
18,382
67,553
Dodge
19,521
982,125
96215,005
96374,166
103
109
11,014
19,167
Appling
17,892
873,409
79208,310
98607,514
80191
11,643
33,955
Morgan
17,524
693,762
71361,964
66728,670
68215
20,655
41,581
Ben Hill
17,369
992,525
91207,748
99349,453
106
145
11,961
20,119
Pierce
17,120
102
1,946
102
230,745
94348,762
107
114
13,478
20,372
Jefferson
16,783
100
2,196
95195,620
103
400,212
101
131
11,656
23,846
Berrien
16,735
107
1,724
105
196,642
102
307,233
112
103
11,750
18,359
Lamar
16,605
101
1,597
108
220,963
95408,607
100
9613,307
24,607
Cook
16,311
104
2,083
98186,114
106
332,681
109
128
11,410
20,396
TABLE 14
Three Econom
ic Indicators by County with Rankings and Per Capita Amounts
Per Capita Amounts of Three Indicators
COUNTY
2005
Population
Estim
ates
Master
Econom
ic
Rank
2006 County 1%
Tax
Distribution
2005 Adjusted Gross Income
("AGI") Reported (GA Returns)
2006 Net Property and
Utility Digest

S E L E C T E D T A X D A T A
50
2007 Statistical Report
Thousand
Dollars
RANK
Thousand Dollars
RANK
Thousand
Dollars
RANK
1% ST
Distribution
Income
Reported
Net Digest
Cook
16,311
104
2,083
98186,114
106
332,681
109
128
11,410
20,396
Brooks
16,269
113
1,238
116
162,463
110
350,285
105
769,986
21,531
Rabun
16,265
733,394
80254,827
901,306,644
45209
15,667
80,335
Dade
16,129
952,575
90189,704
105
433,832
95160
11,762
26,898
Banks
16,101
883,303
83239,515
91535,961
85205
14,876
33,287
Pike
16,073
971,225
117
279,810
83452,770
9376
17,409
28,170
Greene
15,570
583,493
76353,911
681,439,832
38224
22,730
92,475
Brantley
15,474
115
1,371
112
178,497
107
286,776
115
8911,535
18,533
Screven
15,288
108
1,337
113
164,131
109
395,669
102
8710,736
25,881
Macon
13,725
118
1,301
114
106,254
129
304,399
113
957,742
22,178
Oglethorpe
13,601
114
832
131
192,327
104
424,732
9761
14,141
31,228
Telfair
13,341
121
1,207
118
109,392
126
267,104
117
908,200
20,021
Jas per
13,144
106
1,135
121
206,699
101
429,532
9686
15,726
32,679
Jeff Davis
13,082
112
2,009
100
162,327
111
258,068
119
154
12,408
19,727
Craw
ford
12,837
125
661
136
153,644
113
230,930
122
5111,969
17,989
Chattahoochee
12,406
154
461
146
27,934
156
54,153
159
372,252
4,365
Bleckley
12,210
119
1,089
122
159,849
112
215,815
126
8913,092
17,675
Early
12,068
111
2,019
99132,316
117
293,687
114
167
10,964
24,336
Dooly
11,703
116
1,528
109
122,596
120
239,697
121
131
10,476
20,482
Evans
11,354
117
1,389
111
136,802
115
220,000
125
122
12,049
19,376
Heard
11,336
915,718
51132,736
116
373,768
104
504
11,709
32,972
Long
11,122
144
450
148
82,741
136
134,898
144
407,439
12,129
McIntosh
11,000
105
1,675
106
143,323
114
434,170
94152
13,029
39,470
Charlton
10,714
124
1,142
120
99,522
130
240,937
120
107
9,289
22,488
Terrell
10,684
126
933
126
126,912
118
202,880
129
8711,879
18,989
Wilkes
10,480
110
1,190
119
207,119
100
329,186
110
114
19,763
31,411
Bacon
10,418
123
1,282
115
116,564
123
198,878
131
123
11,189
19,090
Candler
10,352
120
1,436
110
117,113
122
203,365
128
139
11,313
19,645
Towns
10,281
892,252
94164,585
108
770,958
66219
16,009
74,989
Twiggs
10,273
129
877
129
115,883
125
200,461
130
8511,280
19,513
Irwin
10,227
133
659
137
116,309
124
190,786
133
6411,373
18,655
Wilkinson
10,094
109
2,003
101
126,498
119
337,153
108
198
12,532
33,401
Pulaski
9,757
122
1,025
124
118,438
121
226,255
123
105
12,139
23,189
Hancock
9,713
130
508
143
90,192
134
282,679
116
529,286
29,103
Johnson
9,522
140
627
139
82,324
137
138,649
142
668,646
14,561
Turner
9,436
132
937
125
97,973
132
171,870
136
9910,383
18,214
Seminole
9,191
128
1,078
123
106,698
128
215,648
127
117
11,609
23,463
TABLE 14
Three Econom
ic Indicators by County with Rankings and Per Capita Amounts
Per Capita Amounts of Three Indicators
COUN
TY2005
Population
Estim
ates
Master
Econom
ic
Rank
2006 County 1%
Tax
Distribution
2005 Adjusted Gross Incom
e ("AGI") Reported (GA Returns)
2006 Net Property and
Utility Digest

S E L E C T E D T A X D A T A
51
2007 Statistical Report
Thousand
Dollars
RANK
Thousand Dollars
RANK
Thousand
Dollars
RANK
1% ST
Distribution
Income
Reported
Net Digest
Montgom
ery
8,938
135
672
134
90,432
133
153,889
138
7510,118
17,217
Taylor
8,826
131
919
127
98,855
131
179,357
135
104
11,200
20,321
Jenkins
8,715
136
756
133
83,891
135
152,286
139
879,626
17,474
Wilcox
8,629
145
467
145
72,357
142
138,403
143
548,385
16,039
Lincoln
8,283
127
870
130
108,221
127
263,111
118
105
13,065
31,765
Atkinson
7,965
141
667
135
72,785
140
123,014
147
849,138
15,444
Lanier
7,521
146
582
141
72,682
141
104,283
151
779,664
13,866
Randolph
7,282
137
900
128
69,476
146
183,052
134
124
9,541
25,138
Marion
7,222
139
486
144
76,883
139
193,253
132
6710,646
26,759
Clinch
6,992
138
763
132
72,245
143
152,046
140
109
10,333
21,746
Treutlen
6,734
147
451
147
61,959
147
118,730
148
679,201
17,631
Wheeler
6,703
148
421
150
47,302
150
125,595
146
637,057
18,737
Talbot
6,639
134
609
140
81,455
138
224,881
124
9212,269
33,873
Miller
6,161
143
637
138
69,572
145
148,961
141
103
11,292
24,178
Warren
6,067
142
560
142
69,999
144
163,862
137
9211,538
27,009
Calhoun
6,025
150
449
149
56,067
148
98,688
152
759,306
16,380
Stew
art
4,878
149
398
151
41,753
151
132,684
145
828,559
27,200
Echols
4,207
155
157
158
31,088
154
107,770
150
377,390
25,617
Baker
4,137
151
258
155
37,140
152
118,707
149
628,978
28,694
Schle y
4,101
152
348
153
55,581
149
79,940
154
8513,553
19,493
Cla y
3,232
153
356
152
28,865
155
89,439
153
110
8,931
27,673
Glascoc k
2,670
156
219
156
31,646
153
62,969
157
8211,852
23,584
Quitm
an2,461
157
264
154
20,898
158
73,437
155
107
8,492
29,840
Webster
2,254
158
163
157
26,635
157
55,324
158
7211,817
24,545
Taliaferro
1,835
159
121
159
16,188
159
69,521
156
668,822
37,886
Other
6,189,509
TOTAL
9,132,553
1,687,969
172,975,105
318,453,967
185
18,940
34,870
NOT
E: Counties are listed in descending order per 2005 census estimates.
TABLE 14
Three Econom
ic Indicators by County with Rankings and Per Capita Amounts
Per Capita Amounts of Three Indicators
COUN
TY2005
Population
Estim
ates
Master
Econom
ic
Rank
2006 County 1%
Tax
Distribution
2005 Adjusted Gross Incom
e ("AGI") Reported (GA Returns)
2006 Net Property and
Utility Digest

S E L E C T E D T A X D A T A
52
2007 Statistical Report
Type of Corporation and Taxable Income Class
Number of Returns
Percent of Returns
Net Taxable Income in 000's
Percent of Net Taxable Income
DOMESTIC CORPORATIONS$1 ‐ $5,000 5,406 3.20% $9,385 0.29%$5,000 ‐ $10,000 1,914 1.13% $14,044 0.44%$10,000 ‐ $25,000 2,875 1.70% $47,639 1.49%$25,000 ‐ $50,000 2,384 1.41% $86,079 2.69%$50,000 ‐ $100,000 1,781 1.05% $124,731 3.90%$100,000 ‐ $250,000 1,214 0.72% $185,267 5.80%$250,000 ‐ $500,000 447 0.26% $156,708 4.90%$500,000 ‐ $1,000,000 278 0.16% $195,599 6.12%Over $1,000,000 413 0.24% $2,376,560 74.36%NONE (No Taxable Income) 152,216 90.11%Total 168,928 100.00% $3,196,012 100.00%FOREIGN CORPORATIONS$1 ‐ $5,000 2,613 7.04% $4,069 0.08%$5,000 ‐ $10,000 809 2.18% $5,938 0.12%$10,000 ‐ $25,000 1,252 3.37% $20,567 0.41%$25,000 ‐ $50,000 1,002 2.70% $36,226 0.71%$50,000 ‐ $100,000 901 2.43% $65,203 1.28%$100,000 ‐ $250,000 1,181 3.18% $193,453 3.81%$250,000 ‐ $500,000 702 1.89% $250,110 4.93%$500,000 ‐ $1,000,000 498 1.34% $353,347 6.96%Over $1,000,000 853 2.30% $4,146,494 81.70%$0 or Less 27,286 73.55%Total 37,097 100.00% $5,075,407 100.00%ALL CORPORATIONS$1 ‐ $5,000 8,019 3.89% $13,453 0.16%$5,000 ‐ $10,000 2,723 1.32% $19,981 0.24%$10,000 ‐ $25,000 4,127 2.00% $68,206 0.82%$25,000 ‐ $50,000 3,386 1.64% $122,305 1.48%$50,000 ‐ $100,000 2,682 1.30% $189,934 2.30%$100,000 ‐ $250,000 2,395 1.16% $378,720 4.58%$250,000 ‐ $500,000 1,149 0.56% $406,819 4.92%$500,000 ‐ $1,000,000 776 0.38% $548,946 6.64%Over $1,000,000 1,266 0.61% $6,523,054 78.86%$0 or Less 179,502 87.13%Total 206,025 100.00% $8,271,419 100.00%(Note: Figures reflect 97.3% of returns processed as of the date of this report.)
TABLE 15Corporation Income Tax Returns by Taxable Income Class
Calendar Year 2005 Returns

S E L E C T E D T A X D A T A
53
2007 Statistical Report
County Name CY 2005 Rate
CY 2006 Rate
CY 2007 Rate
County Name CY 2005 Rate
CY 2006 Rate
CY 2007 Rate
Appling 26.7000 28.5100 28.4200 Dade 18.7900 17.2300 19.2300Atkinson 27.7990 27.9090 30.0020 Dawson 22.4340 22.4340 22.4340Bacon 27.2500 26.6390 27.7500 Decatur 21.8400 21.6500 21.6500Baker 26.3700 26.2600 24.6100 DeKalb 38.7100 39.3000 39.3000Baldwin 24.6200 23.6200 25.1200 Dodge 20.5000 19.0500 19.9500Banks 23.9390 20.3530 20.2980 Dooly 31.6620 31.6620 31.6620Barrow 26.6660 28.3590 28.0860 Dougherty 40.1830 43.1580 37.8720Bartow 27.9400 27.3900 26.6800 Douglas 26.8990 28.7900 27.8110Ben Hill 28.5300 29.4200 29.4200 Early 29.0200 31.7500 22.8000Berrien 26.2500 32.2500 32.2500 Echols 32.0580 32.4700 30.4200Bibb 32.7867 32.7867 35.2867 Effingham 30.5520 30.7540 29.9110Bleckley 24.0400 24.0400 26.5500 Elbert 26.0050 24.6030 25.2300Brantley 37.0500 29.8480 31.8681 Emanuel 22.9130 23.8420 23.5750Brooks 27.9700 29.0400 30.7700 Evans 18.6500 18.6400 19.6500Bryan 23.4920 20.3370 20.7330 Fannin 20.1690 20.1690 17.3600Bulloch 19.1700 19.1700 20.6400 Fayette 30.8800 30.1940 30.3780Burke 21.7020 21.5770 22.4910 Floyd 29.7610 29.6790 29.3590Butts 32.1160 33.2320 33.2320 Forsyth 22.8830 22.6310 22.5280Calhoun 35.4900 35.0100 25.3450 Franklin 19.5350 18.9900 21.2160Camden 27.1280 27.0000 27.0000 Fulton 34.7330 35.5580 34.2810Candler 28.6300 27.1590 24.2390 Gilmer 24.9130 21.6630 21.1630Carroll 24.8500 24.8500 26.8500 Glascock 33.8200 33.8200 27.5300Catoosa 18.9610 21.3770 22.2060 Glynn 23.3120 22.5110 21.4980Charlton 41.5360 41.6020 32.4500 Gordon 24.4000 27.2200 26.7260Chatham 32.8590 31.1990 28.8770 Grady 23.8020 21.8020 22.5500Chattahoochee 20.7200 22.3600 26.5610 Greene 18.0770 13.5400 13.9810Chattooga 19.5020 18.6570 19.0470 Gwinnett 32.2700 32.1000 31.8800Cherokee 26.8390 26.4970 26.2500 Habersham 23.3730 27.1730 22.8470Clarke 33.0500 33.0500 33.0500 Hall 24.6600 25.5500 23.7700Clay 30.0760 30.0760 30.0760 Hancock 39.6300 39.3400 40.1800Clayton 26.9470 29.0140 28.6210 Haralson 25.0490 25.0290 24.9390Clinch 37.0600 41.2300 30.8780 Harris 24.7100 24.7100 24.2780Cobb 29.8700 29.7500 28.7500 Hart 17.8330 17.3160 18.2500Coffee 22.5600 22.5740 23.4640 Heard 22.5730 23.5730 22.5590Colquitt 26.6890 26.7120 26.4030 Henry 36.9500 37.5090 37.5100Columbia 26.8100 26.8100 26.9770 Houston 24.8500 23.2600 23.3500Cook 23.4650 23.9650 23.9650 Irwin 30.7800 30.7800 29.3900Coweta 26.4900 27.4900 28.4900 Jackson 31.5400 31.2300 32.5500Crawford 31.2500 31.2500 25.8330 Jasper 27.2200 28.6000 28.7100Crisp 30.3600 29.6090 28.7890 Jeff Davis 23.9300 24.9760 24.9700
Jefferson 27.4900 26.1200 26.2500Camden 27.1280 27.0000 27.0000
Table 16Calendar Year Millage Rates by CountyAlphabetically
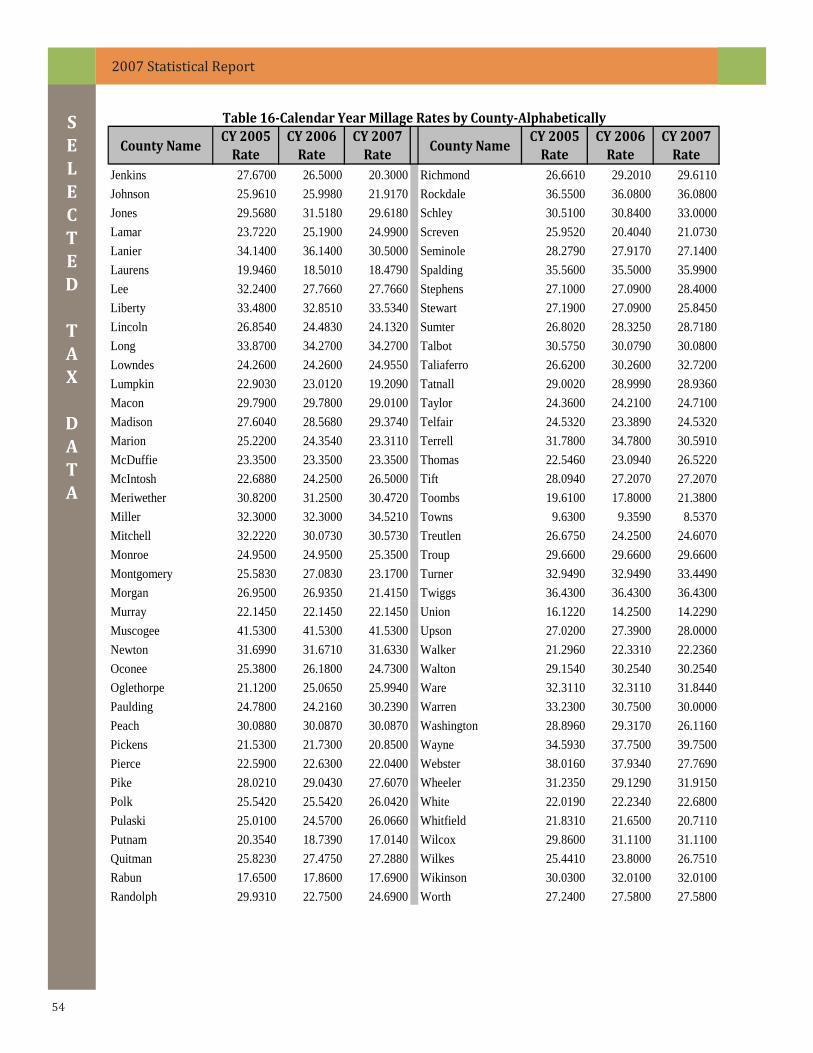
S E L E C T E D T A X D A T A
54
2007 Statistical Report
County NameCY 2005 Rate
CY 2006 Rate
CY 2007 Rate
County NameCY 2005 Rate
CY 2006 Rate
CY 2007 Rate
Jenkins 27.6700 26.5000 20.3000 Richmond 26.6610 29.2010 29.6110Johnson 25.9610 25.9980 21.9170 Rockdale 36.5500 36.0800 36.0800Jones 29.5680 31.5180 29.6180 Schley 30.5100 30.8400 33.0000Lamar 23.7220 25.1900 24.9900 Screven 25.9520 20.4040 21.0730Lanier 34.1400 36.1400 30.5000 Seminole 28.2790 27.9170 27.1400Laurens 19.9460 18.5010 18.4790 Spalding 35.5600 35.5000 35.9900Lee 32.2400 27.7660 27.7660 Stephens 27.1000 27.0900 28.4000Liberty 33.4800 32.8510 33.5340 Stewart 27.1900 27.0900 25.8450Lincoln 26.8540 24.4830 24.1320 Sumter 26.8020 28.3250 28.7180Long 33.8700 34.2700 34.2700 Talbot 30.5750 30.0790 30.0800Lowndes 24.2600 24.2600 24.9550 Taliaferro 26.6200 30.2600 32.7200Lumpkin 22.9030 23.0120 19.2090 Tatnall 29.0020 28.9990 28.9360Macon 29.7900 29.7800 29.0100 Taylor 24.3600 24.2100 24.7100Madison 27.6040 28.5680 29.3740 Telfair 24.5320 23.3890 24.5320Marion 25.2200 24.3540 23.3110 Terrell 31.7800 34.7800 30.5910McDuffie 23.3500 23.3500 23.3500 Thomas 22.5460 23.0940 26.5220McIntosh 22.6880 24.2500 26.5000 Tift 28.0940 27.2070 27.2070Meriwether 30.8200 31.2500 30.4720 Toombs 19.6100 17.8000 21.3800Miller 32.3000 32.3000 34.5210 Towns 9.6300 9.3590 8.5370Mitchell 32.2220 30.0730 30.5730 Treutlen 26.6750 24.2500 24.6070Monroe 24.9500 24.9500 25.3500 Troup 29.6600 29.6600 29.6600Montgomery 25.5830 27.0830 23.1700 Turner 32.9490 32.9490 33.4490Morgan 26.9500 26.9350 21.4150 Twiggs 36.4300 36.4300 36.4300Murray 22.1450 22.1450 22.1450 Union 16.1220 14.2500 14.2290Muscogee 41.5300 41.5300 41.5300 Upson 27.0200 27.3900 28.0000Newton 31.6990 31.6710 31.6330 Walker 21.2960 22.3310 22.2360Oconee 25.3800 26.1800 24.7300 Walton 29.1540 30.2540 30.2540Oglethorpe 21.1200 25.0650 25.9940 Ware 32.3110 32.3110 31.8440Paulding 24.7800 24.2160 30.2390 Warren 33.2300 30.7500 30.0000Peach 30.0880 30.0870 30.0870 Washington 28.8960 29.3170 26.1160Pickens 21.5300 21.7300 20.8500 Wayne 34.5930 37.7500 39.7500Pierce 22.5900 22.6300 22.0400 Webster 38.0160 37.9340 27.7690Pike 28.0210 29.0430 27.6070 Wheeler 31.2350 29.1290 31.9150Polk 25.5420 25.5420 26.0420 White 22.0190 22.2340 22.6800Pulaski 25.0100 24.5700 26.0660 Whitfield 21.8310 21.6500 20.7110Putnam 20.3540 18.7390 17.0140 Wilcox 29.8600 31.1100 31.1100Quitman 25.8230 27.4750 27.2880 Wilkes 25.4410 23.8000 26.7510Rabun 17.6500 17.8600 17.6900 Wikinson 30.0300 32.0100 32.0100Randolph 29.9310 22.7500 24.6900 Worth 27.2400 27.5800 27.5800
Table 16Calendar Year Millage Rates by CountyAlphabetically

S E L E C T E D T A X D A T A
55
2007 Statistical Report
County NameCY 2005 Rate
CY 2006 Rate
CY 2007 Rate
County NameCY 2005 Rate
CY 2006 Rate
CY 2007 Rate
Towns 9.6300 9.3590 8.5370 Houston 24.8500 23.2600 23.3500Greene 18.0770 13.5400 13.9810 McDuffie 23.3500 23.3500 23.3500Union 16.1220 14.2500 14.2290 Coffee 22.5600 22.5740 23.4640Putnam 20.3540 18.7390 17.0140 Emanuel 22.9130 23.8420 23.5750Fannin 20.1690 20.1690 17.3600 Hall 24.6600 25.5500 23.7700Rabun 17.6500 17.8600 17.6900 Cook 23.4650 23.9650 23.9650Hart 17.8330 17.3160 18.2500 Lincoln 26.8540 24.4830 24.1320Laurens 19.9460 18.5010 18.4790 Candler 28.6300 27.1590 24.2390Chattooga 19.5020 18.6570 19.0470 Harris 24.7100 24.7100 24.2780Lumpkin 22.9030 23.0120 19.2090 Telfair 24.5320 23.3890 24.5320Dade 18.7900 17.2300 19.2300 Treutlen 26.6750 24.2500 24.6070Evans 18.6500 18.6400 19.6500 Baker 26.3700 26.2600 24.6100Dodge 20.5000 19.0500 19.9500 Randolph 29.9310 22.7500 24.6900Banks 23.9390 20.3530 20.2980 Taylor 24.3600 24.2100 24.7100Jenkins 27.6700 26.5000 20.3000 Oconee 25.3800 26.1800 24.7300Bulloch 19.1700 19.1700 20.6400 Haralson 25.0490 25.0290 24.9390Whitfield 21.8310 21.6500 20.7110 Lowndes 24.2600 24.2600 24.9550Bryan 23.4920 20.3370 20.7330 Jeff Davis 23.9300 24.9760 24.9700Pickens 21.5300 21.7300 20.8500 Lamar 23.7220 25.1900 24.9900Screven 25.9520 20.4040 21.0730 Baldwin 24.6200 23.6200 25.1200Gilmer 24.9130 21.6630 21.1630 Elbert 26.0050 24.6030 25.2300Franklin 19.5350 18.9900 21.2160 Calhoun 35.4900 35.0100 25.3450Toombs 19.6100 17.8000 21.3800 Monroe 24.9500 24.9500 25.3500Morgan 26.9500 26.9350 21.4150 Crawford 31.2500 31.2500 25.8330Glynn 23.3120 22.5110 21.4980 Stewart 27.1900 27.0900 25.8450Decatur 21.8400 21.6500 21.6500 Oglethorpe 21.1200 25.0650 25.9940Johnson 25.9610 25.9980 21.9170 Polk 25.5420 25.5420 26.0420Pierce 22.5900 22.6300 22.0400 Pulaski 25.0100 24.5700 26.0660Murray 22.1450 22.1450 22.1450 Washington 28.8960 29.3170 26.1160Catoosa 18.9610 21.3770 22.2060 Cherokee 26.8390 26.4970 26.2500Walker 21.2960 22.3310 22.2360 Jefferson 27.4900 26.1200 26.2500Dawson 22.4340 22.4340 22.4340 Colquitt 26.6890 26.7120 26.4030Burke 21.7020 21.5770 22.4910 McIntosh 22.6880 24.2500 26.5000Forsyth 22.8830 22.6310 22.5280 Thomas 22.5460 23.0940 26.5220Grady 23.8020 21.8020 22.5500 Bleckley 24.0400 24.0400 26.5500Heard 22.5730 23.5730 22.5590 Chattahoochee 20.7200 22.3600 26.5610White 22.0190 22.2340 22.6800 Bartow 27.9400 27.3900 26.6800Early 29.0200 31.7500 22.8000 Gordon 24.4000 27.2200 26.7260Habersham 23.3730 27.1730 22.8470 Wilkes 25.4410 23.8000 26.7510Montgomery 25.5830 27.0830 23.1700 Carroll 24.8500 24.8500 26.8500Marion 25.2200 24.3540 23.3110 Columbia 26.8100 26.8100 26.9770
Camden 27.1280 27.0000 27.0000
Table 17Calendar Year Millage Rates by CountyNumerical

S E L E C T E D T A X D A T A
56
2007 Statistical Report
County NameCY 2005 Rate
CY 2006 Rate
CY 2007 Rate County Name
CY 2005 Rate
CY 2006 Rate
CY 2007 Rate
Seminole 28.2790 27.9170 27.1400 Walton 29.1540 30.2540 30.2540Tift 28.0940 27.2070 27.2070 Fayette 30.8800 30.1940 30.3780Qutiman 25.8230 27.4750 27.2880 Echols 32.0580 32.4700 30.4200Glascock 33.8200 33.8200 27.5300 Meriwether 30.8200 31.2500 30.4720Worth 27.2400 27.5800 27.5800 Lanier 34.1400 36.1400 30.5000Pike 28.0210 29.0430 27.6070 Mitchell 32.2220 30.0730 30.5730Bacon 27.2500 26.6390 27.7500 Terrell 31.7800 34.7800 30.5910Lee 32.2400 27.7660 27.7660 Brooks 27.9700 29.0400 30.7700Webster 38.0160 37.9340 27.7690 Clinch 37.0600 41.2300 30.8780Douglas 26.8990 28.7900 27.8110 Wilcox 29.8600 31.1100 31.1100Upson 27.0200 27.3900 28.0000 Newton 31.6990 31.6710 31.6330Barrow 26.6660 28.3590 28.0860 Dooly 31.6620 31.6620 31.6620Stephens 27.1000 27.0900 28.4000 Ware 32.3110 32.3110 31.8440Appling 26.7000 28.5100 28.4200 Brantley 37.0500 29.8480 31.8681Coweta 26.4900 27.4900 28.4900 Gwinnett 32.2700 32.1000 31.8800Clayton 26.9470 29.0140 28.6210 Wheeler 31.2350 29.1290 31.9150Jasper 27.2200 28.6000 28.7100 Wikinson 30.0300 32.0100 32.0100Sumter 26.8020 28.3250 28.7180 Berrien 26.2500 32.2500 32.2500Cobb 29.8700 29.7500 28.7500 Charlton 41.5360 41.6020 32.4500Crisp 30.3600 29.6090 28.7890 Jackson 31.5400 31.2300 32.5500Chatham 32.8590 31.1990 28.8770 Taliaferro 26.6200 30.2600 32.7200Tatnall 29.0020 28.9990 28.9360 Schley 30.5100 30.8400 33.0000Macon 29.7900 29.7800 29.0100 Clarke 33.0500 33.0500 33.0500Floyd 29.7610 29.6790 29.3590 Butts 32.1160 33.2320 33.2320Madison 27.6040 28.5680 29.3740 Turner 32.9490 32.9490 33.4490Irwin 30.7800 30.7800 29.3900 Liberty 33.4800 32.8510 33.5340Ben Hill 28.5300 29.4200 29.4200 Long 33.8700 34.2700 34.2700Richmond 26.6610 29.2010 29.6110 Fulton 34.7330 35.5580 34.2810Jones 29.5680 31.5180 29.6180 Miller 32.3000 32.3000 34.5210Troup 29.6600 29.6600 29.6600 Bibb 32.7867 32.7867 35.2867Effingham 30.5520 30.7540 29.9110 Spalding 35.5600 35.5000 35.9900Warren 33.2300 30.7500 30.0000 Rockdale 36.5500 36.0800 36.0800Atkinson 27.7990 27.9090 30.0020 Twiggs 36.4300 36.4300 36.4300Clay 30.0760 30.0760 30.0760 Henry 36.9500 37.5090 37.5100Talbot 30.5750 30.0790 30.0800 Dougherty 40.1830 43.1580 37.8720Peach 30.0880 30.0870 30.0870 Dekalb 38.7100 39.3000 39.3000Paulding 24.7800 24.2160 30.2390 Wayne 34.5930 37.7500 39.7500
Hancock 39.6300 39.3400 40.1800Muscogee 41.5300 41.5300 41.5300
Table 17Calendar Year Millage Rates by CountyNumerical

S E L E C T E D T A X D A T A
57
2007 Statistical Report
2006 2007
Tags & RegistrationGRATIS $196,131,501.55 $190,592,800.89Tradeport $927,878.00 $978,934.25Refunds ($182,594.00) ($168,689.61) Tag & Reg. Sub‐Total $196,876,785.55 $191,403,045.53TitlesGRATIS $42,232,647.00 $42,720,035.00Tradeport $10,298,124.00 $9,884,023.35Penalties $754,250.00 $123,450.00 Titles Sub‐Total $53,286,021.00 $52,727,508.35Total Amount of *Net Revenue $250,162,806.55 $244,130,553.88
TABLE 18Summary of Revenues from Motor Vehicle Tag, Title & Related Items for
Fiscal Years 2006 and 2007
* Net revenue amounts take into account refunds, commissions retained by county tag agents, and other accounting adjustments.
Fiscal Year Ended June 30SOURCE OF REVENUE
2006 2007
Titles Issued 2,910,967 2,851,018Tags Issued 8,201,511 8,467,856
Tags By Major Category 5,173,865 5,331,590Passenger Cars 157,781 174,158Motorcycles 1,916,680 1,950,494Trucks 921,636 977,599Trailers 31,318 35,416Bus 231 208Other 8,201,511 8,469,465
Total
TABLE 19Number of Motor Vehicle Tags Sold by Major Category
and Number of Titles Sold in Calendar Years 2006 and 2007
SOURCE OF REVENUE Fiscal Year Ended June 30

59
2007 Statistical Report
Administration 2, 5, 16Alcohol, Tobacco & Wine Taxes i, ii, 2, 5, 6, 7, 10, 11, 15, 16, 22, 23Alcohol Beverages ii, vi, 1, 10, 15, 16, 22, 35Tobacco v, 22, 23Amusement 5, 6, 16, 23, 35Dyed Fuel 7, 15
Bankruptcy 7Compliance vi, 2, 3, 5, 7, 9, 13, 16, 17Corporate Income Tax i, vii, 5, 6, 7, 11, 12, 13, 22, 23, 24, 52County Tax Data i, iii, v, vii, 39, 43, 44, 45, 46, 47, 53, 54, 55, 56Customer Service 16Directory v, 2, 3Estate Taxes 1, 23Georgia Personal Income 34Georgia Population v, 8IFTA 5, 6, 14, 23Information Technology Division 3, 5Individual Income Tax i, ii, 5, 6, 7, 10, 11, 12, 13, 22, 23, 24Electronic Filing Results vi, vii, 5, 7, 11, 36
Litigation & Investigation 16Local Government Services iii, 3, 5Public Utilities iii, vii, 5, 37, 38, 43Flight Equipment for Airlines iiiRailroad Equipment Car iii
Motor Fuel Tax ii, vii, 1, 5, 22, 23, 24, 33, 35, 38Motor Vehicle Tags & Titles ii, iii, vii, 3, 5, 6, 8, 14, 16, 17, 21, 22, 23, 33Organization Structure vi, 3, 4, 5Per Capita Personal Income vii, 26, 27, 28, 29, 39, 40, 41, 42Personal Income Growth Trend vii, 26, 27, 32, 33, 34Prepaid Sales Tax ii, 22, 23Processing Center 3, 5, 7, 16Property Taxes iii, iv, v, vii, 5, 6, 16, 23, 37, 38, 39, 43‐46, 47‐51Homestead Taxpayer Relief Grant Distribution iv, vii, 5, 7, 16, 38Unclaimed Property iv, 5, 7, 16, 23Refund Summary vi, 13
Results & Performance Measures by Program vi, 16, 17Revenue Highlights 6, 7Revenue Processing 10, 16Sales & Use Tax iv, v, vi, vii, 5, 6, 7, 11, 13, 16, 22, 23, 24, 25, 28, 30, 31, 36Seminars v, 18, 19, 20Sources of Revenue Tax Dollars vi,1State Treasury iii, 10, 13Tax Law Policy 5, 16Taxpayer Services Division 3, 5Withholding 10, 11
INDEX