gheorghe rusu* and elena rusu - scielo · 2015-10-26 · gheorghe rusu* and elena rusu “petru...
TRANSCRIPT
Article J. Braz. Chem. Soc., Vol. 26, No. 2, 338-349, 2015.Printed in Brazil - ©2015 Sociedade Brasileira de Química0103 - 5053 $6.00+0.00Ahttp://dx.doi.org/10.5935/0103-5053.20140285
*e-mail: [email protected]
Anionic Aliphatic Polyesteramide Copolymers: Evaluation of Dielectric Properties
Gheorghe Rusu* and Elena Rusu
“Petru Poni” Institute of Macromolecular Chemistry, Aleea Grigore Ghica Voda 41A, 700487 Iasi, Romania
This study looks at the effects on the dielectric behavior as result of the incorporation of ester sequences along the nylon 6 chains. The aliphatic polyesteramide copolymers and nylon 6 homopolymer were synthesized via anionic ring-opening copolymerization using the rotational molding technique by varying the ratio of the ε-caprolactam (CLA) and ε-caprolactone (CLO) comonomers. The ester units are correlated with biodegradable potential of polymers and the polar amide groups are able both to confer the polymer semicrystalline character and to be sensitive to the electric stimulus. The dielectric properties of the anionic nylon 6 and polyesteramides have been carried out as a function of frequency (100 Hz-106 Hz), at ambient temperature. Regarding to dielectric permittivity, ε*(f), it was observed that the samples exhibit same behavior at increasing of the frequency. Experimental data revealed that the real part of electric modulus, M’(f) of the copolymers are many lower than those corresponding of the homopolymer. The presence of a single arc in the complex impedance plane plots confirms that, within the studied frequency range, the samples have a highly capacitive behavior. The results related to dielectric, crystalline and thermal properties of copolymers were compared with those obtained for homopolymer.
Keywords: anionic ring-opening copolymerization, reactive rotational molding, nylon 6, polyesteramide copolymers, dielectric properties
Introduction
The synthetic polymers and materials based on them constitute a significant proportion of the engineered materials market ranging from everyday products to sophisticated niche applications. Some of these polymers, namely polyamides (PAs), polyethylene (PE), polypropylene (PP), polystyrene (PS), etc., designated as plastics, with a great demand in a large area of engineering applications are made from petroleum-based feedstocks. In counter part, there is an increase in public awareness regarding the depletion of petroleum-based raw materials and these polymers type have been introduced easily into the environment due to their widespread use and the great variety of sources. In addition, they persist in the environment for many years generating serious environmental pollution due to their nature, high molecular weight and hydrophobic character. In this regard, the designing, developing and promoting of the eco-friendly green polymers has been emerged as a necessity to contribute to reduction of the pollution originated from nonbiodegradable plastic wastes. Polymeric material properties can be varied continuously over a broad
range of values under the control of the researcher and in this sense various methods, such as copolymerization, functionalization, blending, incorporation of fillers, etc. have been taking into consideration. Careful selection of materials types (comonomers, reactive compounds, polymers, filler, etc.) enables finished product characteristics to be tailored to almost any specific engineering requirement. The development of linear aliphatic polyesters has been seem to be attractive, being characterized by their biodegrability potential promoted by the hydrolysable ester sequences (−O–CO–) included into their structure.1-3 Although the aliphatic polyesters are important materials and can be used as substitutes for some conventional plastics in everyday life, they have a limited use, especially in the biomedical field imposed by some of their properties (e.g., low melting temperature, Tg, flexural properties, etc.), that do not allow their use as engineering plastics.4 All these determined to enhance the research focused on the development of new biodegradable materials. Various solutions have been proposed to optimize their properties without losing any biodegradability. On the other hand, the polyamides, in its fully aliphatic form, called nylons, with a similar structure with most aliphatic polyesters are among the first commercial synthetic polymers, which have entered into modern
Rusu and Rusu 339Vol. 26, No. 2, 2015
life. They are known as high-performance engineering plastics and their applications are constantly expanding. Their structure characterized by strong hydrogen bonding between the chains and high regularity in the crystalline phase provides excellent thermal and mechanical properties and resistance to nonpolar solvent, but also confers a highly resistance to biodegradation in the nature. During the last years, researchers concentrated efforts to perform the transition from nonbiodegradable to biodegradable polymeric materials. The design and synthesis of polymers were oriented toward materials that exhibit a combination of the two polymers type properties. In order to attain this aim, namely the increase of sensitivity to hydrolysis and implicitly the biodegradability, ester units (−O–CO–) were incorporated in the polyamide backbone. Thus, relative high thermal and mechanical properties of aliphatic polyamides, due to intermolecular hydrogen bonding of amide link (‑NH–CO–), and degradability specific to linear aliphatic polyesters, due to the presence of hydrolysable ester link (−O–CO–) within the backbone become characteristics of new polymers.3,5
Aliphatic polyesteramides (PEAs) appear as an interesting new type of materials that were found to be readily biodegraded; their degradation rate increases with the content in ester units.6 In addition, the increase of the ester units content in the copolymers structure makes possible the obtaining of wide range of materials with tailored properties varying from semicrystalline thermoplastic polymers to elastomers.7,8 PEAs have reported as biodegradable convenience materials for waste bags, agricultural films or plant pots9 as well as functional biomedical materials for, e.g., drug delivery systems4,10,11 or tissue engineering scaffolds.10,12 Besides, the level and distribution, type of comonomer units in the polymer chains affect the properties of polyesteramide copolymers. Generally, the aliphatic polyesteramide copolymers can be obtained using ring-opening polymerization by hydrolytic and anionic reaction mechanism, interfacial polymerization, polycondensation, and ester-amide exchange reactions in the melting of preformed polyamide and polyester blends.3,5,7,13 Literature survey shows that different lactams and lactone, as comonomers or initiator/activator systems seem to be suitable for the ring-opening copolymerization process, an attractive pathway to obtain aliphatic polyesteramide copolymers.13-23 It is expected that by incorporating ester groups (−O–CO–), not only the change in the structure of polyamides to occur, but among other properties of resulted polyesteramide copolymers, the dielectric ones can be affected being known the fact that the polar amide groups existent along the chains of polymers are sensitive to the electric stimulus. Taking into account
all these, it is of interest for both academic and industrial research to contribute to evaluate the effects of initial ε-caprolactone (CLO) content on the dielectric properties of polyesteramide copolymers.
To our best knowledge, no study has yet been reported on the dielectric properties of anionic polyesteramide copolymers based on ε-caprolactam and ε-caprolactone. The polyesteramide copolymers differentiated by CLO concentrations, ranging from 0.0 to 25.0 wt.% and nylon 6 homopolymer, taken into consideration in the present study were prepared in the same manner as method established in the previously reports.3,24 The anionic ring-opening copolymerization of ε-caprolactam (CLA) and CLA/CLO system by rotational molding technique was used for synthesis of nylon 6 homopolymer and polyesteramide copolymers, respectively. The synthesis-molding process were promoted in this case by ε-caprolactam magnesium bromide as initiator and N,N-isophthaloyl-bis-ε-caprolactam as activator. It is worthwhile to note that obtaining all samples does not imply the use of solvents and expensive activated intermediates.
This work aims to explore the effect of the CLO concentration on the dielectric properties of anionic polyesteramide copolymers by analyzing the experimental values of complex dielectric permittivity ε*(f), complex electric modulus M*(f), and complex impedance Z*(f) in the frequency range 100 Hz to 106 Hz, at room temperature. In addition, the properties of the samples have ascertained through the combined use of attenuated total reflectance Fourier transform infrared (ATR-FTIR) spectroscopy, wide-angle X-ray diffraction (WAXD) and differential scanning calorimetry (DSC) measurements. A comparison of the results of measurements on all the polyesteramide copolymers and nylon 6 homopolymer was performed.
Experimental
Materials
The monomers: ε-caprolactam (technical grade, Sigma-Aldrich Chem. Gmbh) and ε-caprolactone (Aldrich 99%) were used after purification in similar fashions to those described in the literatures.3,24,25 ε-Caprolactam magnesium bromide (1.6 mol kg‑1 concentration in ε-caprolactam) as initiator, was obtained in our laboratories according to the procedure described in the literature.26 The activator, N,N’-isophthaloyl-bis-ε-caprolactam was synthesized in our laboratories according to the procedure described in the literature.25 Formic acid (98%) supplied by Merck-Germany and other chemicals were of reagent grade and used as received.
Anionic Aliphatic Polyesteramide Copolymers: Evaluation of Dielectric Properties J. Braz. Chem. Soc.340
Synthesis of anionic nylon 6 and polyesteramide copolymers
The polyesteramide copolymers and nylon 6 homopolymer were prepared in bulk by reactive rotational molding process via anionic ring-opening copolymerization of ε-caprolactam with various weight content of ε-caprolactone as a comonomer (between 0.0 and 25.0 wt.%). The reaction was promoted by N,N’-isophthaloyl-bis-ε-caprolactam, as activator (0.4 mol%) and ε-caprolactam magnesium bromide, as initiator (0.6 mol%). The initial copolymerization temperature was kept constant at 160 °C ± 2 °C and the copolymerization-molding time was 30 min for all tests. The details related to the synthesis of anionic nylon 6 homopolymer and its copolymers were presented in previously published articles.3,24,27
Sample preparation
ATR-FTIR, DSC and X-ray measurements were performed on samples cut from parts coming directly from synthesis. The dielectric properties measurements were performed on thin and transparent film samples. The nylon 6 homopolymer and polyesteramide copolymers films were prepared by solution evaporation technique. A solution of 10.0 wt.% polymer was made in formic acid (80.0 wt.%) and poured onto a clean and dry optical glass plate. It was kept in dust free oven, in vacuum at 60 °C for 48 h to get a transparent dry solid film of uniform thickness (about 20 μm).
Characterization methods
The ATR-FTIR spectra of the samples coming directly from synthesis were recorded at 25 °C, over the range 4000-600 cm–1 using a Bruker Vertex70 spectrometer. The internal reflection element was a single reflection diamond ATR crystal with an incidence angle of 45°. Hundred scans at a resolution of 2 cm–1 were averaged to obtain each spectrum. DSC measurements on the nylon 6 homopolymer and the polyesteramide copolymers, coming directly from synthesis were performed using a Pyris Diamond DSC, Perkin Elmer. The samples were encapsulated in aluminum pans, the mass of the sample used for analysis being of 5.0-6.0 mg. All the DSC measurements were carried out under nitrogen protection (40 mL min−1) in order to diminish oxidation. All specimens were run at 10 °C min–1 through a heating cycle from 25 °C to 250 °C and then through a cooling cycle, also at 10 °C min–1, after holding for 3 min at 250 °C to eliminate previous thermal history. Using the heat of fusion for a 100% crystalline nylon 6 homopolymer and polycaprolactone (PCLO) as 191.1 J g–1 3,25 and
136.2 J g–1 3,22 respectively, the degree of crystallinity (αDSC) (first heating scan) of nylon 6 homopolymer and the polyesteramide copolymers were determined from ratio of the melting enthalpy of the sample (ΔHf) obtained by DSC and the melting enthalpy of a completely crystalline sample (ΔHf,c) using the following equation:
100f
DSCf c,
H
Hα
∆= ×
∆ (1)
The values of the melting enthalpy (ΔHf,c) for the 100% crystalline polyesteramide copolymers were calculated based on the contributions of the mole percent of each homopolymer in the respective copolymer. The crystal structure of the anionic nylon 6 homopolymer and polyesteramide copolymers samples was recorded at room temperature by means of wide-angle X-ray diffraction (WAXD) technique as function of CLO content on a DRON-2.0 diffractometer equipped with nickel-filtered CuKα radiation of wavelength 1.54182 Å, in the Bragg angle range (5 < 2θ < 50°) at a speed of 2° min–1. The voltage and tube current were 26 kV and 30 mA, respectively. The X-ray measurements were performed on cut sample of approximately 20 × 20 × 4 mm. Dielectric measurements of the anionic nylon 6 homopolymer and polyesteramide copolymers samples were performed with an Agilent 4292A Precision Impedance Analyzer using sandwich-type cells. The samples (film with thickness 20 μm) were located between two horizontal silver plated metallic electrodes. The contact area of the samples was of 4-8 mm2. The measurements were performed in a direction perpendicular to the surface of polymeric films. The measurements were conducted over a broad frequency range, 100 < F (Hz) < 106. Different formalisms such as complex dielectric permittivity, ε*(f), complex electric modulus, M*(f) and complex impedance, Z*(f) have been explored to interpret the dielectric spectra. The dielectric behavior of both nylon 6 homopolymer and polyesteramide copolymers with varying CLO content was evaluated taking into account the well known expression of the complex permittivity (ε*(f) = ε’(f) + iε’’(f)) that contain the two terms, namely the real part of dielectric permittivity, ε’(f) (i.e., energy storage term, dielectric constant) and the imaginary part of dielectric permittivity, ε’’(f) (i.e., absorptive term, dielectric loss) associated with the polarization or capacitance and the conductance of the polymer, respectively.26,28 Also, complex electric modulus (M*(f) = M’(f) + iM’’(f)) and complex impedance (Z*(f) = Z’(f) + iZ’’(f)) were evaluated. The results obtained under our experimental conditions were the typical values of reproduced experiments.
Rusu and Rusu 341Vol. 26, No. 2, 2015
Results and Discussion
ATR-FTIR analysis
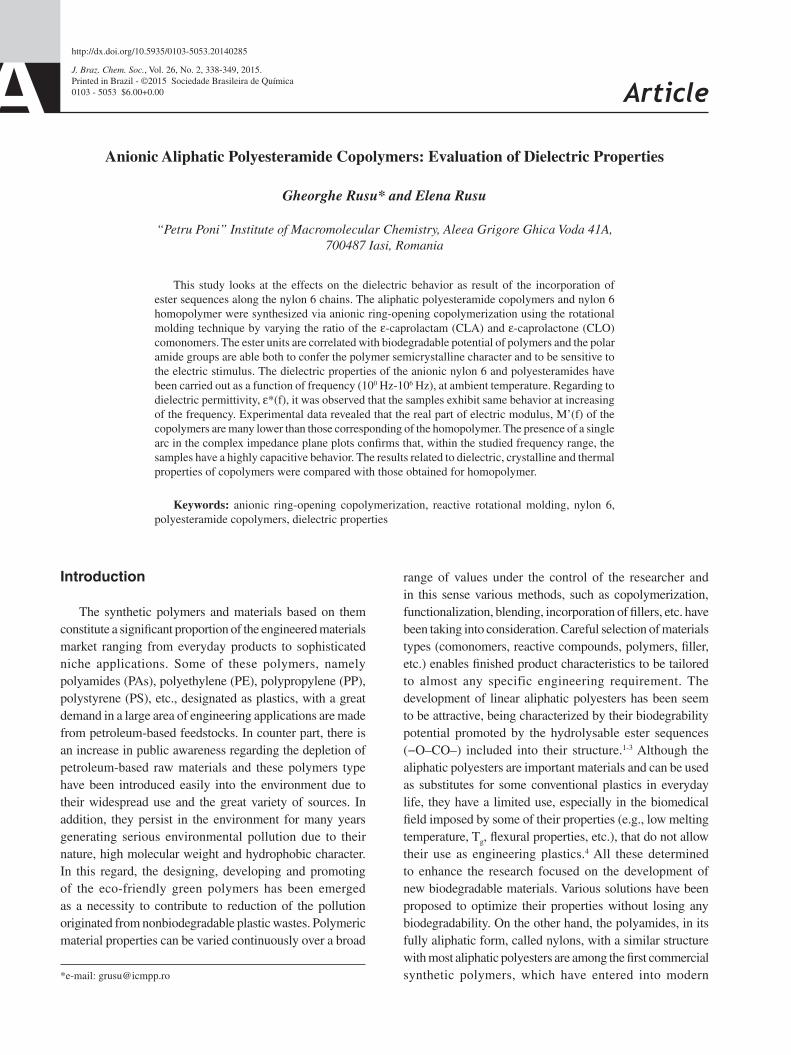
The ATR-FTIR spectra are used to investigate the structure of nylon 6 and polyesteramide copolymers. Figure 1a and 1b show the ATR-FTIR spectra of nylon 6 and polyesteramides copolymer with 20 wt.% CLO content and the corresponding derivatives.
The second derivative spectra were used for increasing the accuracy of the sample evaluation.
The repeating units [–(CH2)5–NHCO–]n present in the backbone of nylon 6 and polyesteramide copolymers determine in the IR range the appearance of peaks corresponding to characteristic absorbance by the methylene, as well as from amide groups. In addition, information related to crystalline structure of polymers under study can be obtained, being known that amide units are able to form hydrogen bonds, which confer semicrystalline character, representative for this type of polymer.29,30 An overview on
the spectra evidenced their similarity and a downshift of the bands in the fingerprint region, in the case of polyesteramide copolymer. This fact could be explained by the increase in the heterogeneity of the system due to incorporation of ester group in nylon 6 backbone that determines an increase in the scattered radiation favored by increasing in the mobility of alkylene segments. The bands corresponding to the aliphatic parts of polyamide chain associated to –CH2– stretch vibration appear in IR spectra as antisymmetric stretching vibration nas(C–H) (higher frequency), at about 2938 cm–1 and as symmetric stretching vibration ns(C–H) at ca. 2867 cm–1.31 Their position does not seem to undergo shift, but a slight modification in the relative peaks intensities occurs in the case of polyesteramides, justified by the changes in the structure of chains. At about 1478 cm–1 and 1417 cm–1 appears a shoulder and a band, respectively attributed to –CH2– units adjacent to NH and C=O groups in the extended conformation of the nylon 6 chains in the α crystal modification. At 1462 cm–1 and 1444 cm–1, bands associated with amorphous phase can be observed. In the spectrum of polyesteramide, it was observed that besides the fact that the band at 1417 cm–1 shifts towards lower frequency, at 1411 cm–1 the relative intensities of the bands change. Near 1372 cm–1 and 1369 cm–1 for nylon 6 and polyesteramide, respectively, is displayed the band corresponding to the CH2 wagging vibration, that overlap amide III band. In the 760-680 cm–1 region, CH2 unit is associated only with the rocking shoulder at 728 cm–1 (see Figure 1). In the N–H stretching region, there are two distinguishable bands (Figure 1). One broad and intense band, which is centered at about 3294 cm–1 (amide A) in nylon 6 spectrum, is associated with hydrogen-bonded amide groups. For copolymers its frequency increases, at about 3298 cm–1 indicates weaker hydrogen bonds, since it is known that the hydrogen stretching frequency in NH–O bonds, as in OH–O bonds, increases as the strength of the hydrogen bond decreases.32 The other band, a shoulder at ca. 3400 cm–1 was identified with the free amide groups. The weak and broad band, which appears at ca. 3067 cm–1 and 3074 cm–1 in the spectrum of homopolymer and copolymer, respectively, is called amide B, overtone of amide II (harmonic amide II vibration in Fermi resonance with the stretching NH). Another two strong bands at 1634 cm–1 and 1540 cm–1 are assigned to the amide I band and to the amide II band and have main contributions of the C=O stretching and the NH deformation, respectively. These bands are characteristic of the amide groups existing in the trans planar conformation. The origin of the small shifts (about 1 cm–1) for the observed amide I and amide II bands, to blue and red, respectively could arise from the reorganization of hydrogen bonding in the copolymers structure and this fact is related to the appearance of γ form.
Figure 1. ATR-FTIR spectra of nylon 6 homopolymer and polyesteramide copolymer with 20 wt.% CLO and representative synchronous surfaces, around the amide I band for PEA0 and PEA20 (a) and the second derivative spectra (b).
Anionic Aliphatic Polyesteramide Copolymers: Evaluation of Dielectric Properties J. Braz. Chem. Soc.342
Amide III vibration comes out at about 1372 cm–1 and 1369 cm–1 for homopolymer and copolymer, respectively, while amide IV is present at about 745 cm–1. Also, the out of plane bending vibrations of the NH (amide V) and C=O (amide VI) groups are polymorph sensitive and appear near 690 cm–1 and 600 cm–1, respectively. The amide V band shifts from 690 to 692 cm–1 and this behavior seems to be determined by the appearance of the γ phase, respectively. This fact indicates that the form of the crystalline phase of homopolymer and copolymers is predominantly of α type.33,34 The band near 1739 cm–1 was associated with ester C=O group from polyesteramide copolymers structure. The presence of 3377 cm–1 band in the spectra indicates that there is N–H bonding to ester carbonyls.16 Thus, strictly speaking, the results presented here validate the structure of polymers under study and are consistent with the structural differences between the samples.
X-ray analysis
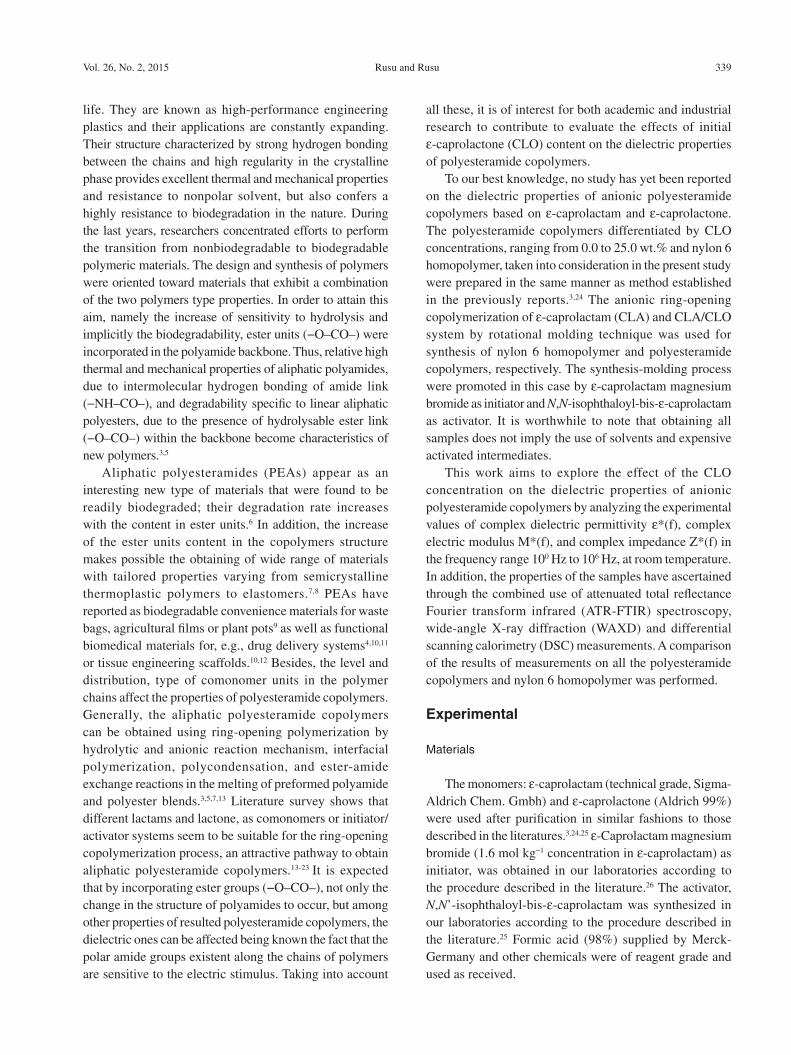
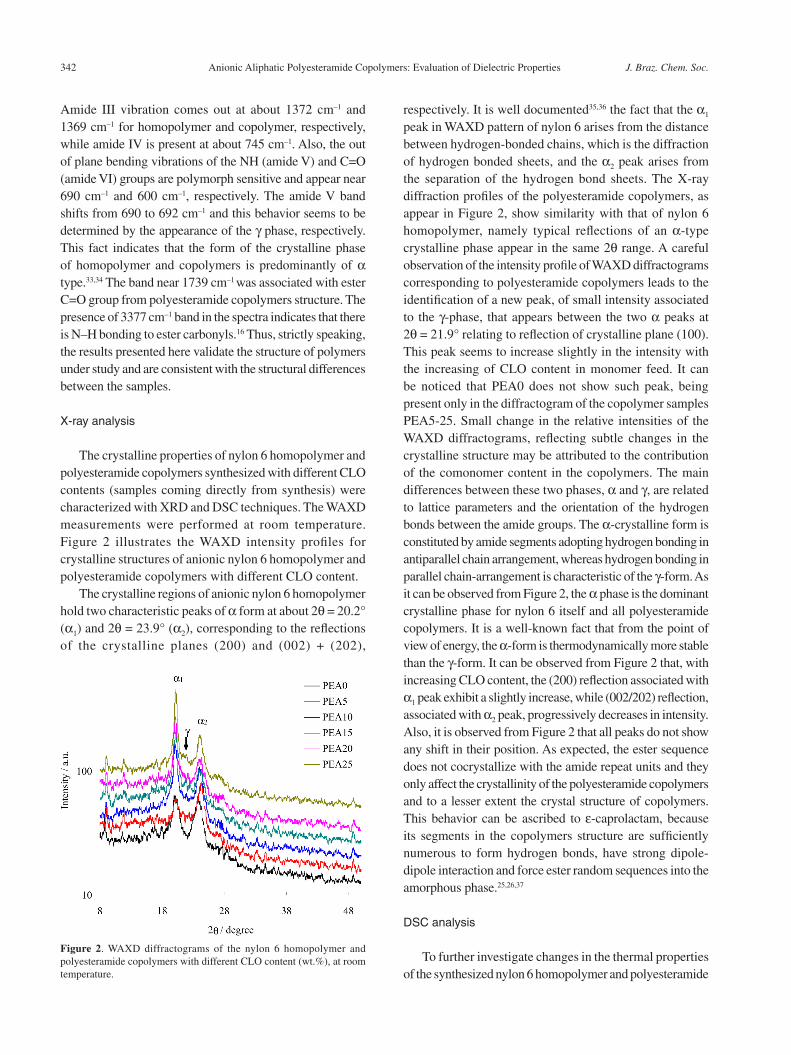
The crystalline properties of nylon 6 homopolymer and polyesteramide copolymers synthesized with different CLO contents (samples coming directly from synthesis) were characterized with XRD and DSC techniques. The WAXD measurements were performed at room temperature. Figure 2 illustrates the WAXD intensity profiles for crystalline structures of anionic nylon 6 homopolymer and polyesteramide copolymers with different CLO content.
The crystalline regions of anionic nylon 6 homopolymer hold two characteristic peaks of α form at about 2θ = 20.2° (α1) and 2θ = 23.9° (α2), corresponding to the reflections of the crystalline planes (200) and (002) + (202),
respectively. It is well documented35,36 the fact that the α1 peak in WAXD pattern of nylon 6 arises from the distance between hydrogen-bonded chains, which is the diffraction of hydrogen bonded sheets, and the α2 peak arises from the separation of the hydrogen bond sheets. The X-ray diffraction profiles of the polyesteramide copolymers, as appear in Figure 2, show similarity with that of nylon 6 homopolymer, namely typical reflections of an α-type crystalline phase appear in the same 2θ range. A careful observation of the intensity profile of WAXD diffractograms corresponding to polyesteramide copolymers leads to the identification of a new peak, of small intensity associated to the γ-phase, that appears between the two α peaks at 2θ = 21.9° relating to reflection of crystalline plane (100). This peak seems to increase slightly in the intensity with the increasing of CLO content in monomer feed. It can be noticed that PEA0 does not show such peak, being present only in the diffractogram of the copolymer samples PEA5-25. Small change in the relative intensities of the WAXD diffractograms, reflecting subtle changes in the crystalline structure may be attributed to the contribution of the comonomer content in the copolymers. The main differences between these two phases, α and γ, are related to lattice parameters and the orientation of the hydrogen bonds between the amide groups. The α-crystalline form is constituted by amide segments adopting hydrogen bonding in antiparallel chain arrangement, whereas hydrogen bonding in parallel chain-arrangement is characteristic of the γ-form. As it can be observed from Figure 2, the α phase is the dominant crystalline phase for nylon 6 itself and all polyesteramide copolymers. It is a well-known fact that from the point of view of energy, the α-form is thermodynamically more stable than the γ-form. It can be observed from Figure 2 that, with increasing CLO content, the (200) reflection associated with α1 peak exhibit a slightly increase, while (002/202) reflection, associated with α2 peak, progressively decreases in intensity. Also, it is observed from Figure 2 that all peaks do not show any shift in their position. As expected, the ester sequence does not cocrystallize with the amide repeat units and they only affect the crystallinity of the polyesteramide copolymers and to a lesser extent the crystal structure of copolymers. This behavior can be ascribed to ε-caprolactam, because its segments in the copolymers structure are sufficiently numerous to form hydrogen bonds, have strong dipole-dipole interaction and force ester random sequences into the amorphous phase.25,26,37
DSC analysis
To further investigate changes in the thermal properties of the synthesized nylon 6 homopolymer and polyesteramide
Figure 2. WAXD diffractograms of the nylon 6 homopolymer and polyesteramide copolymers with different CLO content (wt.%), at room temperature.
Rusu and Rusu 343Vol. 26, No. 2, 2015
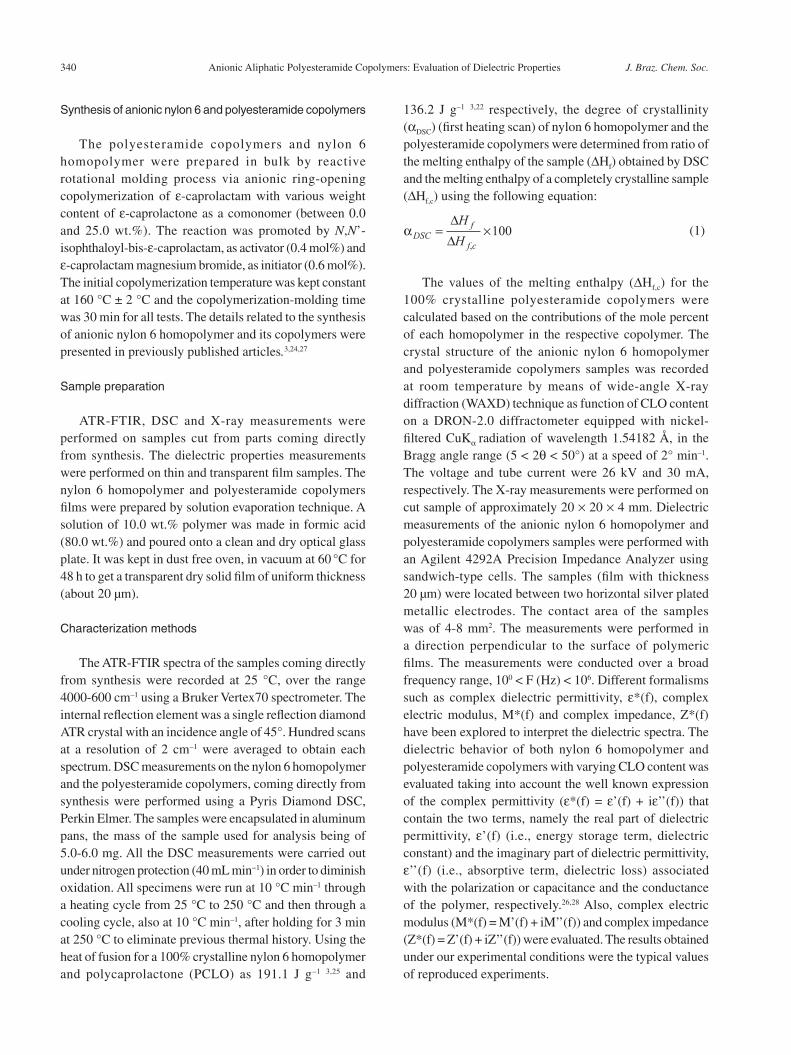
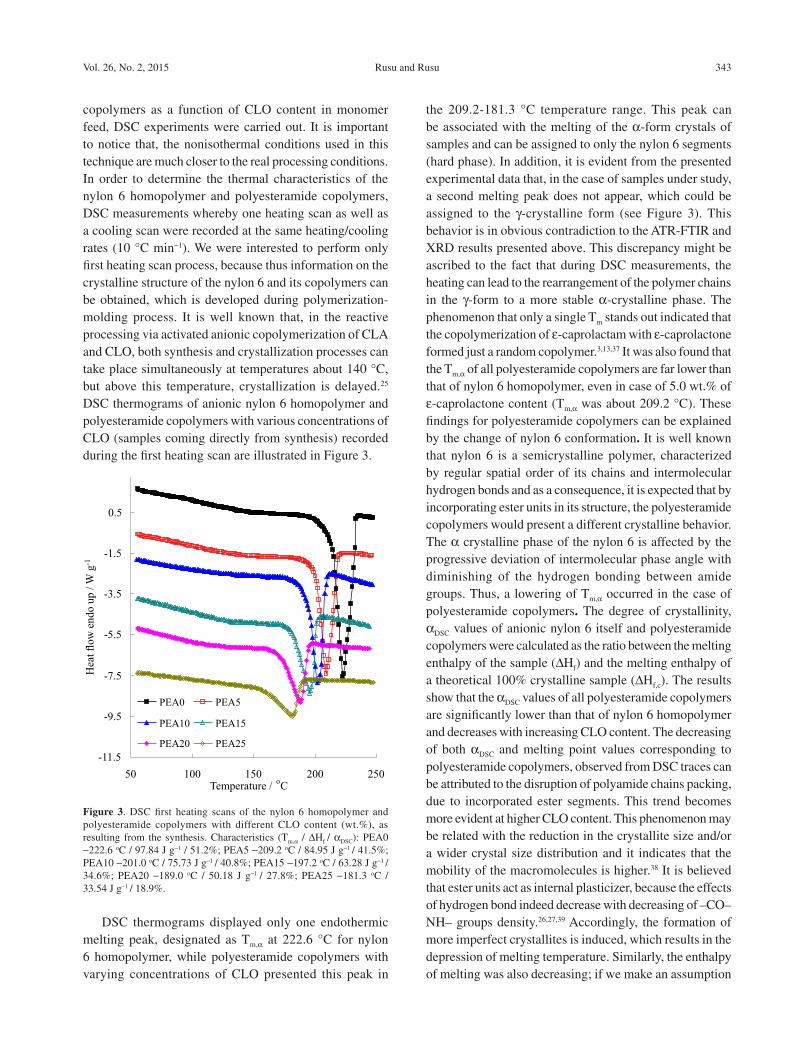
copolymers as a function of CLO content in monomer feed, DSC experiments were carried out. It is important to notice that, the nonisothermal conditions used in this technique are much closer to the real processing conditions. In order to determine the thermal characteristics of the nylon 6 homopolymer and polyesteramide copolymers, DSC measurements whereby one heating scan as well as a cooling scan were recorded at the same heating/cooling rates (10 °C min−1). We were interested to perform only first heating scan process, because thus information on the crystalline structure of the nylon 6 and its copolymers can be obtained, which is developed during polymerization-molding process. It is well known that, in the reactive processing via activated anionic copolymerization of CLA and CLO, both synthesis and crystallization processes can take place simultaneously at temperatures about 140 °C, but above this temperature, crystallization is delayed.25 DSC thermograms of anionic nylon 6 homopolymer and polyesteramide copolymers with various concentrations of CLO (samples coming directly from synthesis) recorded during the first heating scan are illustrated in Figure 3.
DSC thermograms displayed only one endothermic melting peak, designated as Tm,α at 222.6 °C for nylon 6 homopolymer, while polyesteramide copolymers with varying concentrations of CLO presented this peak in
the 209.2-181.3 °C temperature range. This peak can be associated with the melting of the α-form crystals of samples and can be assigned to only the nylon 6 segments (hard phase). In addition, it is evident from the presented experimental data that, in the case of samples under study, a second melting peak does not appear, which could be assigned to the γ-crystalline form (see Figure 3). This behavior is in obvious contradiction to the ATR-FTIR and XRD results presented above. This discrepancy might be ascribed to the fact that during DSC measurements, the heating can lead to the rearrangement of the polymer chains in the γ-form to a more stable α-crystalline phase. The phenomenon that only a single Tm stands out indicated that the copolymerization of ε-caprolactam with ε-caprolactone formed just a random copolymer.3,13,37 It was also found that the Tm,α of all polyesteramide copolymers are far lower than that of nylon 6 homopolymer, even in case of 5.0 wt.% of ε-caprolactone content (Tm,α was about 209.2 °C). These findings for polyesteramide copolymers can be explained by the change of nylon 6 conformation. It is well known that nylon 6 is a semicrystalline polymer, characterized by regular spatial order of its chains and intermolecular hydrogen bonds and as a consequence, it is expected that by incorporating ester units in its structure, the polyesteramide copolymers would present a different crystalline behavior. The α crystalline phase of the nylon 6 is affected by the progressive deviation of intermolecular phase angle with diminishing of the hydrogen bonding between amide groups. Thus, a lowering of Tm,α occurred in the case of polyesteramide copolymers. The degree of crystallinity, αDSC values of anionic nylon 6 itself and polyesteramide copolymers were calculated as the ratio between the melting enthalpy of the sample (ΔHf) and the melting enthalpy of a theoretical 100% crystalline sample (ΔHf,c). The results show that the αDSC values of all polyesteramide copolymers are significantly lower than that of nylon 6 homopolymer and decreases with increasing CLO content. The decreasing of both αDSC and melting point values corresponding to polyesteramide copolymers, observed from DSC traces can be attributed to the disruption of polyamide chains packing, due to incorporated ester segments. This trend becomes more evident at higher CLO content. This phenomenon may be related with the reduction in the crystallite size and/or a wider crystal size distribution and it indicates that the mobility of the macromolecules is higher.38 It is believed that ester units act as internal plasticizer, because the effects of hydrogen bond indeed decrease with decreasing of –CO–NH– groups density.26,27,39 Accordingly, the formation of more imperfect crystallites is induced, which results in the depression of melting temperature. Similarly, the enthalpy of melting was also decreasing; if we make an assumption
-11.5
-9.5
-7.5
-5.5
-3.5
-1.5
0.5
50 100 150 200 250
Temperature /oC
PEA0 PEA5
PEA10 PEA15
PEA20 PEA25
Heat
flo
w e
nd
o u
p /
Wg
-1
Figure 3. DSC first heating scans of the nylon 6 homopolymer and polyesteramide copolymers with different CLO content (wt.%), as resulting from the synthesis. Characteristics (Tm,α / ΔHf / αDSC): PEA0 ‑222.6 oC / 97.84 J g‑1 / 51.2%; PEA5 ‑209.2 oC / 84.95 J g‑1 / 41.5%; PEA10 ‑201.0 oC / 75.73 J g‑1 / 40.8%; PEA15 ‑197.2 oC / 63.28 J g‑1 / 34.6%; PEA20 ‑189.0 oC / 50.18 J g‑1 / 27.8%; PEA25 ‑181.3 oC / 33.54 J g‑1 / 18.9%.
-11.5
-9.5
-7.5
-5.5
-3.5
-1.5
0.5
50 100 150 200 250
Temperature /oC
PEA0 PEA5
PEA10 PEA15
PEA20 PEA25
Heat
flo
w e
nd
o u
p /
Wg
-1
Anionic Aliphatic Polyesteramide Copolymers: Evaluation of Dielectric Properties J. Braz. Chem. Soc.344
that the enthalpy of melting would be given only by the caprolactam sequences (191.1 J g–1) (enthalpy of melting for a 100% crystalline nylon 6 homopolymer), the degree of crystallinity of polyesteramide copolymers decreases from the initial 51.2% for anionic nylon 6 homopolymer to 18.9% for the copolymers with highest content of CLO (25 wt.%). So, it can be stated that, increasing content of the ester units incorporated into nylon 6 structure, the content of the crystalline phase decreases (the degree of the ordering of the system significantly decreases). Even if the two comonomers that contribute to the structure of polyesteramide copolymers separately are crystalizable, the presence of the CLO comonomer units along the copolymer chains affects the symmetry. As the content of minor comonomer increases, the incompatibility in the crystal lattices of the two components prevent cocrystallization. This is consistent with the fact that the –CO–NH– groups density along the polyesteramide copolymers chains decreases as comonomer CLO content increases.
Dielectric analysis
Dielectric analysis is known as a useful informative technique for the determination of the molecular motions and structural relaxations present in the polymeric materials that have permanent dipole moments.40 During dielectric measurements, the sample is exposed to an alternating electric field generated by applying a sinusoidal voltage, and an alignment of dipoles in the material, which results in polarization. It is a well-known fact that in the polymers and copolymers containing permanent dipole moments of the polar groups, in the absence of alternating field, orientation of dipole moments are random. The action of electric field affords the orientation of permanent dipole moments along its direction, the process being called orientational polarization or ‘dipole polarization’. By the polar nature, the amide groups (−NH–CO–) and ester groups (−O–CO–) existent along the chains in the polyesteramide copolymers act as permanent dipoles and it is expected to be sensitive to the electric stimulus. Increasing −O−CO− structural units content in the nylon 6 backbones, the polarity of the resulted polyesteramide copolymers decreases.41
Experimental data resulted from dielectric measurements can be analyzed by means of different formalisms, such as complex dielectric permittivity ε*(f), complex electric modulus M*(f) and complex impedance Z*(f).
The complex dielectric permittivity ε*(f) of an insulating material depends on the frequency (f) in Hertz (Hz) of the applied electric field and can be split into a real part ε’(f) and an imaginary part ε”(f), according to the equation:
ε*(f) = ε’(f) − iε”(f) (2)
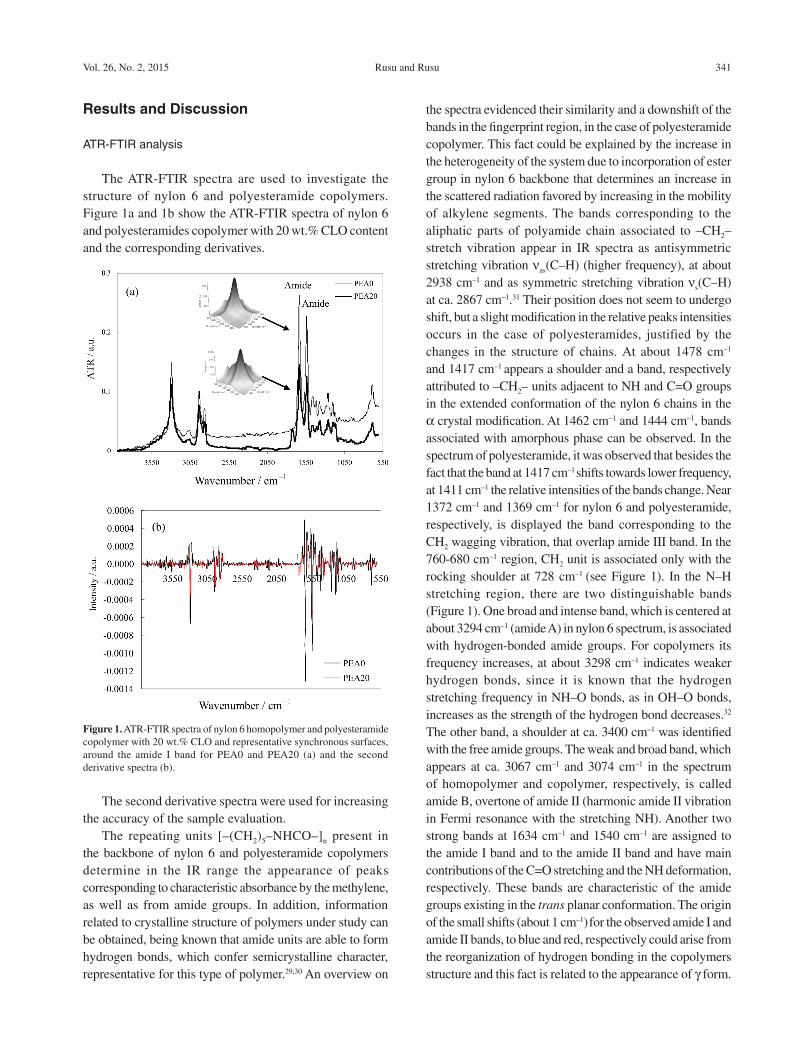
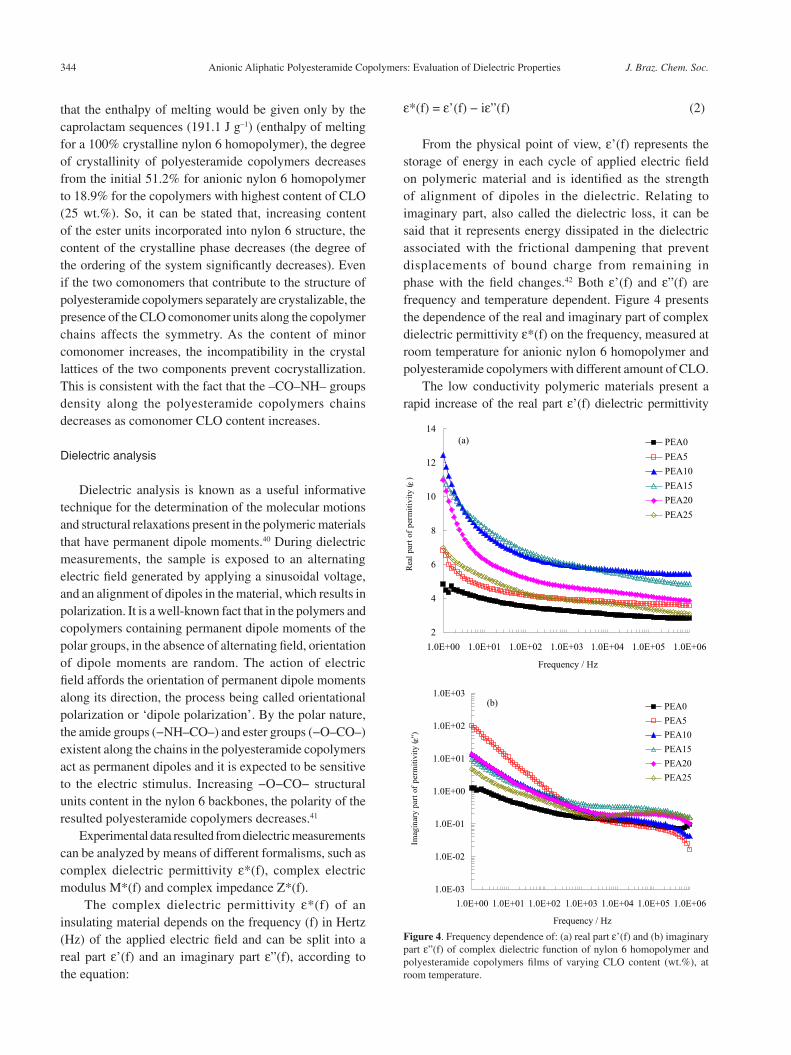
From the physical point of view, ε’(f) represents the storage of energy in each cycle of applied electric field on polymeric material and is identified as the strength of alignment of dipoles in the dielectric. Relating to imaginary part, also called the dielectric loss, it can be said that it represents energy dissipated in the dielectric associated with the frictional dampening that prevent displacements of bound charge from remaining in phase with the field changes.42 Both ε’(f) and ε”(f) are frequency and temperature dependent. Figure 4 presents the dependence of the real and imaginary part of complex dielectric permittivity ε*(f) on the frequency, measured at room temperature for anionic nylon 6 homopolymer and polyesteramide copolymers with different amount of CLO.
The low conductivity polymeric materials present a rapid increase of the real part ε’(f) dielectric permittivity
2
4
6
8
10
12
14
1.0E+00 1.0E+01 1.0E+02 1.0E+03 1.0E+04 1.0E+05 1.0E+06
Frequency / Hz
Rea
lp
art
of
per
mit
ivit
y( ε
)
PEA0
PEA5
PEA10
PEA15
PEA20
PEA25
(a)
1.0E-03
1.0E-02
1.0E-01
1.0E+00
1.0E+01
1.0E+02
1.0E+03
1.0E+00 1.0E+01 1.0E+02 1.0E+03 1.0E+04 1.0E+05 1.0E+06
Frequency / Hz
Imag
inar
ypar
tof
per
mit
ivit
y( ε'
')
PEA0
PEA5
PEA10
PEA15
PEA20
PEA25
(b)
Figure 4. Frequency dependence of: (a) real part ε’(f) and (b) imaginary part ε”(f) of complex dielectric function of nylon 6 homopolymer and polyesteramide copolymers films of varying CLO content (wt.%), at room temperature.
2
4
6
8
10
12
14
1.0E+00 1.0E+01 1.0E+02 1.0E+03 1.0E+04 1.0E+05 1.0E+06
Frequency / Hz
Rea
lp
art
of
per
mit
ivit
y( ε
)
PEA0
PEA5
PEA10
PEA15
PEA20
PEA25
(a)
1.0E-03
1.0E-02
1.0E-01
1.0E+00
1.0E+01
1.0E+02
1.0E+03
1.0E+00 1.0E+01 1.0E+02 1.0E+03 1.0E+04 1.0E+05 1.0E+06
Frequency / Hz
Imag
inar
ypar
tof
per
mit
ivit
y( ε'
')
PEA0
PEA5
PEA10
PEA15
PEA20
PEA25
(b)
Rusu and Rusu 345Vol. 26, No. 2, 2015
measured at low frequency, near 100 Hz, due to the electrode polarization and interfacial relaxation phenomena, and this can completely mask the low frequency relaxation. Considering the insulating nature of the examined systems, the large values of ε’(f) at low frequency consist in the contribution of the two phenomena. The nylon 6 homopolymer and polyesteramide copolymers film-electrode interface polarization masks the other relaxation processes at low frequencies. This tendency of ε’(f) to be in the range of low frequencies indicates a normal behavior of the dielectric materials. It was found that dielectric permittivity of all polyesteramide copolymers measured at lower frequency is always greater than higher frequency. It is noticed from Figure 4a that the real part of dielectric permittivity ε’(f) values of nylon 6 homopolymer and its copolymers decreases steeply increasing the frequency, in the range of low frequencies (100-103 Hz) and remains constant at higher frequencies, indicating the usual dielectric dispersion. The decrease in ε’(f) for nylon 6 homopolymer and polyesteramide copolymers with increase in the frequency may be attributed to the electrical relaxation processes, but at the same time, the material electrode polarization must be taken into consideration. The fact that at higher frequencies (f > 104 Hz) the real part of dielectric permittivity ε’(f) of all samples remains independent of frequency can be explained by the inability of electric dipoles to follow the fast variation of the alternating applied electric field. In the studied frequency range 100 to 106 Hz, the behavior of the real part dielectric permittivity ε’(f) for all polyesteramide copolymers with increase in frequency is similar to that of nylon 6 homopolymer. Figure 4b shows the variation of imaginary part of dielectric function, ε”(f) with frequency for nylon 6 homopolymer and polyesteramide copolymers with different concentration of CLO, at room temperature. The dielectric loss of nylon 6 homopolymer decreases progressively increasing frequency up to 104 Hz. The copolymers exhibit same tend regarding the behavior of ε”(f) at increasing frequency. In the imaginary part ε”(f) spectra it was observed the appearance of a peak at a characteristic frequency (105 and 106 Hz range) for both nylon 6 homopolymer and polyesteramide copolymers, suggesting the presence of relaxing dipoles in all the samples. This result related to imaginary part ε”(f) of dielectric function ε*(f) can be associated with the relaxation phenomena due to glass transition of the amorphous component of the polymer. It is observed that the peak frequency is shifted towards the higher frequency side with an increase in the CLO concentration. As the peak shifts towards higher frequency side, the relaxation time is reduced. Incorporating ester sequences into nylon 6 structure, it is believed that there is an increase in the amorphous content of the copolymers.
This observation is in agreement with results obtained by DSC and X-ray analyses. It can be observed from Figure 4 that both real and imaginary part of dielectric permittivity values for all polyesteramide copolymers, on the whole frequency range are much higher than the corresponding nylon 6 homopolymer. The incorporation of ester links (−O–CO–) (soft sequence) in the nylon 6 structure can lead to exhibition of a plasticizing effect3,43
(decrease crystallinity and increase amorphous phase), accompanied by improving the segmental flexibility of the copolymer backbone, and consequently the enhancement of the segmental mobility occurs. The increased segmental mobility of the polyesteramide copolymers facilitates the orientation of dipoles, thereby leading to an increase in both real and imaginary part of dielectric permittivity of the samples. Generally, semicrystalline polymers are two-phase systems consisting of both amorphous and crystalline domains; both phases can have relaxation processes. It is noticed that polymeric materials with higher crystallinity are prone to exhibit lower tendency of dielectric relaxation due to the constraint imposed on the phase dipoles.44 Both nylon 6 homopolymer and polyesteramide copolymers are polar and semicrystalline materials, and the segmental motions are strongly affected by the presence of crystalline phase. As it is well known, the polar molecules have greater value of permittivity than non-polar ones because of an additional amount of polarization due to orientation. It is well documented45 the fact that the crystallization prevents the movement in the chains; the crystalline phase is rigid and dielectric relaxation processes are slow, and as a consequence, the dielectric response is lower. In our previous sections is shown that the degree of crystallinity of the polyesteramides copolymers decreased with the increasing of CLO content. As a consequence, the reduced number of –NH–CO– groups are available for crystallization. All these remarks are in agreement with the DSC and the WAXD results reported in previous sections that also show that the crystallinity decreases upon introduction of CLO into nylon 6 backbones.
The approach of the complex electric modulus formalism for the interpretation of bulk relaxation phenomena (processes with relatively enhanced relaxation time) in complex systems, offers some advantages against other investigations, mainly because of the elimination of the undesirable effect of electrode polarization.46 The complex modulus formalism, M*(f), was first used to describe the dielectric response of non-conducting materials and then it has been applied also to materials with non-zero conductivity. McCrum et al.47 have introduced the electric modulus formalism and then it has been used to study electrical relaxation phenomena in the polymeric materials.48,49 Complex electric modulus
Anionic Aliphatic Polyesteramide Copolymers: Evaluation of Dielectric Properties J. Braz. Chem. Soc.346
formalism analysis can constitute an alternative approach to evaluate electrical properties of the polymers, copolymers and polymeric composite materials and to magnify any other effects present in the sample (which are unidentifiable or superimposed on the others in the impedance spectroscopy technique) as result of different relaxation time constants.50 The electric modulus was taken into consideration when the reciprocal complex permittivity was treated as an electrical analogue to the modulus from dynamic mechanical analysis (DMA) results. This method, used for the study of dielectric relaxations affords to overcome the electrode polarization effect and to resolve low frequency relaxation, and thus the large variation in the permittivity and loss at low frequencies are minimized. Electrode polarization is a parasitic effect related to the electrode-sample contact. It is a well-known fact that from the physical point of view, the electrical modulus corresponds to the relaxation of the electric field in the material when the electric displacement remains constant. For that matter, the modulus represents the real dielectric relaxation process.51 Complex electric modulus can be expressed as the inverse quantity of complex dielectric permittivity by the following equations:
*
*
1( ) ( ) ( )
( )M f M f iM f
fε= = +’ ’’ (3)
where M’ is the real and M” the imaginary part of electric modulus, respectively, and
’’’’’
’’’’’’
’2 2 2 2
( ) ( )( ) , ( )
( ) ( ) ( ) ( )
f fM f M f
f f f f
ε εε ε ε ε
= =+ +
(4)
where ε’(f) , M’(f) and ε”(f), M”(f) are the real and imaginary part of dielectric permittivity and electric modulus, respectively.
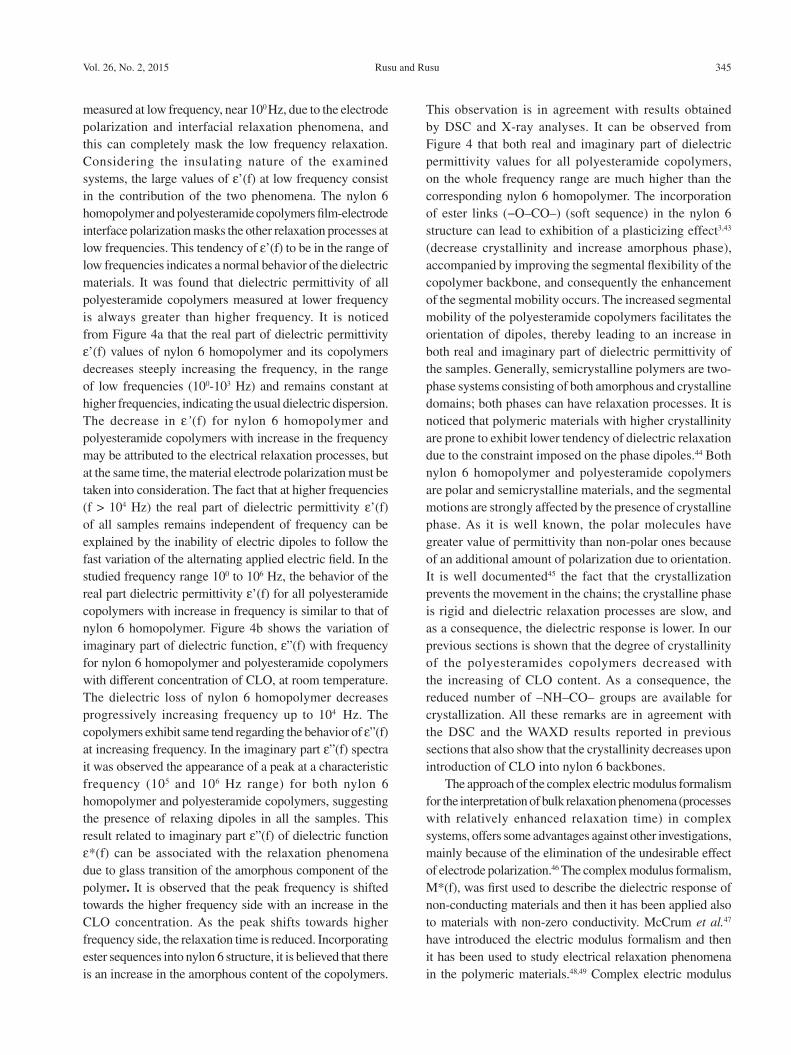
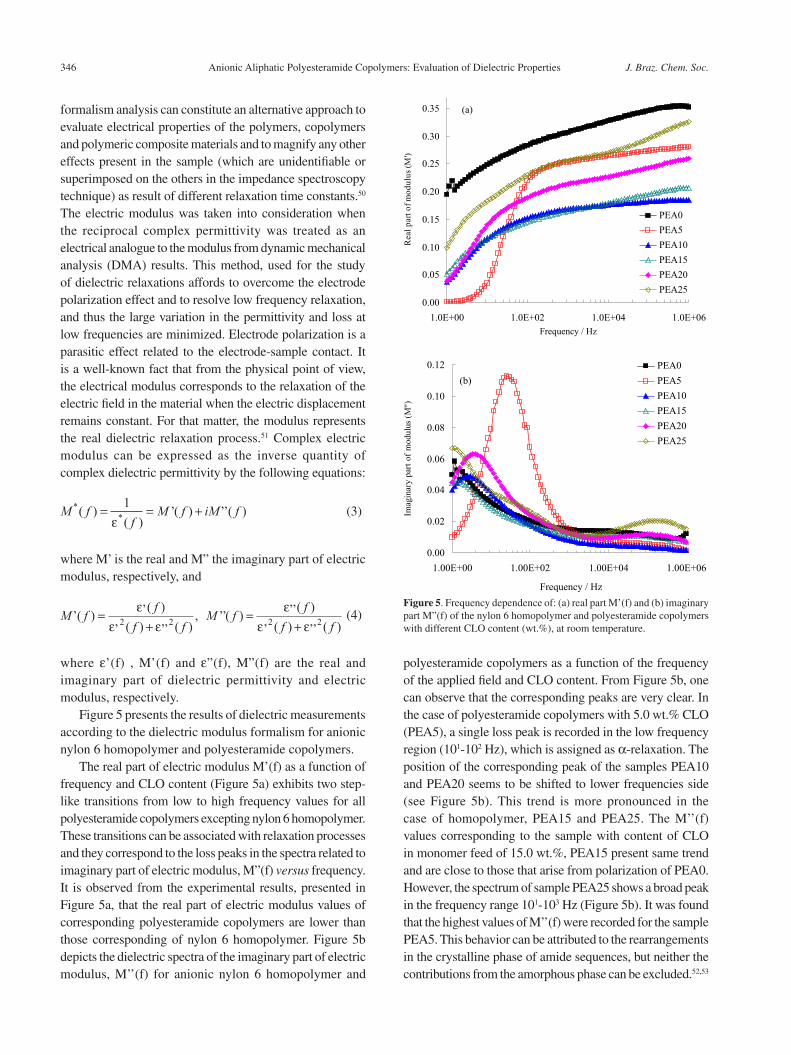
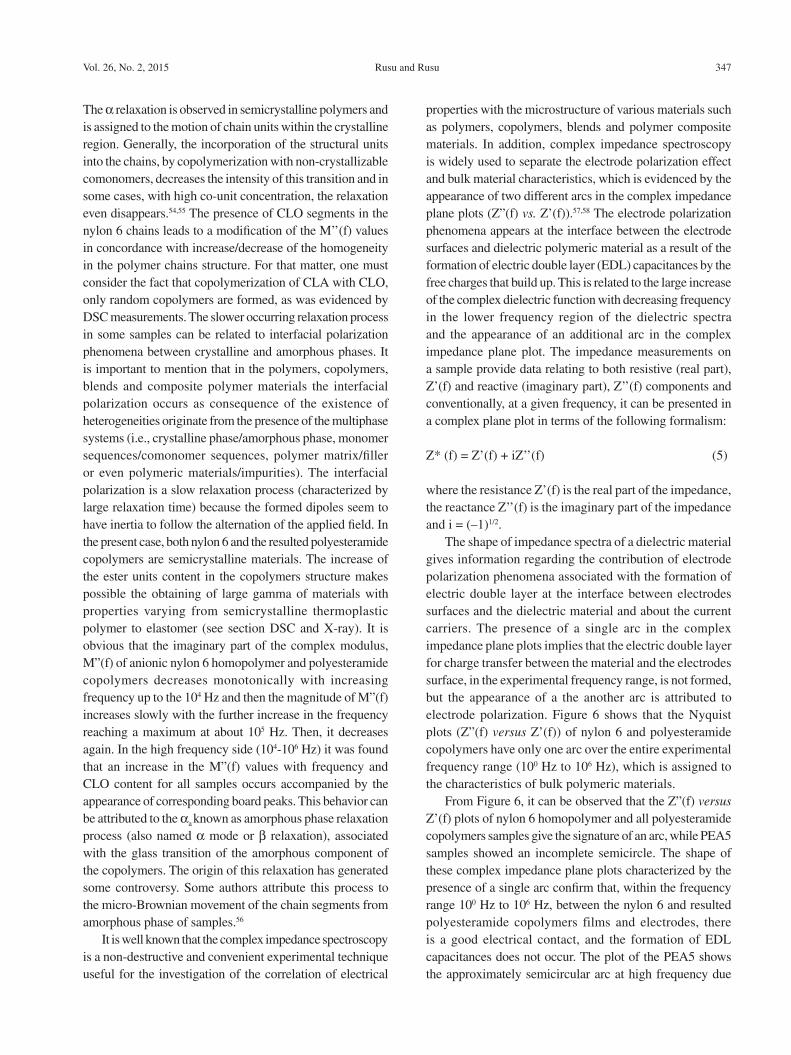
Figure 5 presents the results of dielectric measurements according to the dielectric modulus formalism for anionic nylon 6 homopolymer and polyesteramide copolymers.
The real part of electric modulus M’(f) as a function of frequency and CLO content (Figure 5a) exhibits two step-like transitions from low to high frequency values for all polyesteramide copolymers excepting nylon 6 homopolymer. These transitions can be associated with relaxation processes and they correspond to the loss peaks in the spectra related to imaginary part of electric modulus, M”(f) versus frequency. It is observed from the experimental results, presented in Figure 5a, that the real part of electric modulus values of corresponding polyesteramide copolymers are lower than those corresponding of nylon 6 homopolymer. Figure 5b depicts the dielectric spectra of the imaginary part of electric modulus, M’’(f) for anionic nylon 6 homopolymer and
polyesteramide copolymers as a function of the frequency of the applied field and CLO content. From Figure 5b, one can observe that the corresponding peaks are very clear. In the case of polyesteramide copolymers with 5.0 wt.% CLO (PEA5), a single loss peak is recorded in the low frequency region (101-102 Hz), which is assigned as α-relaxation. The position of the corresponding peak of the samples PEA10 and PEA20 seems to be shifted to lower frequencies side (see Figure 5b). This trend is more pronounced in the case of homopolymer, PEA15 and PEA25. The M’’(f) values corresponding to the sample with content of CLO in monomer feed of 15.0 wt.%, PEA15 present same trend and are close to those that arise from polarization of PEA0. However, the spectrum of sample PEA25 shows a broad peak in the frequency range 101-103 Hz (Figure 5b). It was found that the highest values of M’’(f) were recorded for the sample PEA5. This behavior can be attributed to the rearrangements in the crystalline phase of amide sequences, but neither the contributions from the amorphous phase can be excluded.52,53
0.00
0.05
0.10
0.15
0.20
0.25
0.30
0.35
1.0E+00 1.0E+02 1.0E+04 1.0E+06
Frequency / Hz
Real
part
of
mo
du
l us
(M')
PEA0
PEA5
PEA10
PEA15
PEA20
PEA25
(a)
0.00
0.02
0.04
0.06
0.08
0.10
0.12
1.00E+00 1.00E+02 1.00E+04 1.00E+06
Frequency / Hz
Imag
inar
yp
art
of
mo
du
lus
(M'')
PEA0
PEA5
PEA10
PEA15
PEA20
PEA25
(b)
Figure 5. Frequency dependence of: (a) real part M’(f) and (b) imaginary part M”(f) of the nylon 6 homopolymer and polyesteramide copolymers with different CLO content (wt.%), at room temperature.
0.00
0.05
0.10
0.15
0.20
0.25
0.30
0.35
1.0E+00 1.0E+02 1.0E+04 1.0E+06
Frequency / Hz
Real
part
of
mo
du
l us
(M')
PEA0
PEA5
PEA10
PEA15
PEA20
PEA25
(a)
0.00
0.02
0.04
0.06
0.08
0.10
0.12
1.00E+00 1.00E+02 1.00E+04 1.00E+06
Frequency / Hz
Imag
inar
yp
art
of
mo
du
lus
(M'')
PEA0
PEA5
PEA10
PEA15
PEA20
PEA25
(b)
Rusu and Rusu 347Vol. 26, No. 2, 2015
The α relaxation is observed in semicrystalline polymers and is assigned to the motion of chain units within the crystalline region. Generally, the incorporation of the structural units into the chains, by copolymerization with non-crystallizable comonomers, decreases the intensity of this transition and in some cases, with high co-unit concentration, the relaxation even disappears.54,55 The presence of CLO segments in the nylon 6 chains leads to a modification of the M’’(f) values in concordance with increase/decrease of the homogeneity in the polymer chains structure. For that matter, one must consider the fact that copolymerization of CLA with CLO, only random copolymers are formed, as was evidenced by DSC measurements. The slower occurring relaxation process in some samples can be related to interfacial polarization phenomena between crystalline and amorphous phases. It is important to mention that in the polymers, copolymers, blends and composite polymer materials the interfacial polarization occurs as consequence of the existence of heterogeneities originate from the presence of the multiphase systems (i.e., crystalline phase/amorphous phase, monomer sequences/comonomer sequences, polymer matrix/filler or even polymeric materials/impurities). The interfacial polarization is a slow relaxation process (characterized by large relaxation time) because the formed dipoles seem to have inertia to follow the alternation of the applied field. In the present case, both nylon 6 and the resulted polyesteramide copolymers are semicrystalline materials. The increase of the ester units content in the copolymers structure makes possible the obtaining of large gamma of materials with properties varying from semicrystalline thermoplastic polymer to elastomer (see section DSC and X-ray). It is obvious that the imaginary part of the complex modulus, M”(f) of anionic nylon 6 homopolymer and polyesteramide copolymers decreases monotonically with increasing frequency up to the 104 Hz and then the magnitude of M”(f) increases slowly with the further increase in the frequency reaching a maximum at about 105 Hz. Then, it decreases again. In the high frequency side (104-106 Hz) it was found that an increase in the M”(f) values with frequency and CLO content for all samples occurs accompanied by the appearance of corresponding board peaks. This behavior can be attributed to the αa known as amorphous phase relaxation process (also named α mode or β relaxation), associated with the glass transition of the amorphous component of the copolymers. The origin of this relaxation has generated some controversy. Some authors attribute this process to the micro-Brownian movement of the chain segments from amorphous phase of samples.56
It is well known that the complex impedance spectroscopy is a non-destructive and convenient experimental technique useful for the investigation of the correlation of electrical
properties with the microstructure of various materials such as polymers, copolymers, blends and polymer composite materials. In addition, complex impedance spectroscopy is widely used to separate the electrode polarization effect and bulk material characteristics, which is evidenced by the appearance of two different arcs in the complex impedance plane plots (Z”(f) vs. Z’(f)).57,58 The electrode polarization phenomena appears at the interface between the electrode surfaces and dielectric polymeric material as a result of the formation of electric double layer (EDL) capacitances by the free charges that build up. This is related to the large increase of the complex dielectric function with decreasing frequency in the lower frequency region of the dielectric spectra and the appearance of an additional arc in the complex impedance plane plot. The impedance measurements on a sample provide data relating to both resistive (real part), Z’(f) and reactive (imaginary part), Z’’(f) components and conventionally, at a given frequency, it can be presented in a complex plane plot in terms of the following formalism:
Z* (f) = Z’(f) + iZ’’(f) (5)
where the resistance Z’(f) is the real part of the impedance, the reactance Z’’(f) is the imaginary part of the impedance and i = (–1)1/2.
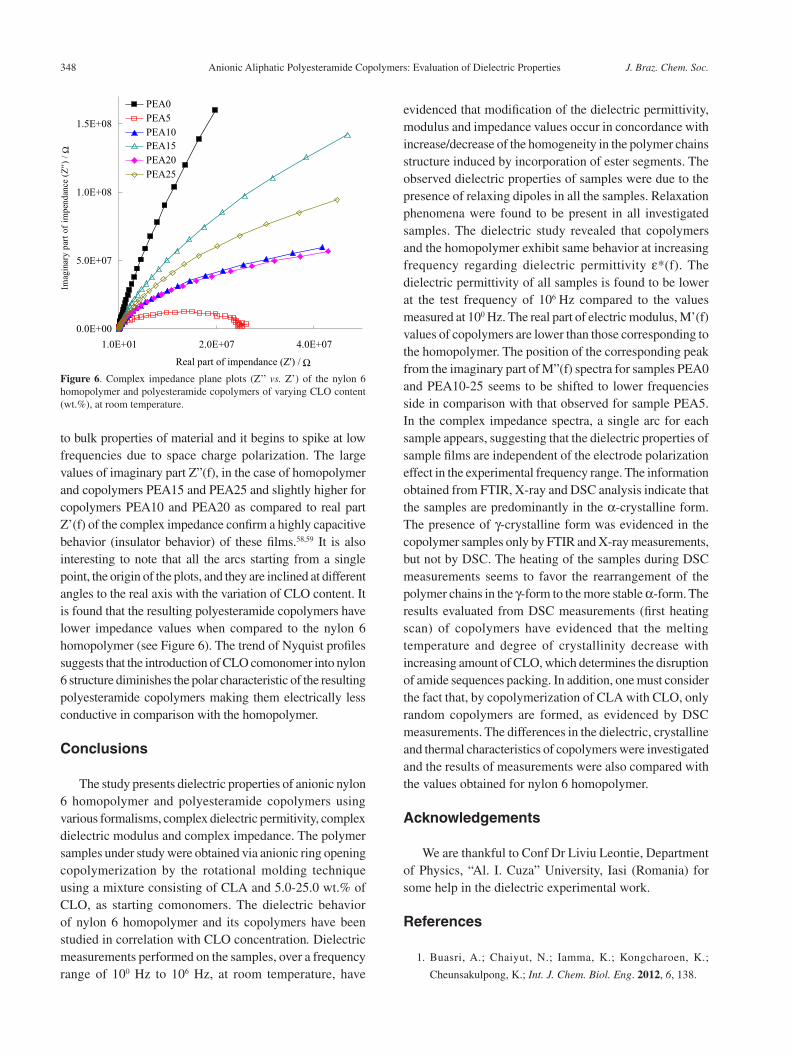
The shape of impedance spectra of a dielectric material gives information regarding the contribution of electrode polarization phenomena associated with the formation of electric double layer at the interface between electrodes surfaces and the dielectric material and about the current carriers. The presence of a single arc in the complex impedance plane plots implies that the electric double layer for charge transfer between the material and the electrodes surface, in the experimental frequency range, is not formed, but the appearance of a the another arc is attributed to electrode polarization. Figure 6 shows that the Nyquist plots (Z”(f) versus Z’(f)) of nylon 6 and polyesteramide copolymers have only one arc over the entire experimental frequency range (100 Hz to 106 Hz), which is assigned to the characteristics of bulk polymeric materials.
From Figure 6, it can be observed that the Z”(f) versus Z’(f) plots of nylon 6 homopolymer and all polyesteramide copolymers samples give the signature of an arc, while PEA5 samples showed an incomplete semicircle. The shape of these complex impedance plane plots characterized by the presence of a single arc confirm that, within the frequency range 100 Hz to 106 Hz, between the nylon 6 and resulted polyesteramide copolymers films and electrodes, there is a good electrical contact, and the formation of EDL capacitances does not occur. The plot of the PEA5 shows the approximately semicircular arc at high frequency due
Anionic Aliphatic Polyesteramide Copolymers: Evaluation of Dielectric Properties J. Braz. Chem. Soc.348
to bulk properties of material and it begins to spike at low frequencies due to space charge polarization. The large values of imaginary part Z”(f), in the case of homopolymer and copolymers PEA15 and PEA25 and slightly higher for copolymers PEA10 and PEA20 as compared to real part Z’(f) of the complex impedance confirm a highly capacitive behavior (insulator behavior) of these films.58,59 It is also interesting to note that all the arcs starting from a single point, the origin of the plots, and they are inclined at different angles to the real axis with the variation of CLO content. It is found that the resulting polyesteramide copolymers have lower impedance values when compared to the nylon 6 homopolymer (see Figure 6). The trend of Nyquist profiles suggests that the introduction of CLO comonomer into nylon 6 structure diminishes the polar characteristic of the resulting polyesteramide copolymers making them electrically less conductive in comparison with the homopolymer.
Conclusions
The study presents dielectric properties of anionic nylon 6 homopolymer and polyesteramide copolymers using various formalisms, complex dielectric permitivity, complex dielectric modulus and complex impedance. The polymer samples under study were obtained via anionic ring opening copolymerization by the rotational molding technique using a mixture consisting of CLA and 5.0-25.0 wt.% of CLO, as starting comonomers. The dielectric behavior of nylon 6 homopolymer and its copolymers have been studied in correlation with CLO concentration. Dielectric measurements performed on the samples, over a frequency range of 100 Hz to 106 Hz, at room temperature, have
evidenced that modification of the dielectric permittivity, modulus and impedance values occur in concordance with increase/decrease of the homogeneity in the polymer chains structure induced by incorporation of ester segments. The observed dielectric properties of samples were due to the presence of relaxing dipoles in all the samples. Relaxation phenomena were found to be present in all investigated samples. The dielectric study revealed that copolymers and the homopolymer exhibit same behavior at increasing frequency regarding dielectric permittivity ε*(f). The dielectric permittivity of all samples is found to be lower at the test frequency of 106 Hz compared to the values measured at 100 Hz. The real part of electric modulus, M’(f) values of copolymers are lower than those corresponding to the homopolymer. The position of the corresponding peak from the imaginary part of M”(f) spectra for samples PEA0 and PEA10-25 seems to be shifted to lower frequencies side in comparison with that observed for sample PEA5. In the complex impedance spectra, a single arc for each sample appears, suggesting that the dielectric properties of sample films are independent of the electrode polarization effect in the experimental frequency range. The information obtained from FTIR, X-ray and DSC analysis indicate that the samples are predominantly in the α-crystalline form. The presence of γ-crystalline form was evidenced in the copolymer samples only by FTIR and X-ray measurements, but not by DSC. The heating of the samples during DSC measurements seems to favor the rearrangement of the polymer chains in the γ-form to the more stable α-form. The results evaluated from DSC measurements (first heating scan) of copolymers have evidenced that the melting temperature and degree of crystallinity decrease with increasing amount of CLO, which determines the disruption of amide sequences packing. In addition, one must consider the fact that, by copolymerization of CLA with CLO, only random copolymers are formed, as evidenced by DSC measurements. The differences in the dielectric, crystalline and thermal characteristics of copolymers were investigated and the results of measurements were also compared with the values obtained for nylon 6 homopolymer.
Acknowledgements
We are thankful to Conf Dr Liviu Leontie, Department of Physics, “Al. I. Cuza” University, Iasi (Romania) for some help in the dielectric experimental work.
References
1. Buasri, A.; Chaiyut, N.; Iamma, K.; Kongcharoen, K.;
Cheunsakulpong, K.; Int. J. Chem. Biol. Eng. 2012, 6, 138.
0.0E+00
5.0E+07
1.0E+08
1.5E+08
1.0E+01 2.0E+07 4.0E+07
Real part of impendance (Z') / Ω
Imag
inar
yp
art
of
imp
end
ance
(Z'')
/Ω
PEA0
PEA5
PEA10
PEA15
PEA20
PEA25
Figure 6. Complex impedance plane plots (Z’’ vs. Z’) of the nylon 6 homopolymer and polyesteramide copolymers of varying CLO content (wt.%), at room temperature.
0.0E+00
5.0E+07
1.0E+08
1.5E+08
1.0E+01 2.0E+07 4.0E+07
Real part of impendance (Z') / Ω
Imag
inar
yp
art
of
imp
end
ance
(Z'')
/Ω
PEA0
PEA5
PEA10
PEA15
PEA20
PEA25
Rusu and Rusu 349Vol. 26, No. 2, 2015
2. Nampoothiri, K. M.; Nair, N. R.; John, R. P.; Bioresource
Technol. 2010, 101, 8493.
3. Rusu, G.; Rusu, E.; J. Polym. Res. 2013, 20, 308.
4. Ali Mohamed, A.; Salhi, S.; Abid, S.; El Gharbi, R.; Fradet, A.;
J. Appl. Polym. Sci. 2014, 131, 40573.
5. Ruppert, M.; Landfester, K.; Ziener, U.; J. Polym. Sci., Part A:
Polym. Chem. 2010, 48, 4929.
6. Vroman, I.; Tighzert, L.; Materials 2009, 2, 307.
7. Deshayes, G.; Delcourt, C.; Verbruggen, I.; Trouillet-Fonti, L.;
Touraud, F.; Fleury, E.; Degée, P.; Destarac, M.; Willem, R.;
Dubois, P.; React. Funct. Polym. 2008, 68, 1392.
8. Chen, X.; Gonsalves, K. E.; Cameron, J. A.; J. Appl. Polym.
Sci. 1993, 50, 1999.
9. Grigat, E.; Koch, R.; Timmermann, R.; Polym. Degrad. Stab.
1998, 59, 223.
10. Sun, H.; Meng, F.; Dias, A. A.; Hendriks, M.; Feijen, J.;
Zhong, Z.; Biomacromolecules 2011, 12, 1937.
11. He, P.; Tang, Z.; Lin, L.; Deng, M.; Pang, X.; Zhuang, X.;
Chen, X.; Macromol. Biosci. 2012, 12, 547.
12. Karimi, P.; Rizkalla, A. S.; Mequanint, K.; Materials 2010, 3,
2346.
13. Gonsalves, K. E.; Chen, X.; Cameron, J. A.; Macromolecules
1992, 25, 3309.
14. Michell, R. M.; Müller, A. J.; Castelletto, V.; Hamley, I.;
Deshayes, G.; Dubois, P.; Macromolecules 2009, 42, 6671.
15. Goodman, I.; Vachon, R. N.; Eur. Polym. J. 1984, 20, 539.
16. Goodman, I.; Eur. Polym. J. 1984, 20, 549.
17. Chromcová, D.; Bernásková, A.; Brožek, J.; Prokopová, I.; Roda,
J.; Náhlík, J.; Sasek, V.; Polym. Degrad. Stab. 2005, 90, 546.
18. Chromcová, D.; Baslerová, L.; Roda, J.; Brožek, J.; Eur. Polym.
J. 2008, 44, 1733.
19. Toncheva, N.; Mateva, R.; Polym. Bull. 2008, 60, 27.
20. Bernášková, A.; Chromcová, D.; Brožek, J.; Roda, J.; Polymer
2004, 45, 2141.
21. Kim, B. J.; White, J. L.; J. Appl. Polym. Sci. 2003, 88, 1429.
22. Fang, X.; Hutcheon, R.; Scola, D. A.; J. Polym. Sci., Part A:
Polym. Chem. 2000, 38, 1379.
23. Fang, X.; Simone, C. D.; Vaccaro, E.; Huang, S. J.; Scola, D. A.;
J. Polym. Sci., Part A: Polym. Chem. 2002, 40, 2264.
24. Rusu, G.; Rusu, E.; J. Optoelectron. Adv. M. 2007, 9, 958.
25. Rusu, G.; Ueda, K.; Rusu, E.; Rusu, M.; Polymer 2001, 42,
5669.
26. Rusu, G.; Rusu, E.; Mater. Des. 2010, 31, 4601.
27. Rusu, G.; Rusu, E.; High Perform. Polym. 2004, 16, 569.
28. Noda, N.; Lee, Y.-H. A.; Bur, J.; Prabhu, V. M.; Snyder, C. R.;
Roth, S. C.; McBrearty, M.; Polymer 2005, 46, 7201.
29. Penel-Pierron, L.; Depecker, C.; Seguela, R.; Lefebvre, J.-M.;
J. Polym. Sci., Part B: Polym. Phys. 2001, 39, 484.
30. Kohan, M. I.; Nylon Plastics, John Wiley & Sons: New York,
1973.
31. Loo, L. S.; Gleason, K. K.; Macromolecules 2003, 36, 6114.
32. Snyder, R. G.; Chen, L. X.-Q.; Srivatsavoy, V. J. P.; Strauss,
H. L.; Kubota, S.; J. Phys. Chem. 1995, 99, 2214.
33. Aharoni, S.; n-Nylons, John Wiley & Sons: New York, 1997.
34. Yeh, J.-L.; Kuo, J.-F.; Chen, C.-Y.; Mater. Chem. Phys. 1994,
37, 161.
35. Li, Y.; Yang, G.; J. Mater. Sci. 2010, 45, 987.
36. Rusu, G.; Rusu, E.; Int. J. Polym. Anal. Charact. 2011, 16, 561.
37. Budin, J.; Brozěk, J.; Roda, J.; Polymer 2006, 47, 140.
38. Ricco, L.; Russo, S.; Orefice, G.; Riva, F.; Macromol. Chem.
Phys. 2001, 202, 2114.
39. Udipi, K.; Dave, R. S.; Kruse, R. L.; Stebbins, L. R.; Polymer
1997, 38, 927.
40. Hassan, H. H. A. M.; Elhusseiny, A. F.; Sweyllam, A. M.;
J. Molec. Struct. 2011, 1001, 89.
41. Malinová, L.; Stolinová, M.; Lubasová, D.; Martinová, L.;
Brozěk, J.; Eur. Polym. J. 2013, 49, 3135.
42. Cheng, D.; Field and Wave Electromagnetics, 2nd ed., Addison-
Wesley: New York, 1989.
43. Mateva, R.; Filyanova, R.; Dimitrov, R.; Velichkova, R.; J. Appl.
Polym. Sci. 2004, 91, 3251.
44. Kalika, D. S.; Krishnaswamy, R. K.; Macromolecules 1993,
26, 4252.
45. Blithe, T.; Bloor, D.; Electrical Properties of Polymers,
Cambridge University Press: Cambridge, 2005.
46. Tsangaris, G. M.; Psarras, G. C.; Kouloumbi, N.; J. Mater. Sci.
1998, 33, 2027.
47. McCrum, N. G.; Read, B. E.; Williams, G.; Anelastic and
Dielectric Effects in Polymeric Solids, Wiley: New York, 1967.
48. Reddy Subba, Ch. V.; Han, X.; Zhu, Q.-Y.; Mai, L.-Q.; Chen, W.;
Microelectron. Eng. 2006, 83, 281.
49. Hanafy, T. A.; Adv. Mater. Phys. Chem. 2012, 2, 255.
50. Roy, A. K.; Prasad, K.; Prasad, A.; Process. Appl. Ceram. 2013,
7, 81.
51. Wagner, H.; Richert, R.; Polymer 1997, 38, 5801.
52. Siengchin, S.; Karger-Kocsis, J.; Psarras, G. C.; Thomann, R.;
J. Appl. Polym. Sci. 2008, 110, 1613.
53. Sauer, B. B.; Avakian, P.; Flexman, E. A.; Keating, M.; Hsiao,
B. S.; Verma, R. K.; J. Polym. Sci., Part B: Polym. Phys. 1997,
35, 2121.
54. Popli, R.; Mandelkern, L.; Polym. Bull. 1983, 9, 260.
55. Suljovrujic, E.; Micic, M.; Milicevic, D.; J. Eng. Fibers Fabr.
2013, 8, 131.
56. Pradhan, D. K.; Choudhary, R. N. P.; Samantaray, B. K.; Mater.
Chem. Phys. 2009, 115, 557.
57. Sengwa, R. J.; Sankhla, S.; Colloid Polym. Sci. 2007, 285, 1237.
58. Sengwa, R. J.; Choudhary, S.; eXPRESS Polym. Lett. 2010, 4, 559.
59. Sengwa, R. J.; Sankhla, S.; Choudhary, S.; Indian J. Pure Appl.
Phys. 2010, 48, 196.
Submitted on: August 29, 2014
Published online: December 5, 2014