globalization and gender equality in developing countries · globalization and gender equality in...
TRANSCRIPT
http://www.wiwi.uni-konstanz.de/workingpaperseries
U n i v e r s i t y o f K o n s t a n zD e p a r t m e n t o f E c o n o m i c s
Globalization and Gender Equality in
Developing Countries
Niklas Potrafke and Heinrich W. Ursprung
Working Paper Series 2011-33
Globalization and Gender Equality in Developing Countries
Niklas Potrafke∗
University of Konstanz
Heinrich W. Ursprung∗∗ University of Konstanz
12 September, 2011
Abstract
This study empirically assesses the influence of globalization on the institutional root causes of
gender equality as measured by the new OECD Social Institutions and Gender Index (SIGI). We
capture the multifaceted concept of globalization with the KOF index and its three sub-indices
which measure the economic, social and political dimensions of globalization. Observing the
progress of globalization for a sample of almost one hundred countries at ten year intervals
starting in 1970, we find that economic and social globalization exerted a decidedly positive
influence on the social institutions which underlie gender equality.
Keywords: globalization, gender equality, social institutions
JEL Classification: F57, O11, O57
∗ University of Konstanz, Department of Economics, Box 138, D-78457 Konstanz, Germany, Phone: + 49 7531 88 2137, Fax: + 49 7531 88 3130. Email: [email protected] ∗∗ University of Konstanz, Department of Economics, Box 138, D-78457 Konstanz, Germany, Phone: + 49 7531 88 2332, Fax: + 49 7531 88 3130. Email: [email protected] We thank the participants of the Workshop on Political Economy 2010 in Konstanz and the Verein für Socialpolitik Meetings 2011 in Frankfurt for helpful comments and suggestions. Felix Weber has provided excellent research assistance.
1
1. Introduction
The literature dealing with the influence of globalization on economic wellbeing is well
established and extensive. It encompasses studies on globalization-induced economic
growth, on distributional effects across developed and developing countries, as well as
studies on the within-country distribution across workers of different skill-levels and
workers in different industries (e.g., Marjit et al. 2004). Research investigating the effects
of globalization on gender equality is, in contrast, only about to emerge as an independent
strand of the globalization literature. This neglect is surprising since the issue of gender
equality has for a long time played an important role in the political discourse, especially
among the discontents of globalization who, for example, claim that “women and other
marginalized communities have suffered disproportionately from free trade agreements”
and call on their followers to act using slogans such as “Women unite in the global fight!”1
The political discourse on gender equality by nature heavily draws on some very
specific aspects of the undisputed dark side of (international) labor markets such as forced
labor, child labor, and the international trafficking of women.2 Recent economic studies on
the relationship between globalization and gender equality, in contrast, mainly focus on the
gender wage gap and women’s employment opportunities. The seminal study by Boserup
(1970) marks the beginning of this literature. From a naive theoretical viewpoint the
relationship between deepening globalization and the gender wage gap in developing
countries appears to be clear-cut. Since global competition restricts gender-based employer
discrimination, the gender wage gap will become smaller (cf. Becker, 1957). The
traditional Stolper-Samuelsson effect works in the same direction: developing countries
have a comparative advantage in the production of goods which are intensive in low-skilled
1
Women & the economy, UNPAC - UN Platform for Action Committee Manitoba: http://www.unpac.ca/economy/introglob.html. 2
An economic analysis of the deprivation of sexually exploited trafficked women is to be found in Di Tommaso et al. (2009).
2
labor, implying that the female workers, who have, as a rule, a relatively poor education,
stand to gain.
In a world characterized by heterogeneous labor, the coarseness of a comparative
advantage argument based on a simple two factor Heckscher-Ohlin model is however not
able to disentangle all redistribution effects that are triggered by global economic
integration. The standard argument does, in particular, not consider that globalization gives
rise to a transfer of technology to low-wage countries with the consequence that highly
skilled workers (i.e. mainly men) in the low-wage countries will benefit from the
technology transfer more than they lose via the increase in imports of sophisticated
merchandise and services (Acemoglu, 1998). Empirical evidence supporting this effect has
been documented, for example, by Feenstra and Hanson (1997) who analyze the impact of
foreign direct investments on the skilled labor share of wages in Mexico over 1975-1988.
Women, moreover, mainly work in the agricultural sector which in most developing
countries does not play a major role in international trade; female agricultural labor thus
hardly derives any profit from international trade. Some scholars, finally, even claim that in
several developing countries gender inequalities in the labor market have been used as a
strategic instrument to procuring advantages in international competition (cf., for example,
Cagatay and Ertürk, 2004). These interpretations do however not match well with the
literature that analyzes how multinational enterprises select countries to host their foreign
direct investments. Here the evidence rather favors the view that potential host countries
with a decent human rights record and small gender disparities have an advantage in
attracting FDI (cf. Harms and Ursprung, 2002; Busse and Hefeker, 2007, Busse and
Nunnenkamp, 2009).
The nexus between the gender wage gap and globalization is clearly a complex one with
mutually contradictory channels of influence. The issue is furthermore exacerbated because
empirical studies have to work with rather unreliable data on raw and residual gender wage
3
gaps. In many countries gender-specific wage data is simply not available, implying that
cross-country studies stand on shaky grounds. The empirical literature is therefore far from
being conclusive. A new promising approach has recently been introduced by Oostendorp
(2009) who analyzes within-occupation wage gaps and finds that in richer countries the
occupational gender wage gap varies negatively with increasing economic development,
FDI penetration, and foreign trade, but finds little evidence for a reduction of the gap in
poor countries. Women’s employment opportunities in these poor countries, on the other
hand, appear to have improved in the course of globalization (cf. Ozler, 2000) and may
even have shifted the household bargaining power in favor of women (cf. Aguayo-Tellez et
al., 2010).
Because of the rather dire state of international wage data sets, many scholars have
settled for a research strategy that focuses on other links between globalization and the
status of women. Schultz (2007), for example, appraises the potential productivity of men
and women (and thereby, in an indirect manner, the gender wage gap) by gender-specific
human capital which, in turn, is determined by the schooling record and health status of
men and women. These indicators are, of course, also proxies for general wellbeing.
Analyzing a cross-section of 70 countries observed at five year intervals between 1960 and
1980, Schultz finds that liberalization of trade is linked to greater accumulation of human
capital and increased gender equality.3 In a similar vein, Neumayer and de Soysa (2007)
argue that the female employment share in the labor force and the gender wage gap are not
ideal measures for gender-related aspects of employment since there are many other forms
of discrimination. They employ instead measures of women’s labor rights (right to work,
hiring and promotion practices, freedom of choice of profession, etc.) and forced labor and
find in a global sample of countries and a sub-sample of developing countries that countries
3
The causal relationship running from gender equality in education to economic growth is analyzed in Abu-Ghaida and Klasen (2004). These authors estimate that countries which do not meet the Millennium Summit by 2005 goals will suffer a 0.1-0.3 percentage point lower per capita growth rate.
4
which are more open to trade and enjoy a higher penetration by foreign direct investments
have better labor rights for women and exhibit a lower incidence of forced labor. Richards
and Gelleny (2007) investigate the influence of economic globalization on women’s status.
Their dataset contains 130 countries over the 1982-2003 period. Women’s status is
measured by five indicators: the Gender-related Devolopment Index (GDI), the Gender
Empowerment Measure (GEM), and the CIRI economic, political and social rights
indicator (Cingranelli and Richards 2005). Economic globalization is measured by foreign
direct investment, trade openness, portfolio investment and structural adjustment policy
implementation (IMF and World Bank). The results show that especially trade openness
had a positive influence on the status of women. The human rights data by Cingranelli and
Richards have been used in other empirical studies: Neumayer and de Soysa (2011) show,
for example, that trade and investment linkages influenced empowerment of women over
the 1981-2007 period. Globalization is modeled by trade and FDI spatially weighted
variables. Spill-over effects via trade links improved women’s economic and social rights
in middle and high income countries, but not in low income countries. Spill-over effects via
FDI links only improved economic rights in middle income countries. Cho (2011) shows
that especially social aspects of globalization as measured by information flows, personal
contact and cultural proximity positively influenced women’s rights over the 1981-2008
period. Cultural proximity also mitigated son preference problems by women in developing
countries and more personal contact decreased human trafficking. The results by Dreher et
al (2011) show that especially social globalization as measured by the KOF index of social
globalization increased empowerment rights over the 1981-2004 period.
Our study follows a similar strategy. We do not attempt to identify globalization induced
effects on the gender wage gap directly but rather investigate how globalization impacts on
women’s relative status as measured by a composite indicator capturing institutional
arrangements that are liable to influences, among other things, the labor market prospects
5
of women. We thus do not use one or two specific aspects of relative welfare such as
education or health, nor do we focus entirely on labor market rights; our indicator of gender
equality is rather supposed to capture all aspects constituting the institutional environment
that governs women’s choice options. For that purpose we use the new Social Institutions
and Gender Index (SIGI) compiled by the OECD (cf. Branisa, Klasen and Ziegler, 2009a).4
In this respect our research strategy is closely related to some recent studies that used the
SIGI as an explanatory variable to investigate the influence of gender inequality on socio-
economic outcomes. Branisa et al. (2009b) examine, for example, how institutions
fostering gender equality (as measured by the SIGI) have influenced female secondary
schooling, fertility rates, child mortality, and governance (rule of law, voice, and
accountability). The results presented by Jüttig et al. (2010) show that these institutions
have also influenced labor market outcomes in developing countries: women’s labor
market participation, the quality of their jobs, and their working conditions vary positively
with gender equality as measured by the SIGI. These results are of course vitally important
for development economics because they show that gender equality in education, health,
employment, et cetera – whether these aspects of gender equality are spurred by
globalization or not – increase economic growth (e.g., Dollar and Gatti 1999, Klasen 2002,
Knowles et al. 2002, Klasen and Lamanna 2009).
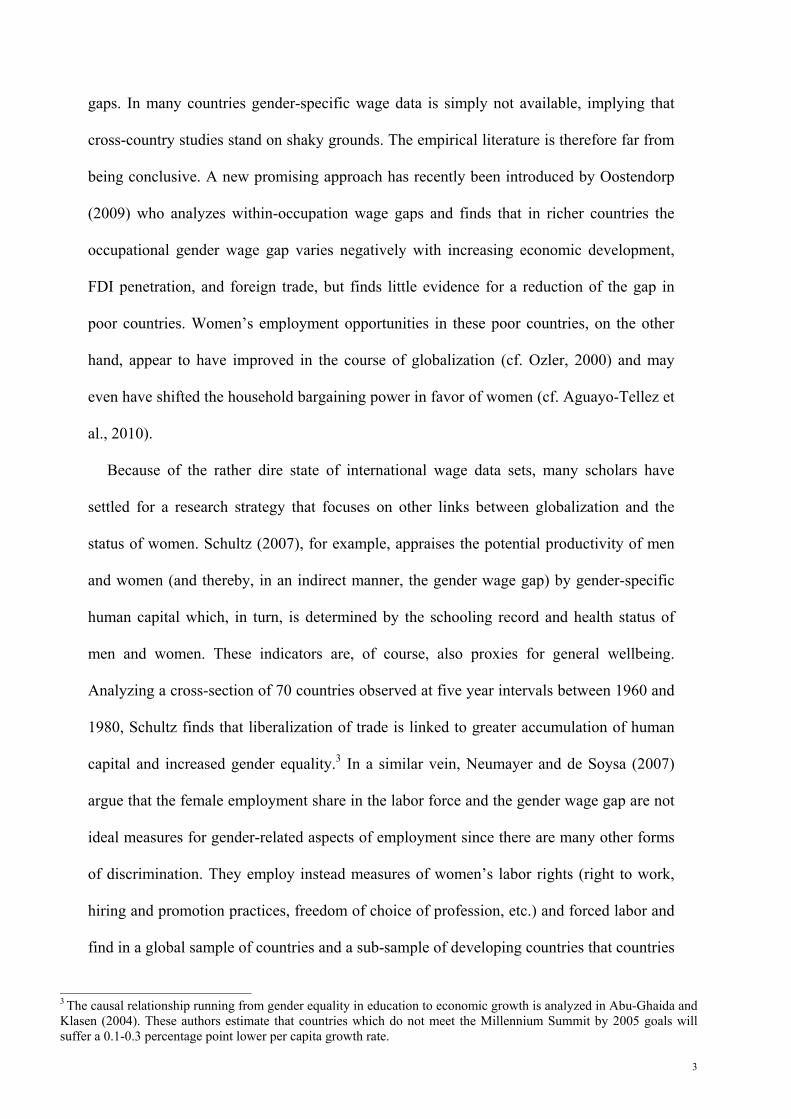
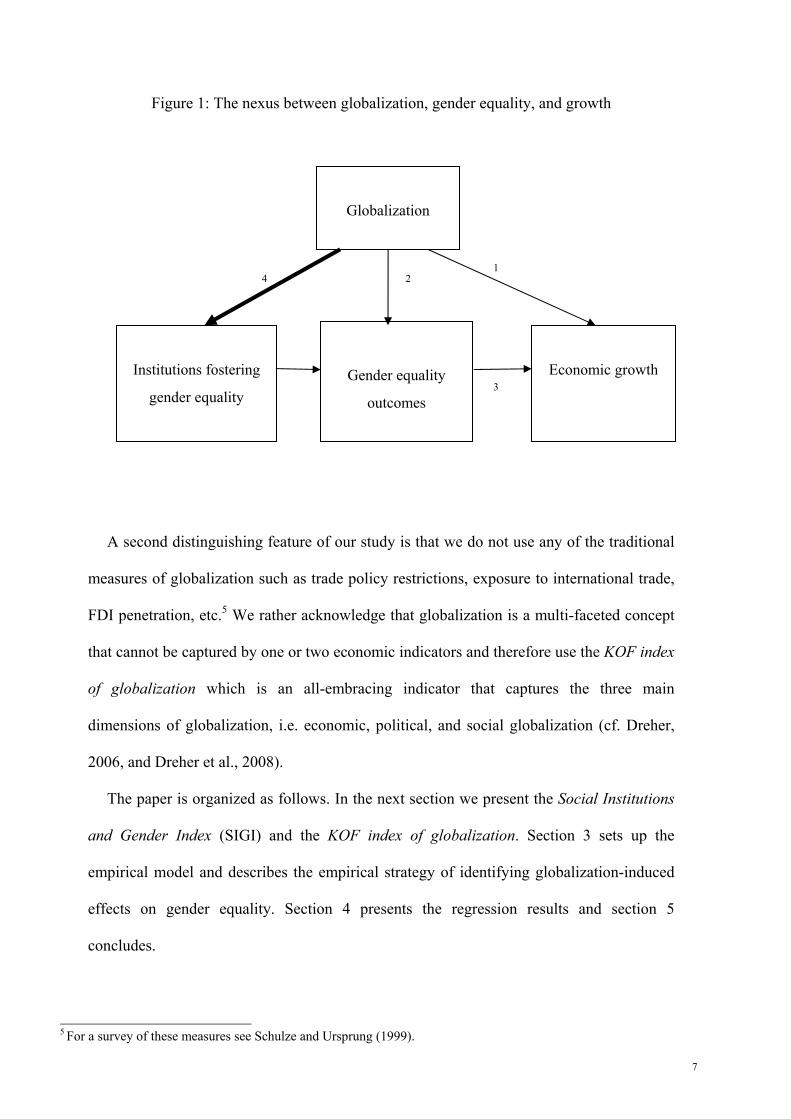
Figure 1 illustrates our contribution by summarizing the four strands of the empirical
literature dealing with the globalization-growth nexus. The traditional macro view (arrow
1) focuses on the overall gains from global economic integration (trade and factor market
liberalization) but implicitly subsumes in the estimated growth effects the contribution that
accrues from the globalization-induced increase in gender equality. The literature primarily
concerned with the globalization-induced changes in the socio-economic status of women
is represented by arrow 2 and the recent literature that relates gender equality outcomes
4 For a critique of the well known UNDP gender-related indices see Bardhan and Klasen, (1999).
6
with economic performance by arrow 3. Our research focuses on how globalization impacts
on the design of institutions that influence in turn gender equality outcomes in the long run
(arrow 4), the idea being that it is the institutional setup that gives rise to sustainable
progress in actually observed gender equality and thereby to economic development. The
advantage of our research strategy as compared to the more traditional approach that
directly relates globalization to gender equality outcomes is that the investigated channels
of influence are less likely to be obfuscated by problems of reverse causality. Since
institutional change is subject to a great deal of inertia, a strong cross-country relationship
between institutional design and the rather volatile indicators of global integration lends
credibility to the interpretation that it is indeed the institutions that (slowly) adjust to the
ever-changing socio-economic environment and not vice versa. We do, of course, back up
our conclusions with respect to causality by exploiting the time-series dimension which is
however only available for our explaining variables. Up to now the SIGI is, unfortunately,
only available for one point of time.
7
Figure 1: The nexus between globalization, gender equality, and growth
A second distinguishing feature of our study is that we do not use any of the traditional
measures of globalization such as trade policy restrictions, exposure to international trade,
FDI penetration, etc.5 We rather acknowledge that globalization is a multi-faceted concept
that cannot be captured by one or two economic indicators and therefore use the KOF index
of globalization which is an all-embracing indicator that captures the three main
dimensions of globalization, i.e. economic, political, and social globalization (cf. Dreher,
2006, and Dreher et al., 2008).
The paper is organized as follows. In the next section we present the Social Institutions
and Gender Index (SIGI) and the KOF index of globalization. Section 3 sets up the
empirical model and describes the empirical strategy of identifying globalization-induced
effects on gender equality. Section 4 presents the regression results and section 5
concludes.
5
For a survey of these measures see Schulze and Ursprung (1999).
4
3
2 1
Globalization
Institutions fostering
gender equality
Gender equality
outcomes
Economic growth
8
2. Data: Gender equality and globalization
2.1 The Social Institutions and Gender Index
To measure gender equality we use the recently published Social Institutions and Gender
Index (SIGI) that provides data for about 120 developing countries. The focus of this index
is on social institutions related to gender equality. It is therefore ideally suited for our
strategy of identifying the influence of globalization on the formal and informal norms of
behavior which shape gender roles and women’s opportunities in social life.
The SIGI is based on twelve institutional variables compiled in the OECD
Gender, Institutions and Development database (cf. Branisa et al., 2009a) and roughly
refers to the year 2000. With the help of these twelve variables, five sub-indices are
constructed: family code, civil liberties, physical integrity, son preference, and ownership
rights. The family code sub-index measures women’s decision-making power at home and
encompasses the variables parental authority, inheritance, early marriage, and polygamy.
The civil liberties sub-index measures the women’s opportunity to engage in social
participation and is based on the two variables freedom of movement and freedom of dress.
Physical integrity is associated with the variables violence against women, female genital
mutilation, and missing women. Son preference is portrayed by a single variable and
ownership rights are measured by access to land, access to other property, and access to
bank loans. These five dimensions of social institutions are then aggregated by computing
the average of the squares of the sub-indices which range from 0 (no inequality) to 1
(complete inequality). Taking the squares of the sub-indices takes into account, first, that
the denial of opportunities is associated with increasing marginal deprivation and, second,
that high inequality in one dimension is not compensated by high equality in another
dimension. We employ in our econometric model the reverse of the SIGI (i.e. 1 – SIGI)
which ranges from 0 (complete inequality) to 1 (equality) simply in order to associate
positive coefficients with a positive influence of globalization on gender equality.
9
The composite Social Institutions and Gender Index (SIGI) thus represents a broad
measure of how severely women are institutionally constrained in their social lives. In
other words, the SIGI is a measure of deprivation that captures one of the primary causes of
gender inequality; it is not a measure of gender inequality in outcomes. This is why this
index lends itself to be used in a study that attempts to uncover the long-run impact of
globalization on gender equality. To be sure, the institutional foundations that constrain
social behavior may not be directly linked to international economic integration. But then
globalization is not merely an economic phenomenon. International integration also has
very conspicuous political and social dimensions, and it is quite evident that these
dimensions - which may well be connected to the economic dimension in intricate ways -
are directly linked to changes in formal and informal norms of social behavior. It is one of
the objectives of this study to disentangle the channels of influence that connect
progressing globalization with the evolution of gender equality.
2.2 The KOF index of globalization
We measure globalization with the help of the KOF index since this index explicitly
acknowledges that globalization is a multi-faceted concept that cannot be entirely captured
by a single “representative” economic indicator such as international trade as a share of
GDP, the volume or stock of received foreign direct investments per capita, or the severity
of capital account restrictions. The KOF index (cf. Dreher, 2006, and Dreher et al., 2008)
represents an attempt to measure globalization in the broad sense that has been accepted in
the recent empirical literature. It now covers 208 countries, includes 24 variables, and
portrays the economic, social and political dimensions of globalization. Each of these three
dimensions is composed of further sub-dimensions. For example, economic globalization is
measured by actual flows and stocks (trade, foreign direct investments, portfolio
investments, and income payments to foreign nationals, each measured as a percentage of
10
GDP) and restrictions (mean tariff rates, hidden import barriers, taxes on international
trade, and capital account restrictions). Social globalization covers, among others, items
such as international tourism, the number of internet hosts and users, as well as the number
of McDonald’s restaurants and IKEA shops (per capita). Political globalization is measured
by the number of foreign embassies, membership in international organizations, and the
participation in U.N. Security Council missions (see Dreher et al., 2008, 43-44, for further
details). In this study, we use the updated 2010 KOF index of globalization which measures
globalization on a scale of 1 to 100, where higher values represent higher levels of
globalization.6
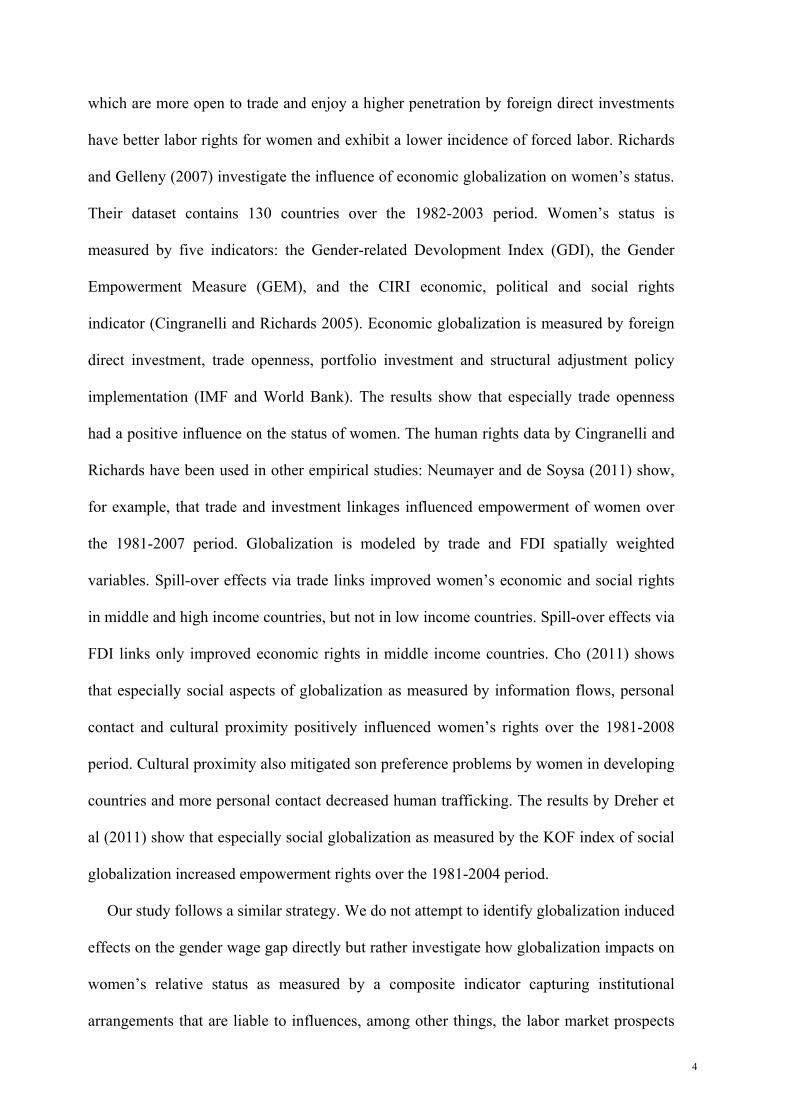
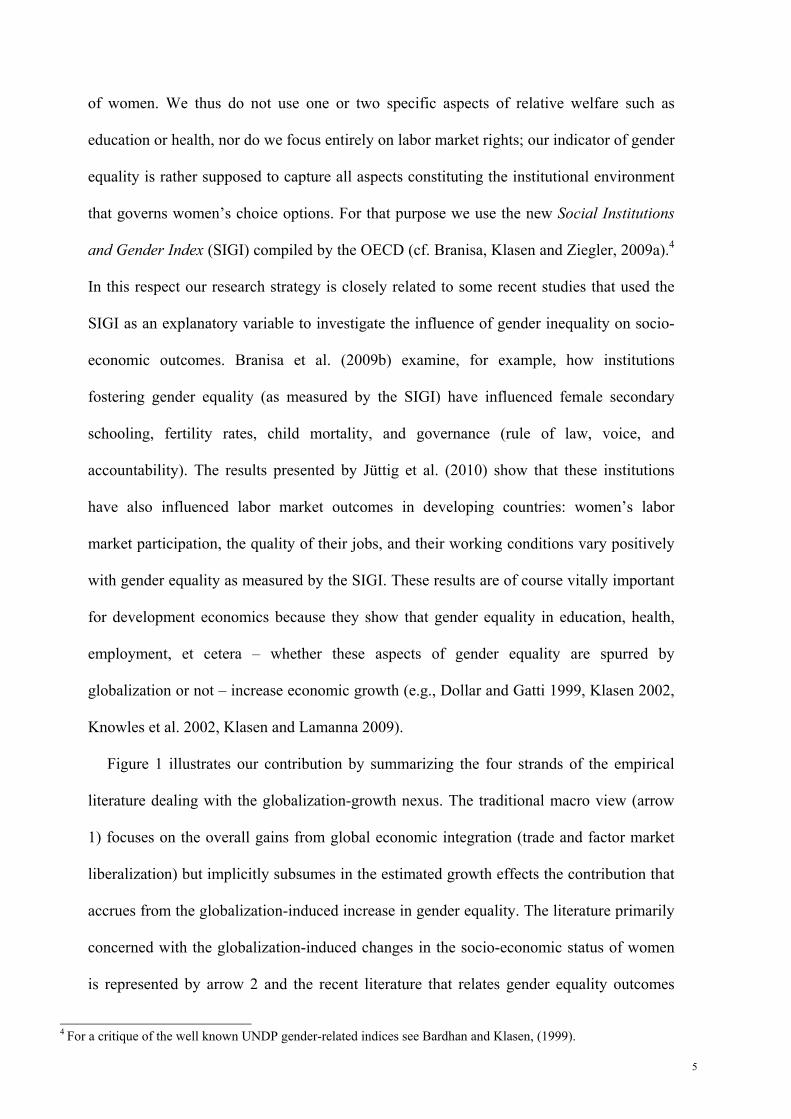
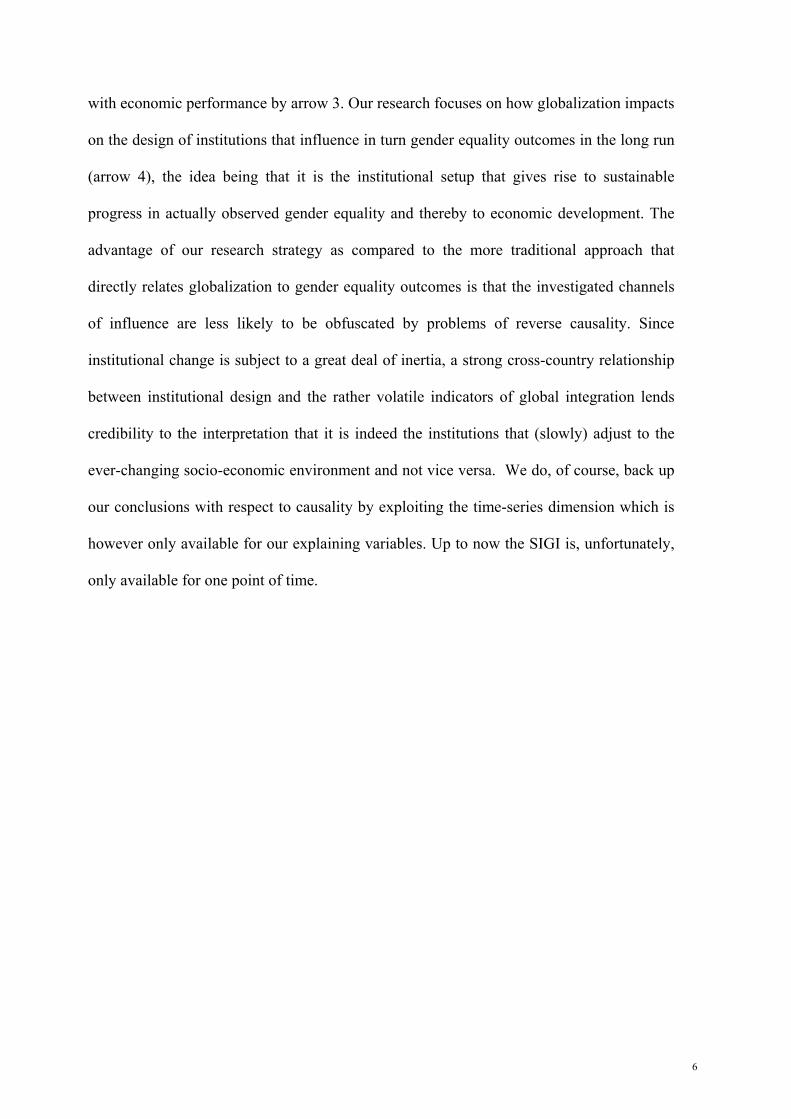
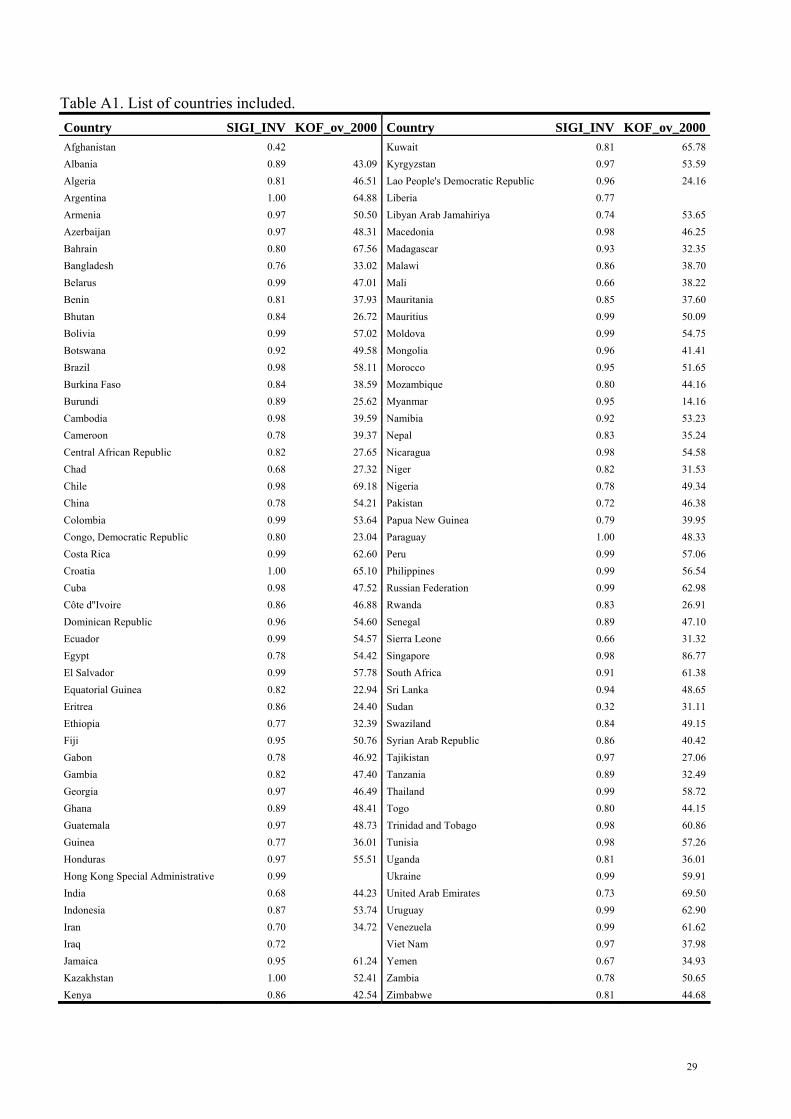
2.3 Correlation between the reversed SIGI and the KOF indices of globalization
To illustrate the association between globalization and gender equality, we present
correlations between gender equality as measured by the reversed SIGI (overall) and the
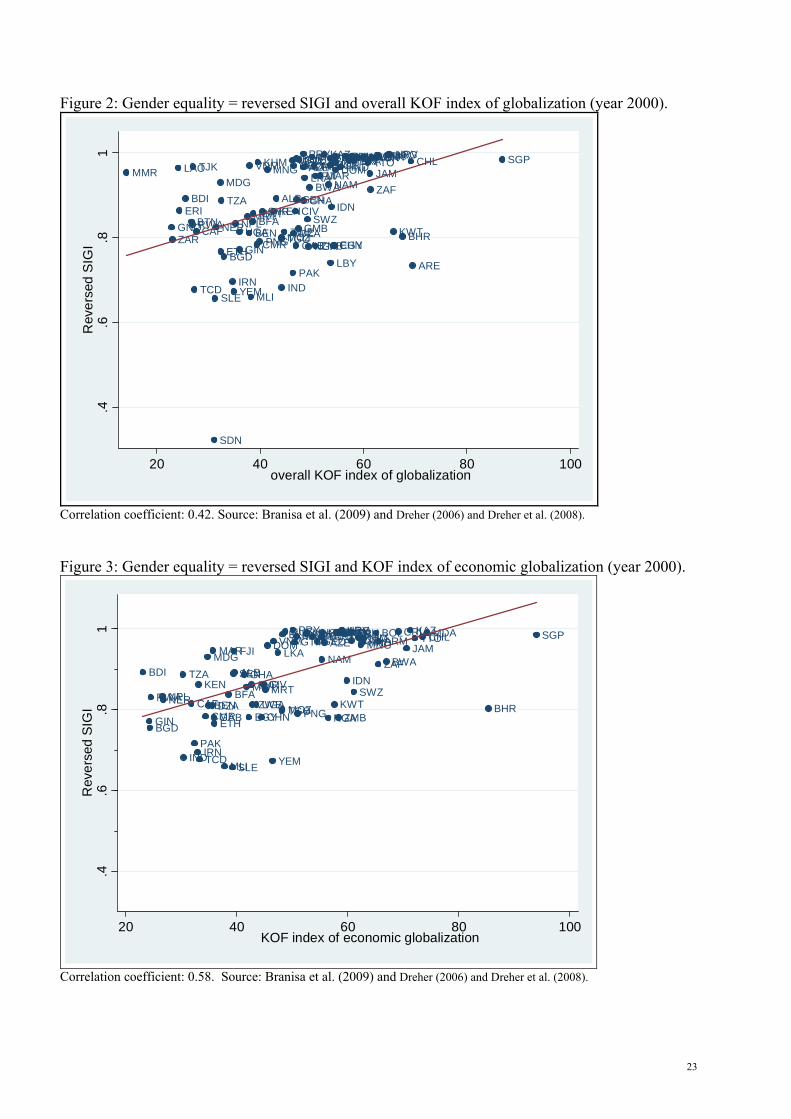
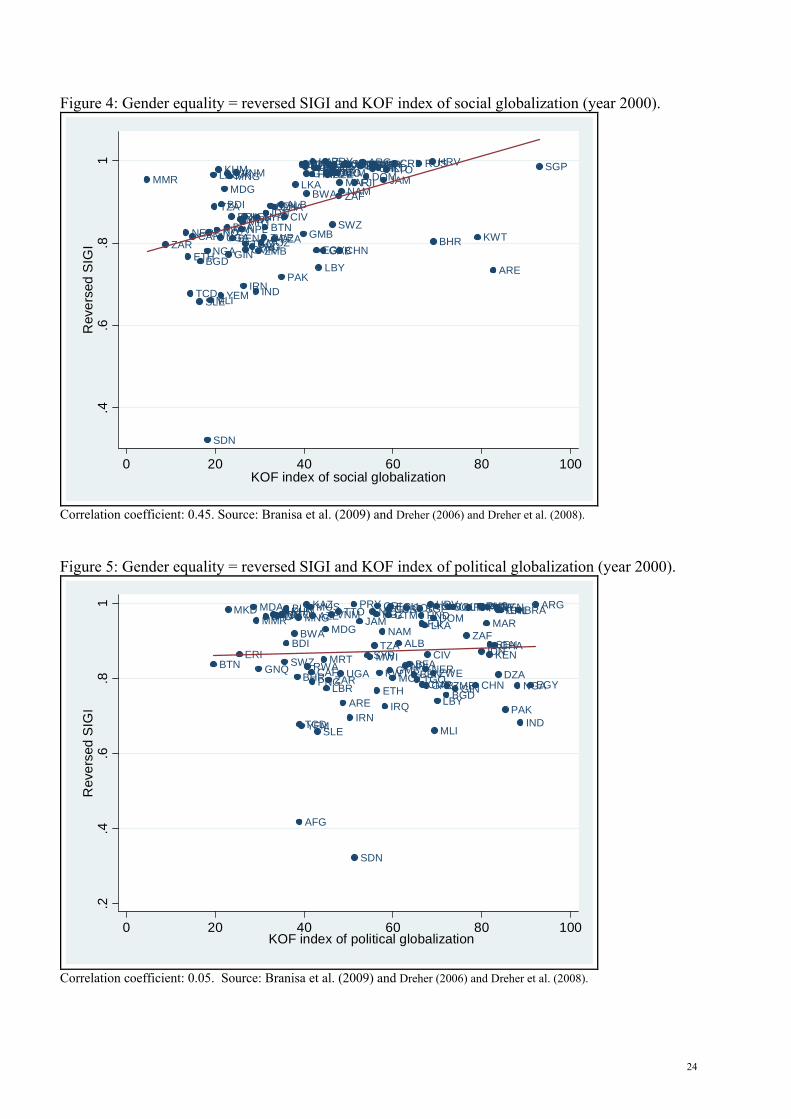
KOF globalization indices. Figure 3 suggests that overall globalization is positively
associated with gender equality. The correlation coefficient between the overall KOF index
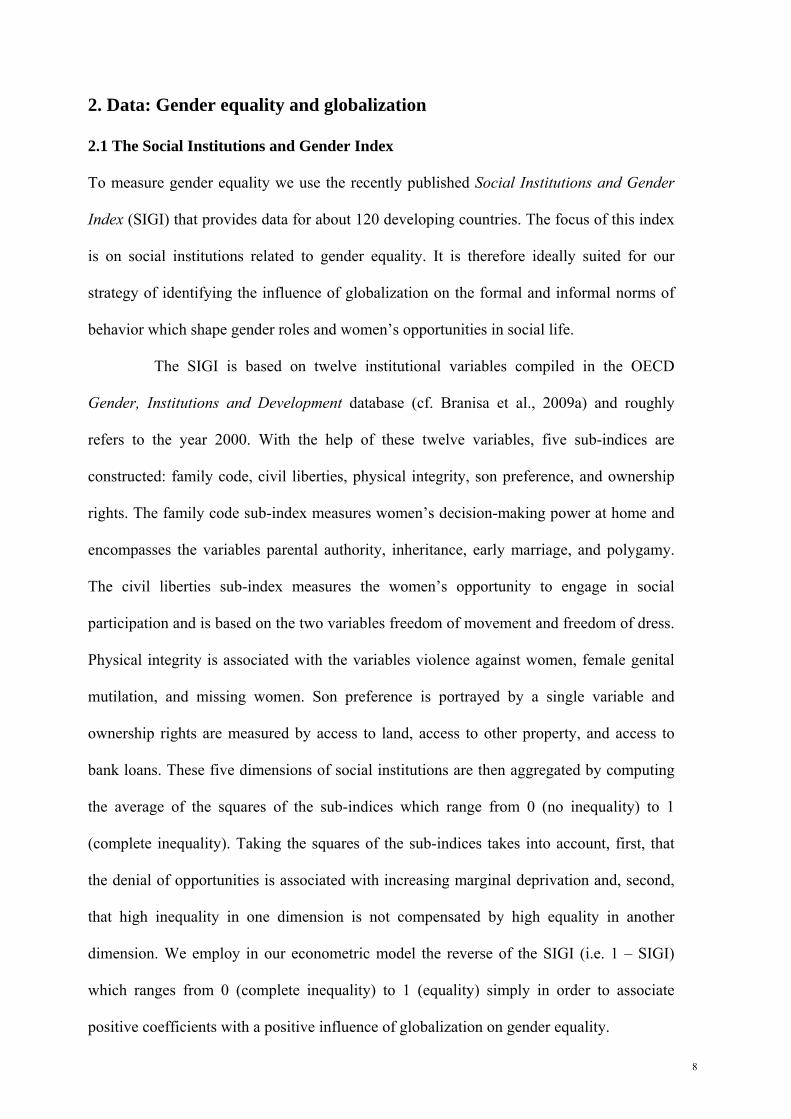
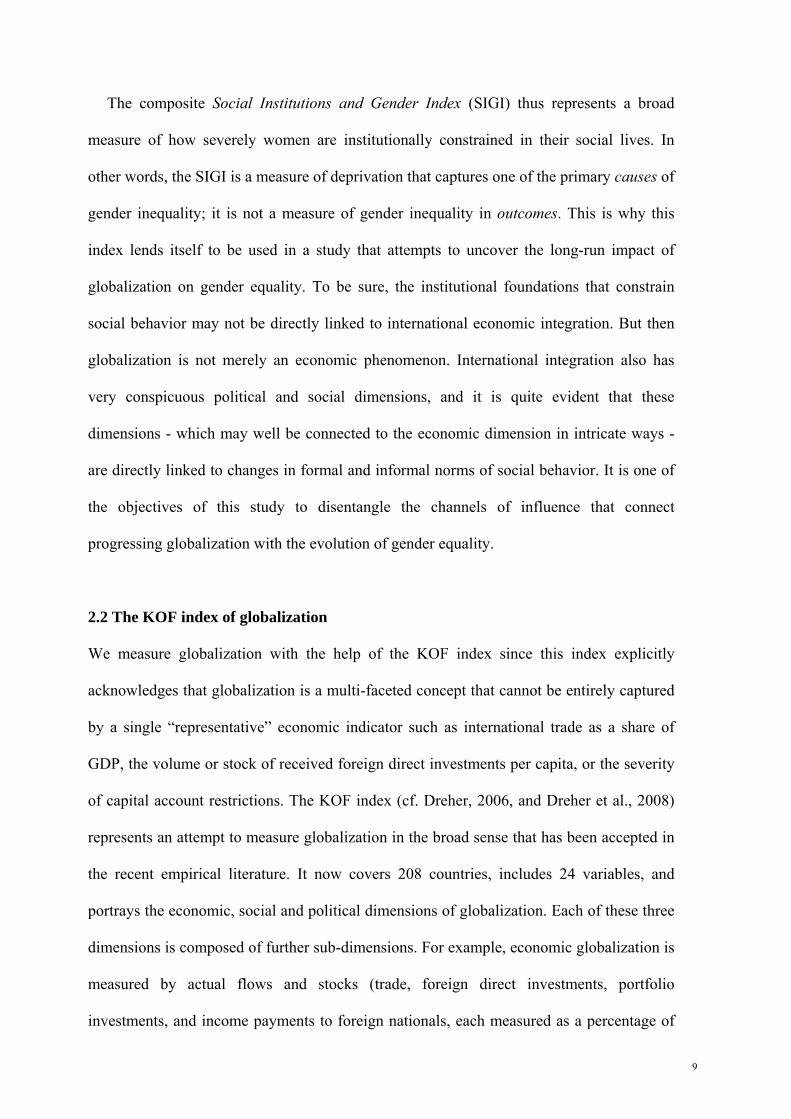
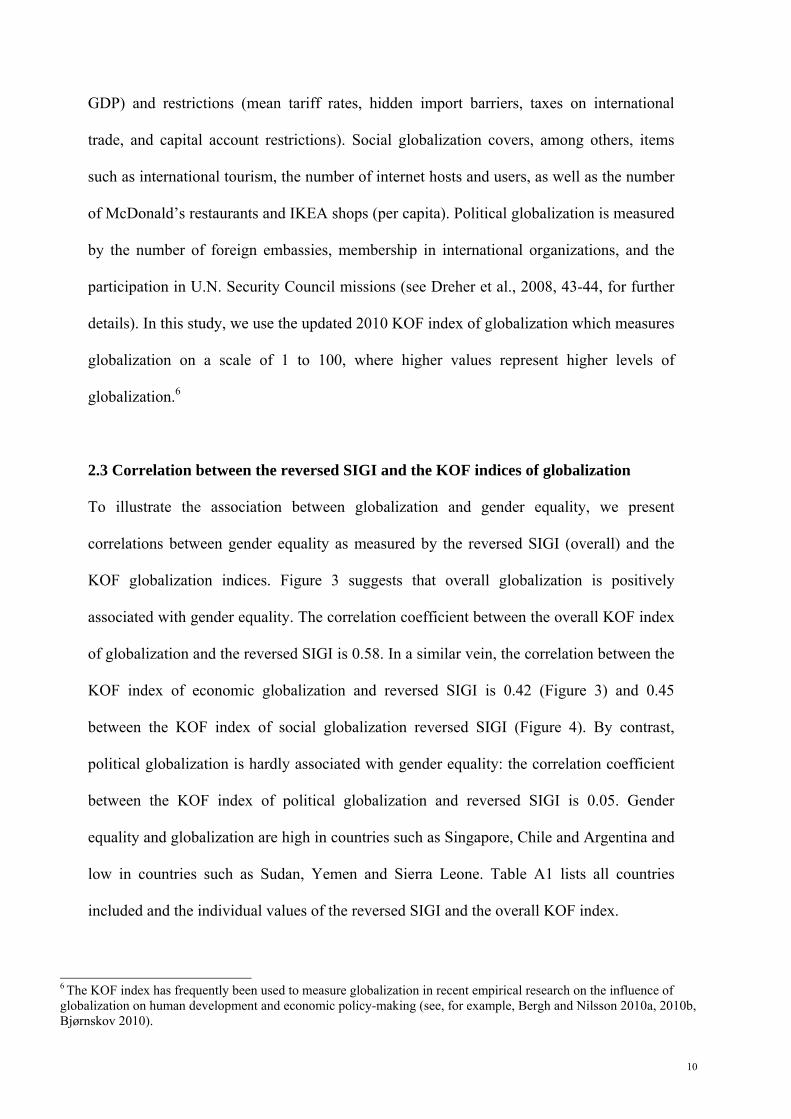
of globalization and the reversed SIGI is 0.58. In a similar vein, the correlation between the
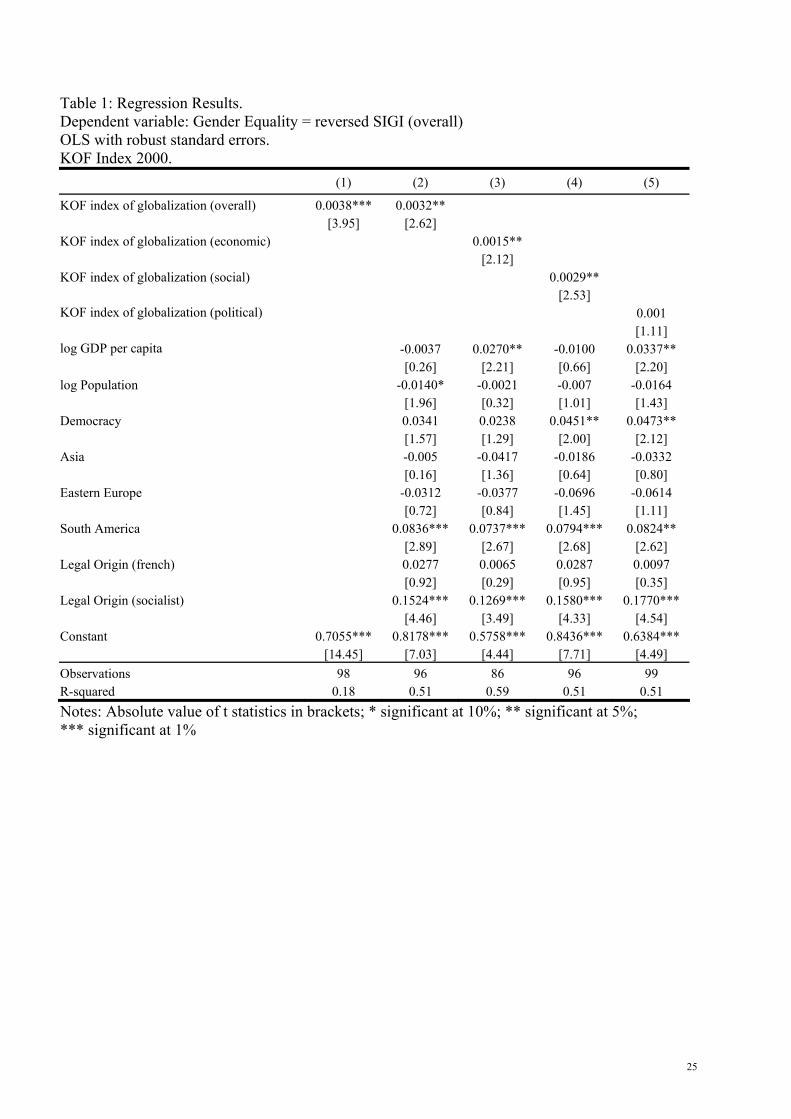
KOF index of economic globalization and reversed SIGI is 0.42 (Figure 3) and 0.45
between the KOF index of social globalization reversed SIGI (Figure 4). By contrast,
political globalization is hardly associated with gender equality: the correlation coefficient
between the KOF index of political globalization and reversed SIGI is 0.05. Gender
equality and globalization are high in countries such as Singapore, Chile and Argentina and
low in countries such as Sudan, Yemen and Sierra Leone. Table A1 lists all countries
included and the individual values of the reversed SIGI and the overall KOF index.
6
The KOF index has frequently been used to measure globalization in recent empirical research on the influence of globalization on human development and economic policy-making (see, for example, Bergh and Nilsson 2010a, 2010b, Bjørnskov 2010).
11
3. The empirical model
The basic econometric model has the following form:
Gender Equalityi = αj Globalizationij + Σk ζk xik +Σl δl Regionil +Σm γm Legal Originim + ui
with i = 1,...,99; j=1,..,4; k=1,...,3; l=1,...,4;m=1,...,3. (1)
The dependent variable Gender Equalityi associates gender equality in country i with the
value [ ]1 0,1iSIGI− ∈ ; values of this reversed SIGI index close to unity thus indicate high
gender equality. Globalizationij denotes the jth dimension of the KOF globalization index
(overall, economic, social, and political dimension). In our base-line specification, we use
the KOF globalization indices for the year 2000 and expect a positive influence of the four
dimensions of globalization on gender equality. The vector xi contains our political-
economic control variables. We include the logarithm of real GDP per capita and the
logarithm of total population – both for the year 2000. We also include the Democracy-
Dictatorship dummy variable by Cheibub et al. (2010) for the year 2000. The Democracy-
Dictatorship variable distinguishes between regimes in which executive and legislative
offices are allocated in contested elections and those regimes in which this is not the case.
The variable assumes the value one for democracies and zero otherwise.7 Regionil are
regional dummy variables assuming the value one if country i belongs to region l and zero
otherwise. We distinguish between four different regions: Africa, Asia, Eastern Europe and
South America. To avoid perfect collinearity between the region dummies, one of the
region dummies serves as the reference category (here Africa). The estimated effects of the
other region dummies can then be interpreted as deviations from the reference category.
Legal Originim are legal origin dummy variables (La Porta et al. 1999). We distinguish
7
See Cheibub et al. (2010) for a more encompassing discussion on classifying democracies and dictatorships. The more traditional measures of democracy are the POLITY IV and the Freedom House indices. These indices have, however, been criticized on several grounds (Munk and Verkuilen 2002, Vreeland 2008, Cheibub et al. 2010).
12
between three different legal origins: British, French and Socialist.8 Our reference category
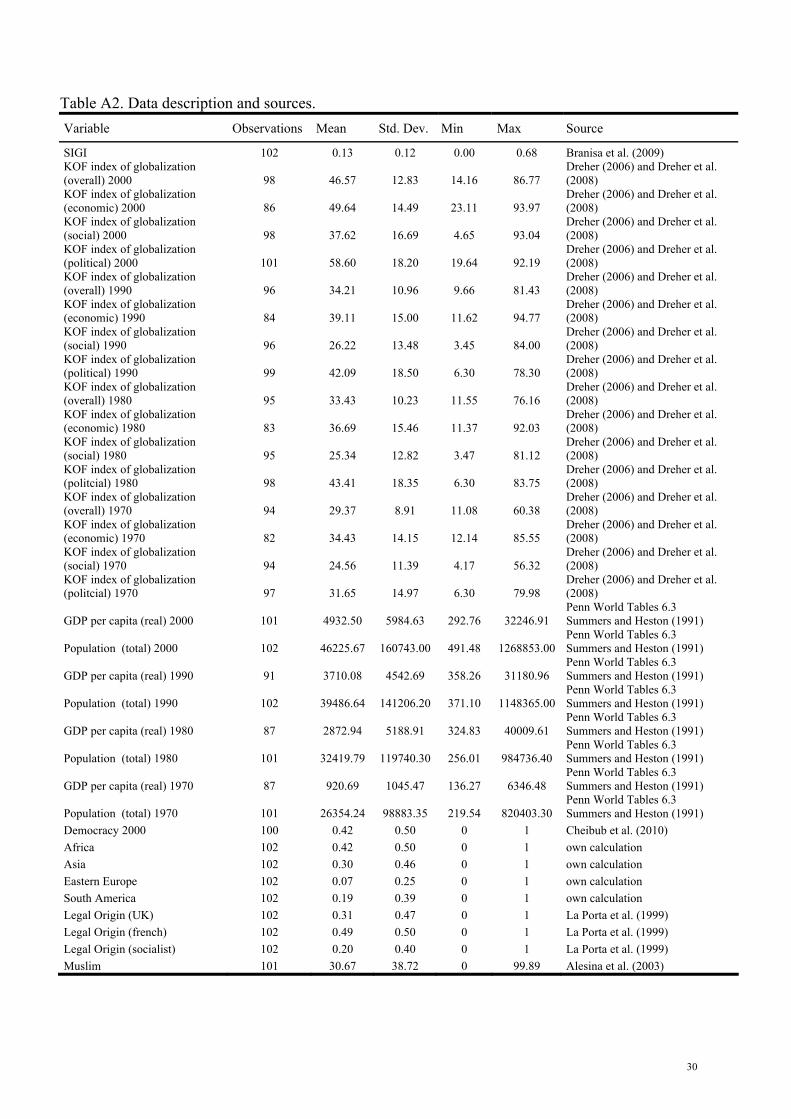
is British legal origin. Table A2 shows descriptive statistics of all variables.
We estimate the model with ordinary least squares (OLS) and robust standard errors.
4. Results
4.1 Basic results
Table 1 shows our base-line regression results. The control variables display the expected
signs and are statistically significant in several cases. Per capita income is statistically
significant at the 5% level in columns (3) and (5) and has in these estimates a positive sign.
The numerical meaning of the estimated coefficients is that when GDP per capita increases
by 1%, the reversed SIGI increases by about 0.03 points. Higher income is thus associated
with more subsequent gender equality. Population size is statistically significant at the 5%
level in column (1) and has a negative sign. This estimate indicates that gender equality as
measured by the reversed SIGI is in a given country by 0.1 points higher than in an
otherwise similar country if it has a 10% smaller population.9 The democracy variable has
the expected positive sign and is statistically significant at the 5% level in columns (4) and
(5) and indicates that the reversed SIGI is about 0.05 points higher in democracies than in
dictatorships. The estimates of the regional dummy variables for Asia and Eastern Europe
do not turn out to be statistically significant, while South American countries have a higher
level of gender equality than Africa; this effect is statistically significant at the 1% level (at
the 5% level in column 5). The coefficients of the socialist legal origin variable are
statistically significant at the 1% level and indicate that gender equality is higher in
countries with a socialist legacy as compared to countries with a British legal origin. The
French legal origin variable does not turn out to be statistically significant. 8
We have no countries with Scandinavian and German legal origin in our sample. 9
This effect is numerically quite big and entirely driven by China and India which have extremely high populations and rather little gender equality. When excluding China and India the coefficient of the logarithm of total population does not turn out to be significantly different from zero.
13
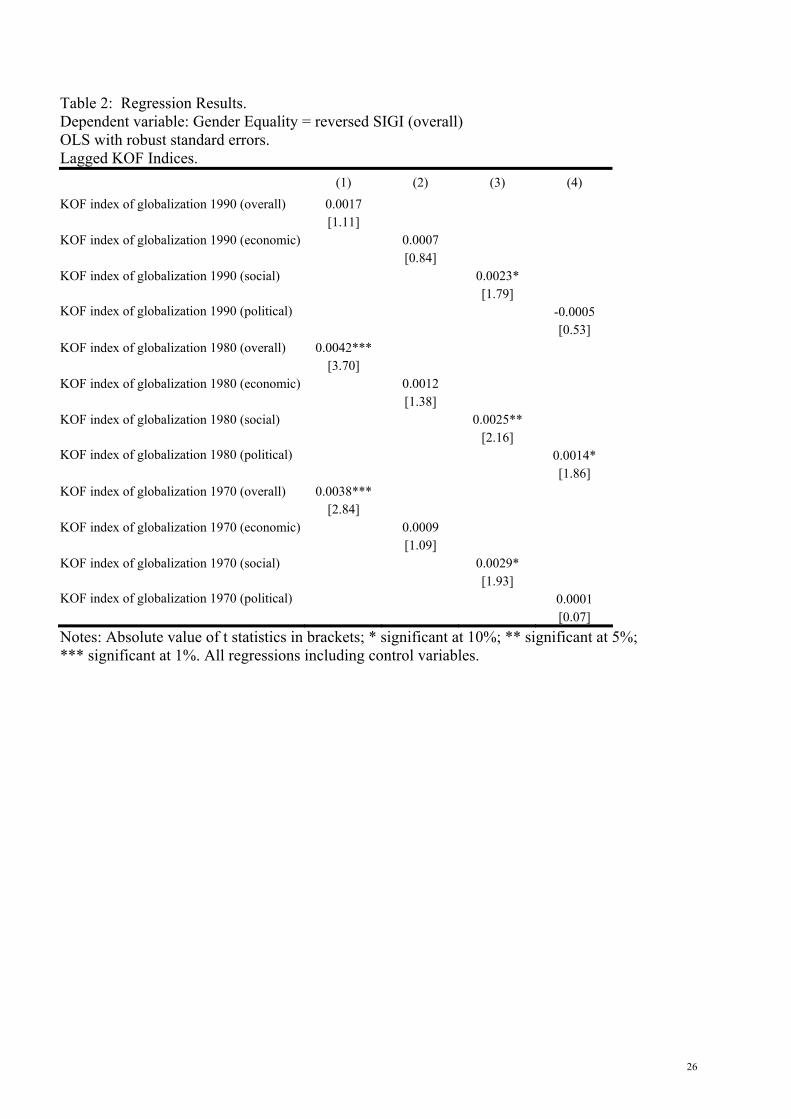
Most importantly, the results reported in Table 1 show that globalization has had a
positive influence on gender equality. The coefficients of the overall KOF index of
globalization (for the year 2000) are statistically significant at the 1% level in column (1)
and at the 5% level in column (2) and indicate that gender equality as measured by the
reversed SIGI increases by about 0.0035 points if the overall KOF index of globalization
increases by one point. Against the background of the standard deviation of 12.83 of the
overall KOF index this is a numerically substantial effect: when the overall KOF index
increases by one standard deviation, the reversed SIGI increases by about 0.045 points. The
KOF indices of economic and social globalization (columns 3 and 4) are statistically
significant at the 5% level and indicate that gender inequality as measured by the reversed
SIGI increases by about 0.0015 points if the KOF index of economic globalization
increases by one point and by about 0.0029 points if the KOF index of social globalization
increases by one point. That is, when the KOF index of economic globalization increases
by one standard deviation (14.49 points), the reversed SIGI increases by about 0.022 points
and when the KOF index of social globalization increases by one standard deviation (16.69
points), the reversed SIGI increases by about 0.048 points. The KOF index of political
globalization (column 5) does not turn out to be statistically significant. The results thus
lend credibility to our hypothesis that social globalization is an important driving force of
gender equality.
Following up this conjecture, we use the fact the influence of globalization on gender
equality is likely to take time. We therefore replaced the four KOF indices of globalization
referring to the year 2000 by the three KOF indices of globalization for the years 1990,
1980 and 1970. Table 2 shows the results (we do not report the results of the control
variables)10. The influence of the overall KOF index of globalization on gender equality
10
We have used the logarithm of real GDP per capita and population for the years 1990, 1980 and 1970 as control variables. The democracy variable is not available for a battery of developing countries before 1991 and we have
14
(column 1) is positive and statistically significant at the 1% level for the years 1970 and
1980) but is not statistically significant for the year 1990. The KOF index of economic
globalization does not turn out to be statistically significant. The KOF index of social
globalization is statistically significant at the 10% level for the years 1990 and 1970 and at
the 5% level for the year 1980. The KOF index of political globalization, finally, is
statistically significant at the 5% level for the year 1980 but does not turn out to be
statistically significant for the years 1990 and 1970. These results again indicate that social
globalization has been the driving force of gender equality. Moreover, it transpires that the
whole build-up of economic and social global integration over the last forty years has had a
positive influence on the contemporary relative status of women.
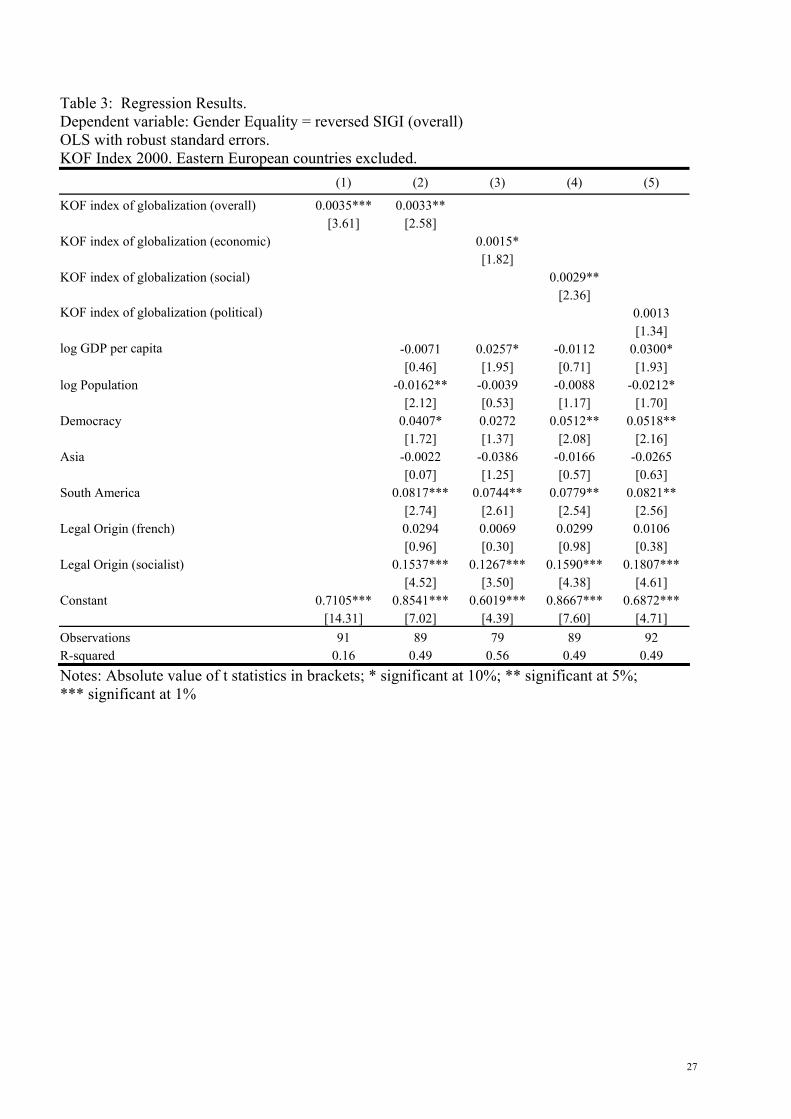
4.2 Robustness checks
We have checked the robustness of our results in several ways. Gender equality has been
very pronounced in the socialist countries. We therefore excluded all Eastern European
countries because their socialist past might bias our estimates. The results reported in Table
3 suggest however that excluding the Eastern European countries does not change our base-
line estimates at all. We have also re-estimated the regressions that use the globalization
indicators for the years 1990, 1980 and 1970 without the Eastern European countries. The
results are almost identical to the ones reported in Table 2.
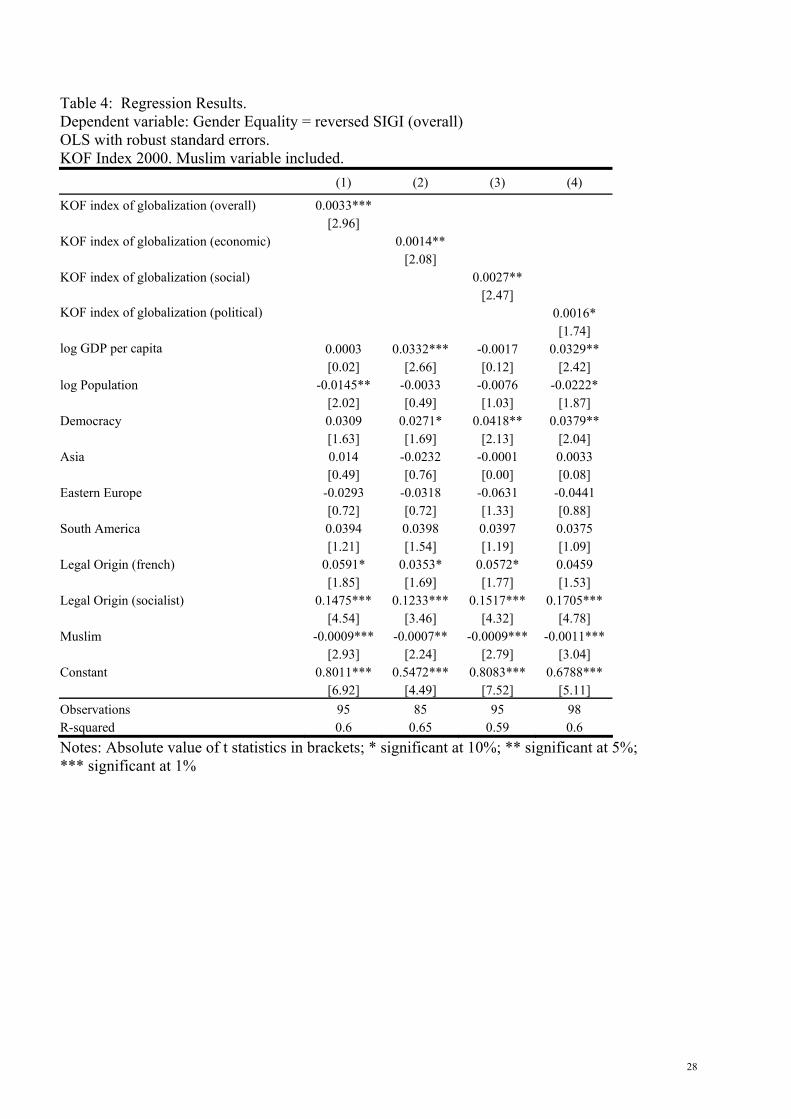
Cultural traits are often believed to exert a strong influence on gender equality.
Protestantism, for example, had a decidedly positive influence on gender equality in
education (Becker and Woessmann 2009, 2010, Norton and Tomal 2009, Cooray and
Potrafke 2011). Islam, on the other hand, has been shown to have a negative influence on
gender equality (cf. Baliamoune-Lutz, 2006, and Neumayer and de Soysa, 2007). To
control for these cultural traits we employ the data on religious fractionalization by Alesina therefore excluded the democracy variable in these regressions. Inferences regarding the globalization variables do not change however when we include the democracy variable for the year 2000.
15
et al. (2003). This database reports for each country in the year 1980 the percentage of the
population belonging to the three most widespread religions in the world. The database
contains however many missing observations. The most complete data is available for
Islam. We therefore focus on the share of a country’s Muslim population. In Alesina’s data
base the category “Muslim” is for some countries subdivided in “Shia Muslim” and “Sunni
Muslim”, for other countries this sub-division is not recorded. We therefore combine the
available data to obtain a single variable that describes the share of Muslims in the total
population of each country. The results reported in Table 4 show that the coefficient of this
Muslim variable is statistically significant at the 1% level (at the 5% level in column 2) and
has a negative sign. The numerical meaning is that gender equality decreases by about
0.001 points if the share of Muslims increases by one percentage point, implying that
gender equality in a country with no Muslims is by 0.1 points higher than in an otherwise
identical but purely Muslim country. Notice, that including the Muslim variable does not
change the inferences with respect to the globalization variables. In fact, including the
Muslim variable rather intensifies the influence of globalization, i.e. excluding the Muslim
variable appears to induce some omitted variable bias.
We have also included average years of total schooling by Barro and Lee (2010) in
order to capture a second dimension of culture (not reported here). Average years of total
schooling in the population aged 15 (25) and over are statistically significant at the 1%
level and have the expected positive signs. The effects indicate that one additional year of
total schooling increases the inversed SIGI by about 0.01 to 0.02 points. Including the
average years of total schooling does not change the inference that globalization had a
positive influence on the inversed SIGI: the globalization variables remain statistically
significant at the 5% or 10% level. The average years of total schooling collected by Barro
and Lee (2010) are however not available for the entire sample of 96 countries in the year
2000, but only for 83 countries. In particular, countries with low gender equality such as
16
Bhutan, Burkina Faso, Chad, Eritrea and Nigeria are excluded. This explains the somewhat
weaker globalization-induced effects when including the average years of total schooling.
The reported effects could also be driven or mitigated by idiosyncratic circumstances in
individual countries. For this reason, we checked whether the results are sensitive to the
inclusion/exclusion of particular countries. Our results (not reported here) indicate that this
is not the case.
The upper limit of the SIGI is censored to one, the lower limit to zero. For this reason
one may well want to estimate a censored regression model (e.g., Tobit) because the
standard assumptions of OLS are, strictly speaking, not satisfied. It is important to note,
however, that in the entire sample the dependent variable in no case assumes the value zero
or one. While the reversed SIGI is never close to zero, it is in several cases close to one.
We have therefore estimated a Tobit model. Again, the results are very similar to the OLS
base-line results.
5. Conclusion
Heartrending anecdotal evidence promulgated by NGOs, the media, and the political
discourse is supposed to prove that globalization is hurting the poorest of the poor, i.e. the
downtrodden in the developing countries: indentured laborers, the sick, women, and
children. The intended political consequence of this kind of publicity is of course to
accommodate to the discontents of global economic integration and to reestablish barriers
to the international trade, investment, and migration.
Since rational policy-making cannot be based on selective evidence that is, moreover,
often gathered from obscure and dubious sources, many scholars have begun to study
globalization-induced effects on the well-being of the most depraved. The results of these
scholarly studies do not support the generally held belief that globalization is good for the
rich and bad for the poor. Many of these empirical investigations that are based on large
17
representative samples arrive at conclusions that are compatible with the overall evaluation
that a policy of openness is actually one of the most promising strategies to alleviate
poverty. This result is moreover perfectly in line with the fundamental economic notion
that the ubiquitous factor will gain from market integration – and this is in the developing
countries unskilled labor. One is therefore left to speculate about the motives of the
promoters of the anti-globalization movement in the developed countries who – when one
adopts a clinical economic view – do not appear to defend the needy in the South but rather
the low-skilled in the North.
Our study contributes to this growing economic literature by empirically investigating
the influence of globalization on one of the target groups of international commiseration:
the women in the developing countries. In contrast to related studies we do not consider
outcome-related aspects of the well-being of women such as the gender wage gap, female
employment shares, education and health status of women, etc. We rather focus on the
basic institutional parameters which guide the women’s daily routine in the developing
countries. To measure the prevailing institutions’ gender blindness, we employ the new
OECD Social Institutions and Gender Index (SIGI). The idea of this strategy is of course to
identify the long-run consequences of deepening globalization. A second distinguishing
feature of our approach is that we use the multi-faceted KOF indicator of globalization in
order to disentangle the impacts of the three major dimensions of globalization.
The results of our study are well in line with the gist of the evidence that emerges from
the related literature: deepening globalization is, in general, good for the women living in
developing countries. In our case we conclude that deepening globalization gives rise to
more gender equality which we interpret to imply that international integration will, in the
long run, improve the well-being of women. Moreover we find that it is mainly the social
aspect of globalization that drives gender equality. In the light of the political landscape of
developing countries, we believe this result to be quite plausible. Economic integration is
18
not a contested issue in these countries, social integration is however extraordinarily
controversial since it is strongly related to “americanization” (cf. Friedman 1999) or, as
Dreher and Gaston (2007: 166) succinctly put it, “globalization implies institutional
convergence to some common (U.S.) benchmark.” In other words, global economic
integration is, overall, beneficial for the developing countries, and it is also beneficial for
the ruling elites as long as the elite is in a position to appropriate a substantial part of these
gains from trade. Social globalization, on the other hand, is, as we argue, tantamount to
empowering the oppressed and therefore represents an issue that potentially undermines the
traditional political-economic order. It is therefore not surprising that in developing
countries with strong ruling elites or male dominated cultures, social globalization is
virtually demonized by the established ruling class. Our finding that it is especially hard to
advocate the adoption of gender equality in countries with large Muslim populations is a
case in point.
Our results admit a decidedly optimistic view of the globalization process with respect
to the status of women in the developing countries. Even if it were true that some outcome
related measures indicated that incipient globalization has had a negative effect on gender
equality, these findings are likely to represent mere teething troubles. These problems,
irritating as they may be, should not be overvalued because globalization, especially social
globalization, clearly invigorates the fundamental driving forces of gender equality.
Globalization will, therefore, eventually give rise to more gender equality.
19
References
Abu-Ghaida, D., & Klasen, S., (2004). The costs of the missing the millennium
development goal on gender equity. World Development 32, 1076-1107.
Acemoglu, D. (1998). Why do new technologies complement skills? Directed technical
change and wage inequality, Quarterly Journal of Economics 113, 1055-1090.
Aguayo-Tellez, E., Juhn, C., &. Airola, J. (2010). Does trade liberalization help women?
The case of Mexico in the 1990s. NBER Working Paper w16195, July.
Alesina, A., Devleeschauwer, A., Easterley, W., Kurlat, S. & Wacziarg, R., (2003).
Fractionalization. Journal of Economic Growth 8, 155-194.
Baliamoune-Lutz, M. (2006). Globalization and gender inequality: Is Africa different?
Journal of African Economies 16, 301-348.
Bardhan, K., & Klasen, S., (1999). UNDP’s gender-related indices: A critical review.
World Development 27, 985-1010.
Barro, R.J., & Lee, J.-W. (2010). A new data set of educational attainment in the world,
1950-2010. NBER Working Paper 15902.
Becker, G.S. (1971). The economics of discrimination. Chicago, Chicago University Press.
Becker, S.O, & Woessmann, L., (2009). Luther and the girls: religious denomination and
the female education gap in nineteeth-century Prussia.
Scandinavian Journal of Economics 110, 777-805.
Becker, S.O., & Woessmann, L., (2010). The effect of Protestantism on education before
industrialization: evidence from 1816 Prussia. Economics Letters 107, 224-228.
Bergh, A., & Nilsson, T. (2010a). Good for living? On the relationship between globalization
and life expectancy. World Development 38, 1191-1203.
Bergh, A., & Nilsson, T. (2010b). Do liberalization and globalization increase income
inequality? European Journal of Political Economy 26, 488-505.
Bjørnskov, C. (2010). On globalization and human rights: the importance of types of
globalization. University of Aarhus, Working Paper.
Boserup, E. (1970). Women’s role in economic development. New York, St. Martin’s
Press.
Branisa, B., Klasen, S. & Ziegler, M. (2009a). New measures of gender inequality: the
social institutions and gender index (SIGI) and its subindices. Courant Research Centre:
Poverty, Equity and Growth - Discussion Papers 10, Courant Research Centre PEG.
20
Branisa, B., Klasen, S. & Ziegler, M. (2009b). Why we should all care about social
institutions related to gender inequality. Courant Research Centre:
Poverty, Equity and Growth - Discussion Papers 15, Courant Research Centre PEG.
Busse, M. & Hefeker, C.(2007). Political risk, institutions, and foreign direct investments.
European Journal of Political Economy 23, 97-415.
Busse, M. & Nunnenkamp, P. (2009). Gender disparity in education and the international
competition for foreign direct investments. Feminist Economics 15, 61-90.
Cagatay, N. & Ertürk, K. (2004). Gender and Globalization: A macroeconomic perspective,
ILO Policy Integration Department, Working Paper No. 19, Geneva.
Cheibub, J., Gandhi, J., & Vreeland, J.R. (2010). Democracy and dictatorship revisited.
Public Choice 143, 67-101.
Cho, S.-Y. (2011). Integrating inequality – Globalization, women´s rights, son preference and
human trafficking. University of Göttingen, Working Paper.
Cingranelli, D.L. & Richards, D.L. (2005). The Cingranelli-Richards (CIRI) Human Rights
Dataset. Available at http://www.humanrightsdata.org.
Cooray, A., & Potrafke, N. (2011). Gender inequality in education: political institutions or
culture and religion? European Journal of Political Economy 27, 268-280.
Di Tommaso, M.L., I. Shima, S. Strom & Bettio, F. (2009). As bad as its gets: Well-being
deprivation of sexually exploited trafficked women. European Journal of Political
Economy 25, 143-162.
Dollar, D., & Gatti, R. (1999). Gender inequality, income and growth: Are good times good
for women? Policy Research Report on Gender and Development Working Paper Series
No. 1, World Bank, Washington DC.
Dreher, A. (2006). Does globalization affect growth? Evidence from a new index of
globalization. Applied Economics 38, 1091-1110.
Dreher, A., Gassebner, M. & Siemers, L.-H. (2011). Globalization, economic freedom and
human rights. Journal of Conflict Resolution, forthcoming.
Dreher, A., & Gaston, N. (2007). Has globalisation really had no effect on unions?
Kyklos 60, 165-186.
Dreher, A., Gaston, N., & Martens, P., (2008). Measuring globalization – Gauging its
consequences. Springer, Berlin.
Feenstra, R. C., & Hanson, G. H. (1997). Foreign direct investment and relative wages:
evidence from Mexico`s maquiladoras. Journal of International Economics 42, 371-393.
21
Friedman, T.L. (1999). The lexus and the olive tree. New York: Farrar, Strauss, and
Giroux.
Harms, P., & Ursprung, H.W. (2002). Do civil and political repression really boost foreign
direct investments? Economic Inquiry 40, 651-663.
Jüttig, J., Luci, A., & Morrison, C., (2010). Why do so many women end up in bad jobs?
A cross-country assessment. Working Paper No. 287 , OECD Development Centre,
Paris.
Klasen, S. (2002). Low schooling for girls, slower growth for all? Cross country evidence on
the effect of gender inequality in education on economic development. World Bank
Economic Review 16, 345-373.
Klasen, S., & Lamanna, F. (2009). The impact of gender inequality in education and
employment on economic growth: new evidence for developing countries.
Feminist Economics 15, 91-132.
Knowles, S., Lorgelly, P., & Ownen, P. (2002). Are educational gender gaps a brake on
economic development? Some cross country empirical evidence. Oxford Economic Papers
54, 118 – 149.
La Porta, R., Lopez-di-Silanes, F., Shleifer, A., & Vishny, R. (1999). The quality of
government. Journal of Law, Economics and Government 15, 222-279.
Margit, S., Beladi, H., & Chakrabarti, A. (2004). Trade and wage inequality in developing
countries. Economic Inquiry 42, 295-303.
Munck, G., & Verkuilen, J. (2002). Conceptualizing and measuring democracy: Evaluating
alternative indices. Comparative Political Studies 55, 5-34.
Neumayer, E., & de Soysa, I. (2007). Globalization, Women’s economic rights and forced
labor. World Economy 1510-1535.
Neumayer, E., & de Soysa, I. (2011). Globalization and the empowerment of women: an
analysis of spatial dependence via trade and foreign direct investment.
World Development 39, 1065-1075.
Norton, S.W., & Tomal, A. (2009). Religion and female educational attainment.
Journal of Money, Credit and Banking 41, 961-986.
Oostendorp, R.H. (2009). Globalization and the gender wage gap. World Bank Economic
Review 23, 141-161.
Ozler, S. (2000). Export orientation and female share of employment: Evidence from
Turkey. World Development 28, 1239-48.
22
Richards, D.L., & Gelleny, R. (2007). Women´s status and economic globalization.
International Studies Quarterly 51, 855-876.
Schultz, P.T. (2007). Does the liberalization of trade advance gender equality in schooling
and health? In E. Zedillo (ed.). The future of globalization (chapter 11), London, Taylor
and Francis.
Schulze, G.G., & Ursprung, H.W. (1999). Globalisation of the economy and the nation
state. World Economy 22, 295–352.
Summers, R., Heston, A. (1991). The Penn World Table (Mark 5): an expanded set of
international comparisons, 1950-1988. Quarterly Journal of Economics 106, 327-369.
Vreeland, J.R. (2008). The effect of political regime on civil war: Unpacking anocracy.
Journal of Conflict Resolution 52, 401-425.
23
Figure 2: Gender equality = reversed SIGI and overall KOF index of globalization (year 2000).
ALB
DZA
ARGARMAZE
BHR
BGD
BLR
BENBTN
BOL
BWA
BRA
BFA
BDI
KHM
CMRCAF
TCD
CHL
CHN
COL
ZAR
CRI
CIV
HRVCUBDOMECU
EGY
SLV
GNQERI
ETH
FJI
GABGMB
GEO
GHA
GTM
GIN
HND
IND
IDN
IRN
JAM
KAZ
KEN
KWT
KGZLAO
LBY
MKD
MDG
MWI
MLI
MRT
MUSMDAMNG MAR
MOZ
MMRNAM
NPL
NIC
NER
NGA
PAK
PNG
PRY PERPHL RUS
RWA
SEN
SLE
SGP
ZAFLKA
SDN
SWZSYR
TJK
TZA
THA
TGO
TTOTUN
UGA
UKR
ARE
URYVENVNM
YEM
ZMBZWE
.4.6
.81
Rev
erse
d S
IGI
20 40 60 80 100overall KOF index of globalization
Correlation coefficient: 0.42. Source: Branisa et al. (2009) and Dreher (2006) and Dreher et al. (2008). Figure 3: Gender equality = reversed SIGI and KOF index of economic globalization (year 2000).
ALB
DZA
ARGARMAZE
BHR
BGD
BLR
BEN
BOL
BWA
BRA
BFA
BDI
KHM
CMRCAF
TCD
CHL
CHN
COL CRI
CIV
HRVDOM
ECU
EGY
SLV
ETH
FJI
GAB
GEO
GHA
GTM
GIN
HND
IND
IDN
IRN
JAM
KAZ
KEN
KWT
KGZMKD
MDG
MWI
MLI
MRT
MUS MDAMNGMAR
MOZ
NAM
NPL
NIC
NER
NGA
PAK
PNG
PRY PERPHLRUS
RWA
SEN
SLE
SGP
ZAFLKA
SWZSYR
TZA
THA
TGO
TTOTUN
UGA
UKRURYVENVNM
YEM
ZMBZWE
.4.6
.81
Rev
erse
d S
IGI
20 40 60 80 100KOF index of economic globalization
Correlation coefficient: 0.58. Source: Branisa et al. (2009) and Dreher (2006) and Dreher et al. (2008).
24
Figure 4: Gender equality = reversed SIGI and KOF index of social globalization (year 2000).
ALB
DZA
ARGARMAZE
BHR
BGD
BLR
BENBTN
BOL
BWA
BRA
BFA
BDI
KHM
CMRCAF
TCD
CHL
CHN
COL
ZAR
CRI
CIV
HRVCUBDOM
ECU
EGY
SLV
GNQERI
ETH
FJI
GABGMB
GEO
GHA
GTM
GIN
HND
IND
IDN
IRN
JAM
KAZ
KEN
KWT
KGZLAO
LBY
MKD
MDG
MWI
MLI
MRT
MUSMDAMNG MAR
MOZ
MMRNAM
NPL
NIC
NER
NGA
PAK
PNG
PRYPERPHL RUS
RWA
SEN
SLE
SGP
ZAFLKA
SDN
SWZSYR
TJK
TZA
THA
TGO
TTOTUN
UGA
UKR
ARE
URYVENVNM
YEM
ZMBZWE
.4.6
.81
Rev
erse
d S
IGI
0 20 40 60 80 100KOF index of social globalization
Correlation coefficient: 0.45. Source: Branisa et al. (2009) and Dreher (2006) and Dreher et al. (2008). Figure 5: Gender equality = reversed SIGI and KOF index of political globalization (year 2000).
AFG
ALB
DZA
ARGARM AZE
BHR
BGD
BLR
BENBTN
BOL
BWA
BRA
BFA
BDI
KHM
CMRCAF
TCD
CHL
CHN
COL
ZAR
CRI
CIV
HRVCUBDOM
ECU
EGY
SLV
GNQERI
ETH
FJI
GABGMB
GEO
GHA
GTM
GIN
HND
IND
IDN
IRNIRQ
JAMKAZ
KEN
KWT
KGZLAO
LBRLBY
MKD
MDG
MWI
MLI
MRT
MUSMDAMNG MAR
MOZ
MMRNAM
NPL
NIC
NERNGA
PAK
PNG
PRY PERPHLRUS
RWA
SEN
SLE
SGP
ZAFLKA
SDN
SWZSYR
TJK
TZA
THA
TGO
TTO TUN
UGA
UKR
ARE
URYVENVNM
YEM
ZMBZWE
.2.4
.6.8
1R
ever
sed
SIG
I
0 20 40 60 80 100KOF index of political globalization
Correlation coefficient: 0.05. Source: Branisa et al. (2009) and Dreher (2006) and Dreher et al. (2008).
25
Table 1: Regression Results. Dependent variable: Gender Equality = reversed SIGI (overall) OLS with robust standard errors. KOF Index 2000.
(1) (2) (3) (4) (5)
KOF index of globalization (overall) 0.0038*** 0.0032** [3.95] [2.62] KOF index of globalization (economic) 0.0015** [2.12] KOF index of globalization (social) 0.0029** [2.53] KOF index of globalization (political) 0.001 [1.11] log GDP per capita -0.0037 0.0270** -0.0100 0.0337** [0.26] [2.21] [0.66] [2.20] log Population -0.0140* -0.0021 -0.007 -0.0164 [1.96] [0.32] [1.01] [1.43] Democracy 0.0341 0.0238 0.0451** 0.0473** [1.57] [1.29] [2.00] [2.12] Asia -0.005 -0.0417 -0.0186 -0.0332 [0.16] [1.36] [0.64] [0.80] Eastern Europe -0.0312 -0.0377 -0.0696 -0.0614 [0.72] [0.84] [1.45] [1.11] South America 0.0836*** 0.0737*** 0.0794*** 0.0824** [2.89] [2.67] [2.68] [2.62] Legal Origin (french) 0.0277 0.0065 0.0287 0.0097 [0.92] [0.29] [0.95] [0.35] Legal Origin (socialist) 0.1524*** 0.1269*** 0.1580*** 0.1770*** [4.46] [3.49] [4.33] [4.54] Constant 0.7055*** 0.8178*** 0.5758*** 0.8436*** 0.6384*** [14.45] [7.03] [4.44] [7.71] [4.49] Observations 98 96 86 96 99 R-squared 0.18 0.51 0.59 0.51 0.51 Notes: Absolute value of t statistics in brackets; * significant at 10%; ** significant at 5%; *** significant at 1%
26
Table 2: Regression Results. Dependent variable: Gender Equality = reversed SIGI (overall) OLS with robust standard errors. Lagged KOF Indices.
(1) (2) (3) (4) KOF index of globalization 1990 (overall) 0.0017 [1.11] KOF index of globalization 1990 (economic) 0.0007 [0.84] KOF index of globalization 1990 (social) 0.0023* [1.79] KOF index of globalization 1990 (political) -0.0005 [0.53] KOF index of globalization 1980 (overall) 0.0042*** [3.70] KOF index of globalization 1980 (economic) 0.0012 [1.38] KOF index of globalization 1980 (social) 0.0025** [2.16] KOF index of globalization 1980 (political) 0.0014* [1.86] KOF index of globalization 1970 (overall) 0.0038*** [2.84] KOF index of globalization 1970 (economic) 0.0009 [1.09] KOF index of globalization 1970 (social) 0.0029* [1.93] KOF index of globalization 1970 (political) 0.0001 [0.07] Notes: Absolute value of t statistics in brackets; * significant at 10%; ** significant at 5%; *** significant at 1%. All regressions including control variables.
27
Table 3: Regression Results. Dependent variable: Gender Equality = reversed SIGI (overall) OLS with robust standard errors. KOF Index 2000. Eastern European countries excluded.
(1) (2) (3) (4) (5)
KOF index of globalization (overall) 0.0035*** 0.0033** [3.61] [2.58] KOF index of globalization (economic) 0.0015* [1.82] KOF index of globalization (social) 0.0029** [2.36] KOF index of globalization (political) 0.0013 [1.34] log GDP per capita -0.0071 0.0257* -0.0112 0.0300* [0.46] [1.95] [0.71] [1.93] log Population -0.0162** -0.0039 -0.0088 -0.0212* [2.12] [0.53] [1.17] [1.70] Democracy 0.0407* 0.0272 0.0512** 0.0518** [1.72] [1.37] [2.08] [2.16] Asia -0.0022 -0.0386 -0.0166 -0.0265 [0.07] [1.25] [0.57] [0.63] South America 0.0817*** 0.0744** 0.0779** 0.0821** [2.74] [2.61] [2.54] [2.56] Legal Origin (french) 0.0294 0.0069 0.0299 0.0106 [0.96] [0.30] [0.98] [0.38] Legal Origin (socialist) 0.1537*** 0.1267*** 0.1590*** 0.1807*** [4.52] [3.50] [4.38] [4.61] Constant 0.7105*** 0.8541*** 0.6019*** 0.8667*** 0.6872*** [14.31] [7.02] [4.39] [7.60] [4.71] Observations 91 89 79 89 92 R-squared 0.16 0.49 0.56 0.49 0.49 Notes: Absolute value of t statistics in brackets; * significant at 10%; ** significant at 5%; *** significant at 1%
28
Table 4: Regression Results. Dependent variable: Gender Equality = reversed SIGI (overall) OLS with robust standard errors. KOF Index 2000. Muslim variable included.
(1) (2) (3) (4)
KOF index of globalization (overall) 0.0033*** [2.96] KOF index of globalization (economic) 0.0014** [2.08] KOF index of globalization (social) 0.0027** [2.47] KOF index of globalization (political) 0.0016* [1.74] log GDP per capita 0.0003 0.0332*** -0.0017 0.0329** [0.02] [2.66] [0.12] [2.42] log Population -0.0145** -0.0033 -0.0076 -0.0222* [2.02] [0.49] [1.03] [1.87] Democracy 0.0309 0.0271* 0.0418** 0.0379** [1.63] [1.69] [2.13] [2.04] Asia 0.014 -0.0232 -0.0001 0.0033 [0.49] [0.76] [0.00] [0.08] Eastern Europe -0.0293 -0.0318 -0.0631 -0.0441 [0.72] [0.72] [1.33] [0.88] South America 0.0394 0.0398 0.0397 0.0375 [1.21] [1.54] [1.19] [1.09] Legal Origin (french) 0.0591* 0.0353* 0.0572* 0.0459 [1.85] [1.69] [1.77] [1.53] Legal Origin (socialist) 0.1475*** 0.1233*** 0.1517*** 0.1705*** [4.54] [3.46] [4.32] [4.78] Muslim -0.0009*** -0.0007** -0.0009*** -0.0011*** [2.93] [2.24] [2.79] [3.04] Constant 0.8011*** 0.5472*** 0.8083*** 0.6788*** [6.92] [4.49] [7.52] [5.11] Observations 95 85 95 98 R-squared 0.6 0.65 0.59 0.6 Notes: Absolute value of t statistics in brackets; * significant at 10%; ** significant at 5%; *** significant at 1%
29
Table A1. List of countries included. Country SIGI_INV KOF_ov_2000 Country SIGI_INV KOF_ov_2000Afghanistan 0.42 Kuwait 0.81 65.78Albania 0.89 43.09 Kyrgyzstan 0.97 53.59Algeria 0.81 46.51 Lao People's Democratic Republic 0.96 24.16Argentina 1.00 64.88 Liberia 0.77 Armenia 0.97 50.50 Libyan Arab Jamahiriya 0.74 53.65Azerbaijan 0.97 48.31 Macedonia 0.98 46.25Bahrain 0.80 67.56 Madagascar 0.93 32.35Bangladesh 0.76 33.02 Malawi 0.86 38.70Belarus 0.99 47.01 Mali 0.66 38.22Benin 0.81 37.93 Mauritania 0.85 37.60Bhutan 0.84 26.72 Mauritius 0.99 50.09Bolivia 0.99 57.02 Moldova 0.99 54.75Botswana 0.92 49.58 Mongolia 0.96 41.41Brazil 0.98 58.11 Morocco 0.95 51.65Burkina Faso 0.84 38.59 Mozambique 0.80 44.16Burundi 0.89 25.62 Myanmar 0.95 14.16Cambodia 0.98 39.59 Namibia 0.92 53.23Cameroon 0.78 39.37 Nepal 0.83 35.24Central African Republic 0.82 27.65 Nicaragua 0.98 54.58Chad 0.68 27.32 Niger 0.82 31.53Chile 0.98 69.18 Nigeria 0.78 49.34China 0.78 54.21 Pakistan 0.72 46.38Colombia 0.99 53.64 Papua New Guinea 0.79 39.95Congo, Democratic Republic 0.80 23.04 Paraguay 1.00 48.33Costa Rica 0.99 62.60 Peru 0.99 57.06Croatia 1.00 65.10 Philippines 0.99 56.54Cuba 0.98 47.52 Russian Federation 0.99 62.98Côte d''Ivoire 0.86 46.88 Rwanda 0.83 26.91Dominican Republic 0.96 54.60 Senegal 0.89 47.10Ecuador 0.99 54.57 Sierra Leone 0.66 31.32Egypt 0.78 54.42 Singapore 0.98 86.77El Salvador 0.99 57.78 South Africa 0.91 61.38Equatorial Guinea 0.82 22.94 Sri Lanka 0.94 48.65Eritrea 0.86 24.40 Sudan 0.32 31.11Ethiopia 0.77 32.39 Swaziland 0.84 49.15Fiji 0.95 50.76 Syrian Arab Republic 0.86 40.42Gabon 0.78 46.92 Tajikistan 0.97 27.06Gambia 0.82 47.40 Tanzania 0.89 32.49Georgia 0.97 46.49 Thailand 0.99 58.72Ghana 0.89 48.41 Togo 0.80 44.15Guatemala 0.97 48.73 Trinidad and Tobago 0.98 60.86Guinea 0.77 36.01 Tunisia 0.98 57.26Honduras 0.97 55.51 Uganda 0.81 36.01Hong Kong Special Administrative 0.99 Ukraine 0.99 59.91India 0.68 44.23 United Arab Emirates 0.73 69.50Indonesia 0.87 53.74 Uruguay 0.99 62.90Iran 0.70 34.72 Venezuela 0.99 61.62Iraq 0.72 Viet Nam 0.97 37.98Jamaica 0.95 61.24 Yemen 0.67 34.93Kazakhstan 1.00 52.41 Zambia 0.78 50.65Kenya 0.86 42.54 Zimbabwe 0.81 44.68
30
Table A2. Data description and sources. Variable Observations Mean Std. Dev. Min Max Source
SIGI 102 0.13 0.12 0.00 0.68 Branisa et al. (2009) KOF index of globalization (overall) 2000 98 46.57 12.83 14.16 86.77
Dreher (2006) and Dreher et al. (2008)
KOF index of globalization (economic) 2000 86 49.64 14.49 23.11 93.97
Dreher (2006) and Dreher et al. (2008)
KOF index of globalization (social) 2000 98 37.62 16.69 4.65 93.04
Dreher (2006) and Dreher et al. (2008)
KOF index of globalization (political) 2000 101 58.60 18.20 19.64 92.19
Dreher (2006) and Dreher et al. (2008)
KOF index of globalization (overall) 1990 96 34.21 10.96 9.66 81.43
Dreher (2006) and Dreher et al. (2008)
KOF index of globalization (economic) 1990 84 39.11 15.00 11.62 94.77
Dreher (2006) and Dreher et al. (2008)
KOF index of globalization (social) 1990 96 26.22 13.48 3.45 84.00
Dreher (2006) and Dreher et al. (2008)
KOF index of globalization (political) 1990 99 42.09 18.50 6.30 78.30
Dreher (2006) and Dreher et al. (2008)
KOF index of globalization (overall) 1980 95 33.43 10.23 11.55 76.16
Dreher (2006) and Dreher et al. (2008)
KOF index of globalization (economic) 1980 83 36.69 15.46 11.37 92.03
Dreher (2006) and Dreher et al. (2008)
KOF index of globalization (social) 1980 95 25.34 12.82 3.47 81.12
Dreher (2006) and Dreher et al. (2008)
KOF index of globalization (politcial) 1980 98 43.41 18.35 6.30 83.75
Dreher (2006) and Dreher et al. (2008)
KOF index of globalization (overall) 1970 94 29.37 8.91 11.08 60.38
Dreher (2006) and Dreher et al. (2008)
KOF index of globalization (economic) 1970 82 34.43 14.15 12.14 85.55
Dreher (2006) and Dreher et al. (2008)
KOF index of globalization (social) 1970 94 24.56 11.39 4.17 56.32
Dreher (2006) and Dreher et al. (2008)
KOF index of globalization (politcial) 1970 97 31.65 14.97 6.30 79.98
Dreher (2006) and Dreher et al. (2008)
GDP per capita (real) 2000 101 4932.50 5984.63 292.76 32246.91 Penn World Tables 6.3 Summers and Heston (1991)
Population (total) 2000 102 46225.67 160743.00 491.48 1268853.00 Penn World Tables 6.3 Summers and Heston (1991)
GDP per capita (real) 1990 91 3710.08 4542.69 358.26 31180.96 Penn World Tables 6.3 Summers and Heston (1991)
Population (total) 1990 102 39486.64 141206.20 371.10 1148365.00 Penn World Tables 6.3 Summers and Heston (1991)
GDP per capita (real) 1980 87 2872.94 5188.91 324.83 40009.61 Penn World Tables 6.3 Summers and Heston (1991)
Population (total) 1980 101 32419.79 119740.30 256.01 984736.40 Penn World Tables 6.3 Summers and Heston (1991)
GDP per capita (real) 1970 87 920.69 1045.47 136.27 6346.48 Penn World Tables 6.3 Summers and Heston (1991)
Population (total) 1970 101 26354.24 98883.35 219.54 820403.30 Penn World Tables 6.3 Summers and Heston (1991)
Democracy 2000 100 0.42 0.50 0 1 Cheibub et al. (2010) Africa 102 0.42 0.50 0 1 own calculation Asia 102 0.30 0.46 0 1 own calculation Eastern Europe 102 0.07 0.25 0 1 own calculation South America 102 0.19 0.39 0 1 own calculation Legal Origin (UK) 102 0.31 0.47 0 1 La Porta et al. (1999) Legal Origin (french) 102 0.49 0.50 0 1 La Porta et al. (1999) Legal Origin (socialist) 102 0.20 0.40 0 1 La Porta et al. (1999) Muslim 101 30.67 38.72 0 99.89 Alesina et al. (2003)
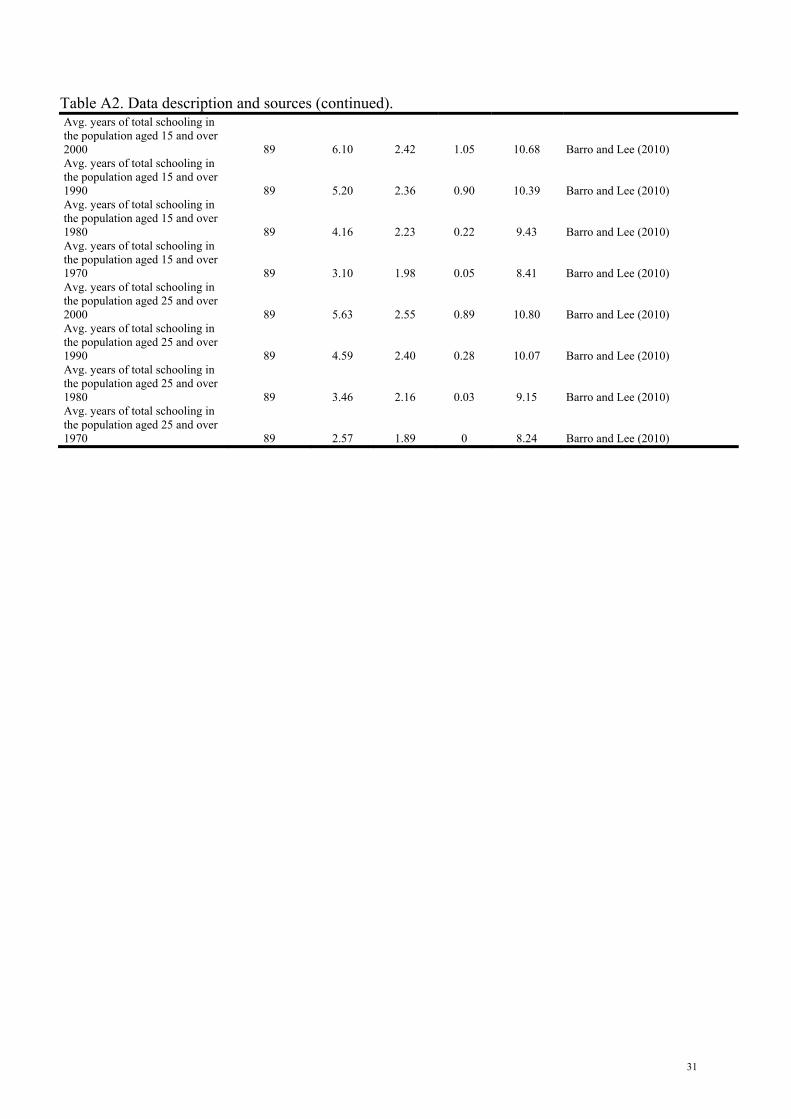
31
Table A2. Data description and sources (continued). Avg. years of total schooling in the population aged 15 and over 2000 89 6.10 2.42 1.05 10.68 Barro and Lee (2010) Avg. years of total schooling in the population aged 15 and over 1990 89 5.20 2.36 0.90 10.39 Barro and Lee (2010) Avg. years of total schooling in the population aged 15 and over 1980 89 4.16 2.23 0.22 9.43 Barro and Lee (2010) Avg. years of total schooling in the population aged 15 and over 1970 89 3.10 1.98 0.05 8.41 Barro and Lee (2010) Avg. years of total schooling in the population aged 25 and over 2000 89 5.63 2.55 0.89 10.80 Barro and Lee (2010) Avg. years of total schooling in the population aged 25 and over 1990 89 4.59 2.40 0.28 10.07 Barro and Lee (2010) Avg. years of total schooling in the population aged 25 and over 1980 89 3.46 2.16 0.03 9.15 Barro and Lee (2010) Avg. years of total schooling in the population aged 25 and over 1970 89 2.57 1.89 0 8.24 Barro and Lee (2010)