global!real!estate:performance,...
TRANSCRIPT

©2013 Investment Property Databank Ltd. All rights reserved. ipd.com 1
GLOBAL REAL ESTATE: Performance, Strategies, Risks, Opportuni=es Simon Fairchild, ExecuFve Director, IPD

©2013 Investment Property Databank Ltd. All rights reserved. ipd.com 2
Discussion topics
PERFORMANCE Global trends, and performance cycle? Why focus on ciFes?
IMPLICATIONS What they mean from a strategic perspecFve?
OUTLOOK What are the risks and opportuniFes associated with global invesFng?

©2013 Investment Property Databank Ltd. All rights reserved. ipd.com 3
Global Index composiFon by market
3
Source: IPD, KTI
Eurozone / EMEA
38%
Asia Pacific
20%
Americas
42%
United States 38%
Canada 4% Germany
6% France 6%
Netherlands 3%
Japan 15%
Australia 4%
UK 7%
Switzerland 4%
Eurozone
21%
Other EMEA
17% Asia
Pacific
20%
Americas
42%

©2013 Investment Property Databank Ltd. All rights reserved. ipd.com 4
Global performance of direct real estate
Annual results based on local currency, unleveraged
Source: IPD
-15
-10
-5
0
5
10
15
2000
2001
2002
2003
2004
2005
2006
2007
2008
2009
2010
2011
2012
3 Ye
ars
5 Ye
ars
10 Y
ears
% pa Capital growthIncome returnTotal return5-year annualised total return

©2013 Investment Property Databank Ltd. All rights reserved. ipd.com 5
15 14
11 9 9
7 7 7 6 6 6 6 6 5 5 4 4 4 4 4 3 3
2 1 1
-‐2 -‐2
10
5
0
5
10
15
20
South Africa
Canada
United States
Australia
New
Zealand
IPD Glob
al Inde
x
Korea
Switzerland
Sw
eden
Po
land
France
Austria
Finland
Norway
Czech Re
public
Germ
any
Pan-‐Eu
rope
an
Denm
ark
Japan
Belgium
UK
Ireland
Ita
ly
Nethe
rland
s Po
rtugal
Hungary
Spain
% pa Capital growth Income return Total return
Global total returns by country, 2012
Annual results based on local currency composite
©2013 Investment Property Databank Ltd. All rights reserved. ipd.com 6
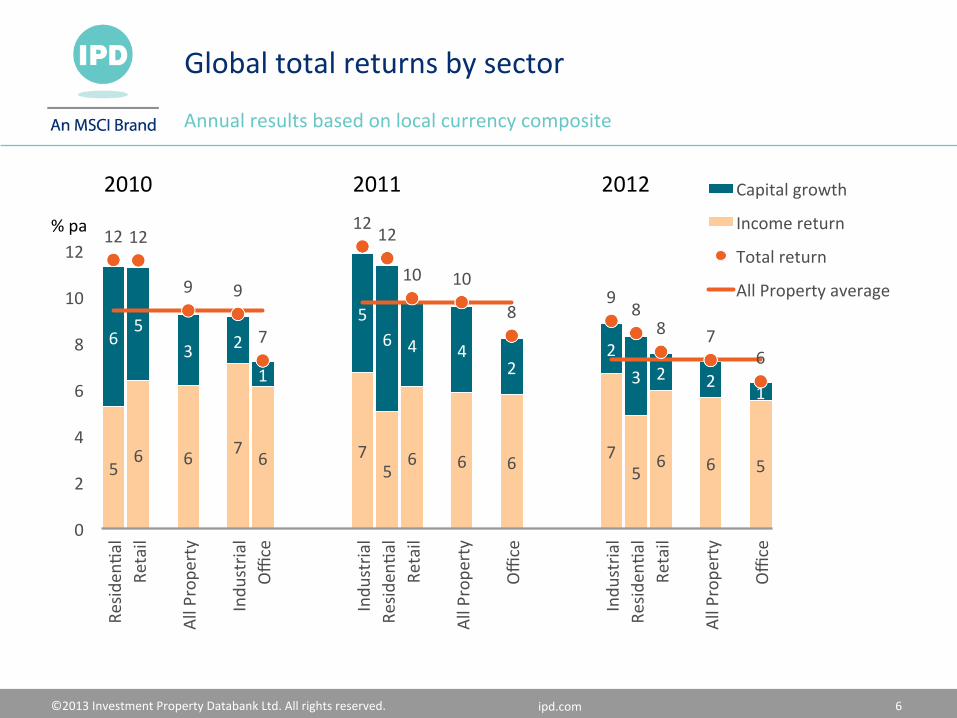
5 6 6 7 6 7
5 6 6 6 7
5 6 6 5
6 5
3 2
1
5 6 4 4
2 2
3 2 2 1
12 12
9 9
7
12 12
10 10
8 9
8 8 7
6
0
2
4
6
8
10
12
Resid
enFa
l Re
tail
All Prope
rty
Indu
stria
l Office
Indu
stria
l Re
siden
Fal
Retail
All Prope
rty
Office
Indu
stria
l Re
siden
Fal
Retail
All Prope
rty
Office
Capital growth
Income return
Total return
All Property average
Global total returns by sector
Annual results based on local currency composite
2010 2011 2012
% pa

©2013 Investment Property Databank Ltd. All rights reserved. ipd.com 7
IPD’s Coverage: Real estate performance on 180 major urban markets in 26 countries Today’s presentaFon focuses on performance in 67 of these ciFes
Source: IPD
©2013 Investment Property Databank Ltd. All rights reserved. ipd.com 8
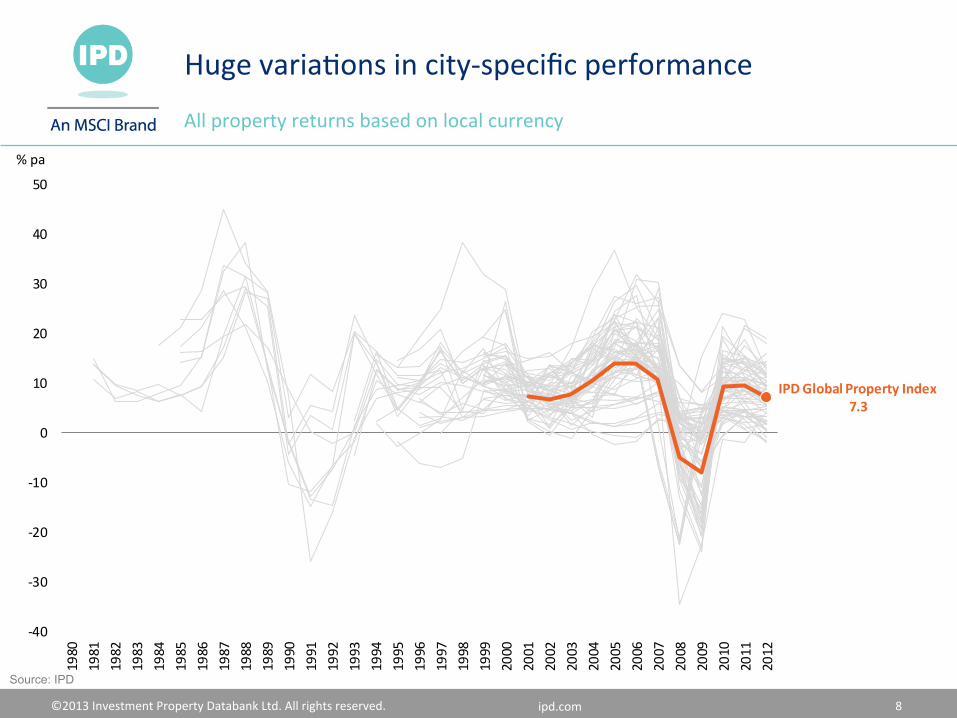
Huge variaFons in city-‐specific performance
All property returns based on local currency
Source: IPD
EMEA
EMEA
EMEA
EMEA
EMEA
EMEA
EMEA
EMEA
EMEA
EMEA
EMEA
EMEA
AP
AP
IPD Global Property Index7.3
-‐40
-‐30
-‐20
-‐10
0
10
20
30
40
50
1980
1981
1982
1983
1984
1985
1986
1987
1988
1989
1990
1991
1992
1993
1994
1995
1996
1997
1998
1999
2000
2001
2002
2003
2004
2005
2006
2007
2008
2009
2010
2011
2012
% pa

©2013 Investment Property Databank Ltd. All rights reserved. ipd.com 9
Capturing important differences in cyclical behaviour
All property returns based on local currency
Source: IPD
EMEA
EMEA
EMEA
EMEA
EMEA
EMEA
EMEA
EMEA
EMEA
EMEA
EMEA
EMEA
AP
AP
London 8.2New York 9.6Hong Kong 12.5
-‐40
-‐30
-‐20
-‐10
0
10
20
30
40
50
1980
1981
1982
1983
1984
1985
1986
1987
1988
1989
1990
1991
1992
1993
1994
1995
1996
1997
1998
1999
2000
2001
2002
2003
2004
2005
2006
2007
2008
2009
2010
2011
2012
% pa

©2013 Investment Property Databank Ltd. All rights reserved. ipd.com 10
Sub-‐naFonal variaFons maeer
2012 performance for key ciFes across ten countries
Source: IPD
10
5
0
5
10
15
20
Calgary
►CA
NADA
Toronto
Mon
treal
Vancou
ver
San Diego
Houston
Seattle
Denver
San Francis
coBo
ston
Portland
Atlanta
►US
AMiami
Dallas
New York
Los A
ngeles
Chica
goPh
iladelphia
Minneapolis
Washington DC
Perth
Brisb
ane
Melbo
urne
►AU
STRA
LIA
Sydney
Auckland
►NE
W ZEA
LAND
Wellington
Toulou
seLyon
Paris
►FRAN
CEMarseille
Munich
Hambu
rg►
GERM
ANY
Dusseldo
rfFrankfurt
Berlin
Yokohama
►JAPAN
Tokyo
Osaka
Antwerp
►BE
LGIUM
Brussels
Lond
onManchester
►UK
Edinbu
rgh
Birm
ingham
Lisbo
n►
PORT
UGAL
Porto
% pa Capital growthIncome returnTotal returnCountry average

©2013 Investment Property Databank Ltd. All rights reserved. ipd.com 11
Discussion topics
PERFORMANCE Global trends, and performance cycle? Why focus on ciFes?
IMPLICATIONS What they mean from a strategic perspecFve?
OUTLOOK What are the risks and opportuniFes associated with global invesFng?
©2013 Investment Property Databank Ltd. All rights reserved. ipd.com 12
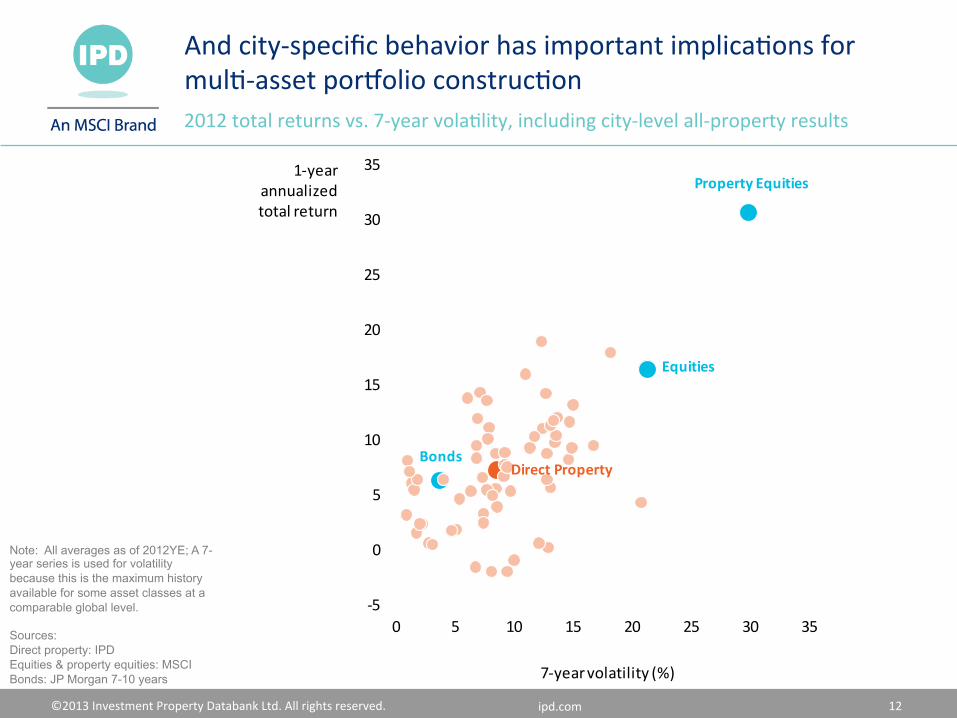
And city-‐specific behavior has important implicaFons for mulF-‐asset porfolio construcFon 2012 total returns vs. 7-‐year volaFlity, including city-‐level all-‐property results
Note: All averages as of 2012YE; A 7-year series is used for volatility because this is the maximum history available for some asset classes at a comparable global level. Sources: Direct property: IPD Equities & property equities: MSCI Bonds: JP Morgan 7-10 years
-‐5
0
5
10
15
20
25
30
35
0 5 10 15 20 25 30 35
1-‐year annualized total return
Property Equities
Equities
BondsDirect Property
7-‐year volatility (%)

©2013 Investment Property Databank Ltd. All rights reserved. ipd.com 13
Note: Annual results based on local currency composite; selected cities shown where data are available Source: IPD, KTI (Finland)
Cape Town
DublinFrankfurt
Johannesburg
London
Paris
Perth
Sydney
Calgary
New York
0
2
4
6
8
10
12
14
16
18
20
0 5 10 15 20Volatility (%)
Total return (%)
l EMEAl Asia Pacificl Americas
Tota
l Ret
urn,
%
Toronto
Performance behavior varies across markets 10 year annualised results based on local currency

©2013 Investment Property Databank Ltd. All rights reserved. ipd.com 14
Despite these variaFons within ciFes, there are paeerns in the behavior of different types of office market Capital growth 2009-‐12 for four disFnct types of city
Note: Capital values in the office sector indexed to 2009, the turning point of the global financial crisis Source: IPD
Commodity cities Financial & capital citiesManagement of mining, oil, and gas activities Management of strategic global finance or diplomacy
Technical cities National "second" citiesManagement of engineering, technology, and R&D Major cities that are upstaged globally by a larger national peer
80
90
100
110
120
130
140
15020
09
2010
2011
2012
2009 = 100 PerthCalgaryOsloJohannesburgHouston
80
90
100
110
120
130
140
150
2009
2010
2011
2012
2009 = 100 ParisLondonNew YorkHong KongWashington DC
80
90
100
110
120
130
140
150
2009
2010
2011
2012
2009 = 100 MelbourneLyonManchesterChicagoOsaka
80
90
100
110
120
130
140
150
2009
2010
2011
2012
2009 = 100 MunichSeoulStockholmSan DiegoSeattle

©2013 Investment Property Databank Ltd. All rights reserved. ipd.com 15
European office markets
2012 total returns for office properFes
Source: IPD Global Cities Report
l Strong (10% or more)
l Moderate (5-‐9%)
l Weak (0-‐5%)
l Declining

©2013 Investment Property Databank Ltd. All rights reserved. ipd.com 16
Sub-‐market variaFons are also highly important...
2012 total returns for office properFes
Source: IPD UK Quarterly Digest
l Strong (10% or more)
l Moderate (5-‐9%)
l Weak (0-‐5%)
l Declining▬ 10-‐year annualised
-‐2
0
2
4
6
8
10
12
OuterLondon
UK average City InnerLondon
West End
% pa

©2013 Investment Property Databank Ltd. All rights reserved. ipd.com 17
... As are asset-‐specific variaFons
2012 total returns for London properFes*
*Includes office properties as well as other property types Source: IPD
0
50
100
150
200
250
300
350
400
-‐20 -‐15 -‐10 -‐5 0 5 10 15 20 25 30
Number of Assets
2012 Total Return (year over year)
Median TR5.4%
Declining TR18% of assets
>10% TR22% of assets

©2013 Investment Property Databank Ltd. All rights reserved. ipd.com 18
Asia: Total returns by market
Annual results based on local currency
0
5
10
15
20
25
China
Hong Kon
g
Indo
nesia
Japan
Korea
Malaysia
Singapore
Taiwan
Thailand
Pan-‐Asia
2010
2011
2012
% pa
8.8
5.5 5.9 6.2
-‐5
0
5
10
15
20
2007 2008 2009 2010 2011 2012 6-‐year annualised
% pa Retail Office Industrial Pan-‐Asia All Property

©2013 Investment Property Databank Ltd. All rights reserved. ipd.com 19
Discussion topics
PERFORMANCE Global trends, and performance cycle? Why focus on ciFes?
IMPLICATIONS What they mean from a strategic perspecFve?
OUTLOOK What are the risks and opportuniFes associated with global invesFng?
©2013 Investment Property Databank Ltd. All rights reserved. ipd.com 20
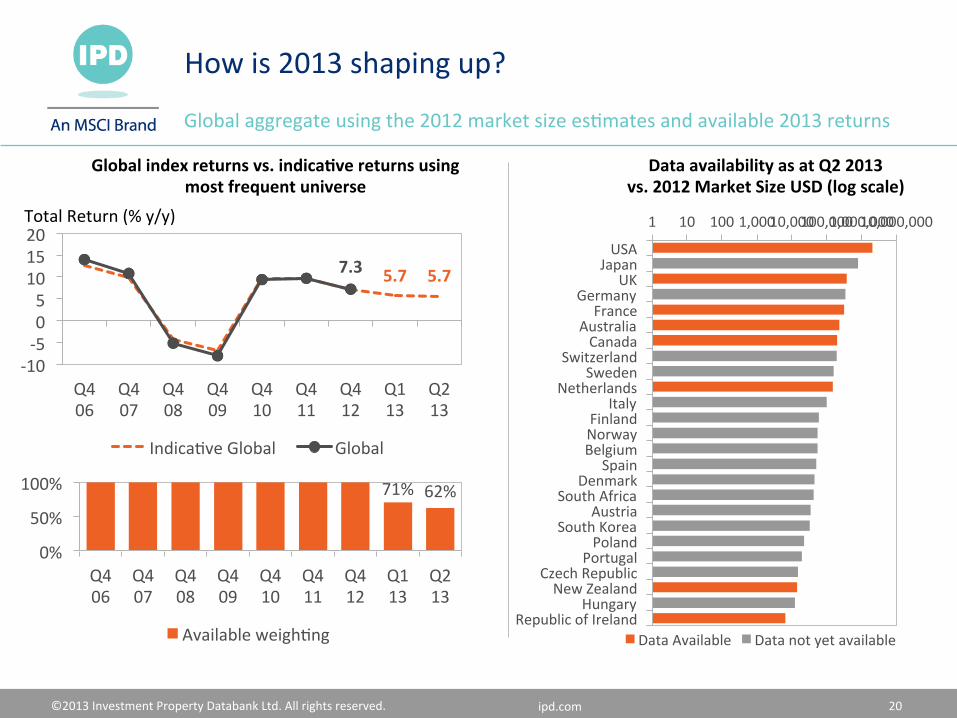
How is 2013 shaping up?
Global aggregate using the 2012 market size esFmates and available 2013 returns
5.7 5.7 7.3
-‐10 -‐5 0 5 10 15 20
Q4 06
Q4 07
Q4 08
Q4 09
Q4 10
Q4 11
Q4 12
Q1 13
Q2 13
IndicaFve Global Global
71% 62%
0%
50%
100%
Q4 06
Q4 07
Q4 08
Q4 09
Q4 10
Q4 11
Q4 12
Q1 13
Q2 13
Available weighFng
Total Return (% y/y) 1 10 100 1,000 10,000 100,000 1,000,000 10,000,000
USA Japan
UK Germany
France Australia Canada
Switzerland Sweden
Netherlands Italy
Finland Norway Belgium
Spain Denmark
South Africa Austria
South Korea Poland
Portugal Czech Republic New Zealand
Hungary Republic of Ireland
Data Available Data not yet available
Data availability as at Q2 2013 vs. 2012 Market Size USD (log scale)
Global index returns vs. indica=ve returns using most frequent universe

©2013 Investment Property Databank Ltd. All rights reserved. ipd.com 21
30
40
50
60
70
80
90
100
110
120
2007
2008
2009
2010
2011
2012
Q1 13
Q2 13
Denmark
Germany
Czech Republic
Japan
Belgium
Republic of Ireland
Netherlands
Italy
Portugal
Hungary
Spain
Global 30
40
50
60
70
80
90
100
110
120
2007
2008
2009
2010
2011
2012
Q1 13
Q2 13
Canada
South Africa
USA
Sweden
Switzerland
Global
France
Australia
UK
Austria
South Korea
Norway
Poland
New Zealand
Finland
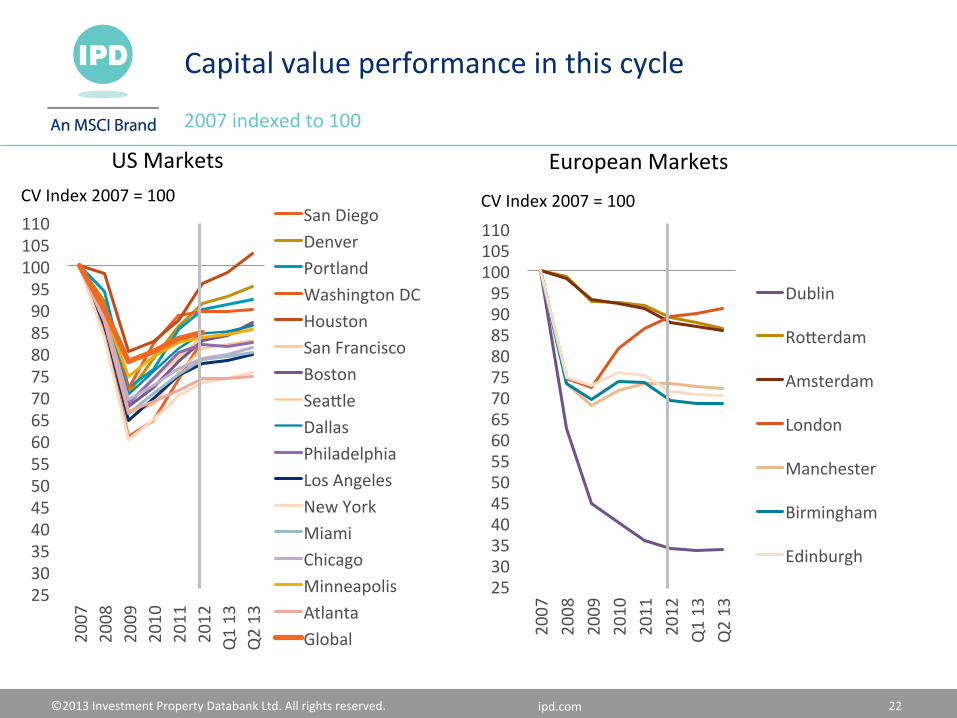
Capital value performance in this cycle
CV Index 2007 = 100 CV Index 2007 = 100
Recovering Markets Lagging Markets
©2013 Investment Property Databank Ltd. All rights reserved. ipd.com 22
25 30 35 40 45 50 55 60 65 70 75 80 85 90 95
100 105 110
2007
2008
2009
2010
2011
2012
Q1 13
Q2 13
San Diego Denver Portland Washington DC Houston San Francisco Boston Seaele Dallas Philadelphia Los Angeles New York Miami Chicago Minneapolis Atlanta Global
Capital value performance in this cycle
2007 indexed to 100
CV Index 2007 = 100 CV Index 2007 = 100
US Markets European Markets
25 30 35 40 45 50 55 60 65 70 75 80 85 90 95 100 105 110
2007
2008
2009
2010
2011
2012
Q1 13
Q2 13
Dublin
Roeerdam
Amsterdam
London
Manchester
Birmingham
Edinburgh

©2013 Investment Property Databank Ltd. All rights reserved. ipd.com 23
CiFes are at different stages of their cycle across global markets 2012 performance vs 3-‐year annualized
Source: IPD
Antwerp Paris
Berlin
MunichDublin
Rotterdam
Oslo
Warsaw
Stockholm
Perth
Sydney
Osaka
Tokyo
Calgary
Toronto
Atlanta
Houston
New York
Philadelphia
San Diego
San FranciscoSeattle
Washington DC
Johannesburg
Madrid
Auckland
Geneva
Birmingham
London
-‐10
-‐5
0
5
10
15
20
25
-‐5 0 5 10 15 20
3-‐year annualized (%)
2012annual
(%)
l EMEAl Asia Pacificl Americas
— globalofficeaverage
IMPROVING PEAKING
SLUGGISH SLIPPING

©2013 Investment Property Databank Ltd. All rights reserved. ipd.com 24
Performance momentum slowing, but huge variaFons persist All property returns, year-‐over-‐year
Source: IPD
-‐5
0
5
10
15
20
25
Calgary
San Diego
Houston
Cape Tow
nPerth
Toronto
Johann
esbu
rgSeattle
HongKo
ngDe
nver
Mon
treal
San Francisco
Boston
Portland
Vancou
ver
Atlanta
Miami
Dallas
Auckland
Brisb
ane
New
York
Melbo
urne
Los A
ngeles
Chicago
Toulou
seSydn
eyPh
ilade
lphia
Lyon
Lond
onGe
neva
Paris
Singapore
Minneapolis
Zurich
Seou
lStockholm
Mun
ich
Antw
erp
Washington DC
Vienna
Manchester
Oslo
Marseille
Hambu
rgWarsaw
Wellington
Yokohama
Copenh
agen
Dublin
Prague
Tokyo
Dusseldo
rfOsaka
Brussels
Frankfurt
Rotterdam
Lisbon
Amsterdam
Berlin
Milan
Edinbu
rgh
Rome
Birm
ingham
Budape
stPo
rto
Madrid
Barcelon
a
2010
2011
2012
% pa
©2013 Investment Property Databank Ltd. All rights reserved. ipd.com 25
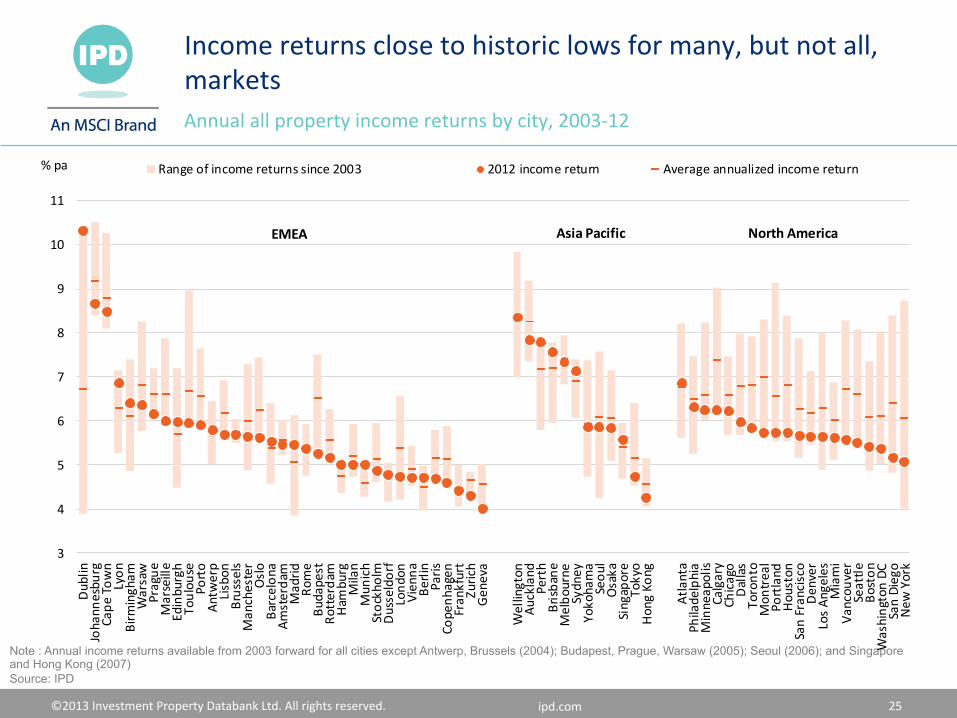
Income returns close to historic lows for many, but not all, markets Annual all property income returns by city, 2003-‐12
Note : Annual income returns available from 2003 forward for all cities except Antwerp, Brussels (2004); Budapest, Prague, Warsaw (2005); Seoul (2006); and Singapore and Hong Kong (2007) Source: IPD
3
4
5
6
7
8
9
10
11
Dublin
Johann
esbu
rgCape Tow
nLyon
Birm
ingham
Warsaw
Prague
Marseille
Edinburgh
Toulou
sePo
rto
Antw
erp
Lisbon
Brussels
Manchester
Oslo
Barcelon
aAm
sterdam
Madrid
Rome
Budapest
Rotterdam
Ham
burg
Milan
Mun
ich
Stockholm
Dusseldorf
Lond
onVienna
Berlin
Paris
Copenh
agen
Frankfurt
Zurich
Geneva
Wellington
Auckland
Perth
Brisbane
Melbo
urne
Sydney
Yokohama
Seou
lOsaka
Singapore
Tokyo
Hong Ko
ng
Atlanta
Philadelphia
Minneapolis
Calgary
Chicago
Dallas
Toronto
Mon
treal
Portland
Houston
San Francisco
Denver
Los An
geles
Miami
Vancou
ver
Seattle
Boston
Washington DC
San Diego
New
York
Range of income returns since 2003 2012 income return Average annualized income return% pa
North AmericaAsia PacificEMEA

©2013 Investment Property Databank Ltd. All rights reserved. ipd.com 26
Where next for the pricing of real estate?
Spread between IPD all property local yield and 10-‐year naFonal bond yield
Source: IPD & OECD
Berlin London Paris Zurich Tokyo Sydney New York Toronto
0
1
2
3
4
5
6
7
8
9
10
11
12
2002
2004
2006
2008
2010
2012
%
0
1
2
3
4
5
6
7
8
9
10
11
12
2002
2004
2006
2008
2010
2012
%
0
1
2
3
4
5
6
7
8
9
10
11
12
2002
2004
2006
2008
2010
2012
%
0
1
2
3
4
5
6
7
8
9
10
11
12
2002
2004
2006
2008
2010
2012
%
0
1
2
3
4
5
6
7
8
9
10
11
12
2002
2004
2006
2008
2010
2012
%
0
1
2
3
4
5
6
7
8
9
10
11
12
2002
2004
2006
2008
2010
2012
%
0
1
2
3
4
5
6
7
8
9
10
11
12
2002
2004
2006
2008
2010
2012
%
0
1
2
3
4
5
6
7
8
9
10
11
12
2002
2004
2006
2008
2010
2012
%
