glycomics approach of livestock management … for use title glycomics approach of livestock...
TRANSCRIPT

Instructions for use
Title Glycomics Approach of Livestock Management Toward the Discovery of Novel Biomarkers Indicating anEnvironmental Stress
Author(s) Rehan, Ibrahim Farag Mohammed
Citation 北海道大学. 博士(生命科学) 甲第12261号
Issue Date 2016-03-24
DOI 10.14943/doctoral.k12261
Doc URL http://hdl.handle.net/2115/61716
Type theses (doctoral)
File Information Ibrahim_Rehan.pdf
Hokkaido University Collection of Scholarly and Academic Papers : HUSCAP

Doctoral Thesis
Glycomics Approach of Livestock Management Toward the Discovery of
Novel Biomarkers Indicating an Environmental Stress
(糖鎖解析による家畜管理法の試み−環境ストレスを反映するバイオマーカーの探索)
Mr. Ibrahim Farag Mohammed Rehan
Laboratory of Advanced Chemical Biology,
Graduate School of Life Science, Hokkaido University
March, 2016

2
Abstract
Because various stresses strongly influence the food productivity of livestock,
biomarkers to indicate unmeasurable environmental stress in domestic farm animals are of
increasing importance. Thermal comfort is one of the basic principles of dairy cow welfare that
enhances productivity, so that the more attention needs to be placed on the principles of The
Welfare Quality®
Assessment protocol, especially in summer and autumn seasons, in order to
enhance the performance and production. However, the expression levels of two major sialic
acids, notably Neu5Ac and Neu5Gc, in the glycoproteins/glycosphingolipids synthesized by
common mammalian cells except human cells might be a critical posttranslational modification
indicating drastic changes of the metabolic immune balance as well as seasonal alteration of the
total serum N-glycan profiles; as an abundant and major class of glycoconjugates in animal
serum glycoproteins. Thus, I considered that advent of novel and sensitive serum biomarkers
using glycoblotting
combined with MALDI-TOF/MS
and DMB-HPLC
allowed for
comprehensive N-glycomics of animal model to indicate not only their productivities but
significant changes in total healthy condition caused by unmeasurable stresses would contribute
greatly to the improvement of their management, healthy performance and high-quality
productivity.
Keywords: glycoblotting, serum glycoproteins, N-glycan structure, sialic acids, environmental
stress, immune responses, Holstein dairy cow welfare, serum biomarker.

3
Acknowledgements
The present dissertation is described author‟s Doctoral study at Graduate School of Life
Science, Hokkaido University.
First of all, I would like to express my sincere gratitude to Prof. Shin Ichiro-Nishimura
for his kind guidance, helpful suggestions, unlimited support and encouragement throughout
my research work. The work described herein would not have been successful without him. I
greatly appreciate kindness of Prof Seiji Kondo, Faculty of Agriculture, for his scientific
collaboration, assistance, valuable suggestions, animal experiment, sample collection, and
discussions. I gratefully acknowledge Prof. Toshiaki Koda for his precious time reading,
suggestions and evaluating my Doctoral dissertation. I would also like to thank Prof. Kenji
Monde for critical reading and suggestion on this dissertation, and I am indebted to Associate
Prof. Hiroshi Hinou for reading the manuscript, valuable suggestions, and evaluating my
dissertation.
I gratefully acknowledge Prof. Abdel-Moez A. Ismaeil at Faculty of Veterinary
Medicine, Assuit University, Egypt for his kind guidance, and helpful suggestions. Also Prof.
C. J. Nicol, and Prof. A. J. F. Webster at School of Veterinary Sciences, University of Bristol,
UK, for their valuable discussions. I would like to thank Assistant Prof. Maho Amano for
discussions, helpful advice, suggestion, and encouragement throughout this work. I am so
thankful to Associate Prof. Koichiro Ueda, and Assistant Prof. Tomohiro Mitani for the
valuable suggestions and discussion. I greatly appreciate kindness of Assistant Prof. Fayna
Garcia-Martin and Dr. Gerard Artigas Sole for their valuable suggestions and comments.

4
I would also like to express my special thanks that have never been forgotten to Mr.
Tetsu Ohashi for his kindness. I would like to thank Assistant Professor. Motamed Elsayed
Mahmoud at Faculty of Veterinary Medicine, Sohag University, Egypt for his kind guidance.
And, I really want to thank all members of Nishimura‟s laboratory, for their supports and
encouragements. I would like to thank the Government of Japan for MEXT Scholarship Award
for three years.
I especially thank my respected family in Egypt: Mr. Farag Rehan, Ms. Dawlat Elaasy,
Mr. Mohamed Elnagar, Ms. Mona Ezzat, Ms. Reham Rehan and her sons, Dr. Mohammed
Rehan, Dr. Ahmed Rehan, Dr. Lamiaa Elnagar, Mrs. Aliaa Elnagar, and my best friend Dr.
Hassan Deab for their unconditional love, care and encouragement allover the time. The best
social outcome from these past three years during my stay in Japan is accompanying my soul-
mate; my wife Dr. Asmaa Elnagar and having our lovely son here; Yasin Rehan to be a
memorable event, I offer a great thanks to her. There are no words to convey how much I
respect and appreciate you all.
Sapporo, 2016
Mr. Ibrahim Farag Mohammed Rehan

5
Table of Contents
List of Figures …………….…………………………………………………...………........ 6
List of Tables …………….…………………………………………………...……………. 9
Abbreviations ……………………………………………………………………..………... 10
Chapter 1: General Introduction and Review of Literatures…………………………………. 12
1.1. Stress and Farm Animal Welfare ….…………………………………………………... 13
1.2. Five Freedom of Farm Animal Welfare ………...………………………...……..……. 15
1.3. Thermal Comfort and Environmental Stress in Holstein Dairy Cows ……………..…. 17
1.4. Temperature-Humidity Index (THI) ……………………………..……………………. 18
1.5. Glycosylation ………………………………………………..………………………… 19
1.6. Sialic Acid and Livestock Immunity ……………………….…………………………. 21
1.7. Glycoblotting Method …………………………………………………………………. 24
Chapter 2: Aim of The Thesis …………………………………………………………….. 26
Chapter 3: Materials and Methods ………………………………………………………. 28
3.1. Animal Management ………………………………………..………..…….…………. 29
3. 2. Chemicals and General Methods ………………………………...….…….………….. 30
3. 3. Cow Serum Preparation ………………………………………..……….….…………. 31
3.4. Determination of Mean Monthly Climate ……………………………….....…………. 31
3. 5. Glycoblotting-based Serum Glycomics ……..…………………………..……………. 31
3. 6. Sialic Acid Analysis ……………………………………..………………..………….. 34
3. 7. Statistical Analysis ...………………………………………..……………..…….…… 36
Chapter 4: Results and Discussion ……………………………………………………………… 37
4. 1. Correlation of Holstein Cows Data and Climatic Change ……………………..……... 38
4.2. Large-Scale Serum N-glycomics of Holstein Cows ...…………………..…………….. 48
4.3. Quantitative Analysis of Dynamic Sialylation in Serum Glycoproteins ….…........….. 75
Chapter 5: Summary……………….……….………………...……………………………. 80
Chapter 6: Conclusion and Recommendation……………….……….………………...… 84
References…………………………………………………………………………………………….. 87

6
List of Figures
Figure 1.1: The principles and criteria of cow welfare…………………………….…. 14
Figure 1.2: Basic structure of glycans………………………………………………... 20
Figure 1.3: Basic structure of N-glycans, O-glycan and Glycosaminoglycans………. 21
Figure 1.4: (A) Sialic acids on cell-surface and secreated molecules, which are
typically found at the terminal position of glycan chains on the cell
surface and secreted molecules. (B) The forms of sialic acids Neu,
Neu5Ac, Neu5Gc, and KDN…………………………………………..….
23
Figure 1.5: Glycoblotting-based systematic procedure for the N-glycomics………… 24
Figure 3.1: Quantitation of Neu5Ac and Neu5Gc by DMB-HPLC method. (A)
DMB-HPLC monitored by fluorescence spectroscopy and the calibration
curve of DMB-Neu5Ac. (B) DMB-HPLC monitored by fluorescence
spectroscopy and the calibration curve of DMB-Neu5Gc………….…….
35
Figure 4.1: Temperature humidity index (THI), monthly mean air temperature, and
relative humidity………….……………………………………………….
38
Figure 4.2: Monthly mean air temperature and wind speed………….………………… 39
Figure 4.3: Monthly mean air temperature and global solar radiation………….………. 39
Figure 4.4: (A) Monthly body weight (mean±SD) of Holstein cows (between
February and October). (B) Monthly days in milk (mean±SD) of
Holstein cows (between February and October). (C) Monthly milk yield
(mean±SD) of Holstein cows (between February and October). (D)
Monthly parity (mean±SD) of Holstein cows (between February and
October). (E) Monthly lactose% in milk (mean±SD) of Holstein cows
(between February and October). (F) Monthly fat% in milk (mean±SD)
of Holstein cows (between February and October). (G) Monthly
protein% in milk (mean±SD) of Holstein cows (between February and
October)…………………………………………………………………
42
Figure 4.5: (A) Representative monthly body weight of Holstein cow
#8 (between February and October). (B) Representative monthly days
in milk of Holstein cow (between February and October). (C)
Representative monthly milk yield of Holstein cow (between February
7
and October). (D) Representative monthly parity of Holstein cow
(between February and October). (E) Representative monthly lactose%
in milk of Holstein cow (between February and October). (F)
Representative monthly fat% in milk of Holstein cow (between
February and October). (G) Representative monthly protein% in milk
of Holstein cow (between February and October)………………………
45
Figure 4.6: Glycoblotting-based systematic procedure for the large-scale glycomics
of Holstein dairy cow serum samples. (A) chemoselective ligation of
whole N-glycans of serum glycoproteins by “BlotGlyco” beads; (B)
washing; (C) on-bead methylation of sialic acids; (D) trans iminization
by benzyloxiamine to afford BOA-tagged N-glycans to be analyzed by
MALDI-TOFMS; (E) selective DMB-labeling of the terminal sialic
acids of total serum N-glycans to be employed for the quantitative
HPLC analysis of serum sialic acids derived from N-glycans of total
glycoproteins……………………………………………………………..
48
Figure 4.7: Large-scale N-glycan profiling of Holstein dairy cows serum
glycoproteins by using a standard protocol combining the glycoblotting
method and MALDI-TOF/MS. (A) MALDI-TOF/MS spectra showing
typical N-glycan profiles of Holstein dairy cow serum collected each
month; (B) monthly changes in the expression levels of the 36 major N-
glycans selected from Holstein cow serum glycoproteins………………..
51
Figure 4.8: Representative N-glycan profiling of Holstein dairy cow serum
glycoproteins of cow #8 by using a standard protocol combining the
glycoblotting method and MALDI-TOF/MS. (A) MALDI-TOF/MS
spectra showing typical N-glycan profiles of Holstein dairy cow serum
collected each month. (B) monthly changes in the expression levels of
the 36 major N-glycans selected from Holstein cow serum glycoproteins.
53
Figure 4.9: Serum N-glycan % of Holstein cow…………….………………….…….. 53
Figure 4.10: Some seasonally relevant serum N-glycoforms of Holstein dairy cows
given by a statistical analysis of expression levels and plausible
biosynthetic pathways…………………………………………………….
57
Figure 4.11: Representative MALDI-TOF/MS spectra of some seasonally relevant
serum N-glycoforms of Holstein dairy cow given by the high expression

8
levels and plausible biosynthetic pathways……………………………… 58
Figure 4.12: Schematic cartoon for the explanation of the addition of sialic acids to
the ends of Fc N-glycans can convert human IgG from a pro-
inflammatory anti-inflammatory, and The interaction between sialylated
IgG Fc N-glycans and (DCSIGN, SIGN-R1 might suppress
inflammation by regulate the TH2 pathway………………………………
67
Figure 4.13: MALDI-TOF/MS of N-glycans of fetal serum glycoproteins…………… 69
Figure 4.14: Monthly description of Holstein cow state during the study…………….. 73
Figure 4.15: A statistical analysis of the average amounts (µM±SE) of N–glycans
(2378, 2525 m/z) released from the serum glycoprotein of preganant and
non pregnant Holstein cows was conducted in February during the study.
(A) in correlation with covariate I (body weight, milk yield, days in
milk, parity). (B) in correlation with covariate II (fat%, protein%,
lactose% in milk)…………………………………………………………
74
Figure 4.16: Quantitation of nonreducing terminal sialic acids of total serum
glycoproteins. (A) Sialic acid-selective fluorescent labeling by means of
DMB reagent. Nonreducing terminal sialic acids of N-glycans captured by
the glycoblotting method were digested predominantly from BlotGlyco
beads and allowed to react specifically with DMB reagent at the α-keto acid
moiety to afford fluorescence-tagged sialic acid derivatives showing the
characteristic HPLC profiles based on the structure at the C5 position of
Neu5Ac, Neu5Gc, and KDN. (B) HPLC profiles monitored by fluorescence
spectrometry of total DMB−Neu5Ac and DMB-Neu5Gc derived from
serum glycoproteins captured by the glycoblotting method. In the present
study, DMB−KDN was not detected, whereas avian glycomics revealed the
existence of N-glycans containing this sialic acid residue in the egg white of
Galloanserae. (C) Seasonal alterations in the THI value, milk production,
and the expression levels of total sialic acids as DMB−Neu5Ac and
DMB−Neu5Ac in the N-glycans of serum glycoproteins .....….………….....
78
Figure 4.17: Schematic cartoon of the biosynthetic pathway for sialoglycoprotein
(Neu5Gc) in Holstein cows……………………………………………….
79

9
List of Tables
Table 4.1: Monthly mean climatic data in Sapporo, Japan………………………….. 38
Table 4.2: Statistical interpretation (mean±SD) of some of Holstein cow data
during the study.……………..……………………………………….…..
46
Table 4.3: Some data of representative Holstein cow #8 during the study.……….... 46
Table 4.4: Etimated pregnancy state of Holstein cows during the study…………..... 47
Table 4.5: Estimated compositions of 36 major N-glycans of Holstein cow serum
glycoproteins Selected…...……………………………………………….
54
Table 4.6: Specific serum N-glycans as biomarkers showing correlations with some
characteristic data of dairy Holstein cows………………………………..
59
Table 4.7: N-glycome expression levels (μM ± SE) of the serum glycoproteins of
Holstein cow between February and October……………………………
61
Table 4.8: Relationship between N-glycome expression levels (μM ± SE) of the
serum glycoproteins of Holstein cow and basic data between February
and October. (A). In correlation with covariates I “body weight, parity,
milk yield, and days in milk”. (B). In correlation with covariates II
“fat%, protein%, lactose% in milk”………...……………………………
62,63
Table 4.9: N-glycome expression levels of the serum glycoproteins of a
representative Holstein cow cow #8 between February and October…...
64
Table 4.10: The statistical analysis of N-glycome concentration (µM) of the serum
glycoproteins from primi-parous and multi-parous-6 Holstein cow in
February, particularly in (2378.95 m/z)...………………………….……..
70
Table 4.11: The statistical analysis of N-glycome concentartion (µM) of the serum
glycoproteins from primi-parous and multi-parous-3 Holstein cow in
February, particularly in (2525.07 m/z)...………………………………...
71

10
Abbreviations
ABC ammonium bicarbonate 99%
AVG Average
AcOH acetic acid
AFP α-fetoprotein
BOA O-benzylhydroxylamine hydrochloride
CEA carcinoembryonic antigen
DCSIGN dendritic cell-Specific intercellular adhesion molecule-3-grabbing non-
integrin
DHex Deoxyhexose
DMB 1,2-diamino-4,5-methylenedioxy-benzene
DTT Dithiothreitol
Fc fragment crystallizable
Fcγ/FcRn Fc-gamma/neonatal Fc receptor
Fu Fucose
Gal Galactose
GlcNAc N-acetyl-D-glucosamine
HeNAc N-acetylhexosamine
Hex Hexose
HPLC high performance liquid chromatography
IAA Iodoacetamide
ICAM-3 intercellular adhesion molecule 3
IgG immunoglobulin G
IS internal standard
JMA Japan metrological agency
KDN 2-keto-3-deoxynonulosonic acid
m/s meters per second
MALDI-TOF/MS matrix assisted laser desorption ionization-time of flight/mass spectrometry
Man Mannose
MeOH Methanol
MJ/m2 megajoule per square metre
11
MS mass spectrometry
MTT 3-Methyl-1-p-tolyltriazene
Neu5Ac 5-N-Acetylneuraminic acid
Neu5Gc 5-N-Glycolylneuraminic acid
PHM sodium 2-hydroxy-3-tetradecanamidopropane-1-sulfonate [1-
propanesulfonic acid, 2-hydroxyl-3-myristamido, sodium salt (1:1)]
PNGase F peptide N-glycosidase F trypsin
PRRs pattern recognition receptors
RH relative humidity
Siglec sialic acid-binding immunoglobulin-type lectins
TH2 T helper cell2
THI temperature−humidity index
CMAH cytidine monophosphate N-acetylneuraminic acid hydroxylase
CMP cytidine monophosphate

Chapter 1
General Introduction and Review of Literatures
12

13
1.1. Stress and Farm Animal Welfare
From an analytical viewpoint, the farming system can be seen as the primary condition
determining the living circumstances and thereby the welfare including the health of livestock.
The welfare of an animal is its state as regards its attempts to cope with its environment. The
animal welfare contains four principles (good housing, good feeding, good health, and
appropriate behaviours) and twelve criteria (absence of prolonged hunger, absence of prolonged
thirst, thermal comfort, comfort around resting, ease of movement, no painful management
procedures, no disease, no injuries, positive emotional state, good human-animal relationship,
and expressing other behaviors), as shown in (Figure 1.1). These principles and criteria should
be considered to deal with animal farm. Coping means maintaining control of mental and bodily
stability of animal in response to a challenge. Welfare therefore includes the extent of failure to
cope, which may lead to disease and injury, but also the ease or difficulty in coping. Both the
long-term and short-term costs of coping are important for an animal„s welfare. For example, an
animal may cope with an acute stress in the short-term by taking action that results in a long
term reduction in its welfare. For example, dairy cattle may be able to cope with the stresses
associated with high milk in lactation, but this coping may result in long-term health problems
that are apparent in later lactations.1
Stress is defined as an organisms total response to
environmental demand or pressures.2,3
Environmental stressor is not limited to climatic factors
but extends to nutrition, housing and any stimuli that demand a response from the animal to
adapt to new circumstances.4 However, the main stressors in an animal‟s life is changing in
routine/environment, over-stimulation which is the opposite of boredom.3
For instance, to get a
proper management of dairy cows welfare thermal comfort,5
must be considered in those
animals to make adjustments of the metabolism in order to maintain homeothermy.6

14
At this time, most of the animal welfare researchers were in zoology or animal
production departments in universities and research institutes. Although not often aware of the
wide range of welfare topics, many veterinarians were aiming to benefit the animals and
improve animal welfare by trying to cure or prevent animal disease. Some of these used their
clinical knowledge to ensure that the health of animals was properly considered in evaluation of
welfare whilst others carried out experimental work. Veterinarians who contributed to more
general aspects of animal welfare science included Andrew Fraser, Ingvar Ekesbo, Henrik
Simonsen, Robert Dantzer, Roger Ewbank, Barry Hughes and John Webster. Andrew Fraser
was one of the founders of the Society for Veterinary Ethology (later the International Society
for Applied Ethology), which is the major scientific society for animal welfare science. He was
also editor of the journal then called „„Applied Animal Ethology‟‟ and now called „„Applied
Animal Behaviour Science‟‟ which is the most important journal for scientific papers on animal
welfare. The journal „„Animal Welfare‟‟ has also been of major importance in more recent
years.
Figure 1.1. The principles and criteria of cow welfare.

15
1.2. Five Freedom of Farm Animal Welfare
The welfare of an animal includes its physical and mental state and we consider that
good animal welfare implies both fitness and a sense of well-being. Any animal kept by man
must at least be protected from unnecessary suffering. The animal‟s welfare, whether on farm,
in transit, at market or at a place of slaughter should be considered in terms of five freedoms, as
sourced in Farm Animal Welfare Council. (http://www.fawc.org.uk/index.htm). These
freedoms define ideal states rather than standards for acceptable welfare. They form a logical
and comprehensive framework for analysis of welfare within any system together with the steps
and compromises necessary to safeguard and improve welfare within the proper constraints of
an effective livestock industry
1. Freedom from hunger and thirst – by ready access to fresh water and a diet to maintain
full health and vigour.
2. Freedom from discomfort – by providing an appropriate environment including shelter
and a comfortable resting area.
3. Freedom from pain, injury or disease – by prevention or rapid diagnosis and treatment.
4. Freedom to express normal behaviour – by providing sufficient space, proper facilities
and company of the animal‟s own kind.
5. Freedom from fear and distress – by ensuring conditions and treatment that avoid mental
suffering.
The word stress should be used for that part of poor welfare that involves failure to
cope. If the control systems regulating body state and responding to dangers are not able to
prevent displacement of state outside the tolerable range, a situation of different biological
importance is reached. The use of the term stress should be restricted to the common public use
16
of the word to refer to a deleterious effect on an individual.7 A definition of stress as just a
stimulation or an event that elicits adrenal cortex activity is of no scientific or practical value. A
precise criterion for what is adverse for an animal is difficult to find but one indicator is
whether there is, or is likely to be, an effect on biological fitness. Stress is an environmental
effect on an individual that over-taxes its control systems and results in adverse consequences,
eventually reduced fitness.7-9
Using this definition, the relationship between stress and welfare
is very clear. Firstly, whilst welfare refers to a range in the state of the animal from very good to
very poor, whenever there is stress, welfare is poor. Secondly, stress refers only to situations
where there is failure to cope but poor welfare refers to the state of the animal both when there
is failure to cope and when the individual is having difficulty in coping. It is very important that
this latter kind of poor welfare, as well as the occasions when an animal is stressed, is included
as part of poor welfare. For instance, if a person is severely depressed or if an individual has a
debilitating disease but there is complete recovery with no long term effects on fitness then it
would still be appropriate to say that the welfare of the individuals was poor at the time of the
depression or disease. In the circumstances in which people have referred to some stress being
good, the effect is not stress but is stimulation that is useful experience in the maintenance or
development of individuals. There is no stress that is good and the terms “eustress” and
“dystress” are redundant. If an experience is difficult to cope with but beneficial in the long-
term, the welfare of the individual is poor at the time of coping difficulty but no stress occurs.

17
1.3. Thermal Comfort and Environmental Stress in Holstein Dairy Cows
The more attention needs to be placed on the principles of The Welfare Quality
Assessment protocol to enhance the performance and productivity of farm animals. Especially,
Freedom #2, in which, thermal comfort is one of the most important factors in the management
of dairy cow welfare,5 because cows must make metabolic adjustments to maintain
homeothermy.6 Various stressors could affect on the animal production and welfare, physically
as environmental climate, moisture, noise, transport, nutritional or pathologically as biological
agent of disease and vaccines. The major factors responsible for Holstein cows were i) it
became known worldwide that Holsteins gave higher milk yields than most breeds; ii) dairy
farmers‟ breeding objectives worldwide became increasingly focused on income from sale of
milk; iii) technology existed to import Holsteins from the USA into other countries. However,
low productive efficiency caused by heat stress among the Holstein breed is a significant issue
faced by the main dairy-producing countries worldwide, for instance, the annual production loss
of the US dairy herd was reported to be more than $900 million/year. Stressful environmental
stimuli are one of the main causes of health issues and deficient immune responses in dairy
cows,10
therefore, heat stress represents a major constraint on animal growth rates, milk yield,
and metabolic immune balance.11
In contrast, dairy cows are relatively resistant to cold stress in
winter due to the presence of subcutaneous fat.12
The ultimate aim of every dairy farm is to
produce the highest milk yield; therefore, an efficient management strategy to maintain the
thermal comfort of dairy cows is of growing importance. Heat stress occurs when the core body
temperature of a given species surpasses the range specified for normal activity due to the total
heat load as well as internal production and the environment exceeding the capacity for heat
dissipation through sweating and panting. Therefore, heat stress has negative impacts on the
health condition of as well as milk production by dairy cows and is associated with serious
economic challenges.13

18
1.4. Temperature−Humidity Index (THI)
An index combining temperature and humidity, the temperature−humidity index (THI),
has been used in assessments of heat stress in cattle to describe categories of heat stress
associated with hot weather for livestock exposed to extreme conditions, even with recognized
limitations related to wind speed and radiation heat loads.14
Previous studies suggested that the
general level of thermal comfort in dairy cows estimated by the THI appeared to be <72,15
with
milk production beginning to decrease when the THI exceeds 72.16
The THI value of dairy
cows producing >35 kg/day of milk was found to be 68.17
Therefore, the sensitivity of dairy
cows to heat stress already appears to be enhanced when milk production increases.18
Because
heat stress gradually increases in dairy cows, precise estimations of the heat load must include a
measure of the intensity of the heat load and the length of time over which animals are exposed
to this stress (for example, THI 78 for a period of >4 h).19
Moreover, convective and radiant
heat exchanges are other factors that contribute to air movement and solar radiation.20
The
presence of sunshine may add several points to the THI, whereas wind may lower it by a few
points because it brings cooler air to animals and carries away excess heat. It is important to
note that the THI value cannot be used as a feasible indicator to alert farmers to any alterations
in an animal‟s metabolic/homeostatic immune balance perturbed by “complicated heat stress”,
whereas the THI may be an important parameter for simply showing the temperature and
humidity of the feeding environment. Farmers have not been able to fully recognize the signs of
cows being physically affected by slight heat stress unless their condition becomes critical.
Moreover, traditional physiological approaches are also insufficient for elucidating a direct
correlation between hormone secretions with adverse effects on animal well-being due to the
stress adaptability of the animal; therefore, the best indicator for identifying animals under
stress is the development of a prepathological state, that is, a stress-related change in biological
functions with suppression of the immune system.21

19
Therefore, the advent of novel and sensitive serum biomarkers to indicate not only the
productivity but also significant changes in the condition of dairy cows caused by unmeasurable
stresses may contribute greatly to improving their thermal comfort, performance, and high-
quality milk productivity.
1.5. Glycosylation
Glycosylation is considered one of the most prevalent post-transitional modifications of
the protein in all eukaryotes. Glycoconjugates are formed when mono-, oligo-, or poly-
saccharides (glycans) are attached to protein or lipid. Those glycans attached to proteins either
through a nitrogen atom of an asparagine (Asn) residue within the consensus sequence Asn-X-
Ser/Thr, (X ≠ Pro) named N-glycan.22
Each glycosylated site may contain many different
glycan structures, oligomannose, in which only mannose residues are attached to the core
(Manα1-6(Manα1-3)Manβ1)-4GlcNAcβ1 -4GlcNAcβ1-Asn-X-Ser/Thr); complex in which
“antenna” initiated by N-acetylglucosaminetransferases (GlcNAcTs) are attached to the core;
and hybrid, in which only mannose residues are attached to the Manα1-6 arm of the core and
one or two antenna are on the Manα1-3 arm.23,24
Glycomics can be performed at the whole organism or an individual cell or tissue type.
In Chapter 4, I discuss about N-glycan analysis of Holstein dairy cow serum. Briefly, the
pretreatment of cows‟ serum glycoproteins was performed to release whole N-glycans using
PNGase F. Glycans were selectively captured by glycoblotting method using BlotGlycoH
beads; methyl esterification of sialic acid residues and trans-iminization reaction to tag N-
glycans with benzyloxyamine (BOA) were carried out on the beads. BOA-tagged N-glycans
were subjected to MALDI-TOF/MS analysis. More details on the pretreatment, glycoblotting,
mass spectrometry.

20
N-Glycosylation
Figure 1.2. Basic structure of glycans.
Post-translational protein glycosylation, (Figure 1.2) is a basic principle for controlling
the structures and functions of most glycoproteins in relation to cellular differentiation,
adhesion, immunity, signal transduction, growth control, and even malignant alterations.25−27
Cell surface glycoproteins produced in the same mammalian cells/tissues often share similar
glycoforms and glycan profiles, and their expression levels appear to be markedly influenced by
environmental stimuli during cell cultivation (exogenous factors) and the genetic background
(endogenous factors).28−31
Protein glycosylation is either N-linked (GlcNAcβ1-Asn linkage with
a minimal amino acid sequence of Asn-X-Ser/Thr, where X ≠ Pro) or O-linked (where GalNAc
is added to Ser or Thr), and GSLs are synthesized by a sequential transfer of sugar residues to a
ceramide lipid anchor (Figure 1.3). Previous studies demonstrated that the N-glycosylation
patterns of major serum glycoproteins (extracellular secretary glycoproteins) were significantly
21
different in patients with various diseases from those in normal human controls.32−36
These
structural alterations in the post-translational glycosylation of major serum proteins may
provide highly sensitive biomarkers to indicate changes in general metabolism and the
homeostatic immune balance directly/indirectly induced by various diseases without any direct
biopsy of the tissues/organs affected. N-glycan structure contains high mannose, hybrid and
complex. Interestingly, the alteration of N-glycan structure/amount is regarded as signals for
cancer, rheumatoid arthritis, inflammations and aberrant physiological, pathological conditions
in human.37
The alteration of the glycan structure in biological species had been acquired to
adapt themselves to various environmental conditions, for example to defend against infection.
However, there is no specific comprehensive N-glycomics focusing on livestock towards the
discovery of environmental stress biomarkers.
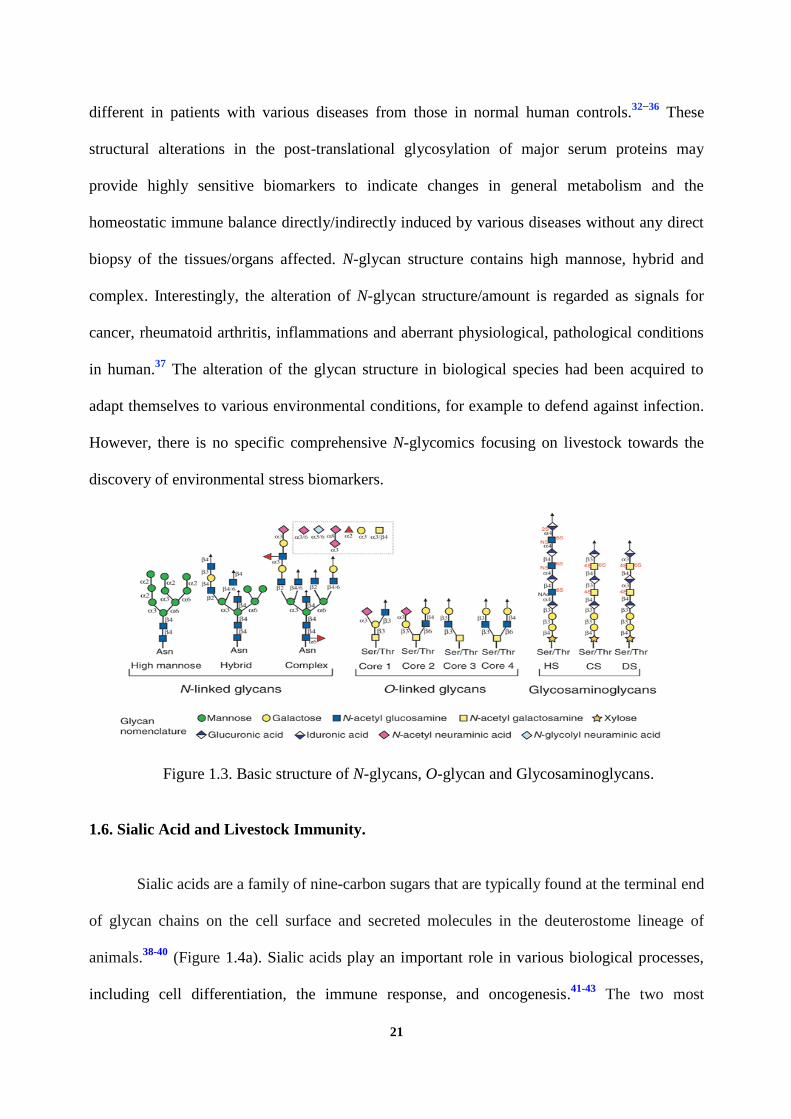
Figure 1.3. Basic structure of N-glycans, O-glycan and Glycosaminoglycans.
1.6. Sialic Acid and Livestock Immunity.
Sialic acids are a family of nine-carbon sugars that are typically found at the terminal end
of glycan chains on the cell surface and secreted molecules in the deuterostome lineage of
animals.38-40
(Figure 1.4a). Sialic acids play an important role in various biological processes,
including cell differentiation, the immune response, and oncogenesis.41-43
The two most

22
common forms of sialic acid are N-acetylneuraminic acid (Neu5Ac) which is predominant in
livestock to prevent pathogens and N-glycolylneuraminic acid (Neu5Gc) provokes the immune
response of bovine species and naturally occurs as endogenous sialic acid,44
and Neu5Gc is
enzymatically produced from Neu5Ac by adding a hydroxyl group. A third sialic acid, 2-keto-3
deoxynonulosonic acid (KDN), is known but is less common in mammals, (Figure 1.4b) while
avian glycomics revealed the existence of N-glycans containing this sialic acid residue in the
egg white of Galloanserae.45
The amino group can also be rarely remained unmodified (Neu)
and is regarded as a fourth sialic acid. These four forms of sialic acids can be further modified in
various ways, and this diversity is increased by attachments to the underlying sugar chains by
different linkages (α2-3, α2-6, and α2-8).38,46-47
This diversity as presented on the cell surface
and secreted molecules has been termed the “sialome”.48
Sialic acids are synthesized from certain precursor molecules or recycled from
glycoconjugates located on the cell surface (Figure 1.4a,b). They can also be taken up from
external sources and metabolically incorporated. The activation of free sialic acid to nucleotide
donors (CMP-Neu5Ac, CMP-Neu5Gc, and CMP-KDN) occurs in the nucleus, and nucleotide
donors are then returned to the cytosol for transport into the lumen of the Golgi apparatus. In the
Golgi, sialic acid residues are transferred from the CMP donors to newly synthesized
glycoconjugates. Finally, sialic acid- containing glycoconjugates are transported to the cell
surface, or secreted. Sialic acids on cell surfaces are often recognized by intrinsic and extrinsic
molecules and play an important role in cell–cell communication and host–pathogen interaction.
The intrinsic recognition is widely involved in many processes including the immune and
nervous systems.38
Elimination of sialic acid production results in embryonic lethality.49
On the
other hand, several pathogens use sialic acid recognition to initiate their infection.38
More than
55 vertebrate genes are involved in these biochemical and biological processes.50

23
A surprisingly large number of these have undergone genomic sequence, expression, or
function changes uniquely in the human lineage.
A.
B.
Figure 1.4. (A) Sialic acids on cell-surface and secreated molecules, which are typically found
at the terminal position of glycan chains on the cell surface and secreted molecules. (B) The
forms of sialic acids Neu, Neu5Ac, Neu5Gc, and KDN.

24
1.7. Glycoblotting Method
The glycoblotting-based systematic procedure for serum, cell, tissue, etc. is as follow
chemoselective ligation of whole N-glycans of serum glycoproteins by “BlotGlyco” beads;
washing; on-bead methylation of sialic acids; trans-iminization by benzyloxiamine to afford
BOA-tagged N-glycans to be analyzed by MALDI-TOFMS (Figure 1.5).
Figure 1.5. Glycoblotting-based systematic procedure for the N-glycomics.
The development of a key universal technology for a glycan specific enrichment
protocol based on the simple nucleophilic addition reactions between hydrazide/aminooxy- and
ketone/aldehyde functional groups, namely, a “glycoblotting method”,37
has allowed, for the
first time, for high throughput and quantitative glycomics of various biological samples
including serum, cultured cells, and tissues. The researchers at Nishimura laboratory
demonstrated that glycoblotting accomplished on the designated bead-platform is the only
method applicable to large-scale clinical glycomics of human whole serum glycoproteins (96
25
samples/plate). This protocol required very small amounts of samples (<100 μL/patient) and,
when combined with the automated system “SweetBlot” and common MALDI-TOFMS,51
took
only 24 h to complete from glycoblotting to the glycoform profiling of 96 human serum
samples. Recent studies revealed that dynamic alterations in the human serum glycoform profile
represent promising diagnostic biomarkers not only in some cancers such as hepatocellular
carcinoma,52-54
pancreatic cancer,55
renal cell carcinoma,56
and prostate cancer,57
but also in
various diseases such as osteoarthritis,58,59
ulcerative colitis,60
nonalcoholic steatohepatitis,61
and diabetic retinopathy.62-63
By employing this approach, we succeeded in obtaining a large
avio-N-glycome database (88 egg white samples of Galloanserae) to investigate the
relationship between the function of glycan diversity and evolutionary lineage in some avian
species.45
Merit of Glycoblotting
Universal platform for glycan sample preparation for MALDI-TOF/MS and DMB-
HPLC; High throughput, fast, and quantitative glycomics of various biological samples
including serum, cultured cells, tissues, and egg white; Easy to perfectly purified and labeled
glycans; Glycans captured by BlotGlyco® beads endure harsh wash. Thereby, impurities, even
peptides and surfactants, are easily removed.
In the present study, I performed, for the first time, large-scale glycomics of dairy
Holstein cow serum samples collected for 9 months in Hokkaido, Japan (between February and
October in 2012), and detected dynamic changes in the expression levels and profiles of the N-
glycan structures of serum glycoproteins as highly sensitive and efficient serum biomarkers to
monitor the heat/environmental stresses influencing the metabolic/homeostatic immune balance,
performance, and milk productivity of dairy cows.

26
Chapter 2
Aim of The Thesis

27
Despite the field of glycomics have been developed by many scientists, it is still time
consuming, in accurate purification process of glycan, and there is no record about large scale
glycomics analysis to detect the environmental stress monthly using climate condition in
livestock in order to improve their productivity, and to detect the mechanism of action of sialic
acid(s) in as a mediator of pathogen infection in neonatal stage of livestock. All these
challenges have also leads to interesting study for almost scientists. In this thesis, I aimed to use
glycoblotting assisted sample preparation combined MALDI-TOF/MS and DMB-HPLC
analysis to estimate the composition and quantify the expression level of the N-glycans from the
serum of dairy cow. This is a novel and sensitive technique to elucidate purified and labeled
glycan easily.
Due to the importance of animal industry and production reported in global survey, it
should be considered worldwide, to reduce the risk of animal exposure to the stress, thus in
chapter 4, I will discuss in a large-scale analysis about the presumptive composition and
expression levels of N-glycans of Holstein cow serum samples to detect the infleunce of
environmental stress monthly based on climate condition and cow production data, to detect the
dynamic changes in the expression levels of N-glycan structures monthly. In order to,
discovering novel glyco-biomarkers for an easy diagnosis and future biomedical indicator of
environmental stress of Holstein cow, which leads to improve cow welfare and to enhance the
milk production.

28
Chapter 3
Materials and Methods

29
3.1. Animal Management
Animal experiments were performed under the approval of the Committee on Animal
Research and Welfare of Hokkaido University. In this study, 336 serum samples were originally
collected at the experimental dairy barn to perform other research programs designed by the
Field Science Center for Northern Biosphere, Hokkaido University, and they were used in a
research agreement to analyze N-glycomics in dairy cow serum samples employing the
glycoblotting method and establish a bovine N-glycome database. Totally 336 serum samples
were collected from lactating Holstein cows (n = 21). The experimental cow serum (n = 12)
were used or might be more whose obtained by using replicate, over 9 months in 2012 between
February and October) to cover the four seasons (spring, summer, autumn, and winter). Among
those 336 serum samples 4% (n = 12) were from primiparous and 96% (n = 324) from the
multiparous cows, and 46% (n = 155) were collected from pregnant cows. The serum samples
were taken outdoor, around Agriculture Faculty inside the campus where cows were exposed to
all climatic stress for grazing behaviour (May to October), but being in a shed while
temperature was not conditioned in winter and spring (April) during the experiment. All
lactating Holstein cows were identified prior to the experiment and mostly housed in an
experimental barn in individual tie stalls between October and April, but grazed on a pasture of
perennial ryegrass/white clover (4 ha), except when being milked (2:30−4:00 p.m., 8:00−10:00
a.m.). Cows were maintained under the same conditions during the experiments. Rations were
frequently changed during the course of the study as part of routine seasonal herd management.
Cows were milked in two milking sessions per day. Parity, body weight, and milk yields were
recorded per cow per milking (morning and evening). Moreover, composited samples were
made from 0.2% of the milk yield to estimate the percentages of fat, protein, and lactose using
MilkoScanS54A. Holstein cows were selected randomly to calculate daily milk production

30
during the experimental period. No specific animal management protocol was necessarily used
in this study because only routinely collected field data were used.
3.2. Chemicals and General Methods
3-Methyl-1-p-tolyltriazene (MTT), ammonium bicarbonate 99% (ABC), 1,2-diamino-
4,5-methylenedioxy-benzene (DMB), sodium 2-hydroxy-3-tetradecanamidopropane-1-sulfonate
[1-propanesulfonic acid, 2-hydroxyl-3-myristamido, sodium salt (1:1); PHM],
disialyloctasaccharide, and O-benzylhydroxylamine hydrochloride (BOA) were obtained from
Tokyo Chemical Industry Co., Ltd. (Tokyo, Japan). BlotGlycoH beads were purchased from
Sumitomo Bakelite, Co., Ltd. (Tokyo, Japan). Peptide N-glycosidase F (PNGase F) was
purchased from New England Biolabs Inc. (Ipswich, MA, USA). Trypsin, dithiothreitol (DTT),
and iodoacetamide (IAA) were purchased from Sigma-Aldrich, Inc. (St. Louis, MO, USA). 5-
N-Acetylneuraminic acid (Neu5Ac) was purchased from Japan Food & Liquor Alliance Inc.,
Food & Bio Research Center (Kyoto, Japan). 5-N-Glycolylneuraminic acid (Neu5Gc) and fetal
bovine serum were from Sigma-Aldrich, Inc. MilkoScanS54A was purchased from Foss
Electric Co., Inc. (Tokyo, Japan). SweetBlot was obtained from Systems Instruments Co., Inc.
(Hachioji, Japan). MultiScreen Solvinert filter plates (0.45 μm low binding hydrophilic PTFE,
MSRLN0410) were purchased from Millipore Co., Inc. (Tokyo, Japan). Mass measurements
were performed using MALDI-TOF/MS (Ultraflex III, Bruker Daltonics, Germany). HPLC was
performed on a Hitachi D-7000, Hitachi High Technologies Co., Ltd. (Tokyo, Japan), and IMB-
SPSS software 22.0 was obtained from IBM Co., Inc. (Armonk, NY, USA).
31
3.3. Cow Serum Preparation.
After being restrained, at least 12 blood samples were collected from each cow each
month. Blood samples were collected into evacuated centrifuge tubes with a capacity of 12 mL.
Approximately 1.5 mL of blood was collected from the jugular vein over the inner surface of
the tube using syringes. All serum samples were then separated by the centrifugation of clotted
blood at 804.96g force for 20 min. Serum samples were clear and free of hemolysis and were
then carefully transferred to new Eppendorf tubes and stored at −80 °C until the N-glycome
analysis.
3.4. Determination of Mean Monthly Climate
The variables (monthly means) of air temperature (°C), maximum temperature (°C),
minimum temperature (°C), mean wind speed (m/s), relative humidity (%), and global solar
radiation (MJ/m2) were recorded in 2012 on the basis of a weather station in Sapporo by the
Japan Meteorological Agency (JMA) server, which provides an online database
(http://www.data.jma.go.jp/obd/stats/data/en/smp/index.html). THI is one of the key parameters
defined by measurements of heat intensity, which has been determined to equal [0.8Ta +
(RH/100)(Ta − 14.3) + 46.4], where Ta means air temperature (°C) and RH defines relative
humidity (%).64
3.5. Glycoblotting-based Serum Glycomics
(A) Pretreatment: The premix composition [0.33 M ABC (2.52 mL), 0.4% PHM in 10
mM ABC (1.26 mL), 120 mM DTT (0.84 mL), and made up to 8.4 mL with water] was initially
prepared, and 50 μL was then freshly added to the serum of each cow (10 μL). The internal
standard (disialyl-octasaccharide) was added carefully (final concentration, 40 μM) and the

32
mixture was incubated at 60oC for 30 min. Ten microliters of freshly prepared 123 mM IAA
was added to the mixture, which was then incubated at 25°C for 60 min in the dark to allow the
alkylation process. The mixture was subsequently treated with trypsin (5 μL, 40 U/μL in 1 mM
HCl) at 37°C for 3 hours, followed by heat inactivation of the enzyme at 90°C for 10 min. After
being cooled to room temperature, N-glycans were enzymatically released from trypsin-
digested glycopeptides by an incubation with 65 units of PNGase F at 37oC for 2 hours. Twenty
microliters of the digested mixture containing N-glycans was directly applied to glycoblotting
technology. (B) Glycoblotting: Five hundred microliters of BlotGlyco®H beads in a 10 mg/mL
suspension with water was initially placed into the wells of a MultiScreen Solvinert®96-well
filter plate, and water was then removed by a vacuum. The digested mixtures of cow serum (20
μL) containing released N-glycan were applied to each well together with 180 μL of 2%
AcOH/CH3CN. The plate was incubated at 80oC for 45 min to dryness in a thermostat in order
to capture the glycans in the sample mixtures onto the beads via stable hydrazone bonds, and
this was followed by successive washing using 200 μL each of 2 M guanidine-HCl in 16.6 mM
ABC and water and 1% triethylamine in MeOH twice each. The acetyl capping of unreactive
hydrazide functional groups was performed using 10% acetic anhydride in MeOH at 25°C for
30 min. The remaining acetic anhydride was removed by a vacuum. In bead methyl
esterification, each well was washed twice with 10 mM HCl, MeOH, and dioxane,
consecutively, and 150 mM MTT was then added, and the plate was incubated at 60oC for 90
min. The beads were serially washed using 200 μL of dioxane, water, methanol, and water. In
order to obtain a perfect transamination reaction, 20 μL of 50 mM BOA was added, followed by
a treatment with 180 μL of 2% AcOH in CH3CN, and an incubation at 80oC for 45 min.
Labeled N-glycans were finally eluted with 100 μL water. The above pretreatment and
glycoblotting of 336 serum samples were performed using SweetBlotTM
, an automated glycan
processing machine. (C) Mass spectrometry: The recovered N-glycans labeled with BOA were

33
finally eluted with 100 μL water, analyzed after being spotted on MTP 384 target plates, and
then crystallized by drying under a vacuum with an equivalent volume of the liquid matrix
solution, 100 mM α-cyano-4-hydroxycinnamic acid diethylammonium salt (CHCA-DEA)
dissolved in buffer solution (MeOH : H2O : DMSO : 10 mM NaOH = 50 : 39 : 10 : 1). MALDI-
TOF/MS data were then displayed on an Ultraflex III, equipped with a reflector and controlled
by the FlexControl 3.0 software package according to the general protocol. All spectral
conditions were obtained using the reflector mode, ions generated by Smartbeam (pulsed UV
solid laser, λex= 355 nm, 50 Hz) with 25 kV as the acceleration voltage, 26.3 kV as the reflector
voltage, 160 ns as pulsed ion extraction in the positive mode, and typically totaling 1,000 shots
of each spot. The intensity of the isotopic peak of each glycan was normalized using 40 μM of
the internal standard (disialyloctasaccharide) for each status, and their concentrations were
calculated from a calibration curve using human serum standards. (D) Data analysis: MS data
were analyzed with the FlexAnalysis 3.0 software (Bruker Daltonik GmbH, Bremen, Germany,
S/N=6, and quality factor threshold of 30). The GlycoMod Tool predicted the possible N-glycan
compositions of the experimental masses, which were mainly reported on GlycoSuiteDB,
(http://web.expassy.org/glycomod/), and non-reported compositions were later checked using
Consortium Functional Glycomics Gateway, (CFG), (http://www.functionalglycomics.org), to
identify and categorize monthly alterations in N-glycan structures of cow serum. N-glycan
profiling was primarily based on sources from the serum of Bos Taurus and other mammals,
especially sources from human serum, cells, and tissue.

34
3.6. Sialic Acid Analysis
Crude mixtures (20 μL each) containing whole N-glycans released from cow serum
glycoproteins were subjected to glycoblotting with BlotGlycoH beads, and the following steps
were performed in a similar manner to that described in procedure B (in Figure 2.6). The beads
capturing whole serum N-glycans in each well were directly treated with 100 μL of 25 mM HCl
at 80 °C for 1 h to hydrolyze N-glycans, without further procedures such as acetyl capping and
methyl esterification described in procedure B. The filtered hydrolysate (100 μL) containing
sialic acids and other monosaccharides was reacted with 100 μL of DMB reagent (7 mM
DMB−2 HCl and 1 M 2-mercaptoethanol to stabilize DMB during the reaction and 18 mM
Na2S2O4 to stabilize the fluorescent products generated from Neu5Ac and Neu5Gc) and then
heated at 60 °C for 2.5 h in the dark to develop fluorescence from the sialic acid derivatives.
The reaction mixture was cooled in ice water for 15 min to stop the reaction, a 10 μL aliquot of
the solution (n = 5) was injected into the HPLC system on a reversed-phase column (Inertsil
ODS- 3 μm, ⌀ 4.6 × 250 mm), and the intensity of fluorescence was then measured (λex = 373
nm, and λem = 448 nm). The HPLC settings were as follows:45
The flow rate was 1 mL/min (ca.
100 kg/cm2) with a MeOH/ACN/H2O mixture (3:1:10, v/v). The column temperature was
ambient (ca. 40 °C). The quantitation of DMB-tagged sialic acids was performed using the
HPLC system equipped with an L-7485 fluorescence detector. The concentrations of sialic acid
derivatives were determined on the basis of calibration curves made using unlabeled Neu5Ac
and Neu5Gc (5, 7.5, 10, 12.5, and 15 pmol/each) as standards (see Figure 3.1).

35
A.
B.
Figure 3.1. Quantitation of Neu5Ac and Neu5Gc by DMB-HPLC method. (A) DMB-HPLC
monitored by fluorescence spectroscopy and the calibration curve of DMB-Neu5Ac. (B)
DMB-HPLC monitored by fluorescence spectroscopy and the calibration curve of DMB-
Neu5Gc.

36
3.7. Statistical Analysis
The expression levels of N-glycans in cow serum are represented as micromolar (mean
± SE). A multivariate analysis was conducted using IMB-SPSS software 22.0, and a one-way
ANOVA was performed. Relationships between variables were analyzed by general linear
model (GLM) procedures to reduce the possibility of random factors introducing variability into
the data and also to allow for the intervention approach. The dependent variable was the
average serum concentration (μM) of N-glycans with different molecular masses (m/z) released
from the serum glycoproteins of cows. Fixed factors included the month of the year. Covariates
appearing in the model included first treatments (parity, days in milk, body weight, and milk
yield) and second treatments (percentages of fat, protein, and lactose in milk). Appropriate
interactions were then examined. The significance of differences between two groups was also
determined using Student‟s t-test. All reported P-values <0.05 for all mean effects were
considered significant.

37
Chapter 4
Results and Discussion

38
4.1. Correlation of Holstein Cows Data and Climatic Change
As shown in Table 4.1, on the basis of some climatic data of Sapporo, Japan, recorded
in 2012, heat stress commonly assessed by the THI was estimated to be maximal in August
(THI = 72.2), during which the effects of solar radiation (14.8 MJ/m2) and rather than low air
velocity (3.3 m/s) may have influenced the performance of cows at an air temperature of
23.4 °C in this month (Figures 4.1−3).65
On the basis of THI values (62.3−70.5), dairy cows
were expected to show higher milk productivity in June, July, and September than in other
months because the THI of dairy Holstein cows producing >35 kg/day of milk was previously
reported to be 68.17
Furthermore, milk production in August was expected to be minimal
because the THI value exceeded 72.15
Table 4.1. Monthly mean climatic data in Sapporo, Japan.
Monthly Mean Jan Feb March April May June July Aug Sept Oct Nov Dec
Wind speed 3.2 3.2 3.4 4.2 4 3.3 3.3 3.4 3.2 3.5 3.4 3.3
Global solar
radiation 6.8 9.7 12.2 15.6 19.1 20.7 19.3 14.8 13.2 9.7 5.1 4.5
Air temperature -4.5 -4.4 0.1 7 13 17.1 21.8 23.4 22.4 13 5.5 -2.3
Relative humidity 67 64 66 66 71 72 74 76 74 69 73 69
THI 30.404 31.112 37.308 47.382 56.077 62.29 69.5 72.23 70.514 56.10 44.576 33.306
These data were recorded in 2012, using a weather station in Sapporo by the Japan Metrological Agency (JMA) server
(http://www.data.jma.go.jp/obd/stats/data/en/smp/index.html). The temperature humidity index (THI) was determined to equal [0.8Ta +
(RH/100) (Ta − 14.3) + 46.4], where air temperature (Ta, °C) and humidity (RH, %) peaked in August, 72.236 (cow suffers from heat
stress).
Figure 4.1. Temperature humidity index (THI), monthly mean air temperature, and relative
humidity.

39
Figure 4.2. Monthly mean air temperature and wind speed.
Figure 4.3. Monthly mean air temperature and global solar radiation.
Table 4.2 shows the statistical interpretation of dairy Holstein cows data collected
during this study (see also Figure 4.4). Moreover, Table 4.3 and Figure 4.5 show the data of
representative cow. These results indicated that animal performance was significantly
influenced by seasonal variations. Monthly changes in milk yield and its composition correlated
with climatological variables and management. Milk yield increased gradually from February
(25.4 kg/day) to spring and reached a maximum in May (36.7 kg/day), see also data of a
representative cow (28.4 and 32.6 kg/day in February and May, respectively). As anticipated,
milk yield in August was lower (24.8 kg/day) than the average, whereas that in October was the
lowest (21.6 kg/day), see also data of a representative cow (22.1, 22 kg/day in August and
October, respectively). The THI value in October was identical to that in May (THI =56.1).
Milk productivity may have decreased gradually from June to October. Furthermore, the

40
contents of protein and fat in milk produced in summer and autumn appeared to be lower than
those in spring and winter, whereas no significant change was observed in the lactose content
(4.36−4.48%), see also data of a representative cow (4.38 and 4.42%). However, days in milk;
the days elapsed from calving during which cows are milked every day were obviously varied
among cows due to different schedules of artificial insemination and calvig date accordingly.
For instance, the days of milk of representative cow #8 supposed to be in February/2012 (97
days in milk), which means this cow had a newly born calf 3 months ago, in November/2011
(calf birth), however, in February/2012 (cow was in maternity with calf of 3 month old) (see
Table. 4.4). These seasonal profiles for milk yield and its constituents may strongly depend on
marked changes in the diet and subsequent metabolic effects on normal microbial protein
synthesis.66
However, difficulties are associated with directly monitoring changes in the profiles
of highly complex metabolites and their effects on the intestinal microbiota. THI values may
contribute to the development of a management system for short-term heat stress and
environmental assessment guidelines to improve animal comfort. However, the relationship
between long-term damage caused by the integration of many environmental stresses and the
performance/milk productivity of lactating Holstein dairy cows currently remains unclear due to
the lack of sensitive biomarkers to indicate alterations in the general metabolism and
homeostatic immune balance of Holstein dairy cows.
A.

41
B
C.
D.

42
E.
F.
G
.
Figure 4.4. (A) Monthly body weight (mean±SD) of Holstein cows (between February
and October). (B) Monthly days in milk (mean±SD) of Holstein cows (between February and
October). (C) Monthly milk yield (mean±SD) of Holstein cows (between February and
October). (D) Monthly parity (mean±SD) of Holstein cows (between February and October).
(E) Monthly lactose% in milk (mean±SD) of Holstein cows (between February and October).
(F) Monthly fat% in milk (mean±SD) of Holstein cows (between February and October). (G)
Monthly protein% in milk (mean±SD) of Holstein cows (between February and October).

43
A.
B
C.

44
D.
E.
F.

45
G.
Figure 4.5. (A) Representative monthly body weight of Holstein cow #8 (between
February and October). (B) Representative monthly days in milk of Holstein cow (between
February and October). (C) Representative monthly milk yield of Holstein cow (between
February and October). (D) Representative monthly parity of Holstein cow (between February
and October). (E) Representative monthly lactose% in milk of Holstein cow (between
February and October). (F) Representative monthly fat% in milk of Holstein cow (between
February and October). (G) Representative monthly protein% in milk of Holstein cow
(between February and October).

Table 4.2. Statistical interpretation (mean±SD) of some of Holstein cow data during the study.
Performance
data Feb March April May June July Aug Sept Oct
Body weight
(kg) 662.25±66.559 698.92±59.336 724.33±60.937* 676.78±64.045 696.43±69.0002 660.42±68.830 653.17±64.279 652.38±68.879 653.21±64.784
Parity # 3.00±1.595 3.00±1.560 3.00±1.595 3.0833±0.874 3.0833±0.8692 3.00±0.922 3.00±0.922 3.00±0.922 3.00±0.922
Days in milk
(day) 188.92±91.193 220.42±89.831 251.92±91.193 118.25±77.270 144.65±77.2679 123.58±71.184 151.58±71.184 179.58±71.184 207.58±71.184
Milk yield
(kg/day) 25.3667±7.489 28.175±7.686 27.2667±8.163 36.7167±6.816*** 32.3183±5.5505 29.1996±4.117 24.7792±4.989 24.3121±4.122 21.6429±4.238
Lactose% in
milk 4.4425±0.082 4.4525±0.103 4.4333±0.056 4.4833±0.074 4.4658±0.0559 4.4537±0.053 4.4133±0.065 4.4332±0.057 4.3575±0.119
Protein% in
milk 3.4058±0.349 3.4767±0.355*** 3.4608±0.268 3.2583±0.248 3.1622±0.3024 2.9296±0.240 2.8821±0.196 2.9287±0.487 3.3527±0.348
Fat% in milk 4.5558±0.534*** 4.2733±0.573 4.3292±0.479 3.5372±0.796 3.5565±0.5181 3.6573±0.640 3.5696±0.657 3.3200±0.696 3.7496±0.656
- A multivariate analysis was conducted using SPSS software with a one-way ANOVA, (asterisks indicate significance level: ***, P ≤ 0.001; **, P ≤ 0.01; ***, P ≤ 0.001; and *, P ≤ 0.05), SD;
standard deviation.
Table 4.3. Some data of representative Holstein cow #8 during the study.
Performance
data Feb March April May June July Aug Sept Oct
Body weight
(kg) 640 677.5 693 657.7 685.4 689 674.5 660.5 635
Parity # 3 3 3 3 3 3 3 3 3
Days in milk
(day) 97 128.5 160 180 206.4 238.5 266.5 294.5 322.5
Milk yield
(kg/day) 28.4 28.75 25.3 32.6 31.6 24.995 22.175 21.7 22.025
Lactose% in
milk 4.41 4.36 4.43 4.42 4.44 4.40 4.38 4.41 4.39
Protein% in
milk 3.44 3.79 3.46 3.48 3.19 3.03 2.96 2.81 2.98
Fat% in milk 4.92 4.76 3.72 3.89 3.62 4.14 3.84 3.71 3.89
- The cow was randomly selected to show the performance data during the study. 46

47
Table 4.4. Etimated maternity state of Holstein cows during the study.
Cow
#
Cummulative
Days in
Milk/Month
Calving
Month
Month Next
Calving
Date Feb March April May June July Aug Sept Oct
Winter Spring Summer Autumn
1 203 days/Feb 7/2011 - - - - - - - - -
2 278 days/Feb 5/2011 - - - 1st Month 2nd Month 3rd Month 4th Month 5th Month 6th Month 18/02/2013
3 216 days/Feb 07/2011 - - - - - - - - -
4 69 days/Feb 12/2011 maternal care - - 1st Month 2nd Month 3rd Month 4th Month 5th Month 6th Month 02/02/2013
5 229 days/Feb 05/2011 - - - - - - - - -
6 234 days/Feb 06/2011 - - - - - - - - -
7 277 days/Feb
26.5 days/July
05/2011
06/2012 6th Month 7th Month 8th Month 9th Month calf birth maternal care maternal care maternal care -
8 97 days/Feb 11/2011 maternal care - - 1st Month 2nd Month 3rd Month 4th Month 5th Month 6th Month 11/02/2013
9 27 days/Feb 1/2012 maternal care - - - - - 1st Month 2nd Month 3rd Month 23/05/2013
10 73.5 days/May 3/2012 9th Month calf birth maternal care maternal care 1st Month 2nd Month 3rd Month 4th Month 5th Month 07/03/2013
11 52 days/May 3/2012 9th Month calf birth maternal care maternal care 1st Month 2nd Month 3rd Month 4th Month 5th Month 15/03/2013
12 47 days/May 4/2012 8th Month 9th Month calf birth maternal care maternal care maternal care 1st Month 2nd Month 3rd Month 17/05/2013
13 85 days/May 2/2012 calf birth maternal care maternal care maternal care - - - - - 04/08/2013
14 44 days/May 3/2012 9th Month calf birth maternal care maternal care maternal care - - - 1st Month 03/07/2013
15 103 days/Feb 11/2011 maternal care - - - - - - - - 30/11/2013
16 82 days/May 2/2012 calf birth maternal care maternal care maternal care - 1st Month 2nd Month 3rd Month 4th Month 28/04/2013
17 33.5 days/July 6/2012 6th Month 7th Month 8th Month 9th Month calf birth maternal care maternal care 1st Month 2nd Month 22/06/2013
18 303 days/Feb
21.3 days/July
4/2011
6/2012 6th Month 7th Month 8th Month 9th Month calf birth maternal care maternal care maternal care - 06/10/2013
19 231 days/Feb
82.5 days/Sept
6/2011
6/2012 6th Month 7th Month 8th Month 9th Month calf birth maternal care maternal care maternal care 1st Month 02/07/2013
20 86 days/May 2/2012 calf birth maternal care maternal care 1st Month 2nd Month 3rd Month 4th Month 5th Month 6th Month 27/02/2013
21 114 days/July 3/2012 9th Month calf birth maternal care maternal care 1st Month 2nd Month 3rd Month 4th Month 5th Month 13/03/2013
- Based on the days of milk, the estimated monthly calving of cows was conducted during the experiment, (”-”) was not pregnant cow. However, there is no accurate interval time after calving for making an
artificial insemination unless the cow and her calf confirmed to be in a healthy condition. The cow gestation period is 9 months, and the weaning time of calf is 3 month old.

4.2. Large-Scale Serum N-glycomics of Holstein Cows
Figure 4.6 shows a schematic procedure for Holstein cow serum N-glycomics based on
the glycoblotting method. In the present study, whole serum N-glycans captured on the beads
were divided into two portions to concurrently perform common N-glycan profiling (steps
A−D) and its quantitative sialic acid analysis (step E) by modifying an original protocol
established for the glycomics of avian egg white.45
The expression levels of two major sialic
acids, Neu5Ac and Neu5Gc, in the glycoproteins/glycosphingolipids synthesized by common
mammalian cells, except for human cells, may be critical to indicate marked changes in the
metabolic immune balance as well as seasonal alterations in total serum N-glycan profiles.
Figure 4.6. Glycoblotting-based systematic procedure for the large-scale glycomics of
Holstein dairy cow serum samples. (A) chemoselective ligation of whole N-glycans of
serum glycoproteins by “BlotGlyco” beads; (B) washing; (C) on-bead methylation of
sialic acids; (D) trans iminization by benzyloxiamine to afford BOA-tagged N-glycans
to be analyzed by MALDI-TOFMS; (E) selective DMB-labeling of the terminal sialic
acids of total serum N-glycans to be employed for the quantitative HPLC analysis of
serum sialic acids derived from N-glycans of total glycoproteins.
48

49
In the present study, I selected 36 key N-glycans in Figure 4.7A and monitored their
expression levels because these ion peaks (m/z) were detected in ≥80% of the cow serum samples
tested herein. Moreover, Figure 4.8A showed the N-glycan peaks of representative cow. Although
32 peaks (88.8%) were found in GlycosuitDB and the rest were reported in the database of CFG,
only 28 of the N-glycan structures were sourced from the serum of Bos taurus species, whereas
the others were sourced from other species. Unidentified mass peaks with significant intensities
may have been due to free reducing oligosaccharides captured by the glycoblotting procedure;
however, their metabolic pathways and biological functions have not yet been elucidated in detail.
The molecular masses (m/z) and estimated sugar compositions of N-glycans derived from
Holstein cow serum glycoproteins are summarized in Table 4.5. Holstein cow serum N-glycans
have been categorized into 5 high-mannose types (13.9%), 8 hybrid types (22.2%), and 23
complex types (63.9%), shown in Figure 4.9. Changes in the monthly serum expression levels of
these 36 N-glycans represented as micromolar (normalized on the basis of 100 μg of serum
proteins) between February and October (see Figure 4.7B and Table 4.7). More information of
representative cow, see Figure 4.8B and Table 4.9.

50
A.

51
B.
Figure 4.7. Large-scale N-glycan profiling of Holstein dairy cows serum glycoproteins by
using a standard protocol combining the glycoblotting method and MALDI-TOF/MS, as
represented in Figure 4.6: (A) MALDI-TOF/MS spectra showing typical N-glycan profiles
of Holstein dairy cow serum collected each month; (B) monthly changes in the expression
levels of the 36 major N-glycans selected from Holstein cow serum glycoproteins. Peak 26
detected at m/z 2175 means internal standard (IS) spiked (normalized as 40 μM).

52
A.

53
B.
Figure 4.8. Representative N-glycan profiling of Holstein dairy cow serum glycoproteins
of cow #8 by using a standard protocol combining the glycoblotting method and MALDI-
TOF/MS, as represented in Figure 4.6: (A) MALDI-TOF/MS spectra showing typical N-
glycan profiles of Holstein dairy cow serum collected each month; (B) monthly changes
in the expression levels of the 36 major N-glycans selected from Holstein cow serum
glycoproteins. Peak 26 detected at m/z 2175 means internal standard (IS) spiked
(normalized as 40 μM).
Figure 4.9. Serum N-glycan % of Holstein cow.

Table 4.5. Estimated compositions of 36 major N-glycans of Holstein cow serum glycoproteins selected.
Common N-glycans from serum of Holstein cow
Peak
# m/z
ExPasy
MW Composition
Estimated
structure Type
Link (source)
1 1362.6 1216.42 (Hex)2 + (Man)3 (GlcNAc)2 High Mannose UniCarbKB (a)
2 1444.65 1298.48 (HexNAc)2 + (Man)3 (GlcNAc)2 Complex UniCarbKB (a)
3 1524.66 1378.48 (Hex)3 + (Man)3 (GlcNAc)2 High Mannose UniCarbKB (a)
4 1533.25 1387.51 (HexNAc)1 (Deoxyhexose)2 + (Man)3 (GlcNAc)2 Hybrid UniCarbKB (b)
5 1549.68 1403.51 (Hex)1 (HexNAc)1 (Deoxyhexose)1 + (Man)3 (GlcNAc)2 Hybrid UniCarbKB (a)
6 1590.72 1444.53 (HexNAc)2 (Deoxyhexose)1 + (Man)3 (GlcNAc)2 Complex UniCarbKB (a)
7 1606.72 1460.53 (Hex)1 (HexNAc)2 + (Man)3 (GlcNAc)2 Hybrid UniCarbKB (a)
8 1686.68 1540.53 (Hex)4 + (Man)3 (GlcNAc)2 High Mannose UniCarbKB (a)
9 1708.72 1548.54 (Hex)1 (HexNAc)1 (NeuAc)1 + (Man)3 (GlcNAc)2 Hybrid UniCarbKB (b)
10 1727.74 1581.56 (Hex)3 (HexNAc)1 + (Man)3 (GlcNAc)2 Hybrid UniCarbKB (a)
11 1752.77 1606.59 (Hex)1 (HexNAc)2 (Deoxyhexose)1 + (Man)3 (GlcNAc)2 Complex UniCarbKB (a)
12 1768.78 1622.58 (Hex)2 (HexNAc)2 + (Man)3 (GlcNAc)2 Complex UniCarbKB (a)
13 1793.77 1647.61 (HexNAc)3 (Deoxyhexose)1 + (Man)3 (GlcNAc)2 Complex UniCarbKB (a)
14 1848.77 1702.58 (Hex)5 + (Man)3 (GlcNAc)2 High Mannose UniCarbKB (a)
15 1886.77 1726.59 (Hex)2 (HexNAc)1 (NeuGc)1 + (Man)3 (GlcNAc)2 Hybrid CFG (c)
16 1914.83 1768.64 (Hex)2 (HexNAc)2 (Deoxyhexose)1 + (Man)3 (GlcNAc)2 Complex UniCarbKB (a)
17 1930.82 1784.63 (Hex)3 (HexNAc)2 + (Man)3 (GlcNAc)2 Complex UniCarbKB (a)
18 1955.84 1809.67 (Hex)1 (HexNAc)3 (Deoxyhexose)1 + (Man)3 (GlcNAc)2 Complex UniCarbKB (a)
19 2010.81 1864.63 (Hex)6 + (Man)3 (GlcNAc)2 High Mannose UniCarbKB (a)
20 2032.91 1872.65 (Hex)3 (HexNAc)1 (NeuAc)1 + (Man)3 (GlcNAc)2 Hybrid UniCarbKB
(b)
54

55
21 2048.86 1888.65 (Hex)3 (HexNAc)1 (NeuGc)1 + (Man)3 (GlcNAc)2 Hybrid CFG
(d)
22 2073.87 1913.68 (Hex)1 (HexNAc)2 (Deoxyhexose)1 (NeuGc)1 + (Man)3 (GlcNAc)2 Complex
CFG (f)
(Hex)2 (HexNAc)2 (NeuAc)1 + (Man)3 (GlcNAc)2 UniCarbKB (a)
23 2076.89 1930.69 (Hex)3 (HexNAc)2 (Deoxyhexose)1 + (Man)3 (GlcNAc)2 Complex UniCarbKB (a)
24 2089.88 1929.67 (Hex)2 (HexNAc)2 (NeuGc)1 + (Man)3 (GlcNAc)2 Complex UniCarbKB (a)
25 2117.9 1971.72 (Hex)2 (HexNAc)3 (Deoxyhexose)1 + (Man)3 (GlcNAc)2 Complex UniCarbKB (a)
26 2175.91 2001.69 IS: (Hex)2 (HexNAc)2 (NeuAc)2 + (Man)3 (GlcNAc)1
27 2219.57 2059.74 (Hex)2 (HexNAc)2 (Deoxyhexose)1 (NeuAc)1 + (Man)3 (GlcNAc)2 Complex UniCarbKB (a)
28 2235.93 2075.73 (Hex)2 (HexNAc)2 (Deoxyhexose)1 (NeuGc)1 + (Man)3 (GlcNAc)2 Complex UniCarbKB (a)
29 2238.98 2092.75 (Hex)4 (HexNAc)2 (Deoxyhexose)1 + (Man)3 (GlcNAc)2 Complex UniCarbKB (a)
30 2251.6 2091.72 (Hex)3 (HexNAc)2 (NeuGc)1 + (Man)3 (GlcNAc)2
Complex CFG (d)
31 2318.24 2157.78 (Hex)1 (HexNAc)4 (NeuAc)1 + (Man)3 (GlcNAc)2
Complex UniCarbKB (c)
32 2378.95 2204.77 (Hex)2 (HexNAc)2 (NeuAc)2 + (Man)3 (GlcNAc)2 Complex UniCarbKB (a)
33 2411 2236.76 (Hex)2 (HexNAc)2 (NeuGc)2 + (Man)3 (GlcNAc)2 Complex UniCarbKB (a)
34 2525.07 2350.83 (Hex)2 (HexNAc)2 (Deoxyhexose)1 (NeuAc)2 + (Man)3 (GlcNAc)2 Complex UniCarbKB (a)
35 2557.07 2382.82 (Hex)2 (HexNAc)2 (Deoxyhexose)1 (NeuGc)2 + (Man)3 (GlcNAc)2 Complex UniCarbKB (a)
36 3227.32 3039.05 (Hex)3 (HexNAc)3 (Deoxyhexose)1 (NeuAc)1 (NeuGc)2 + (Man)3 (GlcNAc)2 Complex CFG (e)
37 3243.39 3055.04 (Hex)3 (HexNAc)3 (Deoxyhexose)1 (NeuGc)3 + (Man)3 (GlcNAc)2 Complex UniCarbKB (e)
(a) Glycosuit and/or CFG database of cow N-glycan structures,
(b) not identified in cow (reported in human),
(c) "no source",
(d) "not classified species",
(e) not identified
structure in cow (reported in pig), and (f)
not identified structure in cow (reported in mouse). Peak #26 is a spiked internal standard (quantification). Compositional annotation
and estimated structures by GlycoMod (ExPASy proteomics server, Swiss Institute of Bioinformatics (http://www.expasy.ch/tools/glycomod/). However, the non-reported
structures from the CFG database. Higher m/z values observed in the experimental results than those of Expasy (M/W) are due to the BOA labeling (+123 m/z) in addition to
(+23 m/z) Na adduct under laser irradiation in MALDI. The esterification of sialic acid residues also increases the mass of N-glycans (+14 m/z per sialic acid residue). N-
glycan cartoons were conducted using the standard symbol nomenclature as follow, HexNAc, N-acetylhexosamine (GlcNAc, N-acety-D-lglucosamine [blue square] or
GalNAc, N-acetylgalactosamine [yellow square] depends on the description); Deoxyhexose, fucose [red triangle]; Hex, hexose (Mannose [green circle], and galactose [yellow
circle] depend on the description); Neu5Ac, 5-N-acetylneuraminic acid [purple diamond]; and Neu5Gc, 5-N-glycolylneuraminic acid [white diamond].

These results showed that the serum expression levels of some characteristic N-glycan
structures were altered in a seasondependent manner and appeared to peak in some months. A
multivariate analysis clearly indicated that monthly expression levels of these N-glycoforms
(μM ± SE, P < 0.001) fit the general linear model and reached the highest level in four
different months as follows: April (peaks 1, 3, 8, 14, and 19 at m/z 1363, 1525, 1687, 1849, and
2011 corresponding to high-mannose type N-glycans assigned as M5−M9) (4.9364 ± 0.3080,
6.9217 ± 0.3997, 1.8851 ± 0.1235, 4.39 ± 0.29874, and 4.0085 ± 0.2378); August (peaks 36
and 37 at m/z 3227 and 3243 corresponding to complex type N-glycans carrying three sialic
acid residues, 3 × Neu5Gc) (0.5919 ± 0.0400, 1.7468 ± 0.1005); October (peaks 24 and 28 at
m/z 2090 and 2236 corresponding to complex type N-glycans bearing one sialic acid residue, 1
× Neu5Gc) (18.2121 ± 1.197, 11.5736 ± 0.877); and February (peaks 32 and 34 at m/z 2379
and 2525 corresponding to complex type N-glycans bearing two sialic acid residues, 2 ×
Neu5Ac) (17.182 ± 2.27498, 3.3818 ± 0.22556) (Figure 4.10 and Table 4.6; see also Table 4.7).
Interestingly, the result of the serum expression levels of these characteristic N-glycan
structures of representative cow clearly confirmed the result of multivariate analysis. For
instance: April (peaks 1, 3, 8, 14, and 19 corresponding to high-mannose type N-glycans) (4.99,
7.701, 1.99, 5.194, and 4.983); August (peaks 36 and 37 corresponding to complex type N-
glycans carrying three sialic acid residues, 3 × Neu5Gc) (0.478, 1.393); October (peaks 24 and
28) (31.498, 11.664 corresponding to complex type N-glycans bearing one sialic acid residue, 1
× Neu5Gc); and February (peaks 32 and 34) (17.475, 4.451 corresponding to complex type N-
glycans bearing two sialic acid residues, 2 × Neu5Ac) (Figure 4.11 and Table 4.9).
56

57
Figure 4.10. Some seasonally relevant serum N-glycoforms of Holstein dairy cows given by a
statistical analysis of expression levels and plausible biosynthetic pathways (see also Tables 4.7
and 4.7). Peak 26 at 2175.91 indicates an internal standard spiked, [(Hex)2 (HexNAc)2
(Neu5Ac)2 + (Man)3 (GlcNAc)1], and the final concentration was adjusted to 40 μM.

58
Figure 4.11. Representative MALDI-TOF/MS spectra of some seasonally relevant serum N-
glycoforms of Holstein dairy cow given by the high expression levels and plausible biosynthetic
pathways (see also Tables 4.9). Peak 26 at 2175.91 indicates an internal standard spiked, [(Hex)2
(HexNAc)2 (Neu5Ac)2 + (Man)3 (GlcNAc)1], and the final concentration was adjusted to 40 μM.

Table 4. 6. Specific serum N-glycans as biomarkers showing correlations with some characteristic data of dairy Holstein cows
Specific peaks of N-glycans from serum of Holstein cow
Peak
# m/z Treatment
Month
February March April May June July August September October Estimated
structure
1 1362.61
(a) 3.895a±0.25 4.609a±0.18 5.006a±0.26*** 4.011a±0.169 3.995a±0.12 3.945a±0.13 3.233a±0.13 3.642a±0.133 3.701a±0.14
(b) 3.782a±0.27 4.345a±0.20 4.781a±0.26** 3.718a±0.157 3.859a±0.11 4.045a±0.13 3.489a±0.14 3.761a±0.136 3.818a±0.14
3 1524.66
(a) 5.316a±0.44 5.567a±0.31 6.986a±0.45 5.400a±0.289 5.963a±0.21 6.357a±0.22 5.939a±0.23 6.356a±0.227 5.651a±0.24
(b) 5.108a±0.47 5.332a±0.35 6.765a±0.46 5.306a±0.272 5.942a±0.20 6.426a±0.23 6.084a±0.25 6.407a±0.234 5.689a±0.24
8 1686.68
(a) 1.372a±0.1 1.658a±0.07 1.863a±0.10** 1.365a±0.066 1.593a±0.04 1.620a±0.05 1.555a±0.05 1.494a±0.052 1.649a±0.05
(b) 1.397a±0.10 1.703a±0.08 1.913a±0.10*** 1.380a±0.062 1.609a±0.04 1.607a±0.05 1.526a±0.05 1.463a±0.054 1.639a±0.05
14 1848.77
(a) 3.341a±0.23 3.615a±0.17 4.407a±0.245* 3.422a±0.157 3.931a±0.11 3.939a±0.12 4.086a±0.12 3.935a±0.124 4.033a±0.13
(b) 3.180a±0.25 3.424a±0.19 4.252a±0.25* 3.257a±0.147 3.893a±0.10 3.981a±0.12 4.229a±0.13 3.981a±0.126 4.109a±0.13
19 2010.81
(a) 3.132a±0.20 3.576a±0.15 4.015a±0.21 3.376a±0.137 3.654a±0.1 3.718a±0.10 3.766a±0.11 3.614a±0.108 3.598a±0.11
(b) 3.010a±0.22 3.432a±0.16 3.896a±0.21 3.246a±0.129 3.615a±0.09 3.747a±0.11 3.877a±0.12 3.676a±0.111 3.661a±0.11
36 3227.32
(a) 0.365a±0.07 0.442a±0.05 0.408a±0.07 0.403a±0.046 0.462a±0.03 0.469a±0.032 0.586a±0.03 0.525a±0.034 0.448a±0.04
(b) 0.305a±0.076 0.382a±0.06 0.360a±0.076 0.373a±0.042 0.451a±0.028 0.479a±0.033 0.623a±0.037** 0.545a±0.034 0.460a±0.043
37 3243.39
(a) 1.043a±0.16 1.034a±0.12 0.933a±0.17 0.980a±0.109 1.171a±0.07 1.415a±0.08 1.745a±0.08*** 1.490a±0.086 1.036a±0.09
(b) 0.964a±0.179 0.970a±0.13 0.906a±0.175 0.877a±0.102 1.134a±0.07 1.403a±0.08 1.805a±0.09*** 1.541a±0.088 1.105a±0.09
59

60
24 2089.88
(a) 14.424a±2.1 14.349a±1.5 14.567a±2.2 14.104a±1.44 16.300a±1.0 17.519a±1.1 17.512a±1.1 16.370a±1.13 18.091a±1.20
(b) 14.201a±2.3 13.885a±1.7 14.446a±2.2 13.272a±1.34 16.053a±0.9 17.877a±1.1 18.231a±1.2 16.952a±1.15 17.988a±1.21
28 2235.93
(a) 9.944a±1.54 9.960a±1.12 11.421a±1.5 8.792a±1.016 10.125a±0.7 8.597a±0.78 9.175a±0.80 9.501a±0.799 11.596a±0.84
(b) 10.809a±1.6 10.345a±1.2 11.537a±1.6 8.928a±0.957 10.236a±0.7 8.860a±0.81 9.018a±0.88 9.131a±0.825 11.123a±0.86
32 2378.95
(a) 17.554a±1.7*** 12.836a±1.2 12.255a±1.7 11.194a±1.15 9.536a±0.83 8.583a±0.89 7.754a±0.91 8.046a±0.906 8.723a±0.96
(b) 15.997a±1.8* 12.034a±1.4 11.563a±1.8 11.872a±1.08 10.192a±0.8 8.625a±0.92 7.738a±1.00 7.994a±0.933 8.441a±0.97
34 2525.07
(a) 3.386a±0.19*** 3.178a±0.14 2.931a±0.2 3.055a±0.128 2.756a±0.09 2.414a±0.09 2.496a±0.10 2.235a±0.101 2.337a±0.107
(b) 3.280a±0.2*** 3.099a±0.15 2.843a±0.20 3.071a±0.119 2.781a±0.08 2.439a±0.10 2.527a±0.11 2.271a±0.103 2.294a±0.107
- Multivariate analyses were performed to evaluate correlations with (a) covariates I “body weight, parity, milk yield, and days in milk” and (b)
covariates II “fat, protein, and lactose % in milk”, respectively. Dependent variables were the average serum concentrations (μM) of N-glycans at
each mass peak (m/z), and fixed factors included the month of the year appearing in the general linear model, SPSS software. N-glycan structures
are represented using the standard symbol nomenclature as follows: HexNAc, N-acetylhexosamine (GlcNAc, N-acetylglucosamine (blue square) or
GalNAc, N-acetylgalactosamine (yellow square) depending on the description); deoxyhexose, fucose (red triangle); Hex, hexose (mannose (green
circle) and galactose (yellow circle) depending on the description); Neu5Ac, 5-N-acetylneuraminic acid (purple diamond); and Neu5Gc, 5-N-
glycolylneuraminic acid (white diamond). A multivariate analysis was conducted by SPSS software with a one-way ANOVA, in which”red
results” was not detected. Asterisks show significance level: ***, P ≤ 0.001; **, P ≤ 0.01; *, P ≤ 0.05.

61
Table 4.7. N-glycome expression levels (μM ± SE) of the serum glycoproteins of Holstein cow between February and October.
Peak
# m/z February March April May June July August September October
1 1362.61 3.9199±0.14413 4.549±0.20705 4.9364±0.308*** 3.8772±0.1411 3.9289±0.11307 3.959±0.13157 3.3053±0.11796 3.6982±0.142 3.7866±0.1192
2 1444.65 2.071±0.16391 2.6376±0.1810 2.8045±0.32055 2.3375±0.136 2.2483±0.11307 2.3284±0.13079 2.3925±0.14091 2.4956±0.165 2.414±0.13966
3 1524.66 5.2963±0.22606 5.5126±0.2657 6.9217±0.399 5.3811±0.1580 5.9725±0.16445 6.4005±0.20298 5.974±0.26452 6.351±0.2828 5.6291±0.2386
4 1533.25 - 4.0702±0.2070 3.5529±0.30809 3.0566±0.1411 2.9198±0.11307 2.6169±0.13157 2.7518±0.11796 2.5762±0.142 2.7801±0.1192
5 1549.67 0.7421±0.06974 1.1757±0.0967 1.0418±0.10342 0.9522±0.0652 0.8676±0.03843 0.8378±0.03893 0.8261±0.05439 0.7289±0.040 0.9026±0.0532
6 1590.72 7.8325±1.01491 9.6377±0.6417 11.1585±1.0127 7.6569±0.5343 7.9923±0.45233 8.374±0.49254 7.8203±0.46348 7.8409±0.500 8.3374±0.5518
7 1606.71 7.0512±0.75789 9.1319±0.7613 10.295±1.2304 8.3254±0.4257 7.3236±0.43513 7.1027±0.48733 7.4032±0.52593 8.1025±0.489 7.262±0.56044
8 1686.68 1.3689±0.05749 1.6703±0.0820 1.8851±0.123*** 1.3618±0.0344 1.6016±0.04595 1.617±0.05116 1.5501±0.05984 1.4869±0.046 1.6438±0.0488
9 1708.71 1.124±0.12215 1.3214±0.0916 1.2828±0.11048 1.1156±0.0468 0.9877±0.04557 1.0212±0.06102 0.9972±0.05319 0.9335±0.054 1.0945±0.0573
10 1727.74 2.9935±0.19 2.9445±0.1495 3.5356±0.29498 2.7583±0.0691 2.9549±0.08918 2.8139±0.11826 2.4807±0.08806 2.72±0.09474 3.0187±0.0863
11 1752.77 32.8607±4.9099 33.9478±2.778 44.0812±5.8344 28.1268±2.803 33.7016±1.8399 32.3857±1.83085 29.5508±2.0218 30.3988±1.91 32.5758±3.066
12 1768.78 9.8193±1.11027 11.3113±1.133 12.8438±1.3938 9.6932±0.6676 9.1719±0.65638 9.1788±0.67472 10.1649±0.6829 10.549±0.763 11.7021±0.740
13 1793.77 4.4345±0.37823 5.1747±0.3008 5.3804±0.57866 4.7537±0.2363 4.8811±0.20339 5.2589±0.28992 5.7962±0.36787 6.0867±0.338 6.0735±0.3282
14 1848.77 3.346±0.14784 3.5779±0.1454 4.39±0.29874** 3.3082±0.1034 3.9109±0.11261 3.9563±0.13173 4.1387±0.12137 3.9585±0.131 4.0747±0.1151
15 1886.77 1.1627±0.10177 1.6414±0.2160 1.6885±0.16591 1.3221±0.0685 1.3643±0.05225 1.3671±0.03978 1.4758±0.03638 1.3876±0.049 1.4859±0.0651
16 1914.83 41.3903±6.0247 49.8067±3.589 53.5951±6.8697 45.6033±2.306 43.3027±2.0896 39.7395±2.68272 34.5167±2.9262 37.3794±2.61 42.1001±2.642
17 1930.83 2.4841±0.21117 3.5461±0.4936 2.8897±0.1892 2.7518±0.1535 3.2415±0.27693 2.9783±0.14169 3.2813±0.1116 3.1995±0.245 3.4129±0.1941
18 1955.84 5.8502±0.89391 8.6881±0.5845 9.9325±1.0258 6.7123±0.4363 7.2796±0.34094 7.724±0.40748 7.7944±0.55463 9.301±0.4887 9.4072±0.5256
19 2010.81 3.1431±0.17005 3.5559±0.1429 4.0085±0.237 3.2862±0.1034 3.628±0.10175 3.723±0.112 3.8033±0.10175 3.6388±0.106 3.6405±0.0940
20 2032.91 1.1182±0.08837 1.1528±0.0816 1.1911±0.14363 1.0194±0.0498 1.0044±0.03668 0.9834±0.04986 0.9595±0.04603 0.8618±0.043 0.9851±0.0476
21 2048.86 0.9198±0.11582 0.9673±0.0717 1.2935±0.11986 0.8957±0.0515 1.0038±0.04406 1.0821±0.05385 1.0718±0.0402 1.0241±0.053 1.1571±0.0542
22 2073.87 9.1094±1.65309 8.8677±1.1455 9.1719±1.45003 8.8058±0.7042 8.1498±0.51109 7.3482±0.54233 7.5075±0.68405 7.0002±0.530 7.7308±0.4715
23 2076.89 2.6104±0.15961 2.8211±0.1455 3.1662±0.32045 2.5138±0.0626 2.5503±0.06636 2.4944±0.06792 2.5362±0.05797 2.4654±0.059 2.6669±0.0563
24 2089.88 14.4745±1.6102 14.5556±1.323 14.9618±2.5238 13.8732±0.87 16.3035±0.8622 17.3736±1.0397 17.4766±1.4241 16.3838±1.08 18.2121±1.19
25 2117.89 5.4668±0.60491 8.0593±0.6517 7.5889±1.0466 7.1273±0.2146 6.585±0.19994 6.3829±0.18665 6.3104±0.32023 6.4554±0.319 7.4375±0.2823
27 2219.57 - 4.3049±0.3557 3.5553±0.40754 3.6295±0.0947 3.4224±0.09824 2.9172±0.12969 3.4537±0.0976 3.3549±0.114 2.9606±0.1297
28 2235.93 9.8593±1.23784 9.4806±1.1494 10.803±1.85661 8.5567±0.7553 10.0714±0.6021 8.8955±0.77775 9.502±0.81124 9.5565±0.780 11.5736±0.87
29 2238.98 5.995±0.22094 6.6253±0.2366 7.4279±0.4786 5.9999±0.1632 6.3261±0.15655 6.261±0.1761 6.5919±0.19926 6.3662±0.153 6.8794±0.1216
30 2251.6 2.3392±0.12549 2.6347±0.1947 2.7086±0.20195 2.3957±0.0698 2.5727±0.12625 2.5335±0.08485 2.9193±0.07758 2.7024±0.117 2.8882±0.1041
31 2318.24 3.0872±0.22258 3.6544±0.2731 3.2048±0.30231 2.9727±0.1398 3.0661±0.13657 3.0633±0.15146 3.3921±0.23175 3.0699±0.231 3.2562±0.1708
32 2378.95 17.182±2.274*** 12.8175±1.817 12.3291±2.6503 11.8628±1.248 10.1646±0.6904 8.8066±0.82594 7.5391±0.67546 7.5779±0.701 7.9739±0.7498
33 2411 35.2825±4.2887 37.52±3.24869 51.1407±6.9979 33.092±2.7784 44.7274±2.2048 48.6048±2.71908 40.7311±3.2009 43.8459±3.30 48.5359±3.637
34 2525.07 3.3818±0.225*** 3.1722±0.1998 2.9267±0.26987 3.0485±0.0921 2.7602±0.08421 2.4204±0.0932 2.5013±0.0871 2.2327±0.079 2.3324±0.0961
35 2557.07 7.7943±0.87022 8.3507±0.8878 9.4348±1.02103 7.2503±0.4328 8.8882±0.42608 8.3294±0.56529 8.5823±0.63158 8.4875±0.573 8.3548±0.6035
36 3227.32 0.366±0.02846 0.4373±0.0398 0.4026±0.04436 0.3913±0.0229 0.4582±0.02258 0.4703±0.02787 0.5919±0.04** 0.528±0.0453 0.4551±0.035
37 3243.39 1.0681±0.15023 1.0676±0.0999 0.9946±0.12251 0.9086±0.0756 1.144±0.06812 1.3838±0.085 1.7468±0.10*** 1.5131±0.095 1.0896±0.0822
- Based on protein concentration 100 µg proteins for N-glycans and 10 µL of serum glycoproteins of each sample. A multivariate statistical analysis
was conducted by SPSS software, one-way ANOVA, (”-”) was not detected, the asterisk”***” showed a significance level, P ≤ 0.001,”**” showed a
significance level, P ≤ 0.01.
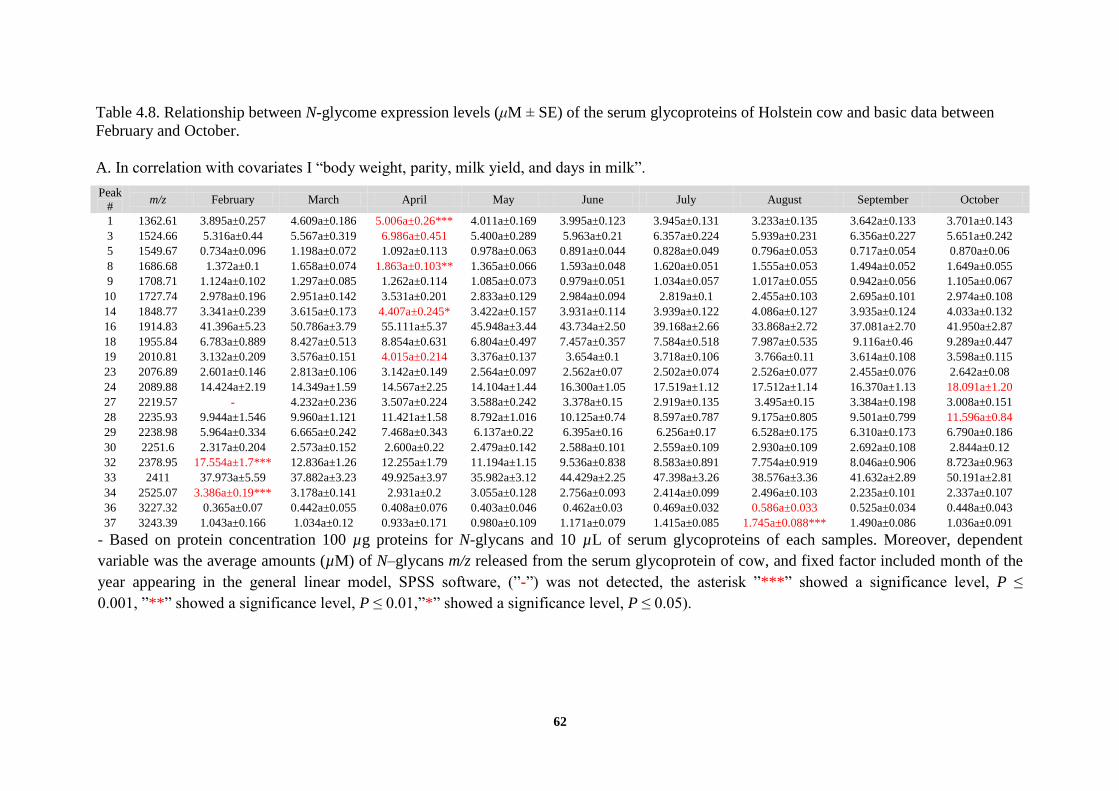
62
Table 4.8. Relationship between N-glycome expression levels (μM ± SE) of the serum glycoproteins of Holstein cow and basic data between
February and October.
A. In correlation with covariates I “body weight, parity, milk yield, and days in milk”.
Peak
# m/z February March April May June July August September October
1 1362.61 3.895a±0.257 4.609a±0.186 5.006a±0.26*** 4.011a±0.169 3.995a±0.123 3.945a±0.131 3.233a±0.135 3.642a±0.133 3.701a±0.143
3 1524.66 5.316a±0.44 5.567a±0.319 6.986a±0.451 5.400a±0.289 5.963a±0.21 6.357a±0.224 5.939a±0.231 6.356a±0.227 5.651a±0.242
5 1549.67 0.734a±0.096 1.198a±0.072 1.092a±0.113 0.978a±0.063 0.891a±0.044 0.828a±0.049 0.796a±0.053 0.717a±0.054 0.870a±0.06
8 1686.68 1.372a±0.1 1.658a±0.074 1.863a±0.103** 1.365a±0.066 1.593a±0.048 1.620a±0.051 1.555a±0.053 1.494a±0.052 1.649a±0.055
9 1708.71 1.124a±0.102 1.297a±0.085 1.262a±0.114 1.085a±0.073 0.979a±0.051 1.034a±0.057 1.017a±0.055 0.942a±0.056 1.105a±0.067
10 1727.74 2.978a±0.196 2.951a±0.142 3.531a±0.201 2.833a±0.129 2.984a±0.094 2.819a±0.1 2.455a±0.103 2.695a±0.101 2.974a±0.108
14 1848.77 3.341a±0.239 3.615a±0.173 4.407a±0.245* 3.422a±0.157 3.931a±0.114 3.939a±0.122 4.086a±0.127 3.935a±0.124 4.033a±0.132
16 1914.83 41.396a±5.23 50.786a±3.79 55.111a±5.37 45.948a±3.44 43.734a±2.50 39.168a±2.66 33.868a±2.72 37.081a±2.70 41.950a±2.87
18 1955.84 6.783a±0.889 8.427a±0.513 8.854a±0.631 6.804a±0.497 7.457a±0.357 7.584a±0.518 7.987a±0.535 9.116a±0.46 9.289a±0.447
19 2010.81 3.132a±0.209 3.576a±0.151 4.015a±0.214 3.376a±0.137 3.654a±0.1 3.718a±0.106 3.766a±0.11 3.614a±0.108 3.598a±0.115
23 2076.89 2.601a±0.146 2.813a±0.106 3.142a±0.149 2.564a±0.097 2.562a±0.07 2.502a±0.074 2.526a±0.077 2.455a±0.076 2.642a±0.08
24 2089.88 14.424a±2.19 14.349a±1.59 14.567a±2.25 14.104a±1.44 16.300a±1.05 17.519a±1.12 17.512a±1.14 16.370a±1.13 18.091a±1.20
27 2219.57 - 4.232a±0.236 3.507a±0.224 3.588a±0.242 3.378a±0.15 2.919a±0.135 3.495a±0.15 3.384a±0.198 3.008a±0.151
28 2235.93 9.944a±1.546 9.960a±1.121 11.421a±1.58 8.792a±1.016 10.125a±0.74 8.597a±0.787 9.175a±0.805 9.501a±0.799 11.596a±0.84
29 2238.98 5.964a±0.334 6.665a±0.242 7.468a±0.343 6.137a±0.22 6.395a±0.16 6.256a±0.17 6.528a±0.175 6.310a±0.173 6.790a±0.186
30 2251.6 2.317a±0.204 2.573a±0.152 2.600a±0.22 2.479a±0.142 2.588a±0.101 2.559a±0.109 2.930a±0.109 2.692a±0.108 2.844a±0.12
32 2378.95 17.554a±1.7*** 12.836a±1.26 12.255a±1.79 11.194a±1.15 9.536a±0.838 8.583a±0.891 7.754a±0.919 8.046a±0.906 8.723a±0.963
33 2411 37.973a±5.59 37.882a±3.23 49.925a±3.97 35.982a±3.12 44.429a±2.25 47.398a±3.26 38.576a±3.36 41.632a±2.89 50.191a±2.81
34 2525.07 3.386a±0.19*** 3.178a±0.141 2.931a±0.2 3.055a±0.128 2.756a±0.093 2.414a±0.099 2.496a±0.103 2.235a±0.101 2.337a±0.107
36 3227.32 0.365a±0.07 0.442a±0.055 0.408a±0.076 0.403a±0.046 0.462a±0.03 0.469a±0.032 0.586a±0.033 0.525a±0.034 0.448a±0.043
37 3243.39 1.043a±0.166 1.034a±0.12 0.933a±0.171 0.980a±0.109 1.171a±0.079 1.415a±0.085 1.745a±0.088*** 1.490a±0.086 1.036a±0.091
- Based on protein concentration 100 µg proteins for N-glycans and 10 µL of serum glycoproteins of each samples. Moreover, dependent
variable was the average amounts (µM) of N–glycans m/z released from the serum glycoprotein of cow, and fixed factor included month of the
year appearing in the general linear model, SPSS software, (”-”) was not detected, the asterisk ”***” showed a significance level, P ≤
0.001, ”**” showed a significance level, P ≤ 0.01,”*” showed a significance level, P ≤ 0.05).

63
B. In correlation with covariates II “fat%, protein%, lactose% in milk”.
Peak
# m/z February March April May June July August September October
1 1362.61 3.782a±0.275 4.345a±0.206 4.781a±0.269** 3.718a±0.157 3.859a±0.116 4.045a±0.134 3.489a±0.147 3.761a±0.136 3.818a±0.142
3 1524.66 5.108a±0.473 5.332a±0.354 6.765a±0.463 5.306a±0.272 5.942a±0.201 6.426a±0.231 6.084a±0.252 6.407a±0.234 5.689a±0.244
5 1549.67 0.746a±0.101 1.157a±0.079 1.030a±0.112 0.927a±0.058 0.856a±0.042 0.843a±0.051 0.850a±0.058 0.738a±0.054 0.920a±0.059
8 1686.68 1.397a±0.107 1.703a±0.082 1.913a±0.105*** 1.380a±0.062 1.609a±0.046 1.607a±0.052 1.526a±0.058 1.463a±0.054 1.639a±0.055
9 1708.71 0.984a±0.109 1.186a±0.091 1.146a±0.117 1.066a±0.066 0.968a±0.048 1.056a±0.058 1.083a±0.059 0.992a±0.056 1.107a±0.067
10 1727.74 2.905a±0.21 2.830a±0.157 3.445a±0.206 2.679a±0.12 2.920a±0.089 2.854a±0.103 2.575a±0.112 2.759a±0.104 3.044a±0.108
14 1848.77 3.180a±0.256 3.424a±0.191 4.252a±0.25* 3.257a±0.147 3.893a±0.109 3.981a±0.125 4.229a±0.138 3.981a±0.126 4.109a±0.132
16 1914.83 43.214a±5.654 50.942a±4.22 54.860a±5.536 45.202a±3.245 42.999a±2.40 39.808a±2.761 34.396a±2.996 36.834a±2.795 42.071a±2.918
18 1955.84 6.502a±0.712 8.696a±0.536 9.390a±0.728 6.643a±0.509 7.331a±0.41 7.763a±0.478 7.692a±0.511 9.677a±0.525 9.218a±0.427
19 2010.81 3.010a±0.224 3.432a±0.167 3.896a±0.219 3.246a±0.129 3.615a±0.095 3.747a±0.11 3.877a±0.121 3.676a±0.111 3.661a±0.116
23 2076.89 2.506a±0.156 2.710a±0.116 3.064a±0.152 2.479a±0.09 2.541a±0.066 2.538a±0.076 2.613a±0.084 2.512a±0.078 2.647a±0.08
24 2089.88 14.201a±2.344 13.885a±1.75 14.446a±2.296 13.272a±1.346 16.053a±0.99 17.877a±1.145 18.231a±1.242 16.952a±1.159 17.988a±1.21
25 2117.89 5.756a±0.458 7.705a±0.345 7.247a±0.468 7.115a±0.331 6.623a±0.264 6.438a±0.308 6.208a±0.328 6.467a±0.338 7.320a±0.274
27 2219.57 - 4.258a±0.258 3.544a±0.243 3.617a±0.243 3.404a±0.137 2.873a±0.141 3.438a±0.171 3.347a±0.208 3.057a±0.149
28 2235.93 10.809a±1.668 10.345a±1.24 11.537a±1.633 8.928a±0.957 10.236a±0.71 8.860a±0.814 9.018a±0.884 9.131a±0.825 11.123a±0.861
29 2238.98 5.923a±0.36 6.509a±0.269 7.337a±0.352 5.911a±0.206 6.289a±0.153 6.323a±0.175 6.702a±0.193 6.386a±0.178 6.873a±0.186
30 2251.6 2.354a±0.223 2.647a±0.171 2.705a±0.226 2.430a±0.133 2.593a±0.097 2.558a±0.115 2.915a±0.121 2.672a±0.112 2.809a±0.122
32 2378.95 15.997a±1.88* 12.034a±1.41 11.563a±1.849 11.872a±1.083 10.192a±0.80 8.625a±0.923 7.738a±1.007 7.994a±0.933 8.441a±0.975
34 2525.07 3.280a±0.2*** 3.099a±0.155 2.843a±0.203 3.071a±0.119 2.781a±0.088 2.439a±0.101 2.527a±0.112 2.271a±0.103 2.294a±0.107
36 3227.32 0.305a±0.076 0.382a±0.06 0.360a±0.076 0.373a±0.042 0.451a±0.028 0.479a±0.033 0.623a±0.037** 0.545a±0.034 0.460a±0.043
37 3243.39 0.964a±0.179 0.970a±0.133 0.906a±0.175 0.877a±0.102 1.134a±0.076 1.403a±0.087 1.805a±0.09*** 1.541a±0.088 1.105a±0.092
- Based on protein concentration 100 µg proteins for N-glycans and 10 µL of serum glycoproteins of each samples. Moreover, dependent
variable was the average amounts (µM) of N–glycans m/z released from the serum glycoprotein of cow, and fixed factor included month of the
year appearing in the general linear model, SPSS software, (”-”) was not detected, the asterisk ”***” showed a significance level, P ≤
0.001, ”**” showed a significance level, P ≤ 0.01,”*” showed a significance level, P ≤ 0.05).

64
Table 4.9. N-glycome expression levels of the serum glycoproteins of a representative Holstein cow #8 between February and October.
Peak
# m/z February March April May June July August September October
1 1362.61 3.853 4.655 4.990 4.271 4.216 3.958 3.423 4.324 3.946
2 1444.65 2.497 2.915 2.085 2.814 2.813 2.611 2.412 3.035 2.545
3 1524.66 5.593 6.757 7.701 5.547 6.199 5.910 5.562 7.144 5.999
4 1533.25 1.995 3.190 2.385 3.419 2.491 2.657 2.031 2.335 1.949
5 1549.67 - 0.882 - 0.752 0.929 0.568 0.720 0.612 0.908
6 1590.72 7.434 9.482 7.199 7.816 8.172 7.250 6.457 7.271 7.276
7 1606.71 8.837 10.188 7.867 9.169 9.337 8.521 8.191 9.799 9.914
8 1686.68 1.351 1.710 1.990 1.321 1.547 1.394 1.264 1.390 1.646
9 1708.71 1.155 1.254 0.934 1.086 1.110 0.787 0.826 0.962 1.063
10 1727.74 3.244 3.238 2.705 3.116 3.510 3.166 2.966 3.289 3.147
11 1752.77 27.574 37.551 30.559 30.818 30.568 27.706 23.707 24.917 28.360
12 1768.78 12.528 13.814 11.248 11.972 12.077 11.131 11.166 14.229 16.326
13 1793.77 4.577 6.148 4.941 4.876 5.120 5.172 5.433 6.445 4.915
14 1848.77 3.806 4.665 5.194 3.843 4.166 3.957 3.972 3.918 4.316
15 1886.77 - 1.356 - 1.285 1.306 1.303 1.366 1.363 1.510
16 1914.83 35.811 48.309 41.913 40.827 38.187 36.209 32.792 34.440 37.610
17 1930.83 2.665 2.603 2.061 3.187 3.241 3.340 2.859 2.741 2.647
18 1955.84 7.824 10.746 9.650 7.854 8.168 8.105 8.486 10.431 9.184
19 2010.81 3.547 4.243 4.983 3.434 3.778 3.547 3.461 3.700 4.274
20 2032.91 1.045 1.020 - 0.922 0.963 0.828 0.872 0.891 0.885
21 2048.86 0.942 0.851 0.939 0.829 0.949 0.900 1.011 0.924 1.147
22 2073.87 12.327 10.969 8.536 8.681 7.672 6.346 6.133 7.586 8.686
23 2076.89 2.458 2.929 2.356 2.632 2.653 2.536 2.416 2.460 2.523
24 2089.88 22.029 21.942 20.850 16.459 19.833 16.708 17.330 19.491 31.498
25 2117.89 7.313 9.357 8.409 7.863 6.740 6.494 6.764 7.837 7.303
27 2219.57 - 3.557 2.999 - 3.635 3.413 3.088 3.340 3.194
28 2235.93 10.116 11.884 10.293 10.143 10.258 9.836 9.597 9.466 11.664
29 2238.98 6.788 7.471 6.279 7.236 7.485 7.447 7.534 7.395 7.256
30 2251.6 2.820 2.914 2.515 2.688 2.975 2.864 3.058 2.800 3.555
31 2318.24 3.889 3.632 3.153 3.650 3.712 3.798 3.549 3.488 3.448
32 2378.95 17.475 13.422 10.812 12.960 8.839 7.880 7.175 8.569 8.516
33 2411 44.463 44.674 49.733 41.992 49.769 48.459 47.901 44.359 75.632
34 2525.07 4.451 3.591 2.675 3.344 2.872 2.542 2.474 2.405 2.349
35 2557.07 9.912 10.380 8.852 8.830 9.458 8.549 8.380 7.831 9.515
36 3227.32 0.448 0.443 - 0.426 0.471 0.403 0.478 0.465 0.384
37 3243.39 1.117 1.030 0.671 1.017 1.190 1.065 1.393 1.267 1.013
- Based on protein concentration 100 µg proteins for N-glycans and 10 µL of serum glycoproteins of each sample, (”-”) was not detected, and the cow was randomly selected to show the
expression levels of the serum glycoproteins during the study.

Furthermore, statistical analyses revealed that the expression levels of these N-
glycoforms correlated with covariate I (parity, days in milk, body weight, and milk yield) and
covariate II (fat %, protein %, and lactose % in milk constituents), as shown in Table 4.8. These
results clearly showed the significant relationship between the seasonal metabolic/homeostatic
immune balance and changes in serum N-glycan expression profiles. A biosynthetic pathway
analysis toward some season-relevant N-glycans revealed that N-glycans detected at m/z 2411
(peak 33) and m/z 2557 (peak 35) markedly increased in August and October and were assigned
as counterparts of the N-glycans observed at m/z 2379 (peak 32) and m/z 2525 (peak 34), notably
characteristic biomarkers that correlated well with the results of the multivariate analysis of
Holstein cow data in February (Table 4.8). As anticipated, serum expression levels of their
precursors detected at m/z 2090 (peak 24) and m/z 2236 (peak 28) also appeared to be
upregulated in accordance with the increase observed in serum N-glycans at m/z 2411 (peak 33)
and m/z 2557 (peak 35) in August and October. Similarly, N-glycans detected at m/z 2074 (peak
22) and m/z 2220 (peak 27), the precursors of the N-glycans observed at m/z 2379 (peak 32) and
m/z 2525 (peak 34), were dominantly synthesized in February, as shown in Figure 4.10 and
Table 4.7. In April, serum levels of a series of high-mannose type N-glycans appeared to be
higher than other matured glycoforms such as hybrid and complex type N-glycans, suggesting
the down-regulation of exo-mannosidases, key enzymes responsible for trimming the multiple
mannose residues of highmannose type N-glycans, leading to the universal intermediate
structure observed at m/z 1445 (peak 2), an indispensable substrate for further synthetic
processes of all complex type N-glycans. These results suggested that the accumulation of such
seasonally characteristic N-glycoforms was caused by changes in the expression levels of exo-
mannosidases/glycosyltransferases and intracellular concentrations of various sugar nucleotides
in relation to their biosynthetic pathways, as shown by the arrows in Figure 4.10. This
biosynthetic pathways has been confirmed in representative cow #8, see Figure 4.11 and Table
65

66
4.9. It is important to emphasize that the dynamic interconversion between Neu5Ac and
Neu5Gc in serum N-glycans provides highly sensitive biomarkers. Seasonal alterations in the
expression levels of two biantennary N-glycans carrying Neu5Ac or Neu5Gc, notably peak 32 at
m/z 2379 and peak 33 at m/z 2411, represent promising serum biomarkers for monitoring
unmeasurable damage or the disruption of the homeostatic immune balance of lactating Holstein
dairy cows under integrated heat/environmental stresses.
I then focused on the significance of the sialylation of highly abundant serum IgG Fc N-
glycans and regulatory mechanism of immunity in dairy cows, as explained in schematic Figure
4.12, because serum IgG Fc N-glycans were needed for optimal Fcγ receptor binding through
modulations of the quaternary structure and thermodynamic stability of the Fc region.67,68
The
addition of sialic acids to the ends of Fc N-glycans was previously shown to convert human IgG
from a pro-inflammatory to an anti-inflammatory agent.69,70
The interaction between sialylated
IgG Fc N-glycans and dendritic-cell-specific ICAM-3 grabbing non-integrin (DCSIGN in
humans and SIGN-R1 in the mouse) may be an essential step to suppress inflammation by
providing an intrinsic mechanism to regulate the TH2 pathway for maintaining immune
homeostasis.71

67
Figure 4.12. Schematic cartoon for the explanation of the addition of sialic acids to the
ends of Fc N-glycans can convert human IgG from a pro-inflammatory anti-inflammatory, and
The interaction between sialylated IgG Fc N-glycans and (DCSIGN, SIGN-R1 might suppress
inflammation by regulate the TH2 pathway.
Moreover, IgG in bovine/buffalo colostrum obtained 1 day after calving was found to be
more heavily terminated by Neu5Ac and Neu5Gc than that in milk obtained 1−4 weeks
postpartum.72,73
Therefore, the sialylation of IgG and other serum glycoproteins was considered
to putatively modulate immune cell functions in infectious diseases, inflammation,
neurodegeneration, autoimmune diseases, and cancer through interactions with Fcγ/FcRn
receptors and/or various pattern recognition receptors (PRRs) including sialic acid-binding
immunoglobulin- like receptors (Siglec) on dendritic cells and macrophages.74
I hypothesized that the sialylation profile of serum IgG Fc N-glycans as well as those of
major serum glycoproteins in fetal bovine serum may differ markedly from those observed in
the serum samples of mature Holstein dairy cows. As shown in Figure 4.13, the N-glycan
profiles of fetal bovine serum glycoproteins were different from those in Holstein cow serum.
Fetal bovine serum glycoproteins carried only 8 major N-glycoforms, and the expression levels
of high-mannose type N-glycans were markedly lower than those in mature bovine serum. Three
major peaks detected at m/z 2379, 3049, and 3354 were fully sialylated complex type N-glycans

68
that were mostly modified with Neu5Ac residues. The triantennary N-glycan detected at m/z
3354 was modified with four Neu5Ac residues, suggesting that this glycoform involved the
typical glycoside unit Neu5Acα2,8Neu5Ac widely found in the embryonic stage.42
However, it
is important to note that peaks due to N-glycans having the Neu5Gc residue were not detected in
fetal serum glycoproteins. Highly sialylated multivalent N-glycans may be released from some
fetal serum-relevant glycoproteins such as α-fetoprotein (AFP) and carcinoembryonic antigen
(CEA) in addition to serum IgG.75,76
The results also revealed that the peak (3 in Figure 4.13)
detected at m/z 2379, assigned as biantennary N-glycan having two terminal Neu5Ac residues,
was identical to peak 32 listed in Table 4.6, and the serum expression level of which in Holstein
dairy cows was highest in February among the 10 months examined. Given the facts that
approximately 50% of the present serum samples were collected from pregnant cows during this
study and the expression levels of this N-glycan (peak 32) and its monofucosylated glycoform
(peak 34 detected at m/z 2525) in February strongly correlated with parity data (Table 4.10 and
4.11), in addition it seems to be related to cows in pregnancy or presence of calves (Table 4.4,
see also Figure 4.14), in addition to N-glycan terminated with two groups Neu5Ac was highly
expressed in pregnant cow than non pregnant one (Figure 4.15 a,b). I considered that these
biantennary N-glycan structures bearing two Neu5Ac residues have potential as specific serum
biomarkers closely related to maternal immune defenses.77,78
However, I have to notice that
further glycomics analysis should be done to easily confirm the maternal relationship.

69
Figure 4.13. MALDI-TOF/MS of N-glycans of fetal serum glycoproteins. Peak 2 detected at
m/z 2175 indicates an internal standard (IS) spiked [(hex)2(HexNAc)2(Neu5Ac)2 +
Man)3(GlcNAc)1] during the glycoblotting protocol, and the final concentration was
adjusted to 40 μM.
It was reported that proteomic analysis of bovine pregnancy-specific serum proteins by
two dimensional-fluorescence difference gel electrophoresis, used as comparative proteomics,
for the development of pregnancy-diagnostic markers in early pregnancy bovine serum. The
differentially expressed proteins were identified by MALDI-TOF/MS.79
Moreover, proteomic
approach based on 2-DE combined with MS revealed the ovine serum protein pattern and
identified 42 medium-high-abundance proteins that could potentially serve as biomarkers in
early diagnoses and monitoring of ovine physiology and metabolism would be useful for
recognising subclinical and pathological conditions, certifying welfare and the quality/safety of
ovine products.80
On the other hand, saliva with its hundreds of proteins, peptides, hormones,
electrolytes and other chemical compounds might be a good source of biomarkers which helps

70
in assessing stress factors such as malnutrition as well as diseases or ongoing viral infections in
farm animals. Also the difference in the proteome of tears in various animal species could
explain their adaptation to their climatic conditions.81
Thus this study is unique to get a
biomarker in case of time independent in cow serum correlated with such environmental
stressors.
Table 4.10. The statistical analysis of N-glycome concentration (µM) of the serum
glycoproteins from primi-parous and multi-parous-6 Holstein cow in February, particularly in
(2378.95 m/z).
t-Test: Two-Samples
Holstein cow serum N-glycome amount (µM), 2378.95 m/z
Estimated structure
Primi-parous Multi-parous-6
Mean 12.9398448 26.62677067
Variance 57.11289771 8.396654138
Observations 8 3
Hypothesized Mean
Difference 0
Degrees of
Freedom 5
t-Stat -4.064886542
P(T<=t) one-tail 0.004841242**
t-Critical one-tail 2.015048373
P(T<=t) two-tail 0.009682483**
t-Critical two-tail 2.570581836
-The corresponding statistical significance was calculated using the student t-test, ("primi-
parous” is a cow who has given birth once, "multi-parous-6" is a cow has given birth 6
times. The asterisk ”**” showed a significance level, P ≤ 0.01).

71
Table 4.11. The statistical analysis of N-glycome concentartion (µM) of the serum
glycoproteins from primi-parous and multi-parous-3 Holstein cow in February, particularly
in (2525.07 m/z).
t-Test: Two-Samples
Holstein cow
serum
N-glycome amount (µM), 2525.07 m/z
Estimated structure Primi-parous Multi-parous-3
Mean 2.939932525 3.711270609
Variance 0.713717055 0.501408827
Observations 8 11
Hypothesized
Mean Difference 0
Degrees of
Freedom 14
t-Stat -2.100894552
P(T<=t) one-tail 0.027121648*
t-Critical one-tail 1.761310136
P(T<=t) two-tail 0.054243295
t-Critical two-tail 2.144786688
-The corresponding statistical significance was calculated using the student t-test, ("primi-
parous” is a cow who has given birth once, "multi-parous-3" is a cow has given birth 3
times. The asterisk ”*” showed a significance level, P ≤ 0.05).
In contrast, in July, August, September, and October, these N-glycans (peak 32 at
m/z 2379 and peak 34 detected at m/z 2525) markedly decreased and a new peak, 33, at m/z
2411, corresponding to the biantennary N-glycan having two Neu5Gc residues, was observed
with high intensity (Figures 4.7A and 4.9 and Table 4.7). Because the N-glycans of bovine
colostrum IgG were modified with Neu5Gc and Neu5Ac residues, the immunity of newborn
calves may be specifically controlled by the Neu5Gc residues of IgG N-glycans because, as
shown in Figure 4.13, fetal bovine serum glycoproteins were not modified with the Neu5Gc
residue. In other words, Neu5Gc appeared to be an unusual sialic acid for newborn calves and
may be required epigenetically to adapt to the dynamic changes associated with early
environmental stresses. As a result, IgG N-glycans,72,73
and free oligosaccharides involving
Neu5Gc residues in colostrum were provided by cows to newborn calves through lactation.
This step was definitely essential for newborn calves to construct a beneficial intestinal

72
microbiota and shape early immunity, as has been reported for the functions of human milk
oligosaccharides in the formation of infant gastrointestinal microbiota.82−84
However, there is
no example to investigate th relation between milk glycan composition and THI/diet. I also
felt that such approach is very interesting and important because changes in the milk glycan
composition influences significantly human gastrointestinal microbiota. The results clearly
suggest that the quantitation of serum expression levels of whole Neu5Ac and Neu5Gc
residues provides highly sensitive biomarkers for matured Holstein cows because the
expression levels (ratio) of these two sialic acids (Neu5Ac/Neu5Gc) differed significantly
between some of the major N-glycoforms observed in February, April, August, and October
(Figure 4.10 and Table 4.6). The upregulation of serum total Neu5Gc expression levels may
directly indicate an increase in damage caused by various environmental stresses in Holstein
dairy cows. The quantitation of serum Neu5Gc expression levels may facilitate the monitoring
of damage and disorders in Holstein dairy cows by directly reflecting their general immune
responses and milk productivity.

Figure 4.14. Monthly description of Holstein cow state during the study.
73

A.
B.
Figure 4.15. A statistical analysis of the average amounts (µM±SE) of N–glycans (2378, 2525
m/z) released from the serum glycoprotein of preganant and non pregnant Holstein cows was
conducted in February during the study. (A) in correlation with covariate I (body weight, milk
yield, days in milk, parity). (B) in correlation with covariate II (fat%, protein%, lactose% in
milk).
74

4.3. Quantitative Analysis of Dynamic Sialylation in Serum Glycoproteins.
To assess the feasibility of simple biomarkers based on the quantitation of whole sialic
acids released from serum glycoproteins, I established an easy and efficient protocol for the
quantitation of Neu5Ac and Neu5Gc concentrations in Holstein cow serum samples by
modifying a general glycoblotting platform (Figure 4.6).45
This standardized protocol
facilitated a quantitative analysis of Neu5Ac and Neu5Gc derived directly from total serum N-
glycans captured by the common glycoblotting procedure. Thus, acid hydrolysis followed by
the derivatization of whole sialic acids with DMB,85
selectively afforded DMB−Neu5Ac and
DMB−Neu5Gc without any side reaction in other monosaccharides because the reagent reacted
specifically with the α-keto acid moieties of sialic acids (Figure 4.16A). Figure 4.16B shows
typical HPLC profiles of DMB−Neu5Ac and DMB−Neu5Gc derived from the serum samples
of Holstein dairy cows in four different months. The quantitation of DMB−Neu5Ac and
DMB−Neu5Gc (represented as μM in serum, n = 5) was performed using calibration curves
with replicate analysis (R2 = 0.9503 for DMB−Neu5Ac and R
2 = 0.9783 for DMB−Neu5Gc;
see also Figure 3.1 in materials and methods). The results obtained demonstrated that the
Neu5Ac content in whole serum N-glycans was markedly higher in winter (February) than in
the other seasons (April, August, and October), as shown in Figure 4.16C. On the other hand,
serum N-glycans in August and October were dominantly terminated by the Neu5Gc residue,
suggesting that serum Neu5Gc concentrations are a promising alternative biomarker to the N-
glycans identified by the present large-scale glycomics study. The markedly higher expression
ratio of the Neu5Gc against Neu5Ac in October than in August correlated with the lowest milk
productivity (21.6 kg/day) of this month. The THI value of October (56.1) was identical to that
of May, which had the highest milk yield (36.7 kg/day) in the year; therefore, the impact of
heat/environmental stress in August (THI = 72.2) was beyond my conception and caused long-
term damage and disorders in the homeostatic immune balance of dairy cows during summer
75

76
and autumn. The present results demonstrated that the Neu5Gc/ Neu5Ac ratio of whole serum
glycoproteins was a highly sensitive and efficient biomarker for indicating the general
performance and milk productivity of Holstein dairy cows. However, it is important to note that
the present protocol covered the quantitation of sialic acids derived selectively from the N-
glycans of whole serum glycoproteins (Figure 4.6). In addition, it seems likely that an HPLC-
based assay is not suited for large-scale analysis needed in the case for serum glycomics study.
The influence of sialic acids in free oligosaccharides, O-glycans, or glycosphingolipids in
serum remains unclear; however, their serum expression levels appear to be very low.86−88
A.

77
B.
.
C.
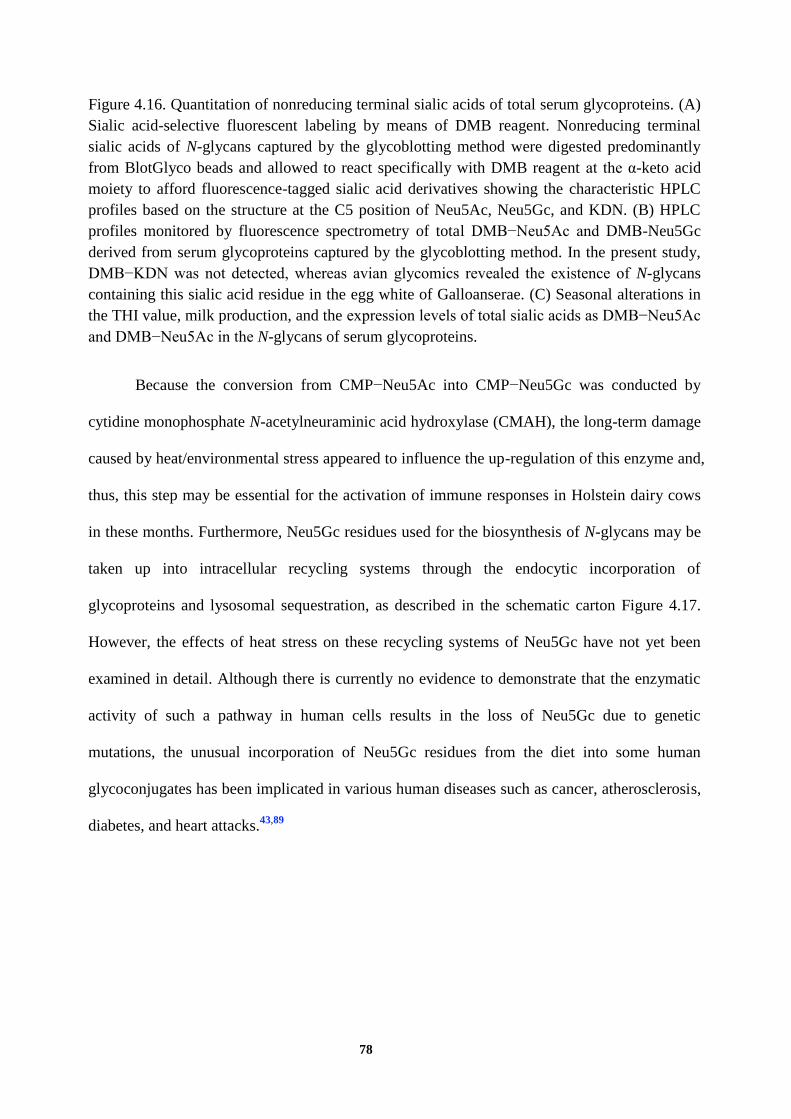
78
Figure 4.16. Quantitation of nonreducing terminal sialic acids of total serum glycoproteins. (A)
Sialic acid-selective fluorescent labeling by means of DMB reagent. Nonreducing terminal
sialic acids of N-glycans captured by the glycoblotting method were digested predominantly
from BlotGlyco beads and allowed to react specifically with DMB reagent at the α-keto acid
moiety to afford fluorescence-tagged sialic acid derivatives showing the characteristic HPLC
profiles based on the structure at the C5 position of Neu5Ac, Neu5Gc, and KDN. (B) HPLC
profiles monitored by fluorescence spectrometry of total DMB−Neu5Ac and DMB-Neu5Gc
derived from serum glycoproteins captured by the glycoblotting method. In the present study,
DMB−KDN was not detected, whereas avian glycomics revealed the existence of N-glycans
containing this sialic acid residue in the egg white of Galloanserae. (C) Seasonal alterations in
the THI value, milk production, and the expression levels of total sialic acids as DMB−Neu5Ac
and DMB−Neu5Ac in the N-glycans of serum glycoproteins.
Because the conversion from CMP−Neu5Ac into CMP−Neu5Gc was conducted by
cytidine monophosphate N-acetylneuraminic acid hydroxylase (CMAH), the long-term damage
caused by heat/environmental stress appeared to influence the up-regulation of this enzyme and,
thus, this step may be essential for the activation of immune responses in Holstein dairy cows
in these months. Furthermore, Neu5Gc residues used for the biosynthesis of N-glycans may be
taken up into intracellular recycling systems through the endocytic incorporation of
glycoproteins and lysosomal sequestration, as described in the schematic carton Figure 4.17.
However, the effects of heat stress on these recycling systems of Neu5Gc have not yet been
examined in detail. Although there is currently no evidence to demonstrate that the enzymatic
activity of such a pathway in human cells results in the loss of Neu5Gc due to genetic
mutations, the unusual incorporation of Neu5Gc residues from the diet into some human
glycoconjugates has been implicated in various human diseases such as cancer, atherosclerosis,
diabetes, and heart attacks.43,89

79
Figure 4.17. Schematic cartoon of the biosynthetic pathway for sialoglycoprotein (Neu5Gc) in
Holstein cows.
As for the effects of diet of the cows on the milk production and glycosylation of serum
proteins, I thought that: (a) Given the accumulating evidences in the previous studies done by
our lab members on human and avian glycome that diet and medication as well as life styles
influence significantly glycosylation profiles of serum glycoproteins and glycosphingolipids, it
is not surprising that seasonal changes in the quality of diet can have influence serum glycan
composition found in the present study. However, (b) It is important to note that the seasonal
glycan alteration observed in the serum can not directly predict the milk productivity of the
cows while this is strongly related to changes in the homeostatic immune balance caused both
by heat stress and quality of the diet. (c) To explain molecular mechanisms explaining the
present results, it is clear that further experiments are needed by focusing on the functional role
of serum proteins modified with key glycan biomarkers revealed in this study.

80
Chapter 5
Summary

81
Because various stresses strongly influence the food productivity of livestock,
biomarkers to indicate unmeasurable environmental stress in domestic farm animals are of
increasing importance. Thermal comfort is one of the basic principles of dairy cow welfare that
enhances productivity, so that the more attention needs to be placed on the principles of The
Welfare Quality® Assessment protocol. THI value cannot be used as a feasible indicator to
alert farmers to any alterations in an animal‟s metabolic/homeostatic immune balance perturbed
by “complicated heat stress”, whereas the THI may be an important parameter for simply
showing the temperature and humidity of the feeding environment. Farmers have not been able
to fully recognize the signs of cows being physically affected by slight heat stress unless their
condition becomes critical. Moreover, traditional physiological approaches are also insufficient
for elucidating a direct correlation between hormone secretions with adverse effects on animal
well-being due to the stress adaptability of the animal; therefore, the best indicator for
identifying animals under stress is the development of a prepathological state, that is, a stress-
related change in biological functions with suppression of the immune system. Post-
translational protein glycosylation is a basic principle for controlling the structures and
functions of most glycoproteins in relation to cellular differentiation, adhesion, immunity,
signal transduction, growth control, and even malignant alterations. These structural alterations
in the post-translational glycosylation of major serum proteins may provide highly sensitive
biomarkers to indicate changes in general metabolism and the homeostatic immune balance
directly/indirectly induced by various diseases without any direct biopsy of the tissues/organs
affected. According to some climatic data of Sapporo, Japan, recorded in 2012, heat stress
commonly assessed by the THI was estimated to be maximal in August. These seasonal
profiles for milk yield and its constituents may strongly depend on marked changes in the diet
and subsequent metabolic effects on normal microbial protein synthesis. However, difficulties
are associated with directly monitoring changes in the profiles of highly complex metabolites
82
and their effects on the intestinal microbiota. THI values may contribute to the development of
a management system for short-term heat stress and environmental assessment guidelines to
improve animal comfort. However, the relationship between long-term damage caused by the
integration of many environmental stresses and the performance/milk productivity of lactating
Holstein dairy cows currently remains unclear due to the lack of sensitive biomarkers to
indicate alterations in the general metabolism and homeostatic immune balance of Holstein
dairy cows. Thus, for the first time using glycomics technological techniques to determine the
concentration and amount of dedicated animal serum proteins (dairy cows) that reveal the
relationship between these proteins and combinations of climate change and seasonal
productivity. Large-scale glycomics of dairy Holstein cow serum samples (n=336) collected for
9 months from the farm, Faculty of Agriculture, Hokkaido University, Japan (between
February and October in 2012). Samples were analyzed using glycoblotting combined with
MALDI-TOF/MS and DMB/HPLC to detect the dynamic changes in the expression levels and
profiles of the N-glycan structures of serum glycoproteins as highly sensitive and efficient
serum biomarkers to monitor the heat/environmental stresses influencing the
metabolic/homeostatic immune balance, performance, and milk productivity of dairy cows. The
analysis demonstrated a correlation between the levels of N-glycan and productivity, where
there was major serum glycoproteins in summer and autumn mainly terminated with Neu5Gc
residues, whereas glycoproteins in winter used Neu5Ac. This was caused by changes in the
expression levels of enzymes and intracellular concentrations of various sugar nucleotides in
relation to their biosynthetic pathways. The dynamic interconversion between Neu5Ac and
Neu5Gc in serum N-glycans provides highly sensitive biomarkers due to the change in the
functions of immune cells across the infectious diseases, inflammation, neurological diseases,
and autoimmune diseases, and cancer through interactions with receptors of these sugars. Also,
serum N-glycans profiles derived from bovine serum embryo (containing sugars Neu5Ac),

83
which differ markedly from serum samples of mature Holsteins cows which means an immune
defense from mothers to fetuses through the placenta and blood circulation. However,
vaccinating newly born calves specifically through the of Neu5Gc residues in colostrum to
adapt to the dynamic changes associated with early environmental stresses in order to construct
a beneficial intestinal microbiota and shape early immunity, because it does not have this kind
of the protein bovine serum to transfer from mother to child or through the placenta. After the
quantitative analysis of the dynamic in N-glycans in the serum of Holstein cows, Neu5Ac
quantifications ratio is a promising alternative embryonic biomarker to the individual N-
glycans of serum in cows, while in summer and autumn dominated the existence of the Neu5Gc
residue to indicate the environmental stress resulting from climate change and the results
showed that the serum ratio Neu5Gc/Neu5Ac indicated the heat/environmental stress and milk
productivity/performance of Holstein dairy cows.

84
Chapter 6
Conclusion and Recommendation

85
In this thesis, I have discussed about the a glycoblotting-based systematic strategy that
concurrently allowed for a large-scale serum N-glycome analysis and the quantitation of
nonreducing terminal sialic acids was established in the present study. By applying the present
protocol, I discovered highly sensitive serum N-glycan biomarkers indicating an
environmental/heat stress affecting the general health condition, especially homeostatic
immune balance, of Holstein dairy cows. The results obtained clearly showed the seasonal
alterations in serum N-glycan expression levels and their structural characteristics. The N-
glycans of major serum glycoproteins in summer and autumn mainly terminated with Neu5Gc
residues, whereas glycoproteins in winter used Neu5Ac as the main sialic acid instead of
Neu5Gc residues. A multivariate analysis revealed a correlation between productivity and the
expression levels of season-specific glycoforms. Dynamic alterations in modifications to the
nonreducing terminals of di/triantennary N-glycans provide highly sensitive serum biomarkers
indicating an environmental stress/thermal comfort in dairy cows that affects their immune
responses, performance, and milk productivity. Consequently, serum Neu5Gc levels are a
promising alternative biomarker to the individual N-glycans. The merit of this biomarker is
evident because the serum ratio Neu5Gc/Neu5Ac correlated well with the performance and
milk productivity of Holstein dairy cows, whereas the THI value was not capable of predicting
such long-term damage by a heat/environmental stress in October (THI = 56), which ultimately
resulted in the lowest milk yield (21.6 kg). By applying DMB-HPLC analysis, I can quantify
the nonreducing terminal sialic acids, in which the significance of the interconversion between
Neu5Ac and Neu5Gc of serum glycoproteins in the regulatory mechanism of immune
responses may be determined in terms of the interactions between glycoform-engineered IgG
and Fcγ/FcRn receptors or key animal lectins/PRRs on dendritic cells/macrophages.

86
Herein, I have confirmed the accuracy and effectiveness of using glycoblotting for a
large-scale serum N-glycome analysis and DMB-HPLC analysis in order to quantify of non-
reducing terminal sialic acids. Moreover, the serum ratio Neu5Gc/Neu5Ac indicated the
heat/environmental stress and milk productivity/performance of Holstein dairy cows.
However, Neu5Ac quantifications ratio is a promising alternative embryonic biomarker to the
individual N-glycans of serum in cows.
Finally, I strongly recommend that glycomics profiling is one of the non-invasive
approaches to investigate the immune balance and productivities in livestock (e.g., Holstein
cow) management under integrated heat/environmental stresses.

87
References
88
(1) Broom, D. M. Indicators of poor welfare. Br. vet. J. 1986, 6, 524-526.
(2) International Labour Organization (ILO)) Taking hazardous child labour in Agriculture.
Guidance and Policy and Practice. ILO Publications, International Labour Office, Ch. 1211,
Geneva 22, Switzerland. 2006, pp 45.
(3) Naturanimal Stress and animals. Available at: (www.naturanimals.com/stress-and-animals).
2012.
(4) Lee, C. N. Environmental stress effects on bovine reproduction. Vet. Clin. North America.
Food Anim. Pract. 1993, 2, 263-273.
(5) Franchi, G. A.; Garcia, P. R.; da Silva, I. J. O. Welfare quality applied to the Brazilian
dairy cattle. J. Animal Behav. Iometeorol. 2014, 2, 60-65.
(6) Collier, R. J.; Doelger, S. G.; Head, H. H.; Thatcher, W. W.; Wilcox, C. J. Effects of heat
stress during pregnancy on maternal hormone concentrations, calf birth weight and
postpartum milk yield of Holstein cows. J. Animal Sci. 1982, 54, 309-319.
(7) Broom, D. M; Johnson, K. G. Stress and animal welfare. Dordrecht:Kluwer. 2000.
(8) Broom, D. M. The stress concept and ways of assessing the effects of stress in farm animals.
Appl. Anim. Ethol. 1983, 1-79.
(9) Broom, D. M. Adaptation. Berl Munch Tierarztl Wochenschr. 2006b, 119, 1–6.

89
(10) Vermunt, J. J.; Malmo, J.; Parkinson, T.; Lameness, J. In Diseases of Cattle in
Australasia—A Comprehensive Textbook: The New Zealand Veterinary Association
Foundation for Continuing Education (VetLearnTM): Wellington, New Zealand. 2010, pp660–
719.
(11) Schwartz, G.; Rhoads, M. L.; VanBaale, M. J.; Rhoads, R. P.; Baumgard, L. H. Effect of a
supplemental yeast culture on heat-stressed lactating Holstein cows. J. Dairy Sci. 2009, 92,
935-942.
(12) Bernabucci, U.; Lacetera, N.; Baumgard, L. H.; Rhoads, R. P.; Ronchi, B.; Nardone, A.
Metabolic and hormonal acclimation to heat stress in domestic ruminants. Animal 2010, 4,
1167-1183.
(13) St-Pierre, N. R.; Cobanov, B.; Schnitkey, G. Economic losses from heat stress by US
livestock industries. J. Dairy Sci. 2003, 86, 52–77.
(14) Segnalini, M.; Bernabucci, U.; Vitali, A.; Nardone, A.; Lacetera, N. Temperature
humidity index scenarios in the Mediterranean basin. Int. J. Biometeorol. 2013, 57, 451–458.
(15) Ominski, K. H.; Kennedy, A. D.; Wittenberg, K. M.; Moshtaghi-Nia, S. A. Physiological
and production responses to feeding schedule in lactating dairy cows exposed to short-term,
moderate heat stress. J. Dairy Sci. 2002, 85, 730–737.
(16) Akyuz, A.; Boyaci, S.; Cayli, A. Determination of critical period for dairy cows using
temperature humidity index. J. Animal and Veter. Adv. 2010, 13, 1824-1827.

90
(17) Zimbleman, R. B.; Rhoads, R. P.; Rhoads, M. L.; Duff, G. C.; Collier. R. J. A re-
evaluation of the impact of temperature humidity index (THI) and black globe humidity index
(BGHI) on milk production in high producing dairy cows. In the Proceedings of the
Southwest Nutrition and Management Conference, Arizona, February, 2009, pp158-168.
(18) Berman, A. Estimates of heat stress relief needs for Holstein dairy cows. J. Animal Sci.
2005, 83, 1377-1384.
(19) Brown-Brandl, T. M.; Neinaber, J. A.; Eigenberg, R. A,; Hahn. G. L.; Freetly, H.
Thermoregulatory responses of feeder cattle. J. Thermal Biology. 2003, 28, 149-157.
(20) Mader, T. L.; Johnson, L. J.; Gaughan, J. B. A comprehensive index for assessing
environmental stress in animals. J. Animal Sci. 2010, 88, 2153-2165.
(21) Kumar, B., Manuja, A.; Aich, P. Stress and its impact on farm animals. Front. Biosci.
2011, 4, 1759-1767.
(22) Ohatsubo, K.; Marth, J. D. Glycosylation in cellular mechanisms of health and disease.
Cell. 2006, 126, 855-867.
(23) Kornfeld, R.; Kornfeld, S. Assembly of aspargine-linked oligosaccharides. Ann. Rev.
Biochem. 1985, 54, 631-664.
(24) Stanley, P.; Schachter, H.; Taniguchi, N. N-glycans, in: Varki, A.; Cummings. R. D.; Esko.
J. D.; Freeze. H. H.; Stanley, P.; Betrozzi. C. R.; Hurt. G. W.; Etzler. M.E (Eds.), Essentials of

91
Glycobiology, 2nd
Ed., Cold Spring Harbor Laboratpry Press, Cold Spring Harbor, New York.
2008, pp. 101-114.
(25) Haltiwanger R. S.; Lowe J. B. Role of glycosylation in development. Annu. Rev.
Biochem. 2004, 73, 491-537.
(26) Ohatsubo, K.; Marth, J. D. Glycosylation in cellular mechanisms of health and disease.
Cell. 2006, 126, 855-867.
(27) Lau K. S.; Partridge E. A.; Grigorian A.; Silvescu C. I.; Reinhold V. N.; Demetriou M.;
Dennis J. W. Complex N-glycan number and degree of branching cooperate to regulate cell
proliferation and differentiation. Cell. 2007, 129, 123-134.
(28) Hato M.; Nakagawa H.; Kurogochi M.; Akama T. O.; Marth J. D.; Fukuda M. N.;
Nishimura S.-I. Unusual N-glycan structures in alpha-mannosidase II/IIx double null embryos
identified by a systematic glycomics approach based on two-dimensional LC mapping and
matrix-dependent selective fragmentation method in MALDI-TOF/TOF mass spectrometry.
Mol. Cell. Proteomics. 2006, 5, 2146-2157.
(29) Amano, M.; Yamaguchi, M.; Takegawa, Y.; Yamashita, T.; Terashima, M.; Furukawa,
J.-i.; Miura, Y.; Shinohara, Y.; Iwasaki, N.; Minami, A., Nishimura, S.-I. Threshold in stage-
specific embryonic glycotypes uncovered by a full portrait of dynamic N-glycan expression
during cell proliferation. Mol. Cell. Proteomics. 2010, 9, 523–537.

92
(30) Amano, M.; Hashimoto, R.; Nishimura, S.-I. Effects of single genetic damage in
carbohydrate recognizing proteins in mouse serum N-glycan profile revealed by simple
glycoblotting analysis. ChemBioChem. 2012, 13, 451–464.
(31) Nishimura, S.-I.; Hato, M.; Hyugaji, S.; Feng, F.; Amano, M. Glycomics for drug
discovery: Metabolic perturbation in androgen-independent prostate cancer cells induced by
unnatural hexosamine mimics. Angew. Chem. Int. Ed. 2012, 51, 3386-3390.
(32) Terashima, M.; Amano, M.; Onodera, T.; Nishimura, S.-I.; Iwasaki, N. Quantitative
glycomics monitoring of induced pluripotent and embryonic stem cells during neuronal
differentiation. Stem Cell Res. 2014, 13, 454-464.
(33) Bones, J.; Mittermayr, S.; O‟Donoghue, N.; Guttman, A.; Rudd, P. M. Ultra
performance liquid chromatographic profiling of serum N-glycans for fast and efficient
identification of cancer associated alterations in glycosylation. Anal. Chem. 2010, 82,
10208–10215.
(34) Pierce, A.; Saldova, R.; Abd Hamid, U. M.; Abrahams, J. L.; McDermott, E. W.; Evoy,
D.; Duffy, M. J.; Rudd, P. M. Levels of specific glycans significantly distinguish lymph
node-positive from lymph node-negative breast cancer patients. Glycobiology. 2010, 20,
1283–1288.
(35) Knezevic, A.; Gornik, O.; Polasek, O.; Pucic, M.; Redzic, I.; Novokmet, M.; Rudd, P.
M.; Wright, A. F.; Campbell, H.; Rudan, I.; Lauc, G. Effects of aging, body mass index,

93
plasma lipid profiles, and smoking on human plasma N-glycans. Glycobiology. 2010, 20, 959–
969.
(36) Saldova, R.; Fan, Y.; Fitzpatrick, J. M.; Watson, R. W.; Rudd, P. M. Core fucosylation
and alpha2-3 sialylation in serum N-glycome is significantly increased in prostate cancer
comparing to benign prostate hyperplasia. Glycobiology. 2011, 21, 195–205.
(37) Nishimura, S.-I.; Niikura, K.; Kurogochi, M.; Matsushita, T.; Fumoto, M.; Hinou, H.;
Kamitani, M.; Nakagawa, H.; Deguchi, K.; Miura, N.; Monde, K.; Kondo, H. High- throughput
protein glycomics: Combined use of chemoselective glycoblotting and MALDI- TOF/TOF
mass spectroscopy. Angew. Chem. Int. Ed. 2005, 44, 91–96.
(38) Angata, T.; Varki, A. Chemical diversity in the sialic acids and related alpha-keto acids: an
evolutionary perspective. Chem Rev. 2002, 102, 439–469.
(39) Schauer R. Achievements and challenges of sialic acid research. Glycoconj J. 2002. 17,
485–499.
(40) Varki, A. Glycan-based interactions involving vertebrate sialic-acid-recognizing proteins.
Nature (Lond). 2007, 446, 1023–1029.
(41) Varki, A.; Cummings, R.; Esko, D. J. D.; Freeze, H. H.; Stanley, P.; Bertozzi, C. R.; Hart,
G. W.; Etzler, M. E. Essential of Glycobiology, 2nd ed., Cold Spring Habor Laboratory Press,
Cold Spring Harbor: New York. 2009.

94
(42) Schauer, R. Salic acids are regulators of moleculars and cellular interactions, Curr. Opin.
Struct. Biol. 2009, 19,507-514.
(43) Varki, A. Multiple changes in sialic acid biology during human evolution. Glycoconj J.
2009, 26, 231-245.
(44) Varki, A. Loss of N-Glycolylneuraminic acid in Humans: Mechanisms, Consequences and
Implications for Hominid Evolution. Am J Phys Anthropol. 2001, 116, 54–69.
(45) Hirose, K.; Amano, M.; Hashimoto, R.; Lee, Y. C.; Nishimura, S.-I. Insight into glycan
diversity and evolutionary lineage based on comparative avio-N-glycomics and sialic acid
analysis of 88 egg whites of Gallonaserae. Biochemistry. 2011, 50, 4757-4774.
(46) Beyer, TA.; Rearick, JI.; Paulson, JC.; Prieels, JP.; Sadler, JE.; Hill RL. Biosynthesis of
mamma- lian glycoproteins. Glycosylation pathways in the synthesis of the nonreducing
terminal sequences. J Biol Chem. 1979, 254, 12531–12534.
(47) Traving, C.; Schauer, R. Structure, function and metabolism of sialic acids. Cell Mol Life
Sci. 1998, 54, 1330–1349.
(48) Varki, A.; Angata,T. Siglecs: the major subfamily of I-type lectins. Glycobiology. 2006, 16,
1–27.

95
(49) Schwarzkopf, M.; Knobeloch, K. P.; Rohde, E.; Hinderlich, S,.; Wiechens, N.; Lucka, L.;
Horak, I.; Reutter, W.; Horstkorte, R. Sialylation is essential for early development in mice.
Proc Natl Acad Sci USA. 2002 , 99, 5267–5270.
(50) Altheide, T.K.; Hayakawa, T.; Mikkelsen, T.S.; Diaz, S.; Varki, N.; Varki, A. System-wide
genomic and biochemical comparisons of sialic acid biology among primates and rodents:
evidence for two modes of rapid evolution. J Biol Chem. 2006. 281, 25689–25702.
(51) Nishimura, S.-I. Toward automated glycan analysis. Adv. Carbohydr. Chem. Biochem.
2011, 65, 219–271.
(52) Miura, Y.; Hato, M.; Shinohara, Y.; Kuramoto, H.; Furukawa, J.-i.; Kurogochi, M.;
Shimaoka, H.; Tada, M.; Nakanishi, K.; Ozaki, M.; Todo, S.; Nishimura, S.-I.
BlotGlycoABC™, an integrated glycoblotting technique for rapid and large scale clinical
glycomics. Mol. Cell. Proteomics. 2008, 7, 370–377.
(53) Kamiyama, T.; Yokoo, H.; Furukawa, J. I.; Kurogochi, M.; Togashi, T.; Miura, N.;
Nakanishi, K.; Kamachi, H.; Kakisaka, T.; Tsuruga, Y.; Taketomi, A.; Nishimura, S-I.; Todo, S.
Identification of novel serum biomarkers of hepatocellular carcinoma using glycomic analysis.
Hepatology . 2013, 57, 2314–2325.
(54) Miyahara, K.; Nouso, K.; Miyake, Y.; Nakamura, S.; Obi, S.; Amano, M.; Hirose, K.;
Nishimura, S.-I.; Yamamoto, K. Serum glycan as a prognostic marker in patients with
advanced hepatocellular carcinoma treated with sorafenib. Hepatology. 2014, 59, 355-356.

96
(55) Nouso, K.; Amano, M.; Miyahara, K.; Ito, M. I.; Morimoto, Y.; Kato, H.; Tsutsumi, K.;
Tomoda, T.; Yamamoto, N.; Nakamura, S.; Kobayashi, S.; Kuwaki, K.; Hagihara, H.; Onishi,
H.; Miyake, Y.; Ikeda, F.; Shiraha, H.; Takaki, A.; Nakahara, T.; Nishimura, S.-I.; Yamamoto,
K. Clinical utility of high-throughput glycome analysis in patients with pancreatic cancer. J.
Gastroenterol. 2013, 48, 1171-1179.
(56) Hatakeyama, S.; Amano, M.; Tobisawa, Y.; Yoneyama, T.; Tsuchiya, N.; Habuchi, T.;
Nishimura, S-I.; Ohyama, C. Serum N-glycan alteration associated with renal cell carcinoma
detected by high-throughput glycan analysis. J. Urology. 2014, 191, 805–813.
(57) Ishibashi, Y.; Tobisawa, Y.; Hatakeyama, S.; Ohashi, T.; Tanaka, M.; Narita, S.; Koike,
T.; Habuchi, T.; Nishimra, S.-I.; Oyama, C.; Yoneyama, T. Serum tri- and tetra-antennary N-
glycan is a potential predictive biomarker for castration-resistant prostate cancer. Prostate.
2014, 74, 1521-1529.
(58) Urita, A.; Matsuhashi, T.; Onodera, T.; Nakagawa, H.; Hato, M.; Amano, M.; Seito, N.;
Minami, A.; Nishimura, S.-I. Alterations of high-mannose type N-glycosylation in human
and mouse osteoarthritis cartilage. Arthritis Rheumat. 2011, 63, 3428-3438.
(59) Ishihara, T.; Kakiya, K.; Takahashi, K.; Miwa, H.; Rokushima, M.; Yoshinaga, T.; Tanaka,
T.; Togame, T.; Takemoto, H.; Amano, M.; Iwasaki, N. Minami, A.; Nishimura, S.-I.
Discovery of novel differentiation markers in the early stage of chondrogenesis by
glycoform-focused reverse proteomics and genomics. Biochim. Biophys. Acta. 2014, 1840,
645-655.

97
(60) Miyahara, K. Nouso, K.; Saito, S.; Hiraoka, S.; Harada, K.; Takahashi, S.; Morimoto,
Y.; Kobayashi, S.; Ikeda, F.; Miyake, Y.; Shiraha, H.; Takaki, A.; Amano, M.; Nishimura, S.-
I.; Yamamoto, K. Serum glycan markers for evaluation of disease activity and prediction of
clinical course in patients with ulcerative colitis. PLOS ONE. 2013, 8, e74861.
(61) Yamasaki, Y.; Nouso, K.; Miyahara, K.; Wada, N.; Dohi, C.; Morimoto, Y.; Takeuchi, Y.;
Yasunaka, T.; Kuwaki, K.; Onishi, H.; Ikeda, F.; Miyake, Y.; Nakamura, S.; Shiraha, H.;
Takaki, A.; Amano, M.; Nishimura, S.-I.; Yamamoto, K. Use of noninvasive serum glycan
markers to distinguish nonalcoholic steatohepatitis from simple steatosis. J. Gastoentol.
Hepatol. 2015, 30, 528-534.
(62) Inafuku, S.; Noda, K.; Amano, M.; Murata, M.; Saito, W.; Ohashi, T.; Kanda, A.;
Nishimura, S.-I.; Ishida, S. Alteration of N-glycan profiles in diabetic retinopathy. Invest.
Ophthalmol. Vis. Sci. 2015, 56, 5316-5322.
(63) Inafuku, S.; Noda, K.; Amano, M.; Nishimura, S.-I.; Ishida, S. Increase of sialylated N-
glycans in eyes with neovascular glaucoma secondary to proliferative diabetic retinopathy.
Curr. Eye Res. 2015, 1-4.
(64) Kabuga, J. D. The influence of thermal conditions on rectal temperature, respiration rate
and pulse rate of lactating Holstein-Friesian cows in the humid tropics. Int. J. Biometeorol.
1992, 36, 146-150.
(65) Gaughan. J. B.; Mader, T. L.; Holt, S. M.; Lisle, A. A. New heat load index for feedlot
cattle. J. Animal Sci. 2008, 86, 226-234.

98
(66) Ray, D. E.; Halbach, T. J.; Armstrong, D. V. Season and lactation number effects on
milk production and reproduction of dairy cattle in Arizona. J. Dairy Sci. 1992, 75, 2976–
2983.
(67) Arnold, J. N.; Wormald, M. R.; Sim, R. B.; Rudd, P. M.; Dwek, R. A. The impact of
glycosylation on the biological function and structure of human immunoglobulins. Annu. Rev.
Immunol. 2007, 25, 21-50.
(68) Gornik, O.; Pavić, T.; Lauc, G. Alternative glycosylation modulates function of IgG and
other proteins: Implications on evolution and disease. Biochim. Biophys. Acta. 2012, 1820,
1318-1326.
(69) Kaneko, Y.; Nimmerjahn, F.; Ravetch, J. V. Anti-inflammatory activity of
immunoglobulin G resulting from Fc sialylation. Science. 2006, 313, 670-673.
(70) Anthony, R. M.; Wermeling, F.; Karlsson, M. C. I.; Ravetch, J. V. Identification of a
receptor required for the anti-inflammatory activity of IVIG. Proc. Natl. Acad. Sci. USA. 2008,
105, 19571-19578.
(71) Anthony, R. M.; Kobayashi, T.; Wermeling, F.; Ravetch, J. V. Intravenous
gammaglobulin suppresses inflammation through a novel TH2 pathway. Nature. 2011, 475,
110-113.
(72) Takimori, S.; Shimaoka, H.; Furukawa, J.-i.; Yamashita, T.; Amano, M.; Fujitani, N.;
Takegawa, Y.; Hammarstrom, L.; Kacskovics, I.; Shinohara, Y.; Nishimura, S.-I. Alteration

99
of the N-glycome of bovine milk glycoproteins during early lactation. FEBS J. 2011, 278,
3769-3781.
(73) Bhanu, L. S. M.; Amano, M.; Nishimura, S.-I.; Aparna, H. S. Glycome characterization
of immunoglobulin G from buffalo (Bubalus bubalis) colostrum. Glycoconj. J. 2015, 32,
625−634.
(74) Macauley, M. S.; Crocker, P. R.; Paulson, J. C. Siglec-mediated regulation of immune cell
function in disease. Nat. Rev. Immunol. 2014, 14, 653-666.
(75) Furukawa, J.i.; Shinohara, Y.; Kuramoto, H.; Miura, Y.; Shimaoka, H.; Kurogochi, M.;
Nakano, M.; Nishimura, S.-I. Comprehensive approach to structural and functional glycomics
based on chemoselective glycoblotting and sequential tag conversion. Anal. Chem. 2008, 80,
1094–1101. .
(76) Kurogochi, M; Matsushista, T.; Amano, M.; Furukawa, J.-i.; Shinohara, Y.; Aoshima,
M.; Nishimura, S.-I. Sialic acid-focused quantitative mouse serum glycoproteomics by multiple
reaction monitoring assay. Mol. Cell. Proteomics. 2010, 9, 2354-2368.
(77) Patel, O. V.; Sulon, J.; Beckers, J. F.; Takahashi, T.; Hirako, M.; Sasaki, N.; Domeki, I.
Plasma bovine pregnancy-associated glycoprotein concentrations throughout gestation in
relationship to fetal number in the cow. Eur. J. Endocrinol. 1997, 137, 423–428.
(78) Klisch, K.; Boos, A.; Friedrich, M.; Herzog, K.; Feldmann, M.; Sousa, N.; Beckers, J.;
Leiser, R.; Schuler, G. The glycosylation of pregnancy-associated glycoproteins and

100
prolactin-related protein-I in bovine binucleate trophoblast giant cells changes before
parturition. Reproduction. 2006, 132, 791–798. .
(79) Lee, J. E.; Lee, J. Y.; Kim, H. R.; Shin, H. Y.; Lin, T.; and Jin, D. I. Proteomic Analysis of
Bovine Pregnancy-specific Serum Proteins by 2D Fluorescence Difference Gel Electrophoresis.
Asian-Australasian Journal of Animal Sciences (AJAS). 2015, 6, 788-795.
(80) Jayasri, K.; Padmaja, K.; and Prasad, P. E. Proteomics in Animal Health and Production. J
Agric. 2014.
(81) Chiaradia, E.; Avellini, L.; Tartaglia, M.; Gaiti, A.; Just, I.; Scoppetta, F.; Czentnar . Z.;
and Pich, A. Proteomic evaluation of sheep serum proteins. BMC veterinary research. 2012, 1,
66.
(82) Marcobal, A.; Barboza, M.; Froehlich, J. W.; Block, D. E.; German, J. B.; Lebrilla, C.
B.; Mills, D. A. Consumption of human milk oligosaccharides by gut-related microbes. J. Agric.
Food Chem. 2010, 58, 5334-5340.
(83) Zivkovic, A. M.; German, J. B.; Lebrilla, C. B.; Mills, D. A. Human milk glycobiome
and its impact on the infant gastrointestinal microbiota. Proc. Natl. Acad. Sci. USA. 2011, 108,
4653-4658.
(84) Sela, D. A.; Li, Y.; Lerno, L.; Wu, S.; Marcobal, A. M.; German, J. B.; Chen, X.;
Lebrilla, C. B.; Mills, D. A. An infant-associated bacterial commensal utilizes breast milk
sialyloligosaccharides. J. Biol. Chem. 2011, 286, 11909-11918.

101
(85) Hara, S.; Takemori, Y.; Yamaguchi, M.; Nakamura, M.; Ohkura, Y. Fluorometric high-
performance liquid chromatography of N-acetyl- and N-glycolylneuraminic acids and its
application to their microdetermination in human and animal sera, glycoproteins, and
glycolipids. Anal. Biochem. 1987, 164, 138-145.
(86) Cotterchio, M.; Seyfried, T. N. Serum gangliosides in mice with metastatic and non-
metastatic brain tumors. J. Lipid Res. 1994, 35, 10-14.
(87) Lacombe, R.; Salcedo, J.; Algeria, A.; Lagarda, M. J.; Barbera, R.; Mantencio, E.
Determination of sialic acid and gangliosides in biological samples and dairy products: a
review. J. Pharm. Biomed. Anal. 2010, 51, 346-357.
(88) Gizaw S.; Koda, T.; Amano, M.; Kamimura, K.; Ohashi, T.; Hinou, H.; Nishimura, S.-I. A
comprehensive glycome profiling of Huntington‟s disease transgenic mice. Biochim. Biophys.
Acta. 2015, 1850, 1704-1718.
(89) Yin, J.; Hashimoto, A.; Izawa, M.; Miyazaki, K.; Chen, G-Y.; Takamatsu, H.;
Kozutsumi, Y.; Suzuki, A.; Furukawa, K.; Cheng, F-L.; Lin, C-H.; Sato, C.; Kitajima, K.;
Kannagi R. Hypoxic culture induces expression of sialin, a sialic acid transporter, and cancer-
associated gangliosides containing non-human sialic acid on human cancer cells. Cancer Res.
2006, 66, 2937-2945.