good to great professional services
TRANSCRIPT
Going from Good to Great
Greg Buschman Regional Professional Solu�ons Manager (RPSM)
South East
Good to Great
Professional Services South East Regional Review
Agenda
From Good to Great – Professional Services Growth
Where We Were Where We Are Where We Are Headed
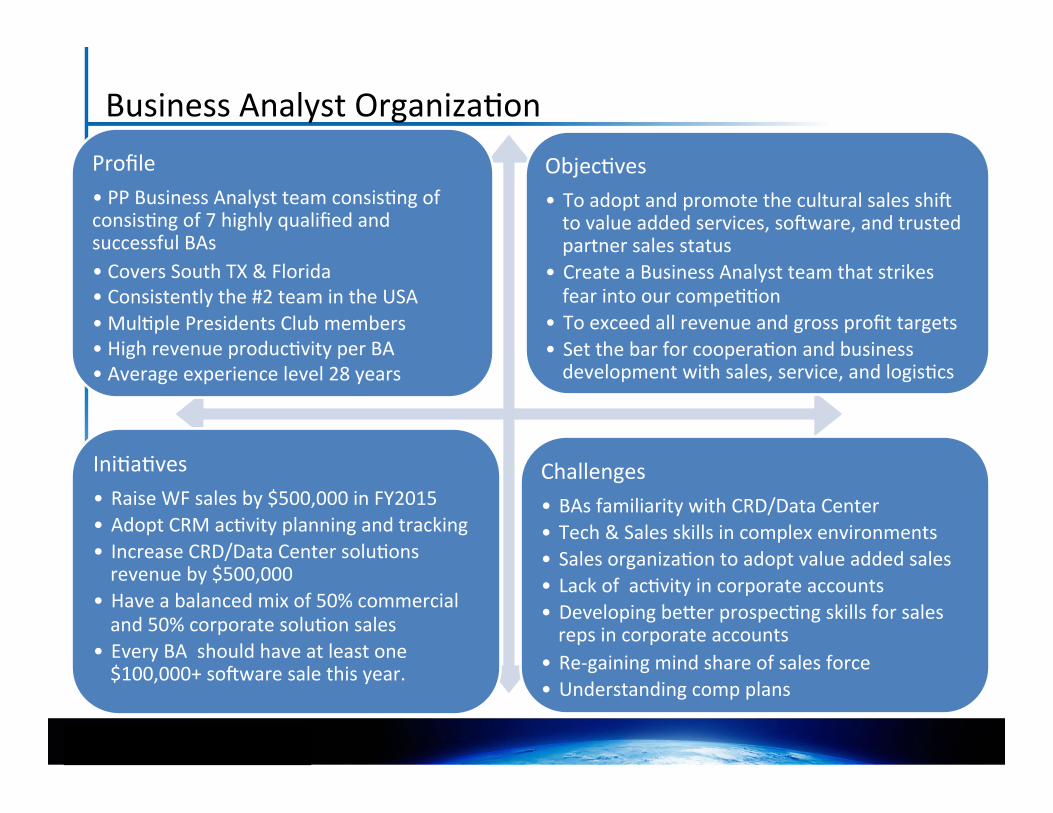
Business Analyst Organiza�on Profile • PP Business Analyst team consis�ng of consis�ng of 7 highly qualified and successful BAs • Covers South TX & Florida • Consistently the #2 team in the USA • Mul�ple Presidents Club members • High revenue produc�vity per BA • Average experience level 28 years
Objec�ves • To adopt and promote the cultural sales shi� to value added services, so�ware, and trusted partner sales status
• Create a Business Analyst team that strikes fear into our compe��on
• To exceed all revenue and gross profit targets • Set the bar for coopera�on and business development with sales, service, and logis�cs
Ini�a�ves • Raise WF sales by $500,000 in FY2015 • Adopt CRM ac�vity planning and tracking • Increase CRD/Data Center solu�ons revenue by $500,000
• Have a balanced mix of 50% commercial and 50% corporate solu�on sales
• Every BA should have at least one $100,000+ so�ware sale this year.
Challenges • BAs familiarity with CRD/Data Center • Tech & Sales skills in complex environments • Sales organiza�on to adopt value added sales • Lack of ac�vity in corporate accounts • Developing be�er prospec�ng skills for sales reps in corporate accounts
• Re-‐gaining mind share of sales force • Understanding comp plans

Where We Have Been FY2010 FY2010
– Total Professional Services sold in the South = $445,000 – Monthly produc�vity = $3090 per Solu�ons Analyst (SA) – No management metrics or measures – No revenue targets – No professional development ac�vi�es – No career path – Training was at a minimum – No concise job descrip�on – No revenue Targets – Solu�ons Analyst (SA) were a non-‐revenue genera�ng marketplace cost
The SA community needed to become a revenue genera�ng organiza�on not a cost center

Where We Have Been – FY2011
You Can Over Achieve if You Believe! – Regional President and myself, RPSM, set a goal to cover the SA community’s cost
– Monthly revenue goals: $7000/SA BHAG of $10,000 was set
– A shock wave went through the South, “These goals were impossible!” Created and launched professional services value added products such as training, on-‐site, and remote service packages and out tasking Completed sales training on how to sell professional services The RP met with VP’s and managers explaining the value of Professional Service dollars to our gross profit and bo�om line
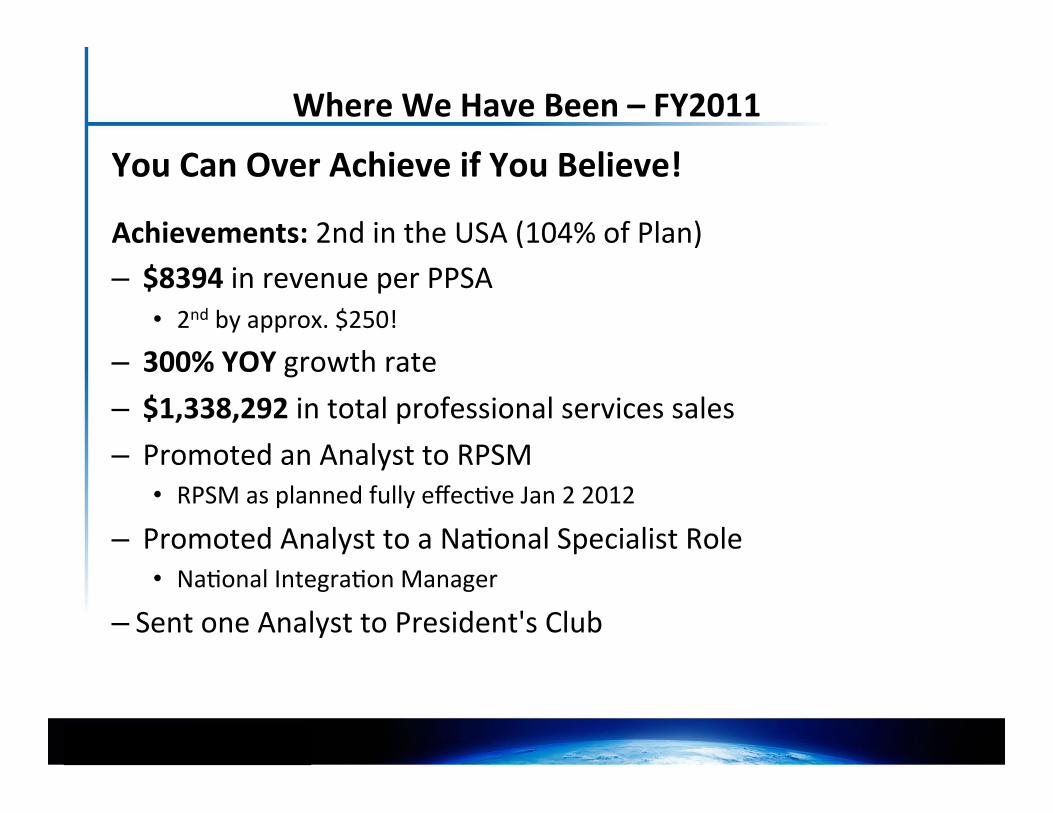
Where We Have Been – FY2011
You Can Over Achieve if You Believe!
Achievements: 2nd in the USA (104% of Plan) – $8394 in revenue per PPSA
2nd by approx. $250! – 300% YOY growth rate – $1,338,292 in total professional services sales – Promoted an Analyst to RPSM
RPSM as planned fully effec�ve Jan 2 2012 – Promoted Analyst to a Na�onal Specialist Role
Na�onal Integra�on Manager – Sent one Analyst to President's Club

Where We Have Been – FY2012
We began a shi� in sales cultural to value added services, solu�ons, and the development of a strategic account sales focus. – I challenged the RPSM’s to sell $1,000,000 in so�ware each
FY11 so�ware revenue was $100,000
– Strategic Account Growth: A Challenge from the COO ‘We are building a Major Account team that will make our
compe��on shake like when the PP team walks into an account, this is why I’ve hired the four RVPs of Major Accounts. When
this happens we will add the PP presence’ COO, Na�onal Leadership Mee�ng Oct, 2012
Thus began the SA migra�on from solu�ons analyst to Business Analyst.
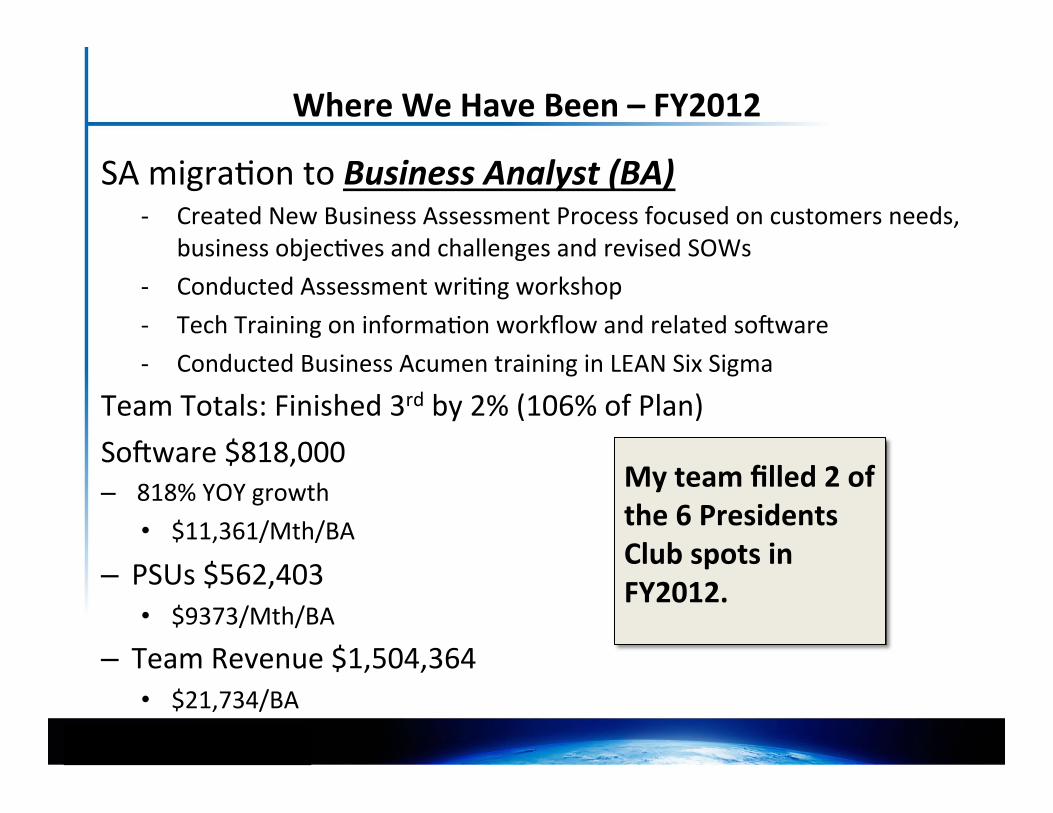
Where We Have Been – FY2012
SA migra�on to Business Analyst (BA) -‐ Created New Business Assessment Process focused on customers needs,
business objec�ves and challenges and revised SOWs -‐ Conducted Assessment wri�ng workshop -‐ Tech Training on informa�on workflow and related so�ware -‐ Conducted Business Acumen training in LEAN Six Sigma
Team Totals: Finished 3rd by 2% (106% of Plan) So�ware $818,000 – 818% YOY growth
$11,361/Mth/BA – PSUs $562,403
$9373/Mth/BA – Team Revenue $1,504,364
$21,734/BA
My team filled 2 of the 6 Presidents Club spots in FY2012.

Where We Have Been – FY2013
SA migra�on to Business Analyst (BA)
– Crea�on of professional services products related to G7 SOPs – Integrated training with service organiza�on – Working jointly with RVP and AVPs to redefine exis�ng and create new BA and service technologist responsibili�es. » Results in Florida reducing on-‐site service calls by 60% » AVP wins AVP of the year recognizing this transforma�on of the service business
– Con�nued growth in value based sales » Adding LEAN Manufacturing principles to the Business Assessment process

Where We Have Been – FY2013
SA migra�on to Business Analyst (BA) – RVP of Major Accounts team adopts strategic account selling methodology -‐ I a�end SAMA base training 12/5/2013
– My team adopts SAMA selling processes in Texas and Florida – QBR training is held in Florida and Texas -‐ BA community takes the lead on perfec�ng presenta�ons and processes
– Held first ever field based corporate technology training – Texas BA recognized as top so�ware sales in the na�on – Florida BA wins Global Sales Contest » Winning trip to Japan

Where Have We Been – FY2013
SA migra�on to Business Analyst
Accomplishments: Finished 2nd by 2% (114% of plan) – So�ware $908,501
$12,618/Mth/BA – $865,514 in Professional Services
YOY Growth 153% $12,021/Mth/BA
– Team Revenue $1,774,015 $24,639/BA
– Pay off in Professional Services due to Business Analyst focus – Even revenue distribu�on between services and so�ware – Sent one BA to Presidents Club

Where We Are: YTD Through December, 2014
..M-FLA.. ..M-SoTX .YTD'Actual YTD'%'of'PlanSoftware..Solutions.. $112,293.00 $120,452.00 $232,745.00 $227,825.00 102.16%Production'Solutions $127,298.00 $334,005.00 $461,303.00 $265,796.00 173.56%Totals $239,591.00 $454,457.00 $694,048.00 $493,621.00 140.60%
Professional9Services9All $784,253.00 $769,517.00 $1,553,770.00 $1,186,588.00 130.94%
Over9all9National9Ranking:9#1 140.00% SoftwareAccounts'for'67%'of'all'PSs 130% Prof.'Services#2'in'Hardware 101.61% Hardware
BA9National9RankingsBoca'Raton:'#7 163.85%South'Texas:'#11 133.59%Miami:'#13 128.17%Jacksonville:'#21 97.22%
Team Total YTD = $1,649,354 $26,180/mth/BA

Where We Are Going 2015
Team Ini�a�ves – Raise WF sales by $500,000 in FY2015
Team Total FY2013 $598,779 YTD FY2014 through Dec. $1,044,643
– Monthly revenue per BA = $32,500 BHAG $40,000
– Increase CRD/Data Center solu�ons revenue by $500,000 – Balanced mix: 50% commercial, 50% corporate solu�on sales – Every BA should have at least one $100,000+ so�ware sale this year (SoTX BA has three YTD FY2014)
– Team revenue of $3,000,000 Total revenue FY2010 FLA and SoTX = $225,000
Next Steps