gum market russia. key drivers of growth. Рынок жевательной резинки в...
TRANSCRIPT

Key growth drivers for Gum category in Russia 3 years perspective
Market overview
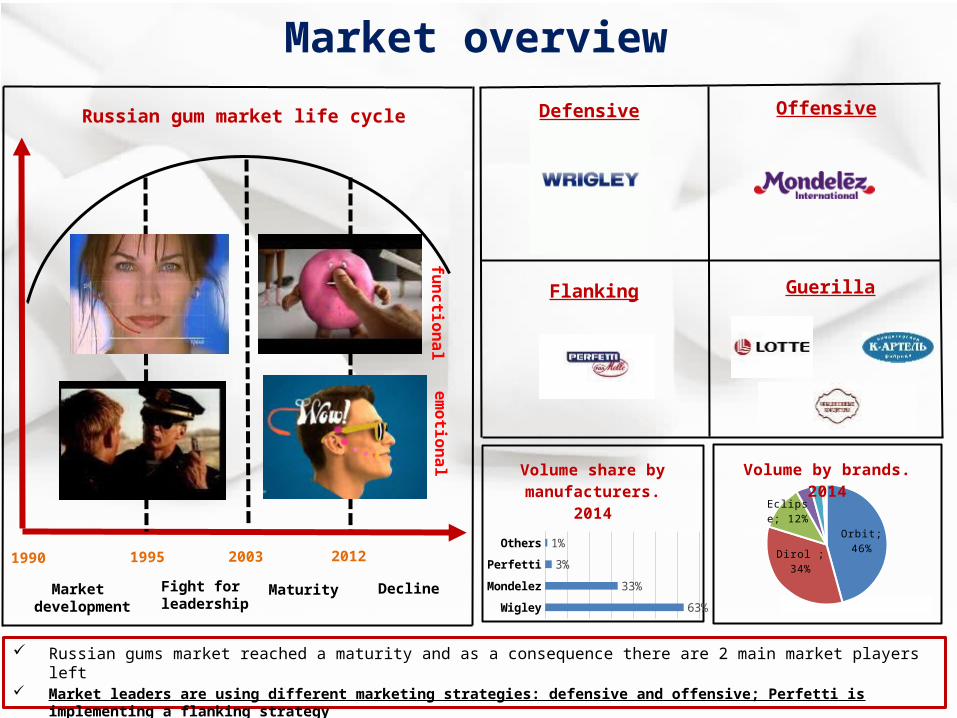
Russian gums market reached a maturity and as a consequence there are 2 main market players left Market leaders are using different marketing strategies: defensive and offensive; Perfetti is implementing a flanking strategy
Russian gum market life cycle
Market development
Fight for leadership
Maturity Decline
1990 1995 2003 2012
Flanking Guerilla
OffensiveDefensive
Wigley
Mondelez
Perfetti
Others
63%
33%
3%
1%
Volume share by manu-facturers. 2014
Orbit; 46%
Dirol ; 34%
Eclipse; 12%
Volume by brands. 2014
functionalem
otional
Market overview
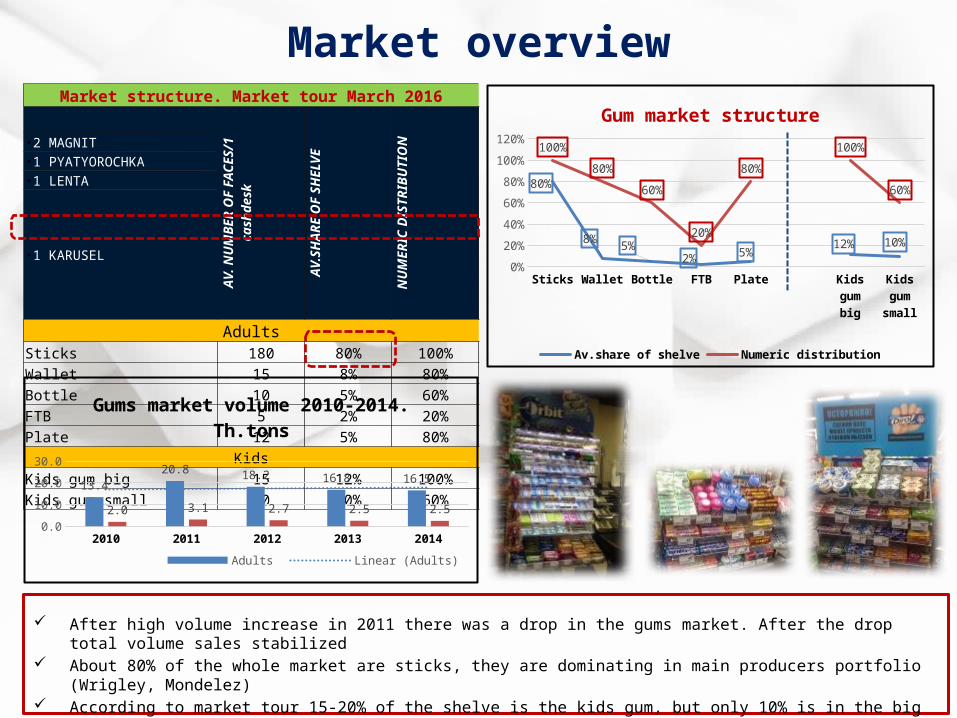
After high volume increase in 2011 there was a drop in the gums market. After the drop total volume sales stabilized About 80% of the whole market are sticks, they are dominating in main producers portfolio (Wrigley, Mondelez) According to market tour 15-20% of the shelve is the kids gum, but only 10% is in the big format Distribution increase of bottles could be a good opportunity for premium development
Market structure. Market tour March 2016
AV. NUMBER OF FACES/1
cashdeskAV.SHARE OF
SHELVENUMERIC
DISTRIBUTION
•2 MAGNIT•1 PYATYOROCHKA•1 LENTA •1 KARUSEL
AdultsSticks 180 80% 100%Wallet 15 8% 80%Bottle 10 5% 60%FTB 5 2% 20%Plate 12 5% 80%
KidsKids gum big 15 12% 100%Kids gum small 10 10% 60%
Sticks Wallet Bottle FTB Plate Kids gum big
Kids gum small
0%
20%
40%
60%
80%
100%
120%
80%
8%5%
2% 5%12% 10%
100%
80%
60%
20%
80%
100%
60%
Gum market structure
Av.share of shelve Numeric distribution
2010 2011 2012 2013 20140.0
5.0
10.0
15.0
20.0
25.0
13.4
20.818.2 16.8 16.5
2.0 3.1 2.7 2.5 2.5
Gums market volume 2010-2014. Th.tons
Adults Linear (Adults) Kids
Gum. Key growth factors3 years perspective
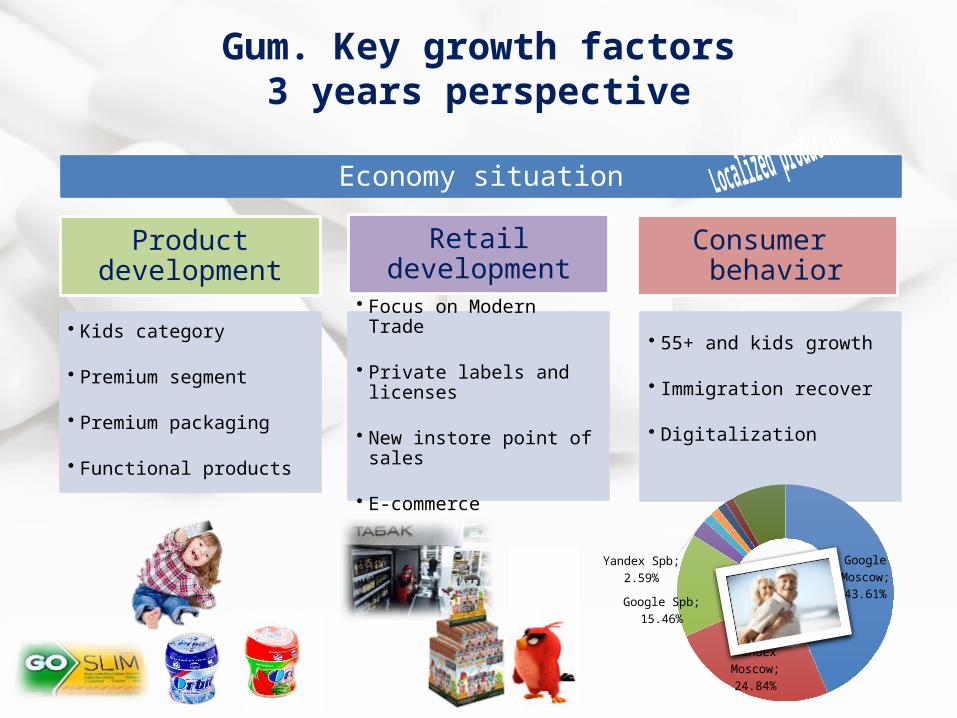
Economy situation
• Kids category
• Premium segment
• Premium packaging
• Functional products
• Focus on Modern Trade
• Private labels and licenses
• New instore point of sales
• E-commerce
Consumer behavior
• 55+ and kids growth
• Immigration recover
• Digitalization
Product development
Retaildevelopment
Google Moscow; 43.61%
Yandex Moscow; 24.84%
Google Spb; 15.46%
Yandex Spb; 2.59%
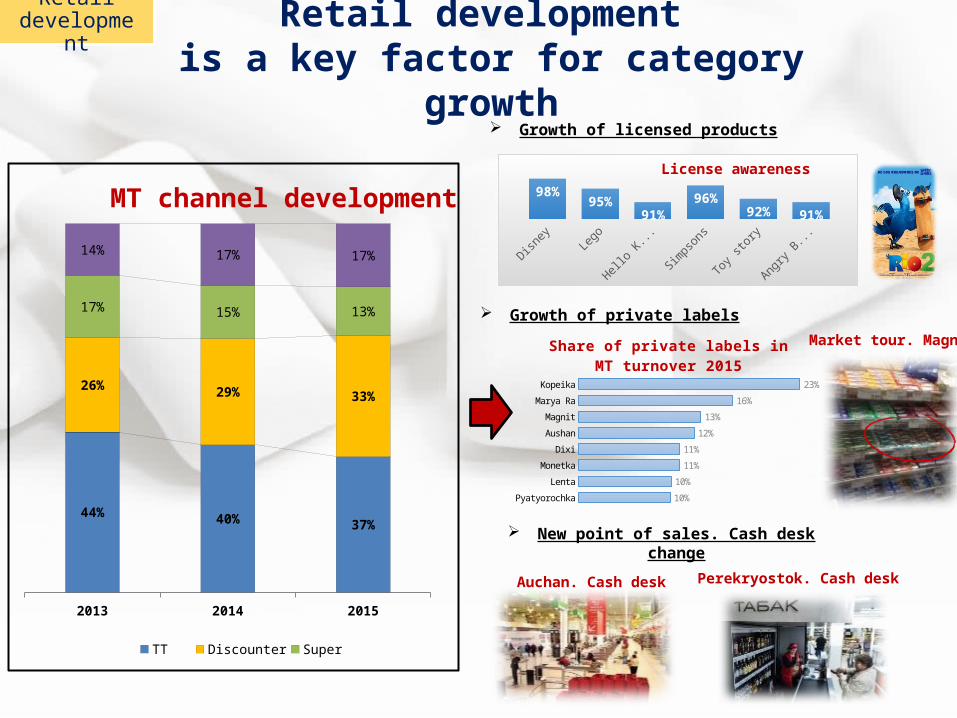
Retail development is a key factor for category growth
2013 2014 2015
44% 40% 37%
26% 29% 33%
17% 14% 13%
14% 17% 17%
MT channel development
TT Discounter Super Hyper
Growth of private labels
New point of sales. Cash desk change
Disney Lego Hello Kitty Simpsons Toy story Angry Birds
98%95%
91%96%
92% 91%
License awareness
Growth of licensed products
Pyatyorochka
Lenta
Monetka
Dixi
Aushan
Magnit
Marya Ra
Kopeika
10%
10%
11%
11%
12%
13%
16%
23%
Share of private labels in MT turnover 2015
Market tour. Magnit
Auchan. Cash desk
Retaildevelopment
Perekryostok. Cash desk
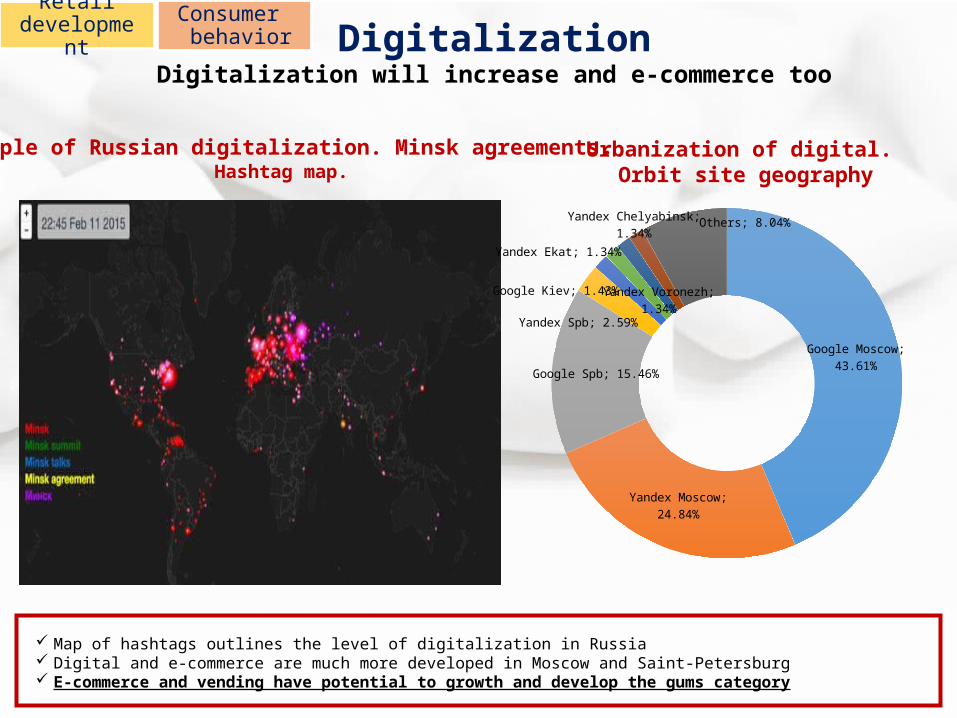
DigitalizationDigitalization will increase and e-commerce too
Map of hashtags outlines the level of digitalization in Russia Digital and e-commerce are much more developed in Moscow and Saint-Petersburg E-commerce and vending have potential to growth and develop the gums category
Example of Russian digitalization. Minsk agreements.Hashtag map.
Urbanization of digital. Orbit site geography
Google Moscow; 43.61%
Yandex Moscow; 24.84%
Google Spb; 15.46%
Yandex Spb; 2.59%
Google Kiev; 1.43%Yandex Voronezh; 1.34%
Yandex Ekat; 1.34%
Yandex Chelyabinsk; 1.34% Others; 8.04%
Retaildevelopment
Consumer behavior
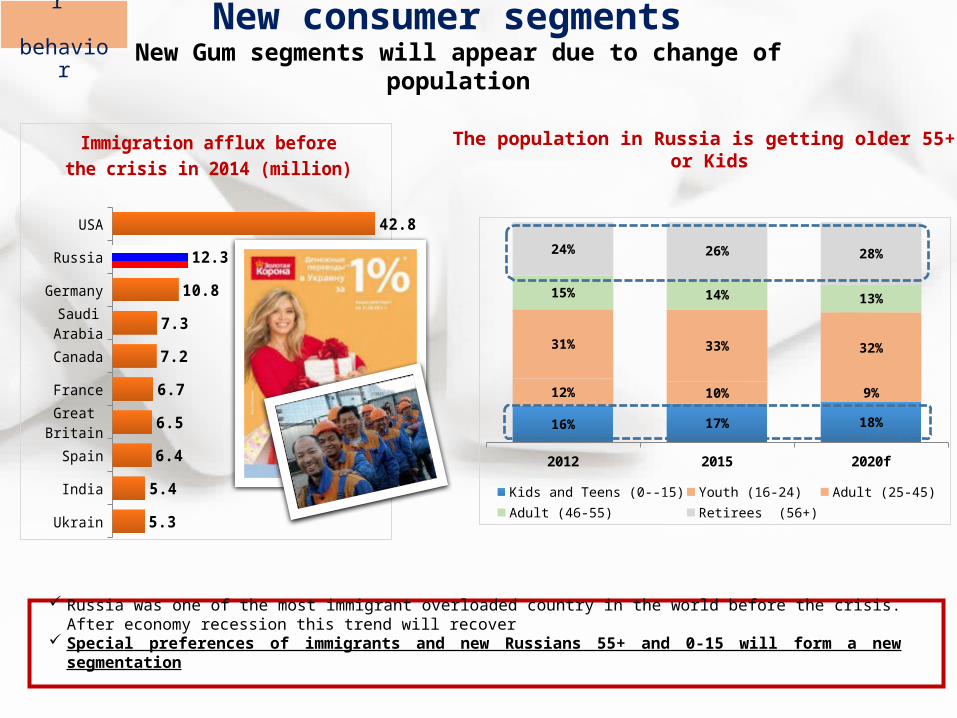
New consumer segments New Gum segments will appear due to change of population
2012 2015 2020f
16% 17% 18%
12% 10% 9%
31% 33% 32%
15% 14% 13%
24% 26% 28%
Kids and Teens (0--15) Youth (16-24) Adult (25-45) Adult (46-55)Retirees (56+)
Russia was one of the most immigrant overloaded country in the world before the crisis. After economy recession this trend will recover
Special preferences of immigrants and new Russians 55+ and 0-15 will form a new segmentation
The population in Russia is getting older 55+ or Kids
USA
Russia
Germany
Saudi Arabia
Canada
France
Great Britain
Spain
India
Ukrain
42.8
12.3
10.8
7.3
7.2
6.7
6.5
6.4
5.4
5.3
Immigration afflux before the crisis in 2014 (million)
Consumer behavior
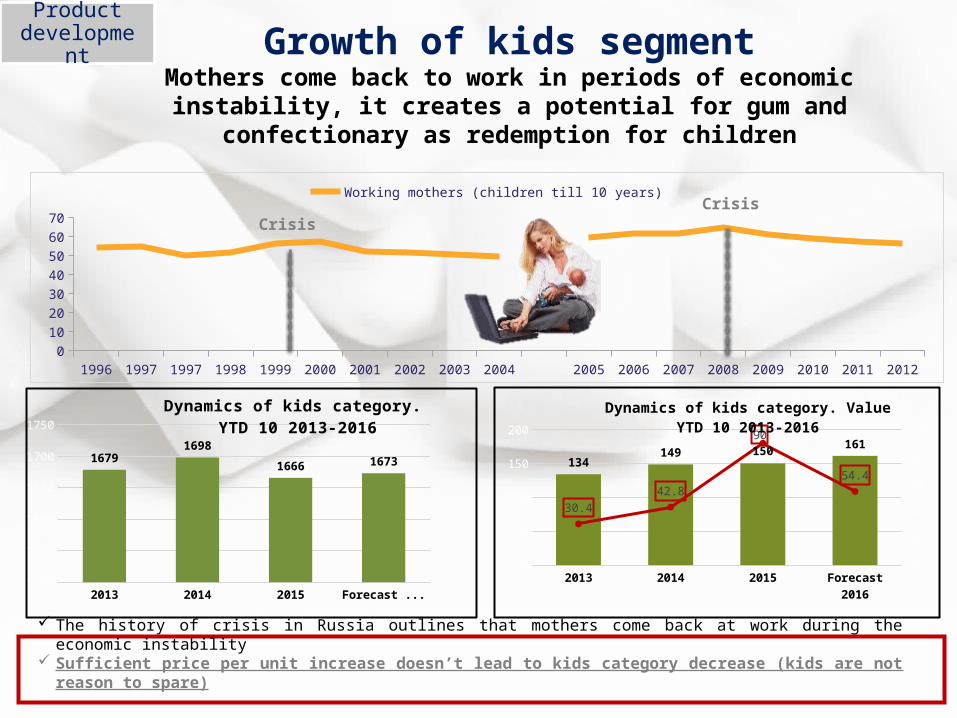
Growth of kids segmentMothers come back to work in periods of economic
instability, it creates a potential for gum and confectionary as redemption for children
1996 1997 1997 1998 1999 2000 2001 2002 2003 2004 2005 2006 2007 2008 2009 2010 2011 20120
10203040506070
Working mothers (children till 10 years)
The history of crisis in Russia outlines that mothers come back at work during the economic instability Sufficient price per unit increase doesn’t lead to kids category decrease (kids are not reason to spare)
CrisisCrisis
2013 2014 2015 Forecast 20161500
1550
1600
1650
1700
1750
16791698
1666 1673
Dynamics of kids category. YTD 10 2013-2016
Volume. Tons
2013 2014 2015 Forecast 20160
20406080
100120140160180
0102030405060708090100
134149 150 161
30.442.8
90
54.4
Dynamics of kids category. ValueYTD 10 2013-2016
Product development
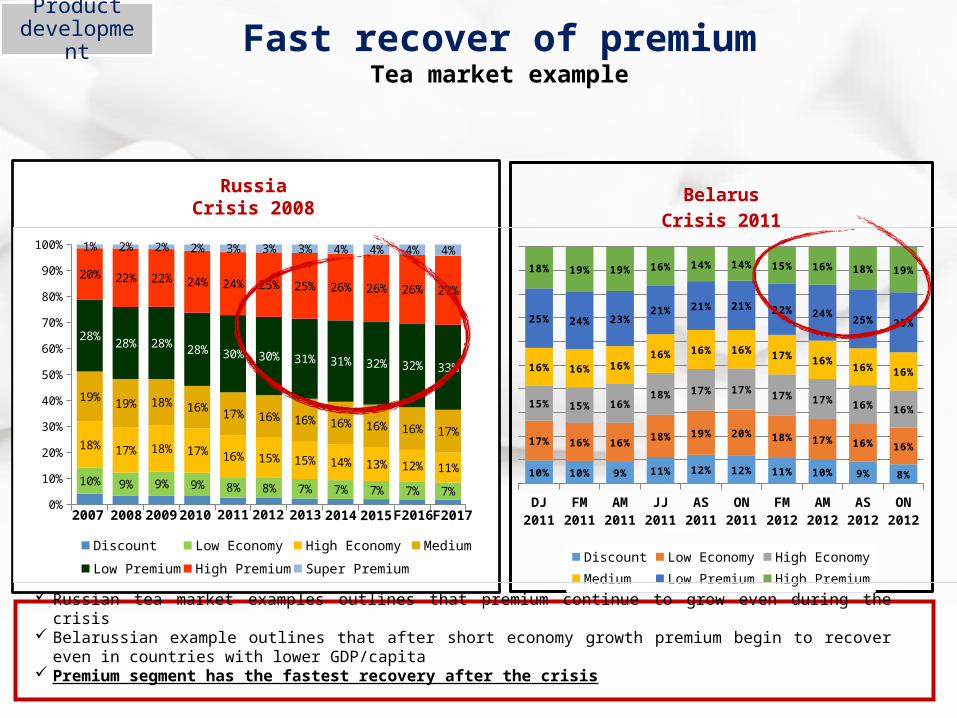
Fast recover of premiumTea market example
DJ 2011
FM 2011
AM 2011
JJ 2011
AS 2011
ON 2011
FM 2012
AM 2012
AS 2012
ON 2012
10% 10% 9% 11% 12% 12% 11% 10% 9% 8%
17% 16% 16%18% 19% 20% 18% 17% 16% 16%
15% 15% 16%18% 17% 17% 17% 17% 16% 16%
16% 16% 16%16% 16% 16% 17% 16%
16% 16%
25% 24% 23%21% 21% 21% 22% 24%
25% 25%
18% 19% 19% 16% 14% 14% 15% 16% 18% 19%
BelarusCrisis 2011
Discount Low Economy High EconomyMedium Low Premium High Premium
Russian tea market examples outlines that premium continue to grow even during the crisis Belarussian example outlines that after short economy growth premium begin to recover even in countries with lower
GDP/capita Premium segment has the fastest recovery after the crisis
201520142013200920082007 201220112010 F2016 F2017
RussiaCrisis 2008
2007 2008 2009 2010 2011 F2012 F2013 F2014 F2015 F2016 F20170%
10%
20%
30%
40%
50%
60%
70%
80%
90%
100%
10% 9% 9% 9% 8% 8% 7% 7% 7% 7% 7%
18% 17% 18% 17% 16% 15% 15% 14% 13% 12% 11%
19% 19% 18% 16% 17% 16% 16% 16% 16% 16% 17%
28% 28% 28% 28% 30% 30% 31% 31% 32% 32% 33%
20% 22% 22% 24% 24% 25% 25% 26% 26% 26% 27%
1% 2% 2% 2% 3% 3% 3% 4% 4% 4% 4%
Discount Low Economy High Economy Medium
Low Premium High Premium Super Premium
2007 2008 2009 2010 2011 2012 2013 F201620152014 F2017
Product development
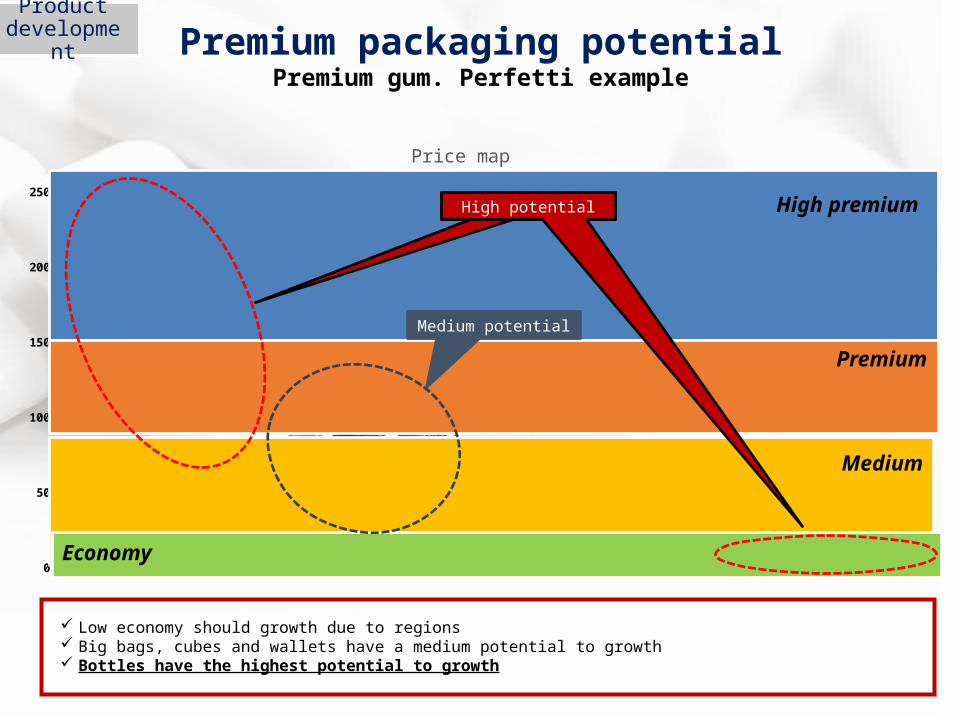
Premium packaging potentialPremium gum. Perfetti example
Low economy should growth due to regions Big bags, cubes and wallets have a medium potential to growth Bottles have the highest potential to growth
0
50
100
150
200
250
Series1
Price map
High premium
Economy
Medium
Premium
High potentialHigh potential
Medium potential
Product development
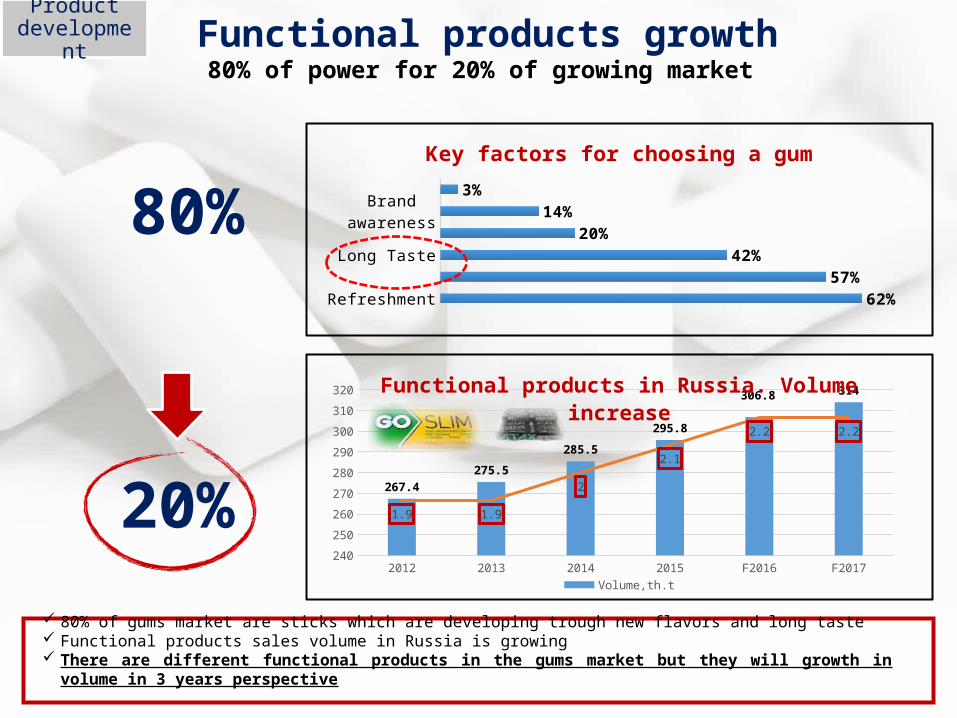
Functional products growth80% of power for 20% of growing market
80% of gums market are sticks which are developing trough new flavors and long taste Functional products sales volume in Russia is growing There are different functional products in the gums market but they will growth in volume in 3 years perspective
2012 2013 2014 2015 F2016 F2017240
250
260
270
280
290
300
310
320
1.7
1.8
1.9
2
2.1
2.2
2.3
267.4275.5
285.5
295.8
306.8 314
1.9 1.9
2
2.1
2.2 2.2
Functional products in Russia. Volume increase
Volume,th.t kg/pers.
RefreshmentFlavor
Long TastePrice
Brand awarenessHealthy
62%57%
42%20%
14%3%
Key factors for choosing a gum
80%
20%
Product development
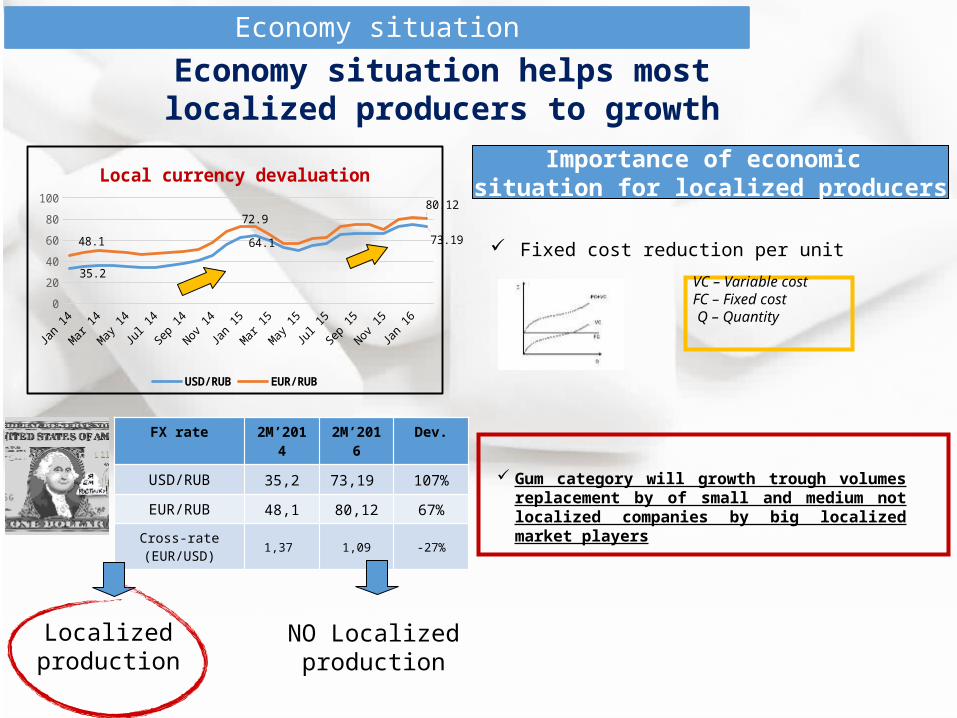
Economy situation helps most localized producers to growth
Importance of economic situation for localized producers
0102030405060708090
35.2
64.1 73.1948.1
72.980.12
Local currency devaluation
USD/RUB EUR/RUB
FX rate 2M’2014
2M’2016
Dev.
USD/RUB 35,2 73,19 107%EUR/RUB 48,1 80,12 67%Cross-rate (EUR/USD) 1,37 1,09 -27%
Fixed cost reduction per unit VC – Variable cost FC – Fixed cost Q – Quantity
Gum category will growth trough volumes replacement by of small and medium not localized companies by big localized market players
Economy situation
Localized production
NO Localized production
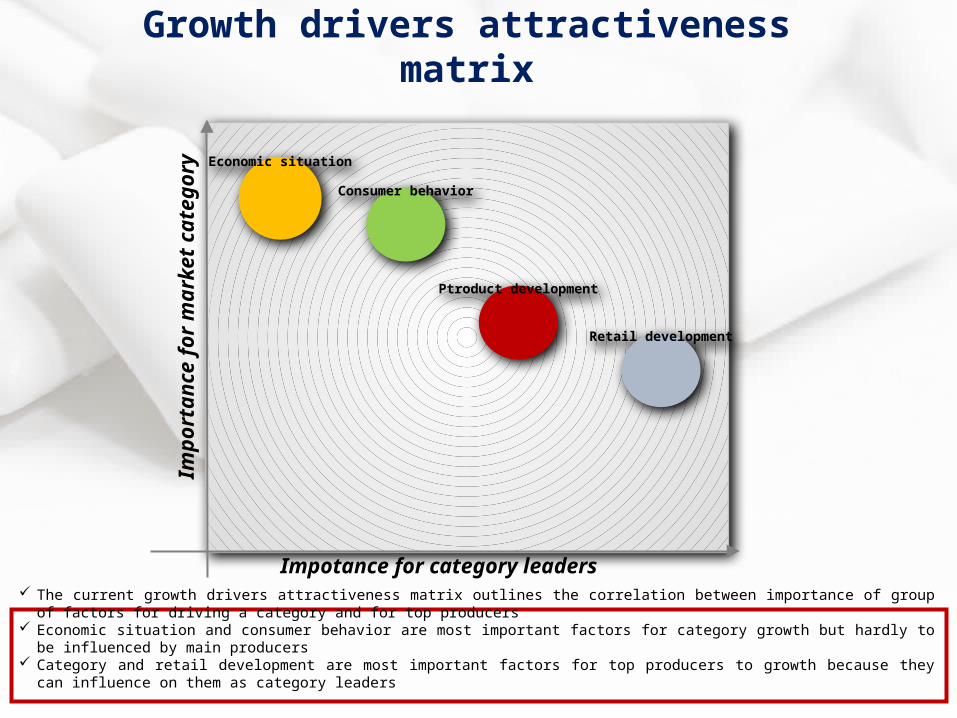
Growth drivers attractivenessmatrix
Impotance for category leaders
The current growth drivers attractiveness matrix outlines the correlation between importance of group of factors for driving a category and for top producers
Economic situation and consumer behavior are most important factors for category growth but hardly to be influenced by main producers Category and retail development are most important factors for top producers to growth because they can influence on them as category leaders
Impo
rtan
ce f
or m
arke
t ca
tego
ry Economic situation
Retail development
Ptroduct development
Consumer behavior

Thanks for your attention!!!