harpoon instructions -...
TRANSCRIPT

1
HARPOON Instructions
Index: Materials needed for the experiment Included in kit…………………………………………………..1 Required, but not included……………………………………1 Experimental instructions Electrode preparation…………………………………………2 Data collection…………………………………………………2 Image processing and workup……………………………….5 Getting Started Filter construction……………………………………………..8 ImageJ………………………………………………………….9 Manual image processing and workup……………………..9 Adjusting the current of the power supply………………….16
Materials needed for the experiment Included in kit: Acrylic electrode holder (1) Stainless steel mesh coated with fluorescent paint on one side (2) Constant-current power supply (1) 400 nm LED flashlight (1) Culture flasks to construct optical filters (2) Graphite counter electrode (1)
FTO-coated glass electrodes, 3 3” (4) Metal nitrate salts NaOH (?) Required, but not included in kit:
Recrystallization dish (190 100 mm, diameter height), or other container 25 mL volumetric flask Micropipet 1μL, 1 mL (optional)
Saran wrap (plastic lid will be included in newer kits) Digital camera Kiln Inert gas (N2 or Ar) Methanol Conductive graphite tape Lab stands (2) and clamps (4) Software: Spreadsheet program (such as Excel or Libre Office) ImageJ (download available at http://rsbweb.nih.gov/ij/download.html)

2
Experiment instructions: **Directions for setting up the experiment for the first time are given at the end of this manual. Electrode preparation 1. For each metal you wish to include on your electrode, prepare 25 mL of a 0.005 M metal nitrate solution (0.005 M in the metal cation). Glycerol can be included (9 % by volume), if available, to promote even evaporation.
2. To prepare mixed-metal oxide precursors, mix the appropriate metal nitrate solutions together in the desired ratios. For example a 50:25:25 mixture of Ni, Fe, and Ca solutions could be prepared by combining 0.50 mL of the Ni solution, 0.25 mL of the Fe solution, and 0.25 mL of the Ca solution. A suggested template is included in the HARPOON section of thesolararmy.org.
3. Rinse a 3 3” electrode with distilled water and dry. Rinse the FTO-coated side with methanol, place the electrode (FTO side up) on a paper towel, and allow to air dry. You can determine which side is coated with FTO by lightly scratching a piece of metal on both sides of the electrode; a metallic mark will be observed on the FTO side. Alternatively, you can scratch both sides with your fingernail; the FTO side will feel rougher than the glass side. 4. Position the electrode on top of the spotting template. Pipet 1 μL of each solution onto the FTO side
of the electrode; try to place the solution in the middle of the appropriate circle on the template. Make sure you spot the reference solution (Ni-Fe-Co in a 2:4:4 ratio) on every electrode. 5. (Optional – particularly useful if the electrode will not be placed immediately into a kiln) Place the electrode on a hotplate and increase the temperature to “medium” and allow the water to evaporate. Turn the hotplate off, allow the electrode to completely cool, and then remove the electrode. 6. Place the electrode in a kiln and heat for 6 h at 500 ºC. If the kiln allows you to control the speed at which it heats up, set the temperature ramp rate to 250 °C/h. Data collection 1. Place the electrode in the bottom piece of the electrode holder such that the metal oxide spots are facing up.
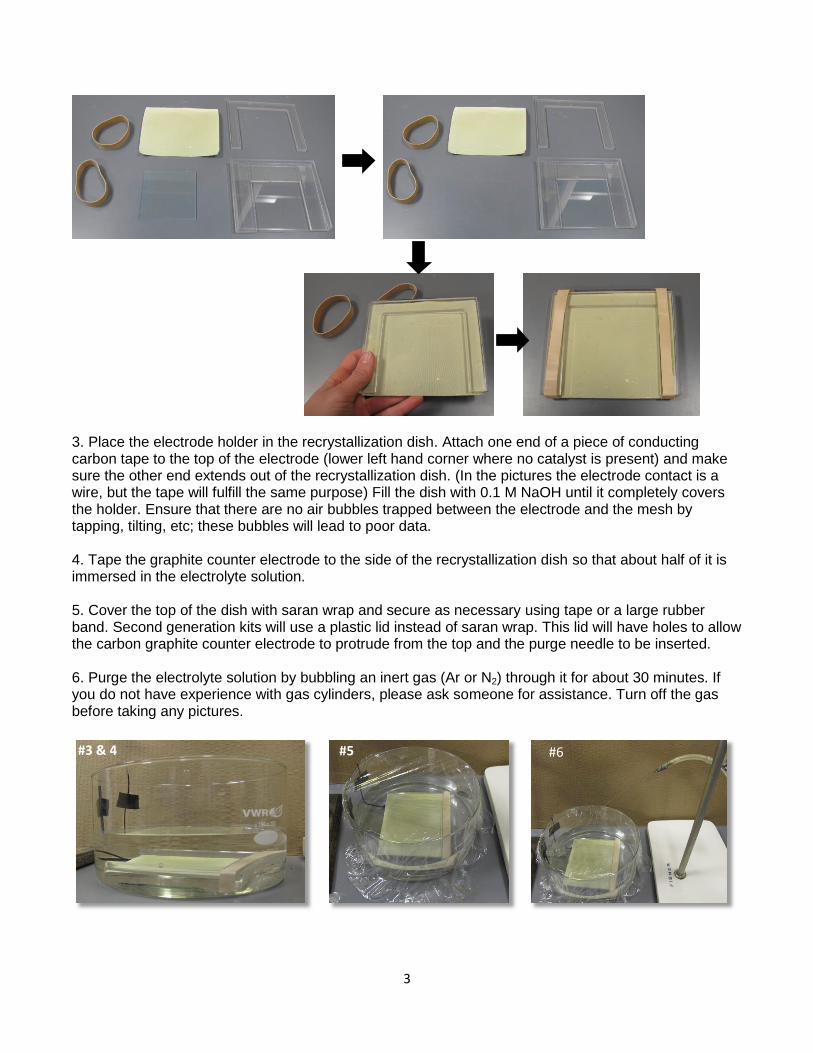
2. Position the mesh (paint side up) and top of the electrode holder above the electrode and secure the whole apparatus with two rubber bands.
3
3. Place the electrode holder in the recrystallization dish. Attach one end of a piece of conducting carbon tape to the top of the electrode (lower left hand corner where no catalyst is present) and make sure the other end extends out of the recrystallization dish. (In the pictures the electrode contact is a wire, but the tape will fulfill the same purpose) Fill the dish with 0.1 M NaOH until it completely covers the holder. Ensure that there are no air bubbles trapped between the electrode and the mesh by tapping, tilting, etc; these bubbles will lead to poor data. 4. Tape the graphite counter electrode to the side of the recrystallization dish so that about half of it is immersed in the electrolyte solution. 5. Cover the top of the dish with saran wrap and secure as necessary using tape or a large rubber band. Second generation kits will use a plastic lid instead of saran wrap. This lid will have holes to allow the carbon graphite counter electrode to protrude from the top and the purge needle to be inserted. 6. Purge the electrolyte solution by bubbling an inert gas (Ar or N2) through it for about 30 minutes. If you do not have experience with gas cylinders, please ask someone for assistance. Turn off the gas before taking any pictures.
#3 & 4 #5 #6

4
7. Using clamps, position the LED flashlight so that it illuminates the whole mesh. Position the blue filter below it (almost touching). 8. Using clamps, position the camera so that the entire mesh can be imaged. Position the yellow filter below the camera. The camera’s flash should be turned off and the macro setting should be used (this setting is for taking pictures of close objects and is usually represented with a picture of a tulip). It is important that the camera remain stationary during the whole experiment; this may require the use of a remote control or a steady hand. 9. Turn off the lights in the room. Turn on the flashlight and take a picture. The mesh should appear orange in the picture; if the mesh appears green, purge the electrolyte for another 10 minutes. The camera and electrode should be positioned so that the pictures show the electrode upside down; this will ensure that the images will be processed properly. 10. Attach the black alligator clip to the graphite counter electrode and the red alligator clip to the tape (attached to the FTO electrode). Plug in the constant-current power supply. If you have a multimeter, you can confirm that there are 5 mA of current passing; directions for doing this are given on page 16.
11. With the flashlight on, take a picture every 30 seconds, for a total of 10 minutes.
Top of electrode Black alligator clip to graphite rod
Red alligator clip to FTO electrode

5
Image processing and workup 1. Save the images from the camera to a new folder on your computer.
2. Open the ImageJ software. Under the Edit tab choose Options > Conversions and make sure the Scale when converting box is not checked.
3. Under Plugins > Macros select Harpoon Processor.
The Choose a Directory window will appear. Locate the folder with the images from your experiment and then click Select.
6
This will open all of the jpeg files in the folder and combine all of your images into one window, called a stack, which allows you to edit all the images in the same way at the same time.
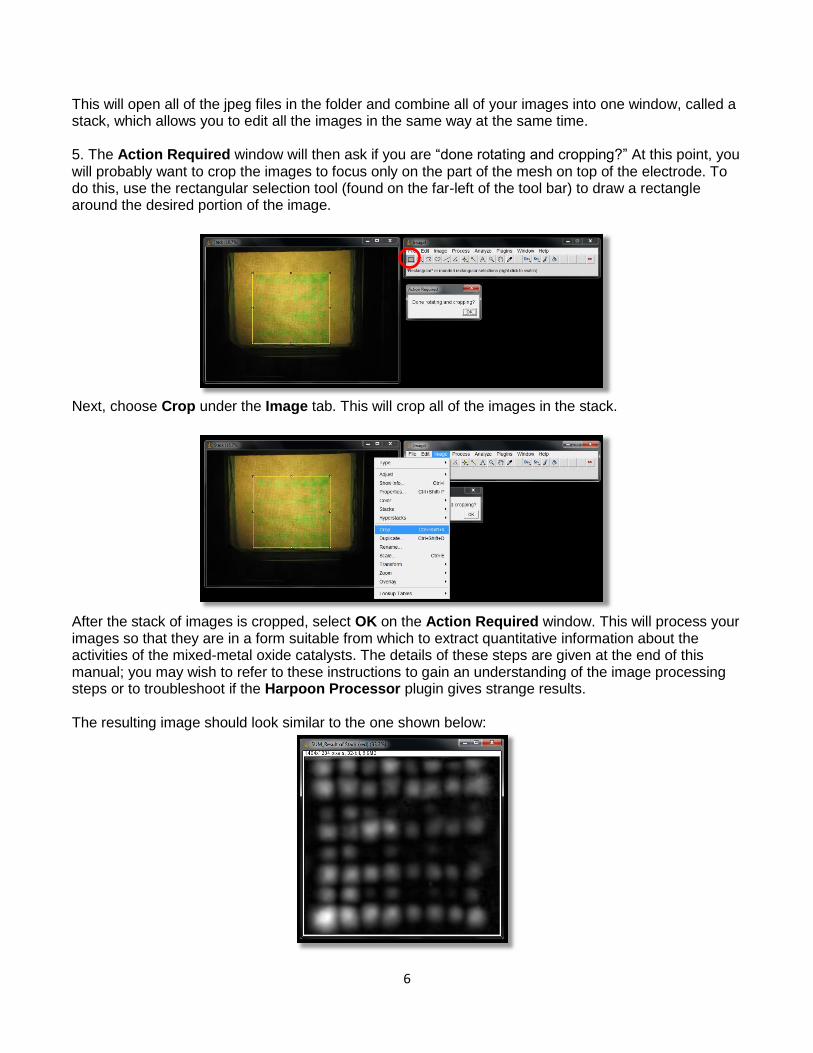
5. The Action Required window will then ask if you are “done rotating and cropping?” At this point, you will probably want to crop the images to focus only on the part of the mesh on top of the electrode. To do this, use the rectangular selection tool (found on the far-left of the tool bar) to draw a rectangle around the desired portion of the image.
Next, choose Crop under the Image tab. This will crop all of the images in the stack.
After the stack of images is cropped, select OK on the Action Required window. This will process your images so that they are in a form suitable from which to extract quantitative information about the activities of the mixed-metal oxide catalysts. The details of these steps are given at the end of this manual; you may wish to refer to these instructions to gain an understanding of the image processing steps or to troubleshoot if the Harpoon Processor plugin gives strange results. The resulting image should look similar to the one shown below:

7
6. Next you will save this image as a tiff. Select File > Save As > Tiff, and save the image to the folder with the raw images. Be sure to give the file a descriptive name. 7. This step is optional, but it may be easier to see the spots if the color scheme is changed. To do this, select Image > Lookup Tables > Fire. Feel free to explore other color schemes besides Fire, but Fire provides nice contrast between regions of different O2 production. The resulting image should look similar to the one shown below:
8. From this image you can see that some spots are brighter than others. To quantify this, we want to run the Harpoon Analyzer plugin, which can be found under Plugins > Analyze. The Grid window will appear with some initial guesses for the grid parameters. Select OK; this will put a grid on top of your image. Confirm that there are 8 columns and 8 rows in the grid. You want each of the spots to be in a square of the grid. In the example below, you can see that the grid is not correct (the boxes on the right and bottom are not complete), so in the Ok? window select Cancel. Adjust Tile Height, Tile Width, X offset, and Y offset.
Once the grid is correct, as seen below, select OK. The Overthruster! (we’ll change the name of this window before wider distribution) window will appear, and in the Threshold textbox enter threshold value that you can determine as described below in # 9 (Usually a number between 100 and 200). Select OK (if you don’t know the threshold value yet, select Cancel). The plugin will then tabulate a list of maxima for each box in the grid.

8
Confirm that there are 64 entries in the table. If not, confirm that your grid has 64 complete squares (having additional partial squares is fine). If the grid appears fine and you have too many entries in your table, you may need to change the Threshold to a larger value. Close the Results Window and run the Harpoon Analyzer plugin again.
9. To determine the value to enter for the threshold, select Process > Find Maxima. A window will appear; set the Output type to Point Selection, and check the Preview point selection box. Now you can vary the number in the Noise tolerance box and see which points will be selected if this threshold is used. You want to find the lowest number that selects the catalyst spots without selecting additional extraneous points. If you can still see the grid overlay, you will only want one maximum per square in your grid. Once you know the threshold value, run the Harpoon Analyzer again, and enter this number when prompted
10. Copy your tabulated results and paste them into Sheet 2 of the HARPOON Data Workup excel spreadsheet. This will give you the activities of the catalysts in both tabular and graphical form.
Getting started - Initial setup instructions: Filter construction Two filters will be necessary for the experiment. The blue filter is placed under the LED flashlight during the experiment; this is required because the flashlight produces a wider range of wavelengths of light than we would like, so we filter out the wavelengths longer than 400 nm. The yellow filter is placed
9
underneath the camera during the experiment. This filter allows us to image the fluorescence emitted from the mesh while filtering out the light from the flashlight. Blue filter. Prepare 500 mL of a 0.0375 M aqueous solution of CuSO4. The solution will be light blue in
color. Add ammonia (28% aqueous NH4OH solution, available from Sigma:
http://www.sigmaaldrich.com/catalog/product/sial/320145?lang=en®ion=US) to the solution. Initially
you will see a pale blue precipitate form (this is copper hydroxide, Cu(OH)2), but the addition of more
ammonia will result in a bright blue solution (the blue color is from the Cu(NH3)42+ complex ion); it will
probably require around 20 mL of the NH4OH solution. Pour the resulting blue solution into one of the
plastic culture flasks.
Yellow filter. Add around two drops of yellow food coloring to 500 mL of water. Stir the resulting solution and pour it into a plastic culture flask. ImageJ 1. Download the appropriate version (Mac or Windows) of ImageJ from http://rsbweb.nih.gov/ij/download.html. If you are using Windows, download the version bundled with Java.
2. Copy the Harpoon Processor text (available for download at thesolararmy.org) and append it to the file ImageJ\macros\StartupMacros.txt, an option called "Harpoon Processor" will appear in the Macros menu in ImageJ upon startup.
3. Save the Harpoon Analyzer plugin (Harpoon_Analyzer.java) in ImageJ\plugins\Analyze. You can now access this plugin from the ImageJ window: Plugins > Compile and Run and select the file Harpoon_Analyzer.java. This will create the file Harpoon_Analyzer.class, and the plugin should now be available via Plugins > Analyze > Harpoon Analyzer.
Manual image processing and workup 1. Save the images from the camera to a new folder on your computer.
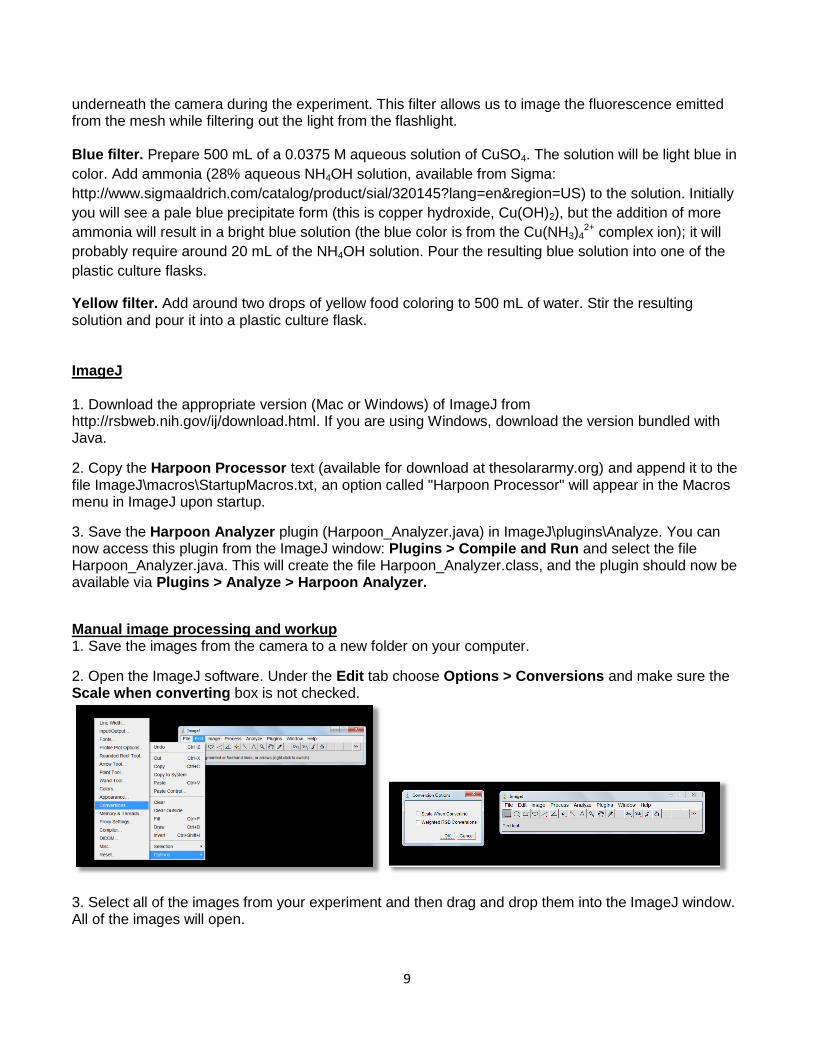
2. Open the ImageJ software. Under the Edit tab choose Options > Conversions and make sure the Scale when converting box is not checked.
3. Select all of the images from your experiment and then drag and drop them into the ImageJ window. All of the images will open.

10
4. Under Images > Stacks choose “Images to Stack”. The Images to Stack window will appear; check the Use Titles as Labels box and uncheck the Keep Source Images box. Feel free to change the name in the Name textbox if you would like, and when finished choose OK. This will combine all of your images into one window and you will be able to edit all the images in the same way at the same time.
5. At this point, you may wish to crop the images to focus only on the part of the mesh on top of the electrode. To do this, use the rectangular selection tool (found on the far-left of the tool bar) to draw a rectangle around the desired portion of the image.
Next, choose Crop under the Image tab. This will crop all of the images in the stack.
6. Next, we want obtain the red and green part of the images. To do this, go to Images > Color > Split channels. This will split your image stack into separate red, green, and blue stacks.

11
You can close the window for the blue stack because you will not need it.
7. Select the green stack window. Under Image >Type, choose 32-bit.
Then under Process > Filter > Gaussian blur enter a radius of “7.00”.

12
The Process Stack? window will then ask “Process all images? There is no Undo if you select “Yes””; choose Yes. You will see this message several times during data processing, and can always select “Yes”.
8. Repeat these steps with the red stack. 9. When illuminated with 400 nm light in the absence of O2, the fluorescent paint on the mesh fluoresces both red and green. In the presence of O2, the red fluorescence is quenched (no longer present) and we only see the green. Therefore, the ratio of the red fluorescence to the green fluorescence is useful in determining the activities of the catalysts. To calculate this, choose Image Calculator under the Process tab.

13
The Image Calculator window will open. In the Image1 drop-down list select Stack (red), in the Operation drop-down list select Divide, and in the Image2 drop-down list select Stack (green). Make sure the Create new window and 32-bit (float) result boxed are checked, and then choose OK.
10. Select the resulting stack. In the ImageJ main window under the Process tab choose Math > Multiply.
In the Multiply window enter “128” into the Value textbox.
11. Next you will sum the images together so that the amount of O2 formed during the whole experiment can be visualized. In the Image tab of the main window select Stacks > Z Project.

14
The ZProjection window will appear; the Start slice textbox should read “1” and the Stop slice textbox should be the number of images in your experiment. In the Projection type drop-down list choose Sum Slices.
12. In the ImageJ main window, choose Edit > Invert. This inverts the colors of the image.
13. You want the top of the electrode to be at the top of the image. If this is not the case (due to the orientation of the camera during the experiment), then the image needs to be rotated. To do this, select Image > Transform > Rotate.

15
The Rotate window will appear, and in the Angle (degrees) textbox enter the appropriate value (180º in the example below) to correctly orient the image.
14. Next you will apply a background correction to account for uneven illumination/fluorescence over the imaged mesh. Select Process > Subtract Background.
The Subtract Background window will appear. Check the Sliding paraboloid box and in the Rolling ball radius textbox enter a value of “150” pixels.
15. Next you will save this image as a tiff. Select File > Save As > Tiff, and save the image to the folder with the raw images. Be sure to give the file a descriptive name.

16
At this point the instructions are the same as in the Image processing and workup section. Adjusting the Current Settings of the Power Supply
You can use a multimeter to check the current setting of the constant-current power supply. Set the
multimeter to read current. To do this put the black probe into the “COM” jack and the red probe into the
jack labeled “mA”. Then turn the dial to read milliamps.
Here is a good youtube tutorial that might be helpful, especially if your multimeter is different than the
one in the pictures:
http://www.youtube.com/watch?v=bF3OyQ3HwfU
As shown below, attach the black alligator clip of the constant-current power supply to the black probe
of the multimeter, and the red alligator clip to the red probe of the multimeter.
Probes in the COM and mA jacks
Dial turned to the appropriate setting

17
Plug in the power supply and observe the reading on the multimeter; it should read about 5 mA.
If the current of the power supply is not set to 5 mA, it can be adjusted by turning the screw on the top
of the metal box with a screwdriver (or spatula, like in the picture below). Turning the screw clockwise
should increase the current and counter clockwise should decrease the current.