health care bls spotlight · bls spotlight on statistics health care u.s. bureau of labor...
TRANSCRIPT

BLS SPOTLIGHT ON STATISTICS HEALTH CARE www.bls.gov/spotlight
U.S. BUREAU OF LABOR STATISTICS 1
Health Care November 2009 Health care touches the lives of nearly everyone in the United States at some point. For example, many are born in the delivery wing of a hospital, while others enjoy their golden years in an assisted living facility. Between these two points, whether you obtain medical insurance through your employer, seek consultation with a doctor about an illness, fill a prescription at the pharmacy, take a day of sick leave from work—or just wonder how you will pay for it all—almost everyone rubs elbows with the U.S. health care system. This Spotlight uses BLS data to shed some light on what is happening in this dynamic and interesting field. Read on to explore these data and discover the “diagnosis” on health care industries and occupations as well as the “prognosis” on future employment!
BLS SPOTLIGHT ON STATISTICS HEALTH CARE www.bls.gov/spotlight
U.S. BUREAU OF LABOR STATISTICS 2
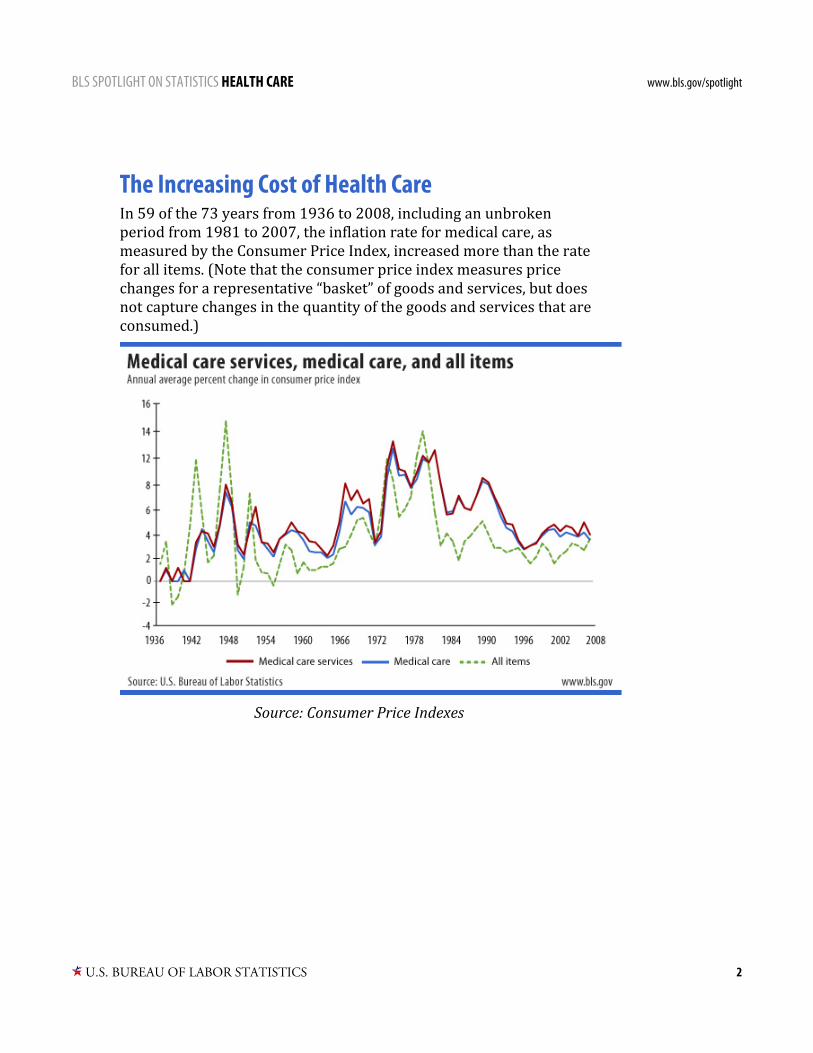
The Increasing Cost of Health Care In 59 of the 73 years from 1936 to 2008, including an unbroken period from 1981 to 2007, the inflation rate for medical care, as measured by the Consumer Price Index, increased more than the rate for all items. (Note that the consumer price index measures price changes for a representative “basket” of goods and services, but does not capture changes in the quantity of the goods and services that are consumed.)
Source: Consumer Price Indexes

BLS SPOTLIGHT ON STATISTICS HEALTH CARE www.bls.gov/spotlight
U.S. BUREAU OF LABOR STATISTICS 3
Household Health Care Spending by Region The portion of their household budget that consumers spend on health care has gradually risen from about 5.3 percent to about 5.9 percent since 1997. Households in the Midwest and South allocate a larger share of their total household expenditures to health care than their counterparts in the Northeast and West.
Source: Consumer Expenditures Program

BLS SPOTLIGHT ON STATISTICS HEALTH CARE www.bls.gov/spotlight
U.S. BUREAU OF LABOR STATISTICS 4
Health Care Spending Demographics U.S. households spent, on average, a total of $2,976 on health insurance, medical services, drugs, and medical supplies in 2008. Hispanic, Black or African American, and Asian households spent less—and White households spent somewhat more‐than the average. These averages are calculated with data collected from all types of households; that is, households of all sizes, ages, incomes, etc., including both households that pay for insurance as well as those that do not. The amount spent on insurance does not include any portion paid by employers or government.
Source: Consumer Expenditures Program

BLS SPOTLIGHT ON STATISTICS HEALTH CARE www.bls.gov/spotlight
U.S. BUREAU OF LABOR STATISTICS 5
Rising Health Care Employment Employment in the health care industry has been growing for decades. Not only has the number of workers employed in health care increased, but the percentage of the nation's private‐sector workforce employed in health care has increased as well. Before 1960, about 3 percent of private‐sector workers were employed in heath care establishments. In recent years, the proportion of workers employed in private‐sector health services has exceeded 11 percent. Employment in health care has continued to grow even during the current recession: health care has added 559,000 jobs since the beginning of the recession in December 2007.
Source: Current Employment Statistics
NOTE: The estimates of employment for 1988 and earlier were calculated using the Standard Industrial Classification (SIC) system; those for 1998 and 2008 were calculated with the North American Industry Classification System (NAICS).
BLS SPOTLIGHT ON STATISTICS HEALTH CARE www.bls.gov/spotlight
U.S. BUREAU OF LABOR STATISTICS 6
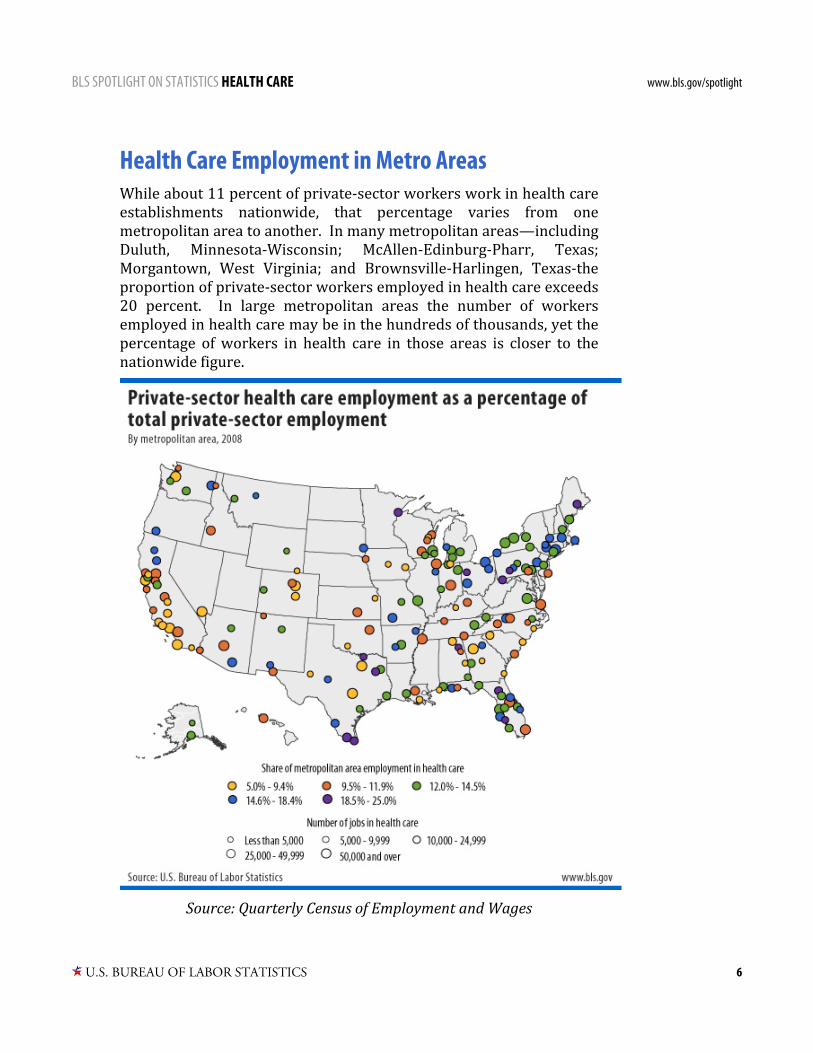
Health Care Employment in Metro Areas While about 11 percent of private‐sector workers work in health care establishments nationwide, that percentage varies from one metropolitan area to another. In many metropolitan areas—including Duluth, Minnesota‐Wisconsin; McAllen‐Edinburg‐Pharr, Texas; Morgantown, West Virginia; and Brownsville‐Harlingen, Texas‐the proportion of private‐sector workers employed in health care exceeds 20 percent. In large metropolitan areas the number of workers employed in health care may be in the hundreds of thousands, yet the percentage of workers in health care in those areas is closer to the nationwide figure.
Source: Quarterly Census of Employment and Wages

BLS SPOTLIGHT ON STATISTICS HEALTH CARE www.bls.gov/spotlight
U.S. BUREAU OF LABOR STATISTICS 7
Pharmacists Have Rx for Highest Wages, RNs Register Highest Employment Among workers employed in health care occupations (not including doctors and dentists, many of whom are self‐employed), the nation's 266,410 pharmacists had the highest average annual wages: $104,260 in May 2008. With over 2.5 million people employed as registered nurses, that occupation was the largest among all health care occupations. Registered nurses' wages are typically among the highest of occupations with employment numbered in the millions (including occupations not related to health care).
Source: Occupational Employment Statistics

BLS SPOTLIGHT ON STATISTICS HEALTH CARE www.bls.gov/spotlight
U.S. BUREAU OF LABOR STATISTICS 8
A Future in Health Care Looks ... Healthy Employment in occupations related to health care is projected to increase in coming years. Employment growth is expected to be driven by technological advances in patient care, which permit a greater number of health problems to be treated, and by an increasing emphasis on preventive care. In addition, the number of older people, who are much more likely than younger people to need nursing care, is projected to grow rapidly. The health care occupations with the largest projected employment increases are registered nurses; personal and home care aides; home health aides; nursing aides, orderlies, and attendants; medical assistants; and licensed practical and licensed vocational nurses.
Source: Employment Projections

BLS SPOTLIGHT ON STATISTICS HEALTH CARE www.bls.gov/spotlight
U.S. BUREAU OF LABOR STATISTICS 9
Health Care Workers Need Health Care Too Like workers anywhere, health care employees get injured or become ill on the job. Offices of dentists and doctors have on‐the‐job injury and illness rates lower than the rate for all private industry. Ambulance services and nursing and residential care facilities have the highest on‐the‐job injury and illness rates of all health care industries.
Source: Injuries, Illnesses, and Fatalities program

BLS SPOTLIGHT ON STATISTICS HEALTH CARE www.bls.gov/spotlight
U.S. BUREAU OF LABOR STATISTICS 10
The Cost for Employers Costs for health care benefits vary by industry for private industry employers. Employers in the information, manufacturing, and financial activities industries spent the most per hour worked for health‐related benefits. In all industries, the cost of health insurance was much larger than other health‐related benefit costs.
Source: National Compensation Survey

BLS SPOTLIGHT ON STATISTICS HEALTH CARE www.bls.gov/spotlight
U.S. BUREAU OF LABOR STATISTICS 11
Access to Health Care Benefits In private industry, 71 percent of workers have access to medical care benefits, 46 percent have access to dental care benefits, and 27 percent, vision care benefits. Full‐time workers and workers represented by unions are more likely to have access to medical benefits.
Source: National Compensation Survey

BLS SPOTLIGHT ON STATISTICS HEALTH CARE www.bls.gov/spotlight
U.S. BUREAU OF LABOR STATISTICS 12
Can You Stay Home When You're Sick? When a worker isn't well, paid sick leave provides time to recover and reduces the chance that an infectious disease will spread to co‐workers. Workers most likely to be able to use sick leave are those that work full time, in service‐providing industries, and in larger establishments.
Source: National Compensation Survey

BLS SPOTLIGHT ON STATISTICS HEALTH CARE www.bls.gov/spotlight
U.S. BUREAU OF LABOR STATISTICS 13
More Info More information from BLS related to health care.
Monthly Labor Review (MLR) articles Health and insurance plans Health care Hospitals Medical care
The Editor's Desk (TED) articles
Health care
Occupational Outlook Handbook and Career Guide to Industries
See health diagnosing and treating occupations, health technologists and technicians, and healthcare support occupations in the Occupational Outlook Handbook, and health care in the Career Guide to Industries.
Note: Data in text, charts and tables are the latest available at the time of publication. Internet links may lead to more recent data. General Information: (202) 691‐5200
Media Contact: (202) 691‐5902