health reform in australia: an update...health reform in australia: an update australian institute...
TRANSCRIPT

Health reform in Australia:
an update
Australian Institute of Health Innovation
Presentation to the Canon Institute for Global
Studies, Japan
Professor Jeffrey Braithwaite, PhD Founding Director, Australian Institute of Health
Innovation

オーストラリアの医療改革最新事情
(2011年9月20日CIGSセミナー後の動向)
Australian Institute of Health Innovation
Presentation to the Canon Institute for Global
Studies, Japan
Professor Jeffrey Braithwaite, PhD Founding Director, Australian Institute of Health
Innovation

Australian Institute of Health
Innovation’s mission
Our mission is to enhance local, institutional
and international health system decision-
making through evidence; and use
systems sciences and translational
approaches to provide innovative,
evidence-based solutions to specified
health care delivery problems.
http://www.med.unsw.edu.au/medweb.nsf/page/ihi

AIHI オーストラリア医療イノベーション研究所の使命
我々の使命は、エビデンスに基づき、
地域や医療機関、国際的な医療システムの意思決定を高めることにある。
更に組織科学や伝統的アプローチを活用することで、
特定の医療提供問題に対し革新的でエビデンスに
基づいた解決策を提供する。
http://www.med.unsw.edu.au/medweb.nsf/page/ihi

Leadership team
• Professor Jeffrey Braithwaite Professor and Foundation Director, Australian Institute of Health Innovation, University of New South Wales
• Professor Enrico Coiera Professor and Director, Centre for Health Informatics
• Professor Ken Hillman Professor and Director Simpson Centre for Health
Services Research
• Professor Johanna Westbrook Professor and Director, Centre for Health Systems and Safety Research
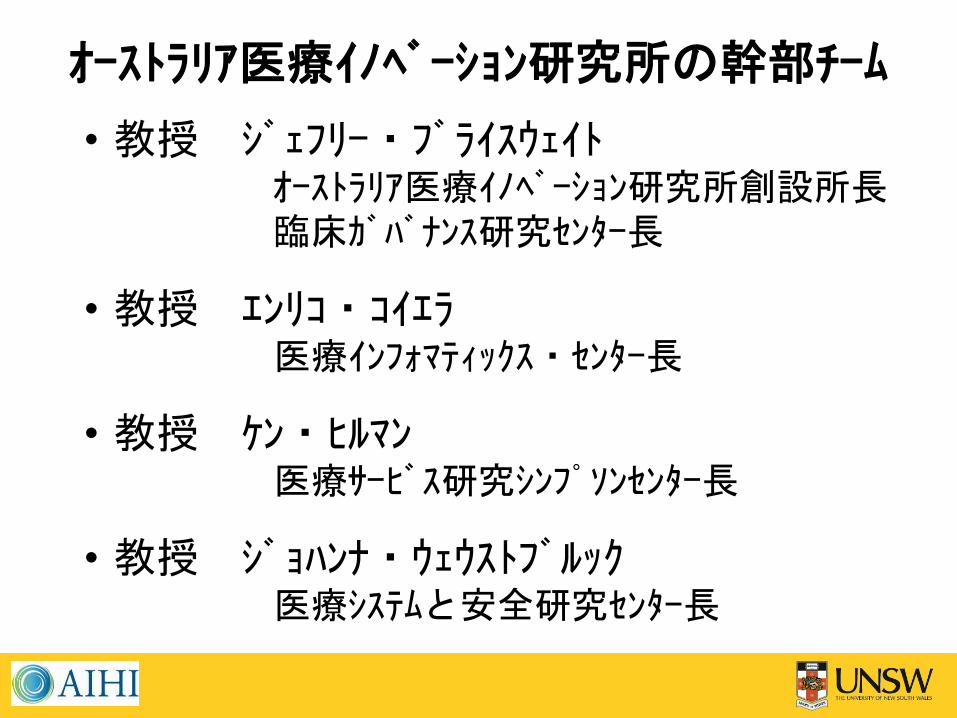
オーストラリア医療イノベーション研究所の幹部チーム
• 教授 ジェフリー・ブライスウェイト オーストラリア医療イノベーション研究所創設所長
臨床ガバナンス研究センター長
• 教授 エンリコ・コイエラ 医療インフォマティックス・センター長
• 教授 ケン・ヒルマン 医療サービス研究シンプソンセンター長
• 教授 ジョハンナ・ウェウストブルック 医療システムと安全研究センター長

Background - the Centre
The Centre for Clinical Governance
Research undertakes strategic research,
evaluations and research-based
projects of national and international
standing with a core interest to
investigate health sector issues of
policy, culture, systems, governance
and leadership.
http://www.med.unsw.edu.au/medweb.nsf/page/ClinGov_About

臨床ガバナンス研究センターについて
臨床ガバナンス研究センターは、医療分野の政策、
カルチャー、システム、ガバナンス、リーダーシップといった
諸問題を関心の核とし、オーストラリア及び国際的な
戦略的調査、評価、研究プロジェクトを引き受け
ている。

Part 1: Comparative data

World, Japan and Australia

Australia and Japan

Australia and Japan in
comparison

A statistical comparison Australia Japan Italy New Zealand
Population 22,015,676 (55th)
127,368,088 (10th)
61,261,254 (23rd)
4,327,944 (125th)
P’n growth 1.126% (107th)
-0.077% (200th)
0.38% (158th)
0.863% (132th)
Area (sq km) 7,741,220 (6th)
377,915 (62nd)
301,340 (72nd)
267,710 (76th)
GDP (PPP, $US)
926.2 billion (19th)
4.497 trillion (5th)
1.871 trillion (11th)
123.8 billion (65th)
GDP per capita ($US)
40,800 (22nd)
35,200 (36th)
30,900 (44th)
28,000 (48th)
Imports ($US)
243.4 billion (21st)
808.4 billion (5th)
556.4 billion (8th)
35.53 billion (62nd)
Exports 272.1 billion (22nd)
788 billion (5th)
523.9 billion (9th)
37.54 billion (62nd)
Source: CIA Factbook, November 2012

統計比較 オーストラリア 日本 イタリア ニュージーランド
人口 22,015,676 (55th)
127,368,088 (10th)
61,261,254 (23rd)
4,327,944 (125th)
人口増加率 1.126% (107th)
-0.077% (200th)
0.38% (158th)
0.863% (132th)
面積 (平方km) 7,741,220 (6th)
377,915 (62nd)
301,340 (72nd)
267,710 (76th)
GDP (PPP, $US)
926.2 billion (19th)
4.497 trillion (5th)
1.871 trillion (11th)
123.8 billion (65th)
一人当たりGDP ($US)
40,800 (22nd)
35,200 (36th)
30,900 (44th)
28,000 (48th)
輸入 ($US) 243.4 billion (21st)
808.4 billion (5th)
556.4 billion (8th)
35.53 billion (62nd)
輸出 272.1 billion (22nd)
788 billion (5th)
523.9 billion (9th)
37.54 billion (62nd)
Source: CIA Factbook, November 2012
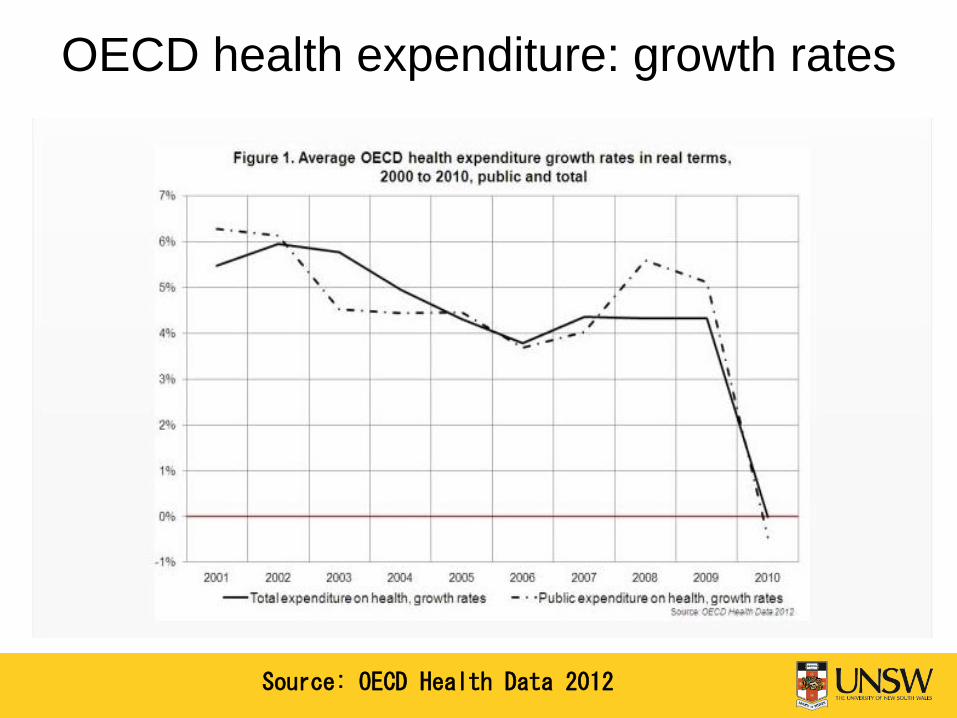
OECD health expenditure: growth rates
Source: OECD Health Data 2012

OECD health expenditure: growth rates
Source: OECD Health Data 2012

How does Australia compare?
Source: OECD Health Data 2012

How does Japan compare?
Source: OECD Health Data 2012
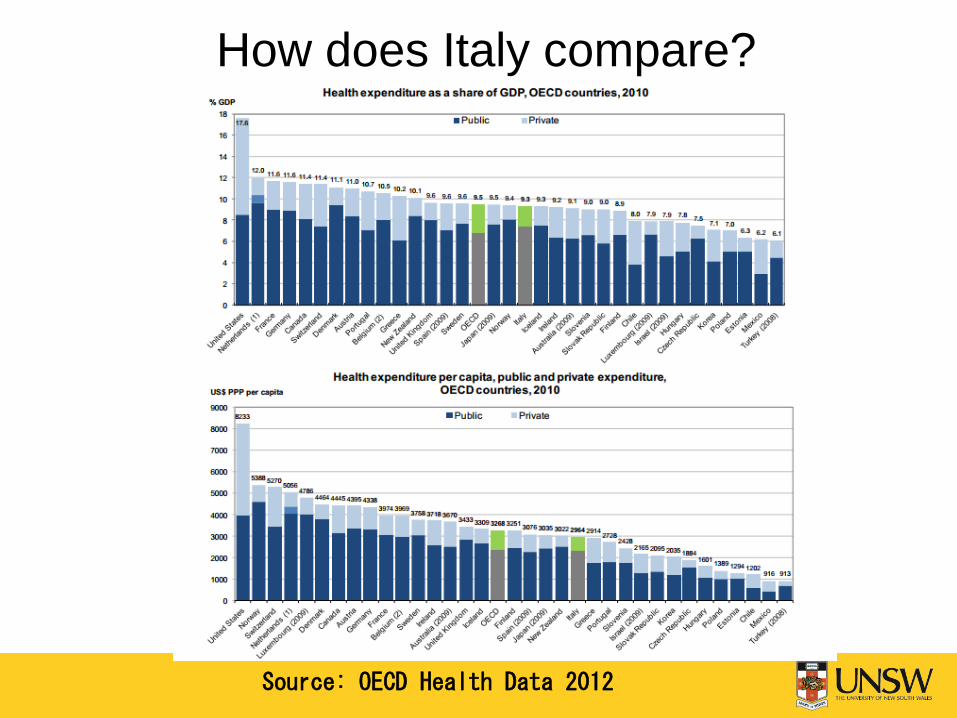
How does Italy compare?
Source: OECD Health Data 2012
0.0
2.0
4.0
6.0
8.0
10.0
12.0
1960
1961
1962
1963
1964
1965
1966
1967
1968
1969
1970
1971
1972
1973
1974
1975
1976
1977
1978
1979
1980
1981
1982
1983
1984
1985
1986
1987
1988
1989
1990
1991
1992
1993
1994
1995
1996
1997
1998
1999
2000
2001
2002
2003
2004
2005
2006
2007
2008
2009
2010
% of GDP
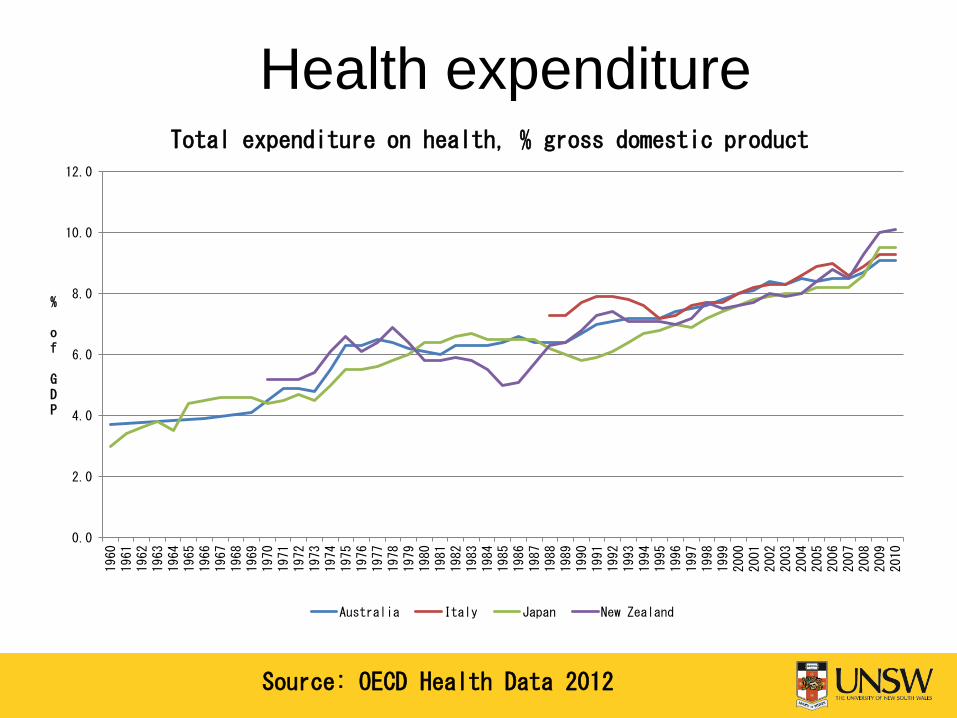
Total expenditure on health, % gross domestic product
Australia Italy Japan New Zealand
Health expenditure
Source: OECD Health Data 2012

0
500
1000
1500
2000
2500
3000
3500
4000
US Dollars
Total expenditure on health
Australia Italy Japan New Zealand
Health expenditure
Source: OECD Health Data 2012
0.0
0.5
1.0
1.5
2.0
2.5
3.0
3.5
4.0
1960
1961
1962
1963
1964
1965
1966
1967
1968
1969
1970
1971
1972
1973
1974
1975
1976
1977
1978
1979
1980
1981
1982
1983
1984
1985
1986
1987
1988
1989
1990
1991
1992
1993
1994
1995
1996
1997
1998
1999
2000
2001
2002
2003
2004
2005
2006
2007
2008
2009
2010
2011
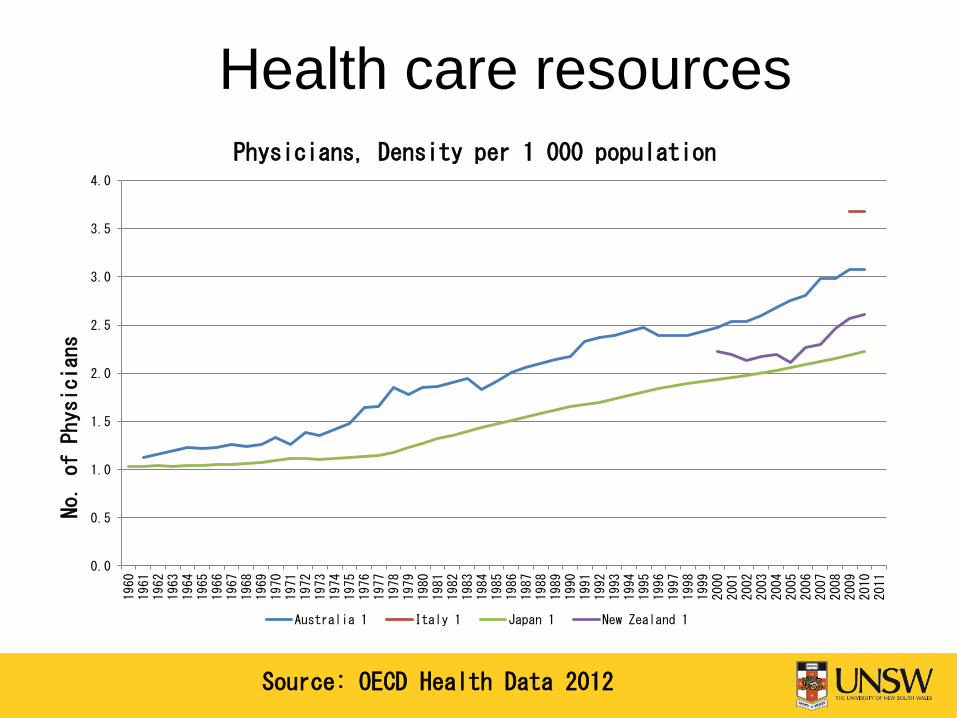
No. of Physicians
Physicians, Density per 1 000 population
Australia 1 Italy 1 Japan 1 New Zealand 1
Health care resources
Source: OECD Health Data 2012

0.0
5.0
10.0
15.0
20.0
25.0
30.0
35.0
40.0
45.0
50.0
1990 1991 1992 1993 1994 1995 1996 1997 1998 1999 2000 2001 2002 2003 2004 2005 2006 2007 2008 2009 2010 2011
Per million population
Magnetic Resonance Imaging units
Australia Italy Japan New Zealand
Health care technology
Source: OECD Health Data 2012

0.0
20.0
40.0
60.0
80.0
100.0
120.0
1990 1991 1992 1993 1994 1995 1996 1997 1998 1999 2000 2001 2002 2003 2004 2005 2006 2007 2008 2009 2010 2011
Per million population
Computed Tomography scanners
Australia Italy Japan New Zealand
Health care technology
Source: OECD Health Data 2012

0
2
4
6
8
10
12
14
16
Number per capita
Doctors’ consultations (医師の診察)
Australia Italy Japan New Zealand
Health care activities
Source: OECD Health Data 2012

Health care activities
0.0
2000.0
4000.0
6000.0
8000.0
10000.0
12000.0
14000.0
16000.0
18000.0
Per 100 0
00 population
Discharge rates by diagnostic categories
Australia Italy Japan New Zealand
Source: OECD Health Data 2012

Health care activities
0.0
5.0
10.0
15.0
20.0
25.0
30.0
35.0
40.0
No. of D
ays
Average length of stay
Australia Italy Japan 1 New Zealand
Source: OECD Health Data 2012

0.0
10.0
20.0
30.0
40.0
50.0
60.0
70.0
80.0
90.0
100.0
1960
1961
1962
1963
1964
1965
1966
1967
1968
1969
1970
1971
1972
1973
1974
1975
1976
1977
1978
1979
1980
1981
1982
1983
1984
1985
1986
1987
1988
1989
1990
1991
1992
1993
1994
1995
1996
1997
1998
1999
2000
2001
2002
2003
2004
2005
2006
2007
2008
2009
2010
2011
Years
Life expectancy, Female
Australia Italy Japan New Zealand
Health status (mortality)
Source: OECD Health Data 2012

0.0
10.0
20.0
30.0
40.0
50.0
60.0
70.0
80.0
90.0
1960
1961
1962
1963
1964
1965
1966
1967
1968
1969
1970
1971
1972
1973
1974
1975
1976
1977
1978
1979
1980
1981
1982
1983
1984
1985
1986
1987
1988
1989
1990
1991
1992
1993
1994
1995
1996
1997
1998
1999
2000
2001
2002
2003
2004
2005
2006
2007
2008
2009
2010
Years
Life expectancy, Male
Australia Italy Japan New Zealand
Health status (mortality)
Source: OECD Health Data 2012

Health status (mortality)
0.0
10.0
20.0
30.0
40.0
50.0
60.0
70.0
80.0
90.0
1960
1961
1962
1963
1964
1965
1966
1967
1968
1969
1970
1971
1972
1973
1974
1975
1976
1977
1978
1979
1980
1981
1982
1983
1984
1985
1986
1987
1988
1989
1990
1991
1992
1993
1994
1995
1996
1997
1998
1999
2000
2001
2002
2003
2004
2005
2006
2007
2008
2009
2010
2011
Years
Life expectancy, Total population
Australia Italy Japan New Zealand
Source: OECD Health Data 2012
0.0
10.0
20.0
30.0
40.0
50.0
60.0
1960
1961
1962
1963
1964
1965
1966
1967
1968
1969
1970
1971
1972
1973
1974
1975
1976
1977
1978
1979
1980
1981
1982
1983
1984
1985
1986
1987
1988
1989
1990
1991
1992
1993
1994
1995
1996
1997
1998
1999
2000
2001
2002
2003
2004
2005
2006
2007
2008
2009
2010
2011
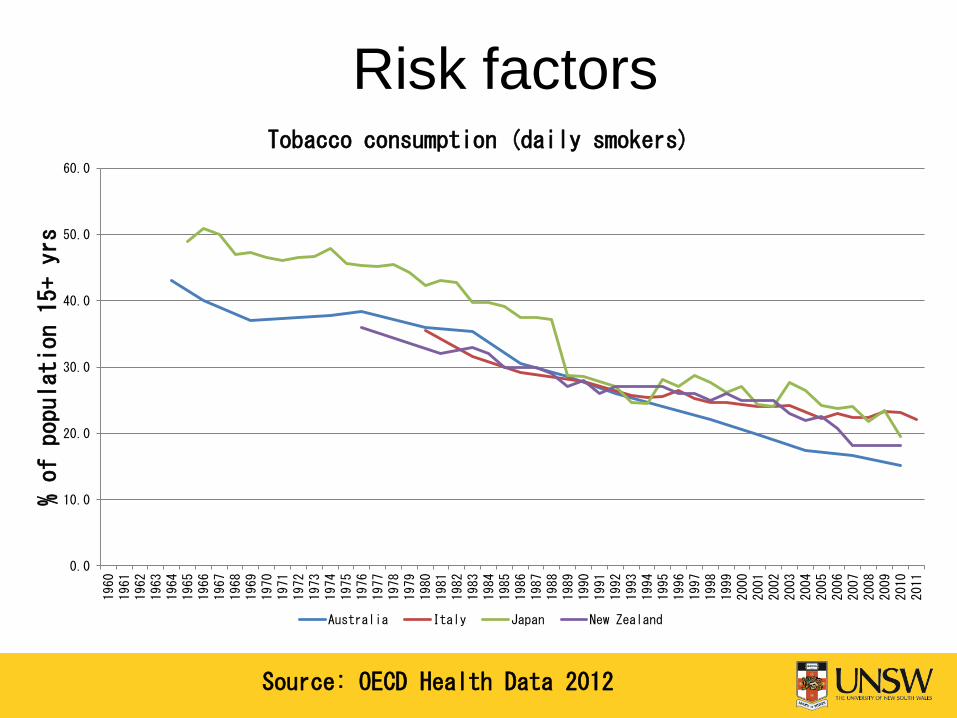
% of p
opulation 15+ y
rs
Tobacco consumption (daily smokers)
Australia Italy Japan New Zealand
Risk factors
Source: OECD Health Data 2012

Risk factors
0
5
10
15
20
25
1960
1961
1962
1963
1964
1965
1966
1967
1968
1969
1970
1971
1972
1973
1974
1975
1976
1977
1978
1979
1980
1981
1982
1983
1984
1985
1986
1987
1988
1989
1990
1991
1992
1993
1994
1995
1996
1997
1998
1999
2000
2001
2002
2003
2004
2005
2006
2007
2008
2009
2010
2011
Liters per capita
Alcohol consumption (+15 yrs)
Australia Italy Japan New Zealand
Source: OECD Health Data 2012
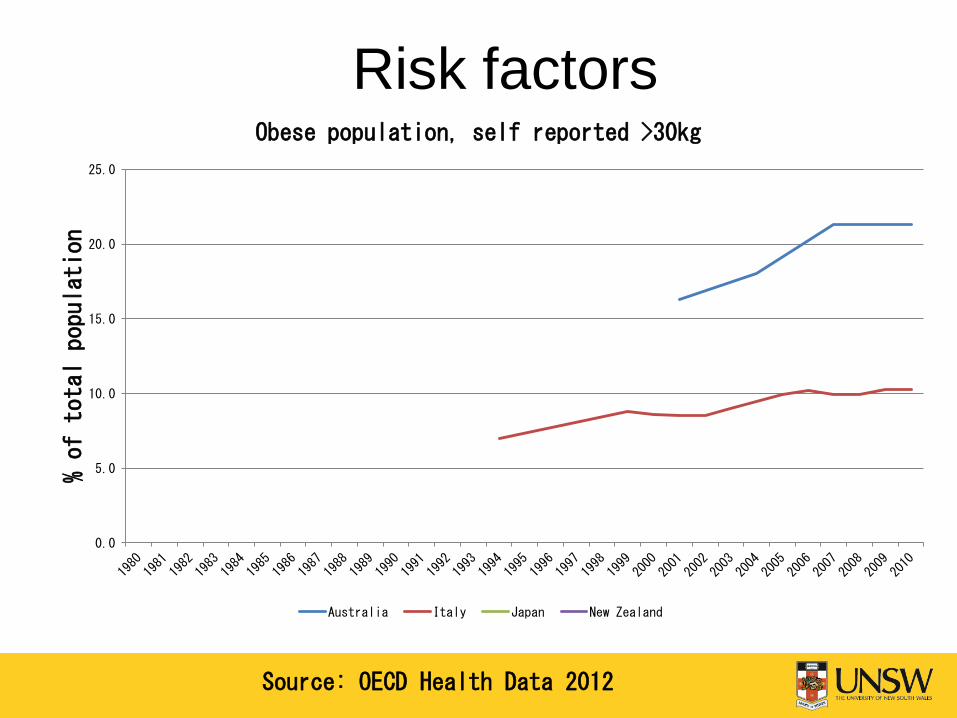
0.0
5.0
10.0
15.0
20.0
25.0
% o
f t
otal population
Obese population, self reported >30kg
Australia Italy Japan New Zealand
Risk factors
Source: OECD Health Data 2012

Risk factors
0
5
10
15
20
25
30
% of t
otal population
Obese population, measured >30kg
Australia Italy Japan New Zealand
Source: OECD Health Data 2012

Part 2: Australia’s national health reforms

A National Health and Hospitals
Network for Australia’s Future
オーストラリアの将来のための全国の医療と病院ネットワーク
A summary of and commentary
on the Commonwealth’s health
reform plan to date 今日までの豪州医療改革プランの要点解説

Case for health reform
Fragmented health system
System under growing pressure:
– Large increases in demand for and expenditure on health care
– Unacceptable inequities in health outcomes and access to services
– Growing concerns about safety and quality
– Workforce shortages
– Inefficiency

医療改革が必要とされる実情
細かく分断された医療システム
増大するプレッシャーに晒されている医療システム: –医療ケアに対する急増するニーズと費用 –医療のアウトカムと医療サービスに対するアクセスにおける許容し難い格差
–安全と質に対する不安が増大 –医療人材の不足 –非効率
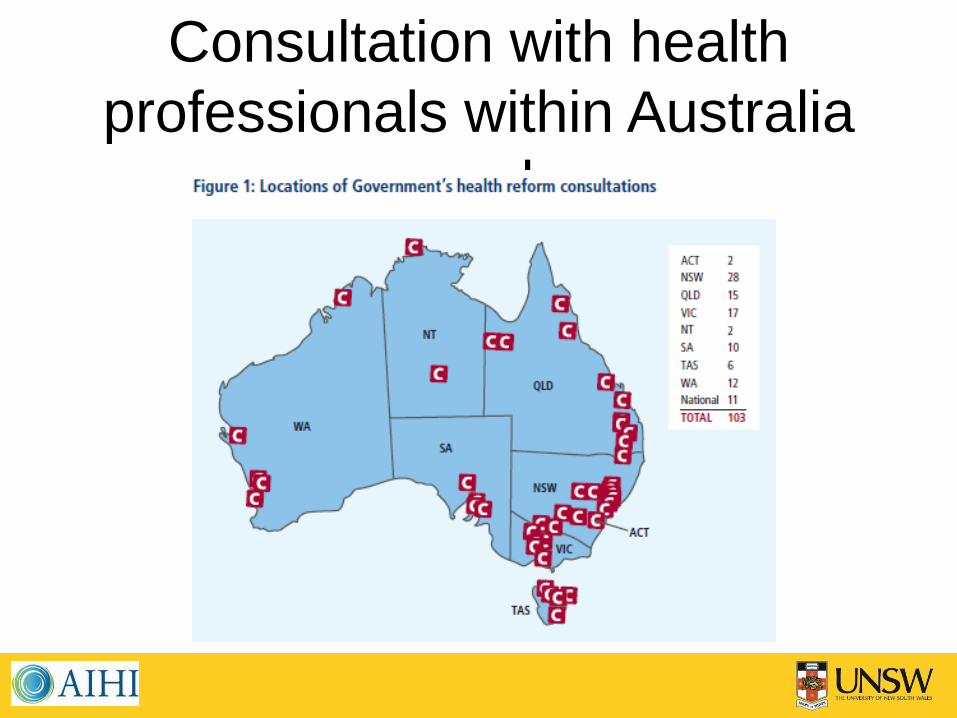
Consultation with health
professionals within Australia
people

医療改革相談事務所の配置状況
<訳注>
オーストラリア政府は国民向けに医療改革の詳細を解説するためWEBサイトを開設 http://www.yourhealth.gov.au/internet/yourhealth/publishing.nsf/content/home

National improvement,
accountability and transparency
• Resolving local structural arrangements
• Reporting on systems performance
• Applying a nationally efficient price
• Monitoring national quality and safety
standards
• Conducting workforce reform
• Supporting E-health

国全体の向上、説明責任、透明性
• 地域の実情に応じた調整を行う
• 医療システムのパフォーマンスを報告する
• 全国効率価格を適用する
• 国全体で医療の質と安全基準をモニター
• 医療人材の改革を実施する
• E-healthを支援する

Local structural arrangements: Medicare
Locals

Local structural arrangements: Local Hospital
Networks

Local structural arrangements: Local Hospital
Networks
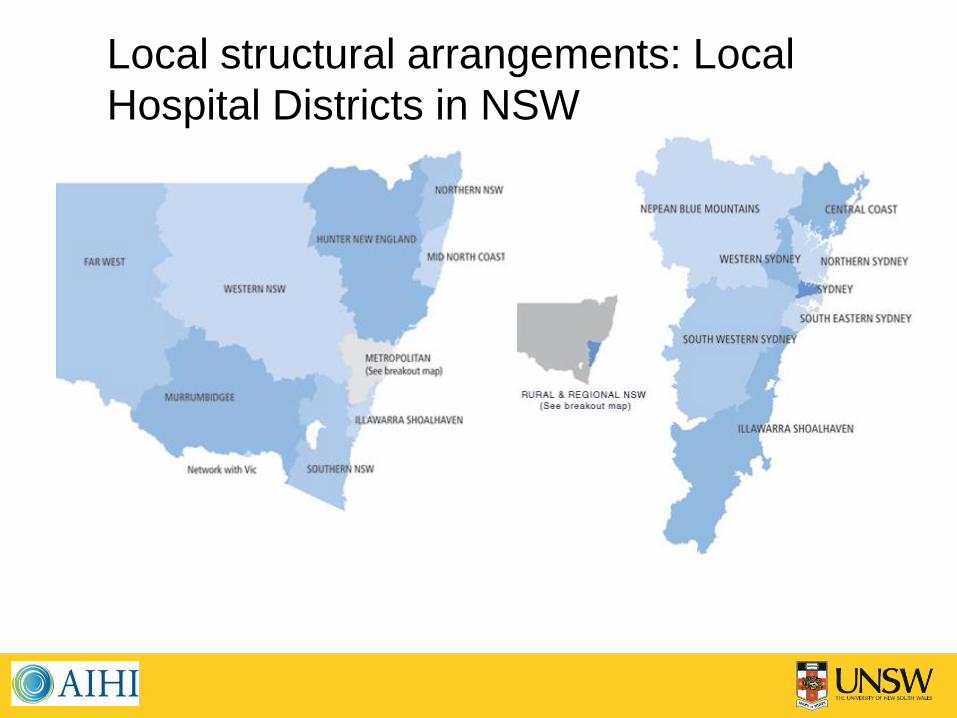
Local structural arrangements: Local
Hospital Districts in NSW

Systems performance
• National Health Performance Authority
• Function – to monitor and report on the
performance of: • Local hospital networks
• Public hospitals
• Private hospitals
• Primary health care organisations
• Other health care providers

医療システムのパフォーマンス評価の仕組み
• National Health Performance Authority <訳注>
NHPAは国民に地域医療サービスのパフォーマンス評価情報を提供する機関
http://www.nhpa.gov.au/internet/nhpa/publishing.nsf/Content/home-1
• 機能 – 次の医療提供者のパフォーマンスをモニターして報告:
• 地域病院ネットワーク
• 公立病院
• 民間病院
• プライマリーケア提供事業者
• その他の医療提供事業者

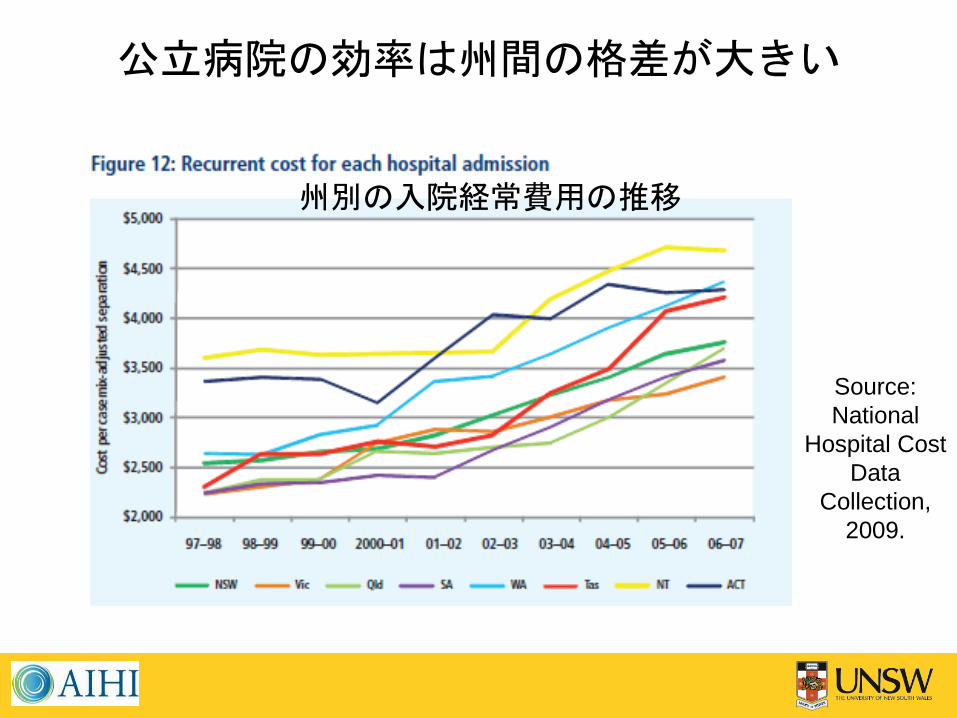
Source:
National
Hospital Cost
Data
Collection,
2009.
The efficiency of public hospitals varies
considerably between states
Source:
National
Hospital Cost
Data
Collection,
2009.
公立病院の効率は州間の格差が大きい
州別の入院経常費用の推移

National efficient price
• Independent Hospital Pricing Authority
• National efficient price for public hospital
services [$4,808 in 2012-2013]: • Acute inpatients
• Emergency department services
• Outpatient services
• With adjustments for indigenous patients, remote
residents, paediatric hospitals, ICU
• Next: sub-acute and mental health services

全国効率価格 • 独立病院価格局(IHPA)
<訳注>
IHPAは2011年全国医療改革法により設置された機関
http://www.ihpa.gov.au/internet/ihpa/publishing.nsf
• 公立病院サービスの全国効率価格
2012年 – 2013年の期間 4,808ドル
• 急性期患者
• 救急部門サービス
• 外来サービス
• 原住民患者、遠隔地居住者、小児病院、ICUのための調整
• 今後検討: 亜急性期と精神科の医療サービス

Australian Commission on Safety
and Quality in Health Care
• Improvement strategies within States and
Territories and private health care e.g. IT
systems, quality and safety programs and
in consumer engagement

医療の安全と質に関するオーストラリア委員会
州・準州及び民間医療における向上戦略
例としてITシステム、質と安全のプログラム、消費者の参加
<訳注>
ACSQHCは2006年に設置された政府機関
http://www.safetyandquality.gov.au/

Australian Commission on Safety
and Quality in Health Care
Ten new health care standards:
1. Governance for safety and quality in
health service organisations
2. Partnering with consumers
3. Preventing and controlling healthcare
associated infections
4. Medication safety
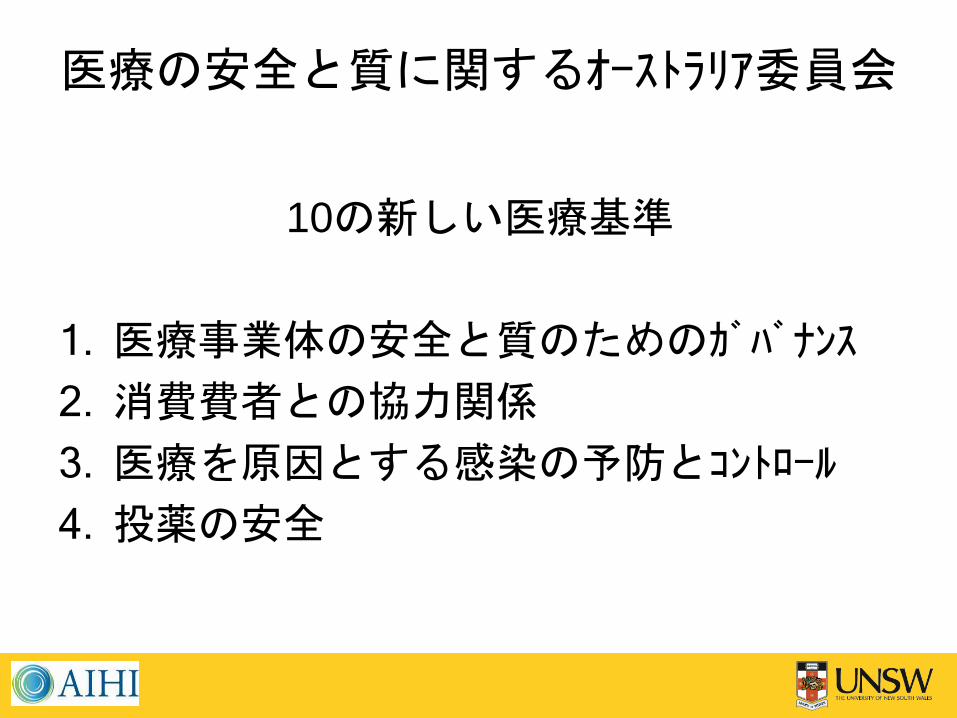
医療の安全と質に関するオーストラリア委員会
10の新しい医療基準
1. 医療事業体の安全と質のためのガバナンス
2. 消費費者との協力関係
3. 医療を原因とする感染の予防とコントロール
4. 投薬の安全
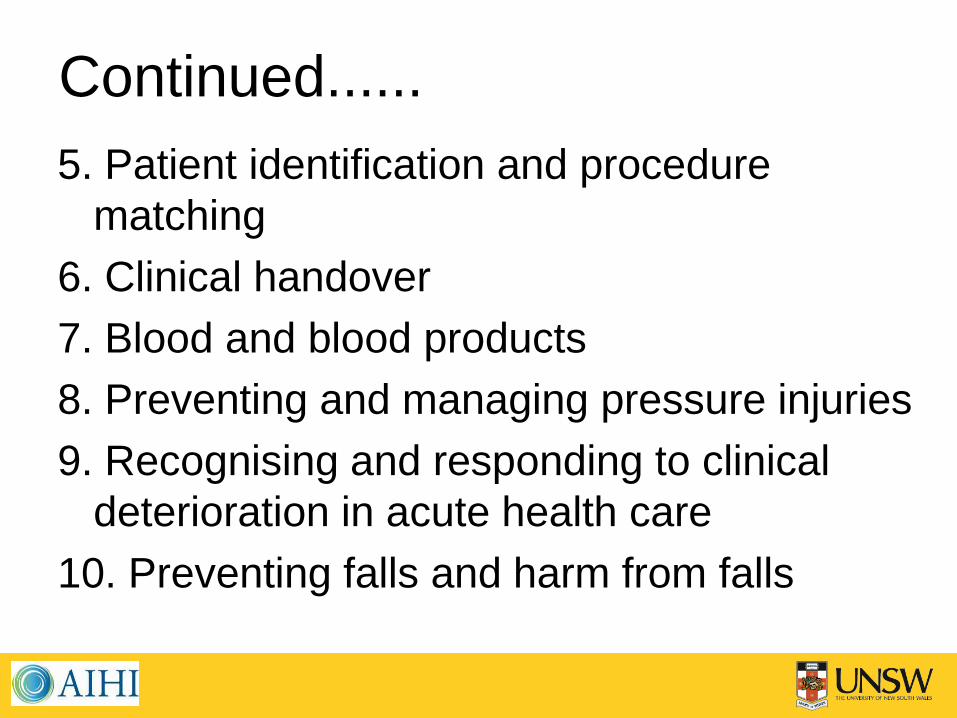
Continued......
5. Patient identification and procedure
matching
6. Clinical handover
7. Blood and blood products
8. Preventing and managing pressure injuries
9. Recognising and responding to clinical
deterioration in acute health care
10. Preventing falls and harm from falls

続き......
5. 患者の特定と治療のマッチング
6. 臨床の引き継ぎ
7. 血液と血液製剤
8. 圧力障害の予防と管理
9. 急性期医療の臨床上の悪化の把握と対応e
10. 病床からの転落とそれによる傷害の防止

Health Workforce Australia
• Improve health workforce capacity,
efficiency and productivity
• Plan for the workforce of 2025
• Five domains of activity: • Workforce reform
• Skills development
• Leadership
• Planning
• Policy, funding, legislation
Health Workforce Australia
• 医療人材の能力、効率性、生産性を向上させる
• 2025年に向けた医療人材計画
• 5つの活動領域
• 医療人材改革
• スキルの開発
• リーダーシップ
• 計画作成
• 政策、財源確保、法規制立案
<訳注>
HWAは2008年に設置された政府機関
https://www.hwa.gov.au/

National E-Health Transition
Authority
• The Commonwealth has initiated the
Personally Controlled Electronic
Health Record [PCEHR]
全国 E-Health 移行局(NEHTA)
• 国が個人がコントロールする電子診療録( PCEHR )に取り組んでいる
<訳注>
NEHTAは2008年に設置された政府機関
http://www.nehta.gov.au/

Part 3 : Commentary
• Reform is a difficult political and policy
journey
• Progress has been made: – Independent Hospital Pricing Authority
– National Health Performance Authority
– Australian Commission on Safety and Quality in
Health Care
– Health Workforce Australia
– National E-Health Transition Authority

解説
• 改革は困難な政治的な政策の旅である
• 進歩はしている: – Independent Hospital Pricing Authority
– National Health Performance Authority
– Australian Commission on Safety and Quality in
Health Care
– Health Workforce Australia
– National E-Health Transition Authority
Selected references 1. Braithwaite, J. and Goulston, K. (2004) Turning the health system 90
degrees down under, The Lancet, 364 (9432), 397-399
[http://www.thelancet.com/journals/lancet/section?volume=
364&issue=9432§ion=Comment].
2. Commonwealth of Australia 2010, A National Health and Hospitals Network
for Australia’s Future. Canberra: Commonwealth of Australia.
3. Commonwealth of Australia 2009, A healthier future for all Australians. Final
report of the National Health and Hospitals Reform Commission. Canberra:
Commonwealth of Australia.
4. Council of Australian Governments 2011, National Health Reform
Agreement. Canberra: Council of Australian Governments.
5. Council of Australian Governments 2011, Brief Summary of Commonwealth
Investments in Public Hospitals. Canberra: Council of Australian
Governments.
6. OECD Health Data 2012.
http://www.oecd.org/health/healthpoliciesanddata/oecdhealthdata2012.htm
(Accessed 2 November 2012)
7. The World Factbook. https://www.cia.gov/library/publications/the-world-
factbook/geos/as.html (Accessed 2 November 2012)