hedc++: an extended histogram estimator for data in the cloud
TRANSCRIPT
Shi YJ, Meng XF, Wang F et al. HEDC++: An extended histogram estimator for data in the cloud. JOURNAL OF
COMPUTER SCIENCE AND TECHNOLOGY 28(6): 973–988 Nov. 2013. DOI 10.1007/s11390-013-1392-7
HEDC++: An Extended Histogram Estimator for Data in the Cloud
Ying-Jie Shi1 (史英杰), Xiao-Feng Meng1 (孟小峰), Senior Member, CCF, Member, ACM, IEEEFusheng Wang2,3, and Yan-Tao Gan1 (干艳桃)
1School of Information, Renmin University of China, Beijing 100872, China2Department of Biomedical Informatics, Emory University, Atlanta 30322, U.S.A.3Department of Mathematics and Computer Science, Emory University, Atlanta 30322, U.S.A.
E-mail: {shiyingjie, xfmeng}@ruc.edu.cn; [email protected]; [email protected]
Received December 2, 2012; revised May 3, 2013.
Abstract With increasing popularity of cloud-based data management, improving the performance of queries in thecloud is an urgent issue to solve. Summary of data distribution and statistical information has been commonly used intraditional databases to support query optimization, and histograms are of particular interest. Naturally, histograms couldbe used to support query optimization and efficient utilization of computing resources in the cloud. Histograms could providehelpful reference information for generating optimal query plans, and generate basic statistics useful for guaranteeing theload balance of query processing in the cloud. Since it is too expensive to construct an exact histogram on massive data,building an approximate histogram is a more feasible solution. This problem, however, is challenging to solve in the cloudenvironment because of the special data organization and processing mode in the cloud. In this paper, we present HEDC++,an extended histogram estimator for data in the cloud, which provides efficient approximation approaches for both equi-widthand equi-depth histograms. We design the histogram estimate workflow based on an extended MapReduce framework, andpropose novel sampling mechanisms to leverage the sampling efficiency and estimate accuracy. We experimentally validateour techniques on Hadoop and the results demonstrate that HEDC++ can provide promising histogram estimate for massivedata in the cloud.
Keywords histogram estimate, sampling, cloud computing, MapReduce
1 Introduction
The cloud data management system provides a scal-able and highly cost-effective solution for large-scaledata management, and it is gaining much popular-ity these days. Most of the open-source cloud datamanagement systems, such as HBase①, Hive[1], Pig[2],Cassandra② and others now attract considerable enthu-siasm from both the industry and academia. Comparedwith the relational DBMS (RDBMS) with sophisticatedoptimization techniques, the cloud data managementsystem is newly emerging and there is ample room forperformance improvement of complex queries[3]. Asthe efficient summarization of data distribution andstatistical information, histograms are of paramountimportance for the performance improvement of dataaccessing in the cloud. First of all, histograms provide
reference information for selecting the most efficientquery execution plan. A large fraction of queries in thecloud are implemented in MapReduce[4], which inte-grates parallelism, scalability, fault tolerance and loadbalance into a simple framework. For a given query,there are always different execution plans in MapRe-duce. For example, in order to conduct log processingwhich joins the reference table and log table, four dif-ferent MapReduce execution plans are proposed in [5]for different data distributions. However, how to se-lect the most efficient execution plan adaptively is notaddressed, which could be guided by histogram estima-tion. Secondly, histograms contain basic statistics use-ful for load balancing. Load balance is crucial to theperformance of query in the cloud, which is normallyprocessed in parallel. In the processing framework ofMapReduce, output results of the mappers are parti-
Regular PaperThis research was partially supported by the National Natural Science Foundation of China under Grant Nos. 61070055, 91024032,
91124001, the Fundamental Research Funds for the Central Universities of China, the Research Funds of Renmin University of Chinaunder Grant No. 11XNL010, and the National High Technology Research and Development 863 Program of China under Grant Nos.2012AA010701, 2013AA013204.
①http://hbase.apache.org/, October 2012.②http://cassandra.apache.org/, October 2012.©2013 Springer Science+Business Media, LLC & Science Press, China
974 J. Comput. Sci. & Technol., Nov. 2013, Vol.28, No.6
tioned to different reducers by hashing their keys. Ifdata skew on the key is obvious, then load imbalance isbrought into the reducers and consequently results indegraded query performance. Histograms constructedon the partition key can help to design the hash func-tion to guarantee load balance. Thirdly, in the pro-cessing of joins, summarizing the data distribution inhistograms is useful for reducing the data transmissioncost, which is among the scarce resources in the cloud.Utilizing the histogram constructed on a join key canhelp prevent sending the tuples that do not satisfy thejoin predicate to the same node[6]. In addition, his-tograms are also useful in providing various estimatesin the cloud, such as query progress estimate, querysize estimate and results estimate. Such estimates playan important role in pre-execution user-level feedback,task scheduling and resource allocation. However, itcan be too expensive and impractical to construct aprecise histogram before the queries due to the massivedata volume. In this paper, we propose a histogram es-timator to approximate the data distribution with de-sired accuracy.
Constructing approximate histograms is extensivelystudied in the field of single-node RDBMS. However,this problem has received limited attention in the cloud.Estimating the approximate histogram of data in thecloud is a challenging problem, and a simple extensionto the traditional work will not suffice. The cloud istypically a distributed environment, which brings para-llel processing, data distribution, data transmission costand other problems that must be accounted for duringthe histogram estimate. In addition, data in the cloudis organized based on blocks, which could be a thousandtimes larger than that of traditional file systems③. Theblock is the transmission and processing unit in thecloud, and block-based data organization can signifi-cantly increase the cost of tuple-level random sampling.Retrieving a tuple randomly from the whole datasetmay cause the transmission and processing of one block.A natural alternative is to adopt all the tuples in theblock as the sampling data. However, correlation oftuples in one block may affect the estimate accuracy.To effectively build statistical estimators with blockeddata, a major challenge is to guarantee the accuracy ofthe estimators while utilizing the sampling data as effi-ciently as possible. Last but not least, the typical batchprocessing mode of tasks in the cloud does not matchthe requirements of histogram estimate, where “earlyreturns” are generated before all the data is processed.
In this paper, we propose an extended histogramestimator called HEDC++, which is significantly ex-tended from our previous work called HEDC[7]. Ac-
cording to the rule in which the tuples are partitionedinto buckets, histograms can be classified into severaltypes, such as the equi-width histogram, equi-depthhistogram, and spline-based histogram[8]. HEDC pro-vides approximation method only for equi-width his-togram, which is easy to maintain because its bucketboundary is fixed. Actually when summarizing the dis-tribution for skewed data, equi-depth histogram pro-vides more accurate approximation[8]. The main issueof equi-depth histogram approximation is to estimatethe bucket boundary, which cannot be transformed intothe estimate of functions of means just like the equi-width histogram. HEDC++ develops correspondingtechniques for equi-depth histogram estimate, which in-clude the sampling unit design, the error bounding andsampling size bounding algorithm, and the implementa-tion methods over MapReduce. HEDC++ supports theequi-width and equi-depth histogram approximation fordata in the cloud through an extended MapReduceframework. It adopts a two-phase sampling mechanismto leverage the sampling efficiency and estimate accu-racy, and constructs the approximate histogram withdesired accuracy. The main contributions include:
1) We extend the original MapReduce framework byadding a sampling phase and a statistical computingphase, and design the processing workflow for the ap-proximate histogram construction of data in the cloudbased on this framework.
2) We model the construction of equi-width andequi-depth histograms into different statistical prob-lems, and propose efficient approximation approachesfor their estimates in the cloud.
3) We adopt the block as the sampling level to makefull use of data generated in the sampling phase, andwe prove the efficiency of block-level sampling for esti-mating histograms in the cloud.
4) We derive the relationship of required sample sizeand the desired error of the estimated histogram, anddesign the sampling mechanisms to investigate the sam-ple size adaptive to different data layouts, which leve-rage the sampling efficiency and estimate accuracy.
5) We implement HEDC++ on Hadoop and con-duct comprehensive experiments. The results showHEDC++’s efficiency in histogram estimating, and ve-rify its scalability as both data volume and cluster scaleincrease.
The rest of the paper is organized as follows. InSection 2 we summarize related work. In Section 3we introduce the main workflow and architecture ofHEDC++. Section 4 discusses the problem model-ing and statistical issues, which include the samplingmechanisms and histogram estimate algorithms. The
③http://hadoop.apache.org/docs/r1.0.4/hdfs design.html, November 2012.
Ying-Jie Shi et al.: HEDC++: An Extended Histogram Estimator for Data in the Cloud 975
implementing details of HEDC++ are described in Sec-tion 5, and we also discuss how to make the processingincremental by utilizing the existing results. The per-formance evaluation is given in Section 6, followed bythe conclusions and future work in Section 7.
2 Related Work
Histogram plays an important role in cost-basedquery optimization, approximate query and load bala-ncing, etc. Ioannidis[9] surveyed the history of his-togram and its comprehensive applications in the datamanagement systems. There are different kinds of his-tograms based on the constructing way. Poosala et al.[8]
conducted a systematic study of various histograms andtheir properties. Constructing the approximate his-togram based on sampled data is an efficient way to re-flect the data distribution and summarize the contentsof large tables, which is proposed in [10] and studied ex-tensively in the field of single-node data managementsystems. The key problem has to be solved when con-structing approximate histogram is to determine therequired sample size based on the desired estimation er-ror. We can classify the work into two categories by thesampling mechanisms. Approaches in the first categoryadopt uniform random sampling[11-13], which samplesthe data with tuple level. Gibbons et al.[11] focused onsampling-based approach for incremental maintenanceof approximate histograms, and they also computed thebound of required sample size based on a uniform ran-dom sample of the tuples in a relation. Surajit et al.[12]
further discussed the relationship of sample size anddesired error in equi-depth histogram, and proposed astronger bound which lends to ease of use. [13] discusseshow to adapt the analysis of [12] to other kinds of his-tograms. The above approaches assume uniform ran-dom sampling. Approaches of the second category con-struct histograms through block-level sampling[12,14].[12] adopts an iterative cross-validation based approachto estimate the histogram with specified error, and thesample size is doubled once the estimate result doesnot arrive at the desired accuracy. [14] proposes a two-phase sampling method based on cross-validation, inwhich the sample size required is determined based onthe initial statistical information of the first phase. Thisapproach reduces the number of iterations to computethe final sample size, and consequently processing over-head. However, the tuples it samples is much biggerthan the required sample size because cross-validationrequires additional data to compute the error. All theabove techniques focus on histogram estimating in thesingle-node DBMS, and adapting them to the cloud en-vironment requires sophisticated considerations.
There is less work on constructing the histogram in
the cloud. Authors of [6] focused on processing theta-joins in the MapReduce framework, and they adoptedthe histogram built on join key to find the “empty”regions in the matrix of the cartesian product. Thehistogram on the join key is built by scanning thewhole table, which is expensive for big data. Jesteset al.[15] proposed a method for constructing approxi-mate wavelet histograms over the MapReduce frame-work, their approach retrieves tuples from every blockrandomly and sends the outputs of mappers at certainprobability, which aims to provide unbiased estimatefor wavelet histograms and reduce the communicationcost. The number of map tasks is not reduced becauseall the blocks have to be processed, and the sum of starttime of all the map tasks cannot be ignored. Thoughblock locality is considered during the task schedulingof MapReduce framework, there exist blocks that haveto be transferred from remote nodes to the mapper pro-cessing node. So we believe there is room to reduce thisdata transmission cost. In the previous work, we pro-posed a histogram estimator for data in the cloud calledHEDC[7], which only focuses on estimating the equi-width histograms. The equi-depth histogram is anothertype of histograms widely used in data summarizing forquery optimization, and its estimation technique is verydifferent from that of the equi-width histogram. In thispaper, we extend HEDC to HEDC++, and proposenovel method for equi-depth histogram estimate in thecloud.
3 Overview of HEDC++
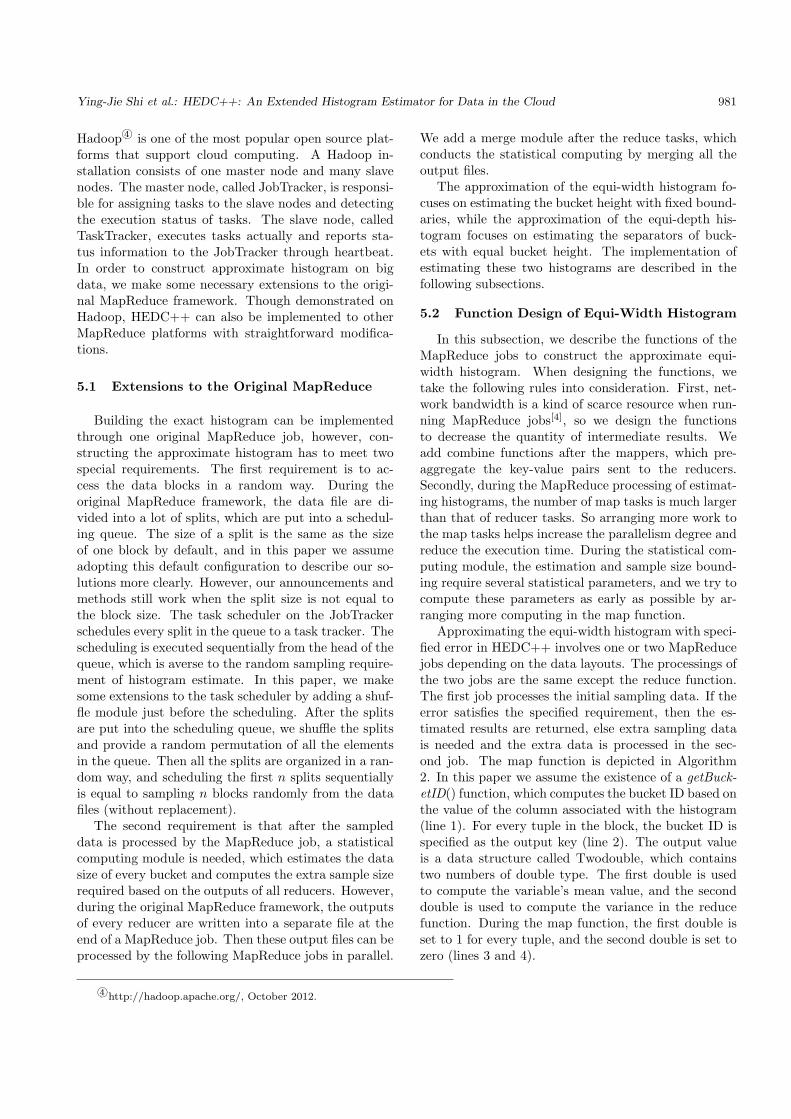
Constructing the exact histogram of data involvesone original Map-Reduce job, which is shown in thesolid rectangles of Fig.1. To construct the equi-widthhistogram, the mappers scan data blocks and generatea bucket ID for every tuple. Then the bucket ID isused as the key of the output key-value pairs, and allthe pairs belonging to the same bucket are sent to thesame reducer. At last, the reducers combine the pairsin each bucket of the histogram. For the equi-depthhistogram, the mappers and combiners compute thenumber of items of every column value, and the col-umn value is set to be the output key of pairs sent tothe reducers. All the pairs are sorted by the key inthe reducers, and the separators of the buckets are de-termined. Generating the exact histogram requires fullscan of the whole table, which is expensive and costslong time to complete in the cloud.
HEDC++ constructs the approximate histogramwith desired accuracy to significantly reduce the timeit takes to get efficient data summarization over largedatasets. However, providing approximate results withstatistical significance in the cloud requires to solve
976 J. Comput. Sci. & Technol., Nov. 2013, Vol.28, No.6
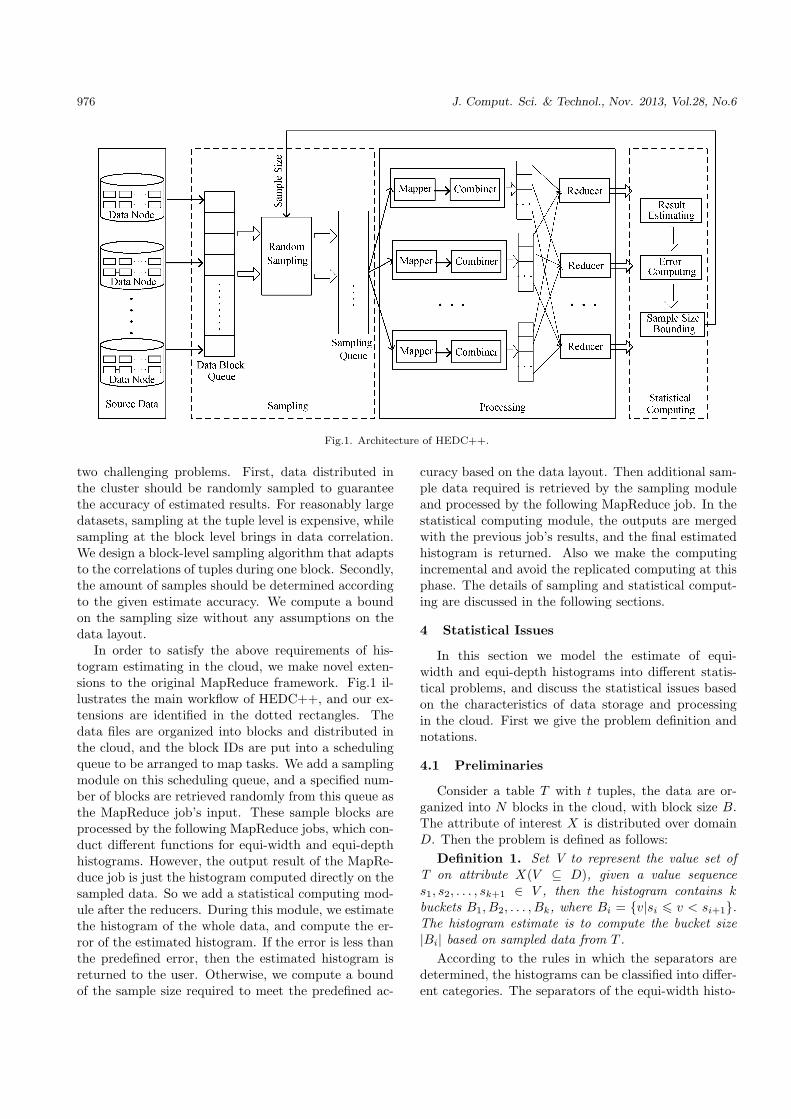
Fig.1. Architecture of HEDC++.
two challenging problems. First, data distributed inthe cluster should be randomly sampled to guaranteethe accuracy of estimated results. For reasonably largedatasets, sampling at the tuple level is expensive, whilesampling at the block level brings in data correlation.We design a block-level sampling algorithm that adaptsto the correlations of tuples during one block. Secondly,the amount of samples should be determined accordingto the given estimate accuracy. We compute a boundon the sampling size without any assumptions on thedata layout.
In order to satisfy the above requirements of his-togram estimating in the cloud, we make novel exten-sions to the original MapReduce framework. Fig.1 il-lustrates the main workflow of HEDC++, and our ex-tensions are identified in the dotted rectangles. Thedata files are organized into blocks and distributed inthe cloud, and the block IDs are put into a schedulingqueue to be arranged to map tasks. We add a samplingmodule on this scheduling queue, and a specified num-ber of blocks are retrieved randomly from this queue asthe MapReduce job’s input. These sample blocks areprocessed by the following MapReduce jobs, which con-duct different functions for equi-width and equi-depthhistograms. However, the output result of the MapRe-duce job is just the histogram computed directly on thesampled data. So we add a statistical computing mod-ule after the reducers. During this module, we estimatethe histogram of the whole data, and compute the er-ror of the estimated histogram. If the error is less thanthe predefined error, then the estimated histogram isreturned to the user. Otherwise, we compute a boundof the sample size required to meet the predefined ac-
curacy based on the data layout. Then additional sam-ple data required is retrieved by the sampling moduleand processed by the following MapReduce job. In thestatistical computing module, the outputs are mergedwith the previous job’s results, and the final estimatedhistogram is returned. Also we make the computingincremental and avoid the replicated computing at thisphase. The details of sampling and statistical comput-ing are discussed in the following sections.
4 Statistical Issues
In this section we model the estimate of equi-width and equi-depth histograms into different statis-tical problems, and discuss the statistical issues basedon the characteristics of data storage and processingin the cloud. First we give the problem definition andnotations.
4.1 Preliminaries
Consider a table T with t tuples, the data are or-ganized into N blocks in the cloud, with block size B.The attribute of interest X is distributed over domainD. Then the problem is defined as follows:
Definition 1. Set V to represent the value set ofT on attribute X(V ⊆ D), given a value sequences1, s2, . . . , sk+1 ∈ V , then the histogram contains kbuckets B1, B2, . . . , Bk, where Bi = {v|si 6 v < si+1}.The histogram estimate is to compute the bucket size|Bi| based on sampled data from T .
According to the rules in which the separators aredetermined, the histograms can be classified into differ-ent categories. The separators of the equi-width histo-
Ying-Jie Shi et al.: HEDC++: An Extended Histogram Estimator for Data in the Cloud 977
gram divide the value domain into buckets with equalwidth, set Pi to represent the proportion of tuples be-longing to Bi, and we can get |Bi| = N × B × Pi.Consider the tuples of one bucket as a category, thenestimating the equi-width histogram can be modeledas estimating the proportion of the different categoriesin the table. In the equi-depth histograms, the sepa-rators divide the value domain into buckets with equalheight, so the proportion of every bucket is the same.The separators s1 and sk+1 represent the boundaries ofthe value domain, and the remaining separators can beconsidered as the quantiles. Estimating the equi-depthhistogram can be modeled as estimating the quantilesof the dataset.
In order to measure the difference between the ap-proximation histogram constructed on the samples andthe histogram constructed on the whole data, variouserror metrics are proposed in the literature. Set hi torepresent the exact size of bucket Bi, and set hi to rep-resent the estimated size of Bi. The height-varianceerror[12] is defined as:
err height =k
NB
√√√√1k
k∑
i=1
(hi − hi)2. (1)
It is the standard deviation of the estimated bucketsize from the actual number of elements in each bucket,normalized with respect to the average width of buck-ets. This error metric is used for both the equi-widthand equi-depth histograms. For equi-depth histograms,hi represents the size of the bucket determined by theestimated separators on the real dataset. And hi isequal to the perfect bucket size NB/k. The max-boundary error[16] is special for the equi-depth his-togram, which is defined as:
err boundary = maxi
{ k
domain width|si − si|
}, (2)
where si is the estimated separator for si, the max-boundary error measure the maximum error across allthe separators, normalized with respect to the aver-age of the bucket width. The exact error of an ap-proximate histogram should be computed based on theprecise histogram, which is gotten after the processingof the whole data. This error metric provides impor-tant reference information for evaluating the approxi-mate results and determining the required sample sizeduring the estimation processing. However, the exacthistogram cannot be gotten at the time when the pro-cessing is far from completion. We propose algorithmsto bound the error based on the sampled data for bothequi-width and equi-depth histograms, and the detailsare described in Subsection 4.3.
4.2 Sampling Unit
Sampling is a standard technique for constructingapproximate summaries of data, and most of the stud-ies adopt the uniform random sampling. However, thetuple-level true random sampling can be very inefficientin the cloud. Recall that data in the cloud is organizedinto blocks and the block is the unit of data transmit-ting in the network. Picking tuple-level random sam-pling from data in such an organization is very expen-sive. In the worst case, retrieving n tuples may causea full scan of n blocks. Secondly, the block is also theprocessing unit of the MapReduce framework, and oneblock is processed by a map task. The startup time ofmap tasks cannot be ignored when the number of tasksis big. One alternative approach for solving these prob-lems is to sample using block as the unit. We prove inTheorem 1 that with the same data transmission cost,block-level sampling will provide more accurate esti-mated equi-width histogram than tuple-level samplingin the cloud.
Theorem 1. Set Pib to represent the proportionof Bi obtained from a simple random sample of nblocks, and Pit to represent the proportion of Bi ob-tained from a simple random sample of n tuples. Fur-ther let the estimated bucket size hib = N × B × Pib,and hit = N × B × Pit. Then both hib and hit areunbiased estimates of the bucket size for the equi-widthhistogram, and the variance of hib is equal to or lessthan that of hit: VAR(hib) 6 VAR(hit).
Proof. The block-level random sampling has thesame spirit with cluster sampling in the statisticalterms[17], with the cluster size equal to the block size.Set Pij to represent the proportion of elements belong-ing to Bi in the j-th block, then the proportion of Bi
is: Pi = 1N × ∑N
j=1 Pij . According to the propertiesof proportion estimate on cluster sampling, we can getPib = 1
n × ∑nj=1 Pij is the unbiased estimate of Pi,
consequently hib is the unbiased estimate of the bucketsize. The variance of Pib is:
VAR(Pib) =N − n
N2n
N∑
j=1
(Pij − Pi)2. (3)
The tuple-level sampling is a final uniform sampling.According to the characteristic of proportion estimate,the sample proportion Pit is the unbiased estimate ofthe population proportion, and the variance of Pit is:
VAR(Pit) =NB − n
NB − 1× Pi(1− Pi)
n. (4)
Consequently, the design effect deff is:
978 J. Comput. Sci. & Technol., Nov. 2013, Vol.28, No.6
VAR(hib)VAR(hit)
=N2B2VAR( ˜Pib)
N2B2VAR( ˜Pit)
=NB − nBNB − n
×∑N
j=1(Pij − Pi)2
NP i(1− Pi). (5)
While B > 1, then we can get:
NB − nB 6 NB − n. (6)
The numerator of the right part in (5) can be derivedas:
N∑
j=1
(Pij − Pi)2 =N∑
j=1
(P 2ij − 2PiPij + P 2
i )
=N∑
j=1
P 2ij − 2NP 2
i + NP 2i
=N∑
j=1
P 2ij −NP 2
i . (7)
Pij is the proportion of tuples belonging to bucket Bi
in the j-th block, so 0 6 Pij 6 1, then according to (7)we can get:
N∑
j=1
(Pij − Pi)2 6N∑
j=1
Pij −NP 2i = NPi −NP 2
i . (8)
According to (6) and (8), we can conclude that:
VAR(hib)VAR(hit)
6 1. (9)
¤Theorem 1 reflects the efficiency of block-level sam-
pling for equi-width histograms. However, estimatingthe equi-depth histogram is different from the prob-lem of estimating the proportion. The height of everybucket is almost the same in the equi-depth histogram,and the main problem is to estimate the boundary ofevery bucket, which can be considered as the quantilesof the population. We prove in Theorem 2 that withthe same transmission cost, the block-level samplingwill also provide more accurate estimated results forthe equi-depth histogram.
Theorem 2. Set var2b to represent the height-
variance error of the estimated equi-depth histogram ob-tained from a simple random sample of n blocks, andvar2
t to represent the height-variance error of the esti-mate results over the simple random sample of n tuples.Then the mean value of var2
b is equal to or less than thatof var2
t : E(var2b) 6 E(var2
t ).Proof. The boundary of bucket Bi is determined by
two p-quantiles: Yi and Yi+1. We set αij to represent
the proportion of records in the j-th block that belongsto Bi according to its boundary, and set σ2
i to representthe variance of αij of every block. Then the mean valueof the variance error is:
E(var2b) =
k
N2B2
k∑
i=1
E[(hi − hi)2]
=k
N2B2
k∑
i=1
σ2hi
=k
N2B2
k∑
i=1
n×B2σ2i
=nk
N2
k∑
i=1
σ2i . (10)
The tuple-level sampling can be considered as thespecial case of block-level sampling with block size of1, so the variance error of estimate obtained from thetuple-level sampling with n tuples can also be computedthrough the above equation:
E(var2t ) =
nk
N2
k∑
i=1
σ2it. (11)
However, the variance σ2it in the tuple-level sampling
of n tuples is equal to or greater than that of the block-level sampling of n blocks, so we can get the conclusionthat E(var2
b) 6 E(var2t ). ¤
In order to efficiently utilize the data gotten duringthe course of the sampling, we adopt the block-levelrandom sampling to estimate both the equi-width andequi-depth histograms in HEDC++. However, the es-timate accuracy based on block-level sampling is influ-enced by the data layout during one block. If dataduring every block is randomly stored, then retrievingone block randomly from the data files is equal to re-trieving B tuples randomly. On the other hand, if datain a block has correlation associated with attribute X,the sample size required to get the estimate result withgiven accuracy will be bigger than that of sampling ondata with random layout. In the following subsection,we bound the error of the estimated histogram, andcompute the relationship of required sample size anddata correlation under a given error.
4.3 Bounding the Error and Sample Size
The main problem of equi-width histogram estima-tion is different from that of equi-depth histogram: theformer focuses on estimating the histogram height ofevery bucket with fixed bucket boundary, while thelatter focuses on estimating the boundary of every
Ying-Jie Shi et al.: HEDC++: An Extended Histogram Estimator for Data in the Cloud 979
bucket with fixed height. We propose different bound-ing methodologies for these two kinds of histograms.
4.3.1 Bounding Method for Equi-Width Histogram
In the previous subsection, we have modeled theequi-width histogram estimation as estimating the pro-portions of different buckets in the table. Given abucket Bi, we construct a random variable Xij , whereXij = Pij . The data blocks are of the same size, thenthe average of random variables in the population µi isthe exact bucket proportion: Pi = µi = 1
N
∑Nj=1 Xij .
Consequently the problem can be transformed into es-timating the average value of Xij over all the blocksin the table. We use σ2
i to represent the variance ofrandom variable Xij : σ2
i = 1N
∑Nj=1 (Xij − µi)2. σ2
i
reflects how evenly the elements of bucket Bi are dis-tributed over the blocks, and it can also reflect the cor-relation of data during one block to some extent. If thetuples are fairly distributed among the blocks, then thecorrelations of tuples during one block are small, andσ2
i will be small. And the opposite is also true.During the sampling phase of HEDC++, blocks are
randomly drawn from the data file without bias. Givenbucket Bi, every block corresponds to a proportionvalue Xij . So after the sampling phase we get a sampleset S = {Xi1, Xi2, . . . , Xin} of size n, during which therandom observations are independently and identicallydistributed (i.i.d.). According to the Central LimitTheorem (CLT) for averages of i.i.d. random variables,for large n the estimated proportion Pi approximatelyobeys a normal distribution with mean value µi andvariance σ2
i /n. We construct a random variable Z bystandardizing Pi: Z = Pi−Pi
σi/√
n. Then according to the
property of normal distribution, Z approximately obeysa standard normal distribution. Given a confidencelevel p, denote by zp the p-quantile of the standard nor-mal distribution, we have: P{|Z| 6 zp} ≈ p. It meansthat with probability p, we have:
|Pi − Pi| 6 σizp/√
n. (12)
Recall the relationship of bucket size and the bucket’sproportion, we can get:
|hi − hi| 6 NBσizp/√
n. (13)
According to the height-variance error metric definitionin (1), the bound of the error can be computed through:
errbound = zpk
√1kn
∑k
i=1σ2
i . (14)
From (14), we can observe the elements that influ-ence the estimate error of histogram. The error is di-rectly proportional to the square root of
∑ki=1 σ2
i , which
reflects the data correlation for constructing the his-togram. Also it is inversely proportional to the squareroot of sample size. In most cases, the variance of thepopulation σ2
i is not available, we adopt the varianceof the sampled data σi
2 to compute errbound, whereσi
2 = 1n
∑nj=1 (Xij − µi)2. According to the property
of simple random sampling, σi2 is a consistent estimate
of σ2i[17]. If errbound computed based on the existing
sampling data is bigger than the required error err req,we will have to retrieve more blocks. The extra samplesize required for the desired error err req is computedin a conservative way by assigning err req to the errorbound. According to the relationship between errorbound and the sample size, we can compute the extrasample size:
b =err2 − err2
req
err2n, (15)
where err reflects the height-variance error of the es-timated histogram over the initial sample data and iscomputed based on the data layout.
4.3.2 Bounding Method for Equi-Depth Histogram
As mentioned in the previous subsection, the esti-mate of equi-depth histogram can be modeled as quan-tile estimate. The estimate of quantiles is different fromthe estimation of functions of means, which is similarto the equi-width histogram estimate. In order to ana-lyze and discuss the bounding method more clearly, weadopt the max-boundary error for the equi-depth his-togram, which can reflect the quality of the estimateresult more directly. Our bounding method can also beextended to the height-variance error with manageablemodifications. The separator si is the pi-quantile Ypi
ofthe whole dataset, where pi = i−1
k . The first separators1 is set to be a fixed value small enough to contain theminimum value of the domain in the first bucket, andthe last separator sk+1 is set in the similar way.
After the sampling phase, HEDC++ retrieves nblocks randomly from the data file. According to theanalysis of [18], the pi-quantile of the sample data Ypi
is the unbiased estimate for Ypi. In order to bound
the error, we have to estimate the confidence inter-val for the quantile. However, developing the confi-dence interval for quantiles directly is very difficult,Woodruff inverted the usual confidence interval for thedistribution function[19], and we adopt the method.Set [YL, YH ] to represent the confidence interval forYpi
, and set p′i to represent the percentage of itemsin the sample data less than Ypi , then we can get:P (YL < Ypi
< YH) = P (L < p′i < H). L is thepercentage of items in the sample data less than YL,and H has the similar meaning. So we first computethe interval of [L,H], and then transfer it to [YL, YH ].
980 J. Comput. Sci. & Technol., Nov. 2013, Vol.28, No.6
Let αij be the percentage of items less than Ypiin the
j-th block, and σi be the variance of αij . Though σi
has different meaning from the variance defined in theequi-width histogram of the previous subsection, it canalso quantify the effect of data layout during one blockto the estimation. Woodruff gave the interval of [Li,Hi]based on cluster sampling as [pi − δ, pi + δ][19], where
δ2 =B2n(N − n)
Nσ2
i . (16)
Actually, the pi-quantile Ypiis not known, so the es-
timated quantile Ypiis used to compute the variance
σ2i . According to the max-boundary error metric defi-
nition for the equi-depth histogram in (2), we proposethe estimate form of error bound:
errbound = maxi
{ k
domain width(YHi − YLi)
}. (17)
If errbound computed based on the existing samplingdata is bigger than the required error err req, we willhave to retrieve more blocks for the estimate. Thecomputation of extra sample size b of the equi-depthhistogram is more difficult than that of the equi-widthhistogram, because relationship of error bound and thesampling size cannot be computed directly. Decidingthe exact extra sample size requires estimating the den-sity function of Ypi, which is a notoriously difficult sta-tistical problem. In this paper, we assume that the sam-pling can reflect enough details of the density function,and adopt a conservative method to compute the extrasample size. We first compute the required confidenceinterval of p′i based on err req. The required left bound
of the quantile is YreqL = Ypi − err req × NBk × Ypi
−YL
YH−YL,
and the percentage of tuples smaller than YreqL is setto δL. We compute δH in the similar way, and chooseδreq = max{δL, δH} as the required interval of the per-centage. Based on (16), we can compute the extra sam-ple size:
b =δ2 − δ2
req
δ2req
n. (18)
4.4 Adaptive Sampling Method
HEDC++ adopts a sampling mechanism adaptive tothe data correlation, which is illustrated in Algorithm1. The input of Algorithm 1 includes two variables: thedesired error err req and the initial sample size r. Weassume that the desired error is specified in terms ofthe height-variance error metric and the max-boundarymetric for equi-width and equi-depth histograms re-spectively. The initial sample size is the theoreticalsize required to obtain estimate result with error err req
assuming uniform random sampling, which can be com-puted before the processing based on the analysis in
[13]. We can conclude from (14) and (16) that in orderto get the estimate result of the same accuracy, it re-quires more sampling blocks from data with correlatedlayout during one block than the random layout. Afterpicking d r
B e blocks, HEDC++ estimates the histogrambased on the sampled data (lines 1 and 2). The esti-mation is implemented through one or two MapReducejobs, and the details will be described in the next sec-tion. Then the error bound err is computed based onthe analysis in the previous subsection (line 3), whichis executed in the “Statistical Computing” module ofHEDC++. If err is equal to or less than the desirederror, it means that the estimate results satisfy the re-quirements and they are returned (lines 4 and 5). Oth-erwise, the extra required sample size b is computedbased on the data layout in the initial samples (line 7).Then b blocks are retrieved from the data files and theyare combined with the sampled blocks in the first phase(line 8). At last the final estimated histogram is com-puted on the combined sample set and returned (lines9 and 10).
Algorithm 1. Adaptive Sampling Algorithm
Input: desired error in the estimated histogram: err req;
required sample size on the random layout: r
1 S = d rBe blocks randomly retrieved from the data
file;
2 H = HistogramEstimate(S);
3 err = ErrorBound(S);
4 if err 6 err req then
5 return H;
6 else
7 b = SamsizeBound(S);
8 S = S ∪ b blocks retrieved randomly from data
file;
9 H = HistogramEstimate(S);
10 return H;
11 end
During the adaptive sampling method, the extrasample size required for the desired error err req is com-puted in a conservative way by assigning err req to theerror bound. Both the error bounds of equi-width andequi-depth histograms are computed based on the datalayout. When the correlation of data grouped into oneblock is bigger, the error we bound will be larger andit requires more extra sample data. HEDC++ deter-mines the required sample size adaptively according tothe data layout.
5 Implementing over MapReduce
In this section we describe the implementing detailsof HEDC++ over the Hadoop MapReduce framework.
Ying-Jie Shi et al.: HEDC++: An Extended Histogram Estimator for Data in the Cloud 981
Hadoop④ is one of the most popular open source plat-forms that support cloud computing. A Hadoop in-stallation consists of one master node and many slavenodes. The master node, called JobTracker, is responsi-ble for assigning tasks to the slave nodes and detectingthe execution status of tasks. The slave node, calledTaskTracker, executes tasks actually and reports sta-tus information to the JobTracker through heartbeat.In order to construct approximate histogram on bigdata, we make some necessary extensions to the origi-nal MapReduce framework. Though demonstrated onHadoop, HEDC++ can also be implemented to otherMapReduce platforms with straightforward modifica-tions.
5.1 Extensions to the Original MapReduce
Building the exact histogram can be implementedthrough one original MapReduce job, however, con-structing the approximate histogram has to meet twospecial requirements. The first requirement is to ac-cess the data blocks in a random way. During theoriginal MapReduce framework, the data file are di-vided into a lot of splits, which are put into a schedul-ing queue. The size of a split is the same as the sizeof one block by default, and in this paper we assumeadopting this default configuration to describe our so-lutions more clearly. However, our announcements andmethods still work when the split size is not equal tothe block size. The task scheduler on the JobTrackerschedules every split in the queue to a task tracker. Thescheduling is executed sequentially from the head of thequeue, which is averse to the random sampling require-ment of histogram estimate. In this paper, we makesome extensions to the task scheduler by adding a shuf-fle module just before the scheduling. After the splitsare put into the scheduling queue, we shuffle the splitsand provide a random permutation of all the elementsin the queue. Then all the splits are organized in a ran-dom way, and scheduling the first n splits sequentiallyis equal to sampling n blocks randomly from the datafiles (without replacement).
The second requirement is that after the sampleddata is processed by the MapReduce job, a statisticalcomputing module is needed, which estimates the datasize of every bucket and computes the extra sample sizerequired based on the outputs of all reducers. However,during the original MapReduce framework, the outputsof every reducer are written into a separate file at theend of a MapReduce job. Then these output files can beprocessed by the following MapReduce jobs in parallel.
We add a merge module after the reduce tasks, whichconducts the statistical computing by merging all theoutput files.
The approximation of the equi-width histogram fo-cuses on estimating the bucket height with fixed bound-aries, while the approximation of the equi-depth his-togram focuses on estimating the separators of buck-ets with equal bucket height. The implementation ofestimating these two histograms are described in thefollowing subsections.
5.2 Function Design of Equi-Width Histogram
In this subsection, we describe the functions of theMapReduce jobs to construct the approximate equi-width histogram. When designing the functions, wetake the following rules into consideration. First, net-work bandwidth is a kind of scarce resource when run-ning MapReduce jobs[4], so we design the functionsto decrease the quantity of intermediate results. Weadd combine functions after the mappers, which pre-aggregate the key-value pairs sent to the reducers.Secondly, during the MapReduce processing of estimat-ing histograms, the number of map tasks is much largerthan that of reducer tasks. So arranging more work tothe map tasks helps increase the parallelism degree andreduce the execution time. During the statistical com-puting module, the estimation and sample size bound-ing require several statistical parameters, and we try tocompute these parameters as early as possible by ar-ranging more computing in the map function.
Approximating the equi-width histogram with speci-fied error in HEDC++ involves one or two MapReducejobs depending on the data layouts. The processings ofthe two jobs are the same except the reduce function.The first job processes the initial sampling data. If theerror satisfies the specified requirement, then the es-timated results are returned, else extra sampling datais needed and the extra data is processed in the sec-ond job. The map function is depicted in Algorithm2. In this paper we assume the existence of a getBuck-etID() function, which computes the bucket ID based onthe value of the column associated with the histogram(line 1). For every tuple in the block, the bucket ID isspecified as the output key (line 2). The output valueis a data structure called Twodouble, which containstwo numbers of double type. The first double is usedto compute the variable’s mean value, and the seconddouble is used to compute the variance in the reducefunction. During the map function, the first double isset to 1 for every tuple, and the second double is set tozero (lines 3 and 4).
④http://hadoop.apache.org/, October 2012.
982 J. Comput. Sci. & Technol., Nov. 2013, Vol.28, No.6
Algorithm 2: Map Function
Input: tuple t
Output: text key, twodouble value
1 bucketID = getBucketID (t);
2 key.set(bucketID);
3 value.set(1, 0);
4 output.collect(key, value);
In order to reduce the cost of intermediate datatransmission in the shuffle phase, we define a combinefunction, which is shown in Algorithm 3. The valuesbelonging to the same bucket in the block are accumu-lated (lines 1∼4) and the proportion of every bucket inthe block is computed (line 5). The first double of theoutput value is specified as the proportion of the bucketin this block, and the second double is specified as thesquare of the proportion (line 6). After the combinefunction, all the values belonging to the same bucketare sent to the same reducer. During the reduce func-tion described in Algorithm 4, the two doubles sum andquadraricsum of the same bucket in the value list areaccumulated respectively (lines 4∼8). If the reducer be-longs to the second MapReduce job, it means that dataprocessed in the first job is not enough to construct anapproximate histogram with the specified error. In or-der to save the compute resource and estimation time,we make the processing incremental by utilizing theoutput results of the reducers in the first job. Sup-pose the data size of the first job is n1, and the datasize needed to estimate the histogram with the specifiederror is n. HEDC++ samples n2 = n−n1 blocks in thesecond job, and processes them through the map func-tion. The sum of all the proportions for bucket i of theblocks is:
∑nj=1 Xij =
∑n1j=1 Xij +
∑n1+n2j=n1+1 Xij . Also
the accumulation of the square sum is:∑n
j=1 X2ij =∑n1
j=1 X2ij +
∑n1+n2j=n1+1 X2
ij . The incremental computingis implemented through lines 9∼12. Then the estimatedhistogram size and variance are computed (lines 13 and14).
Algorithm 3: Combine Function
Input: text key, iterator (twodouble) values
Output: (text key, twodouble value′)
1 while values.hasNext() do
2 twodouble it = values.getNext();
3 sum+ = it .get first();
4 end
5 prop = sum/B ;
6 value′.set(prop, prop ∗ prop);
7 output.collect(key, value′);
After all the reducers of the first job complete, themerge module collects all the output results of the re-ducers and conducts the statistical computing to bound
the error and sample size. The error bound is computedthrough equation (line 14) based on the sum of varianceof all the buckets. If the error is bigger than the speci-fied error, then the number of extra sampling blocks iscomputed through (15).
Algorithm 4: Reduce Function
Input: text key, iterator (twodouble) values
Output: size estimate of bucket hi, proportion variance
σ2i
1 //n: number of blocks processed
2 //sum ′: sum of the variables in the last job
3 //quadraticsum ′: quadratic sum of the variables inthe last job
4 while values.hasNext() do
5 twodouble it = values.getNext();
6 sum+ = it .get first();
7 quadraticsum+ = it .get second();
8 end
9 if the second job then
10 sum = sum + sum ′;
11 quadraticsum = quadraticsum + quadraticsum ′;
12 end
13 hi = N ∗B ∗ sum/n;
14 σi = quadraticsum/n− sum ∗ sum/n ∗ n;
5.3 Function Design of Equi-Depth Histogram
Different from the implementation of the equi-widthhistogram, the approximation of the equi-depth his-togram over MapReduce is much more difficult. It re-quires two or three MapReduce jobs according to thedata layout: the first job and the second job processthe initial sampling data, and the third job processesextra sampling data if required. These three jobs canbe classified into two kinds: the separator estimate job(sepJob) and the variance estimate job (varJob). Thefirst job and the third job are sepJobs that compute thepercentage of items less than every column value andthen estimate the separators. The second job is varJob,which computes the variance of percentages of separa-tors among the blocks. It is used to bound the errorand compute the extra sample size.
The map function of sepJob scans all the sampledblocks. The value of the column of interest is set to bethe output key, and the output value is set to be 1 forevery key-value pair. In order to reduce the data trans-mission cost and the burden of the reducers, a com-biner is designed to accumulate the number of itemsequal to a given column value. After the shuffle phase,all the pairs of the same column value are sent to thesame reducer. The sepJob reduce function is depictedin Algorithm 5. For a given column value, the number
Ying-Jie Shi et al.: HEDC++: An Extended Histogram Estimator for Data in the Cloud 983
of items owning the same column value are computed(lines 3∼6). In order to estimate the separators, wehave to compute the percentage of items with the col-umn value less than the given value. So we accumulatethe number of items with column value less than thecolumn value being processed (line 7). If the executingjob is the third job, then we accumulate the number ofitems with the results of the first job, which makes theprocessing and computing incremental (lines 8∼13). Ifthe processing column value appeared in the first job,then we accumulate the stored results. Otherwise, itmeans that the processing column value is new, andthere is no corresponding result for it in the first job.We adopt the result of the first column value in the firstjob which is less than the new column value (line 10).The column value is arranged as the output key. Theoutput value is the accumulative number of items whichis less than the key (lines 14 and 15). During the mergemodule of sepJob, the percentage of items less than ev-ery column value is computed, and the separators areestimated based on the percentages.
Algorithm 5: Reduce Function(SepJob)
Input: text key, iterator (long) values
Output: (text key, long value′)
1 //sum ′: sum of the variables in the last job
2 //sum acc: sum of the variables in the last itera-tion
3 while values.hasNext() do
4 it = values.getNext();
5 sum+ = it ;
6 end
7 sum acc = sum + sum acc;
8 if the third job then
9 if sum ′==0 then
10 sum ′ = getAdjSum();
11 end
12 sum acc = sum acc + sum ′;
13 end
14 value ′.set(sum acc);
15 output.collect(key, value ′);
After the first job, the initial separators are esti-mated, and the next job is to compute the necessarystatistical parameters to bound the error based on theseparators. The map function of varJob scans the sam-pled blocks, and determines the bucket for every itembased on the separators. The output key is set to be theright separator of the bucket, and the value is set to 1.Actually in the implementation of HEDC++, we makesome extensions to the original file input mechanismof MapReduce, and adopt the output results of everycombine function of sepJob as the mapper’s input. The
extensions are aimed to reduce the computation andI/O cost, and then reduce the running time of the esti-mate.
A combiner is also designed after the mapper to com-pute the percentage of items less than every separatorfor each block, which is depicted in Algorithm 6. Thenumber of items during the bucket with the given sepa-rator as the right boundary is accumulated (lines 2∼5).In order to compute the number of items less than theseparator, we also have to accumulate the results fromthe last iteration (line 6). The separator is arranged asthe output key. The output value is a structure con-taining two numbers of doubles, which includes the per-centage of items less than the given separator and thesquare of the percentage (lines 7∼9). Then the reducefunction described in Algorithm 7 computes the per-centage variance among all the blocks for every separa-tor. Given a separator value, the sum of props and theirsquares are accumulated (lines 2∼6). The variance iscomputed through the mean values of the percentageand its square (line 7).
Algorithm 6: Combine Function(varJob)
Input: text key, iterator (long) values
Output: (text key, twodouble value ′)
1 //sum acc: sum of the variables in the last itera-tion
2 while values.hasNext() do
3 it = values.getNext();
4 sum+ = it ;
5 end
6 sumacc = sumacc + sum;
7 prop = sumacc/B;
8 value ′.set(prop, prop ∗ prop);
9 output.collect(key, value ′);
Algorithm 7: Reduce Function (varJob)
Input: text key, iterator (twodouble) values
Output: proportion variance σ2i
1 //n: number of blocks processed
2 while values.hasNext() do
3 twodouble it = values.getNext();
4 sum+ = it .get first();
5 quadraticsum+ = it .get second();
6 end
7 σi = quadraticsum/n− sum ∗ sum/n ∗ n;
After the reduce function of varJob, all the sepa-rators are decided, and the output results are put to-gether to the statistical computing module. We boundthe error of the estimate results based on the methodsdescribed in Subsection 4.3.2. If the error is bigger thanthe required error, then we decide the extra sample size
984 J. Comput. Sci. & Technol., Nov. 2013, Vol.28, No.6
in a conservative way, and the third job is triggered.After the third job, the separator estimate is improvedwith the extra sample data and used as the estimate ofthe equi-depth histogram.
6 Performance Evaluation
In this section, we evaluate the performance ofHEDC++ in terms of sample size required and the run-ning time to get an estimate with specified error. Wecompare our adaptive sampling approach in HEDC++against two other sampling methods by evaluating theirperformances on datasets with different data correla-tions and block sizes. We also evaluate the scalabilityof HEDC++ from two aspects: the data size and clusterscale. All the experiments are implemented on Hadoop0.20.2.
6.1 Experiment Overview
Our experiment platform is a cluster of 11 nodes con-nected by a 1 gigabit Ethernet switch. One node servesas the namenode of HDFS and jobtracker of MapRe-duce, and the remaining 10 nodes act as the slaves.Every node has a 2.33G quad-core CPU and 7 GB ofRAM, and the disk size of every node is 1.8T. We setthe block size of HDFS to 64 M, and configure Hadoopto run two mappers and one reducer per node.
We adopt two metrics to evaluate the performance:sample size and running time. Sample size is com-puted by the histogram estimate algorithm, which rep-resents the number of tuples needed to be sampled toget the histogram estimate with a specified error. Run-ning time is the time cost to get the final estimate.We compare the performance of HEDC++ with twohistogram estimate methods called TUPLE and DOU-BLE, which adopt different sampling mechanisms. TU-PLE conducts a tuple-level random sampling, whichis similar to the sampling method in [15]. It accessesall the blocks in the data file and retrieves tuples ran-domly from every block. DOUBLE adopts a block-levelsampling method. Its difference from HEDC++ is thesample size computing method, which is an iterativeapproach originates from [12]. If the existing sampleddata is not enough to complete the estimate, DOUBLErepeatedly doubles the sample size and executes the es-timation.
The dataset we adopt in the experiment is the pagetraffic statistics of Wikipedia hits log. It contains sevenmonths of hourly pageview statistics for all articles inWikipedia, and includes 320 GB of compressed data(1TB uncompressed)⑤. Every tuple in the dataset con-tains four columns: language, page name, page views
and page size. During the experiment of estimating theequi-width histogram, we choose language as the keycolumn to construct histogram to reflect the data dis-tribution on 10 languages. So the number of buckets ofthe histogram is k = 10. We set the confidence level ofbounding the error to 95%, and set the specified errorto 0.05. During the experiment of the equi-depth his-togram estimate, we choose page size as the key column,which provides reference information for the result sizeestimate of the range query on the page size column.The number of buckets k is also set to 10, and its re-quired error is also set to 0.05.
6.2 Effect of Data Correlation
In this subsection, we evaluate the performances ofthree approaches on datasets with different correlations.We change the data layout of the real dataset to makedifferent degrees of correlations. We adopt a metric Cto measure the data correlation, which has the similarspirit of the cluster degree in [14]. According to theanalysis of (14) and (16), var sum =
∑ki=1 σ2
i reflectsthe data correlation in blocks. var sum is maximizedwhen the tuples are fully ordered by the column of inter-est, and is minimized when the data layout is random.We normalize the metric with respect to var sum forC = 1 when the correlation is the biggest, and C = 0when tuples are laid randomly.
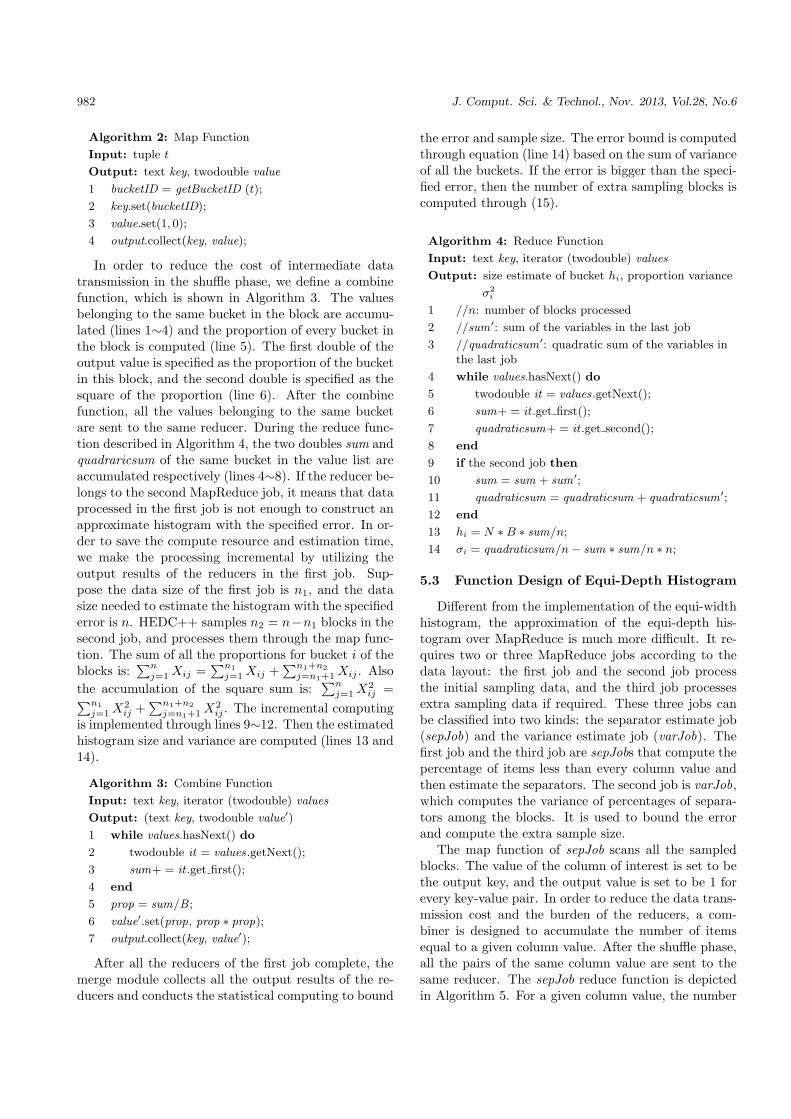
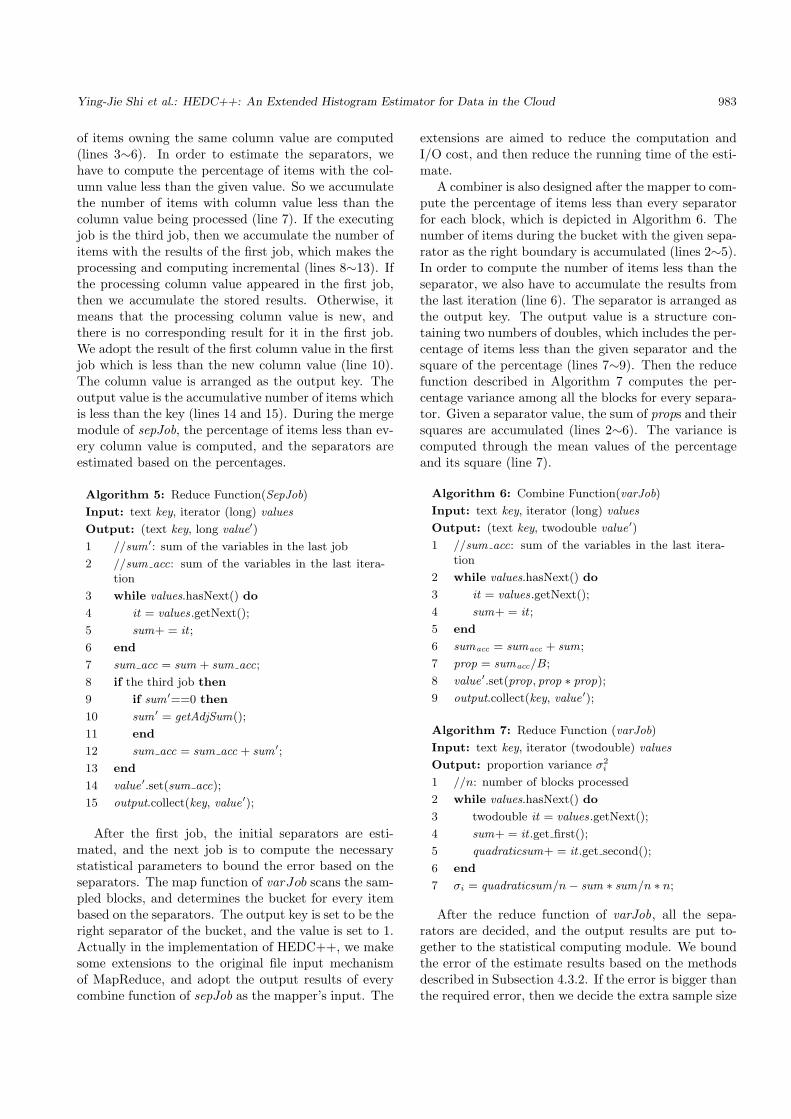
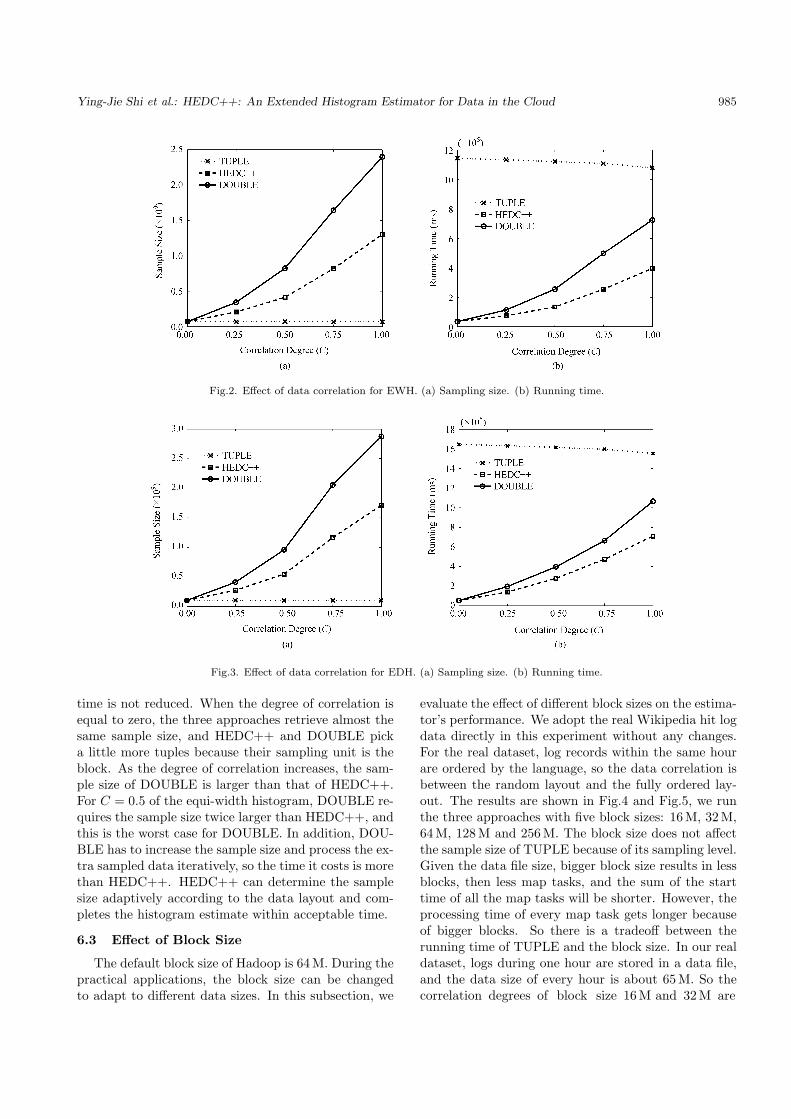
Fig.2 illustrates the sample size and running timeof three approaches on different data correlations forEWH (equi-width histogram), and Fig.3 depicts thecorresponding results for EDH (equi-depth histogram).The effect of data correlation for these two kinds of his-tograms has similar trends. For the approaches withblock-level sampling, the sample size computed is al-ways the number of blocks. In order to compare thesethree approaches conveniently, we show the number oftuples in the experimental results. We can see thatthe data correlation does not affect the required samplesize of TUPLE. This is because that TUPLE conducts arandom sampling on every block in the data files, whichis equal to conduct a tuple-level random sampling onthe whole data. Though the sample size of TUPLE isthe smallest, its running time is longer than HEDC++and DOUBLE. Two reasons may explain the results.First, TUPLE has to access all the blocks during thesampling phase. For blocks that are not in the localdisk of the TaskTracker, data transmission is needed,and this transmission cost of TUPLE is the same asthat of processing all the data. Secondly, the numberof mapper tasks in TUPLE is also the same as that ofprocessing all the data, and the sum of map tasks’ start
⑤http://aws.amazon.com/datasets/2596, November 2012.
Ying-Jie Shi et al.: HEDC++: An Extended Histogram Estimator for Data in the Cloud 985
Fig.2. Effect of data correlation for EWH. (a) Sampling size. (b) Running time.
Fig.3. Effect of data correlation for EDH. (a) Sampling size. (b) Running time.
time is not reduced. When the degree of correlation isequal to zero, the three approaches retrieve almost thesame sample size, and HEDC++ and DOUBLE picka little more tuples because their sampling unit is theblock. As the degree of correlation increases, the sam-ple size of DOUBLE is larger than that of HEDC++.For C = 0.5 of the equi-width histogram, DOUBLE re-quires the sample size twice larger than HEDC++, andthis is the worst case for DOUBLE. In addition, DOU-BLE has to increase the sample size and process the ex-tra sampled data iteratively, so the time it costs is morethan HEDC++. HEDC++ can determine the samplesize adaptively according to the data layout and com-pletes the histogram estimate within acceptable time.
6.3 Effect of Block Size
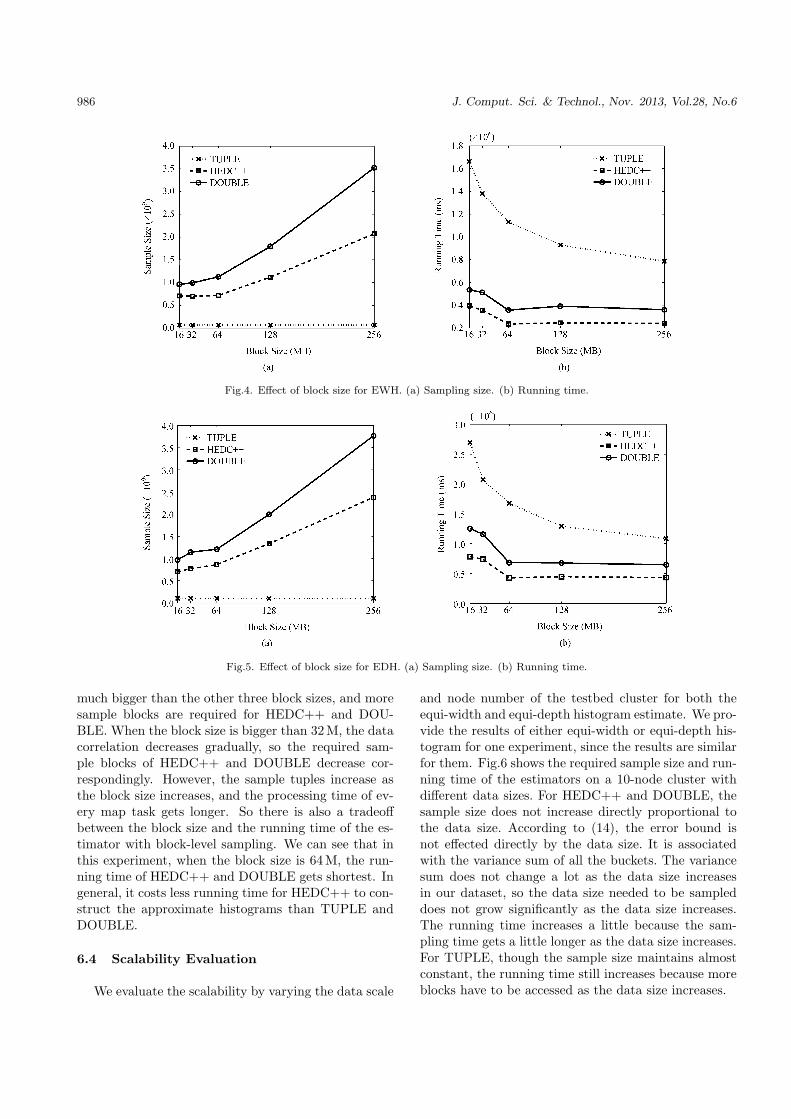
The default block size of Hadoop is 64 M. During thepractical applications, the block size can be changedto adapt to different data sizes. In this subsection, we
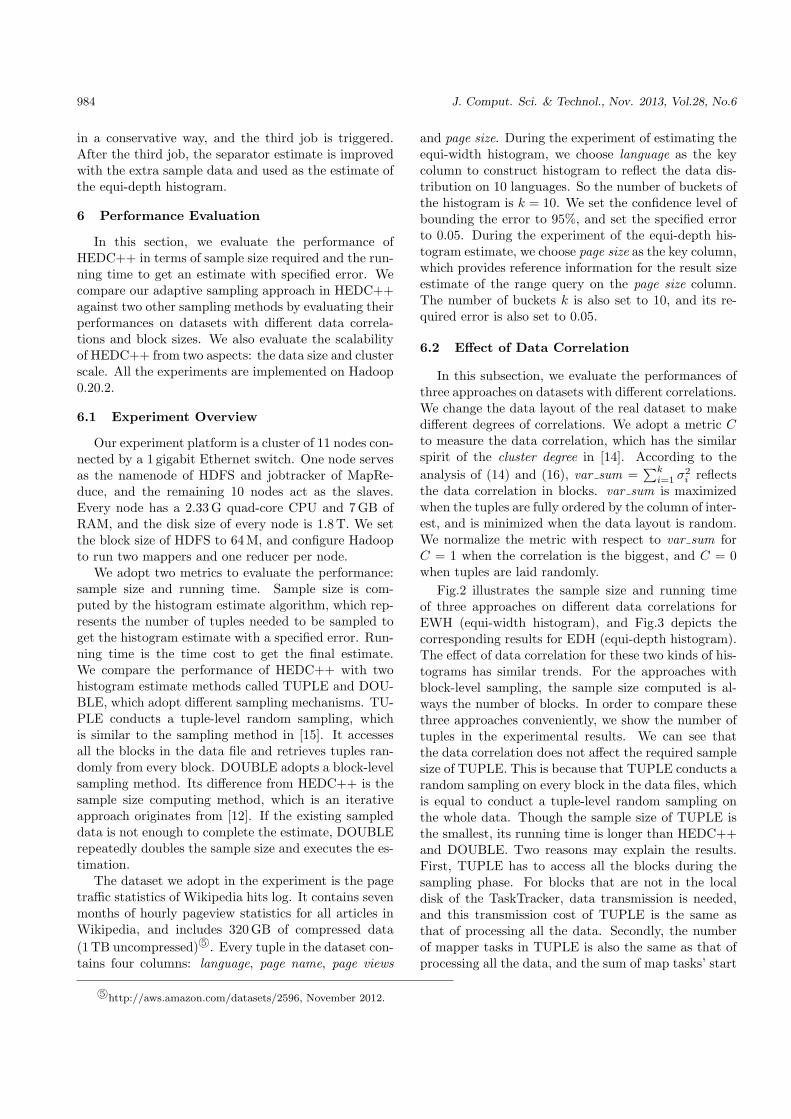
evaluate the effect of different block sizes on the estima-tor’s performance. We adopt the real Wikipedia hit logdata directly in this experiment without any changes.For the real dataset, log records within the same hourare ordered by the language, so the data correlation isbetween the random layout and the fully ordered lay-out. The results are shown in Fig.4 and Fig.5, we runthe three approaches with five block sizes: 16 M, 32M,64M, 128 M and 256 M. The block size does not affectthe sample size of TUPLE because of its sampling level.Given the data file size, bigger block size results in lessblocks, then less map tasks, and the sum of the starttime of all the map tasks will be shorter. However, theprocessing time of every map task gets longer becauseof bigger blocks. So there is a tradeoff between therunning time of TUPLE and the block size. In our realdataset, logs during one hour are stored in a data file,and the data size of every hour is about 65 M. So thecorrelation degrees of block size 16M and 32 M are
986 J. Comput. Sci. & Technol., Nov. 2013, Vol.28, No.6
Fig.4. Effect of block size for EWH. (a) Sampling size. (b) Running time.
Fig.5. Effect of block size for EDH. (a) Sampling size. (b) Running time.
much bigger than the other three block sizes, and moresample blocks are required for HEDC++ and DOU-BLE. When the block size is bigger than 32 M, the datacorrelation decreases gradually, so the required sam-ple blocks of HEDC++ and DOUBLE decrease cor-respondingly. However, the sample tuples increase asthe block size increases, and the processing time of ev-ery map task gets longer. So there is also a tradeoffbetween the block size and the running time of the es-timator with block-level sampling. We can see that inthis experiment, when the block size is 64 M, the run-ning time of HEDC++ and DOUBLE gets shortest. Ingeneral, it costs less running time for HEDC++ to con-struct the approximate histograms than TUPLE andDOUBLE.
6.4 Scalability Evaluation
We evaluate the scalability by varying the data scale
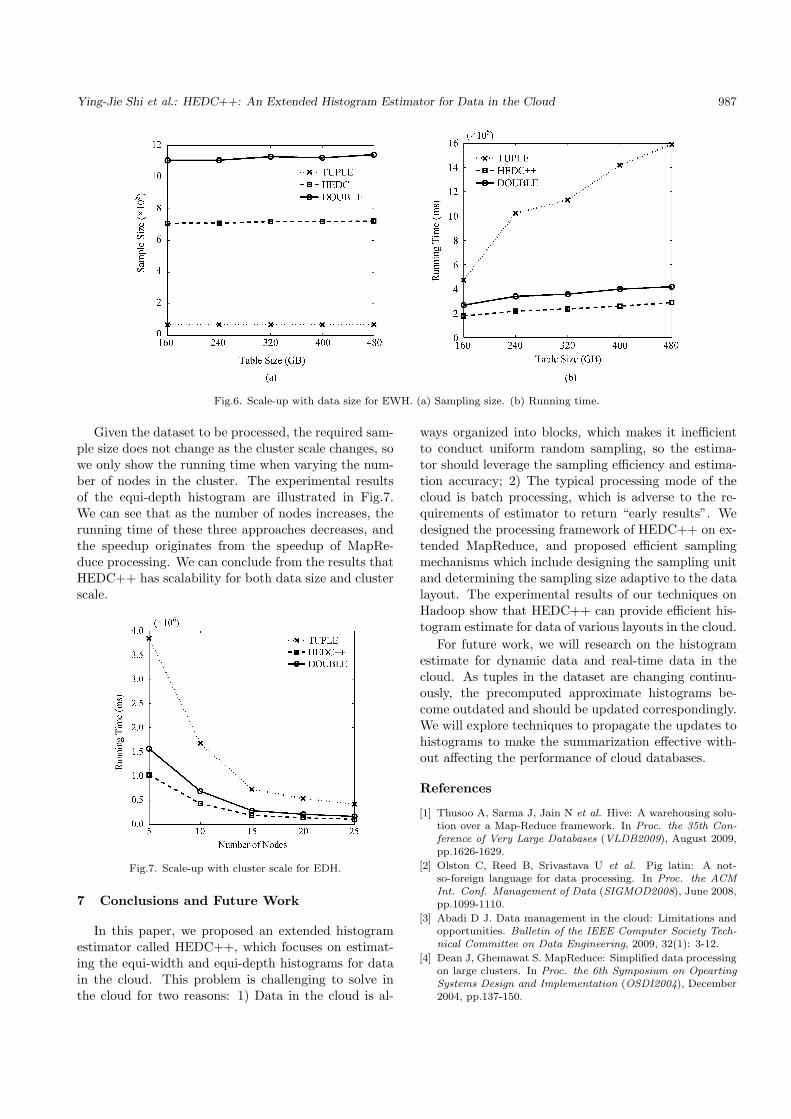
and node number of the testbed cluster for both theequi-width and equi-depth histogram estimate. We pro-vide the results of either equi-width or equi-depth his-togram for one experiment, since the results are similarfor them. Fig.6 shows the required sample size and run-ning time of the estimators on a 10-node cluster withdifferent data sizes. For HEDC++ and DOUBLE, thesample size does not increase directly proportional tothe data size. According to (14), the error bound isnot effected directly by the data size. It is associatedwith the variance sum of all the buckets. The variancesum does not change a lot as the data size increasesin our dataset, so the data size needed to be sampleddoes not grow significantly as the data size increases.The running time increases a little because the sam-pling time gets a little longer as the data size increases.For TUPLE, though the sample size maintains almostconstant, the running time still increases because moreblocks have to be accessed as the data size increases.
Ying-Jie Shi et al.: HEDC++: An Extended Histogram Estimator for Data in the Cloud 987
Fig.6. Scale-up with data size for EWH. (a) Sampling size. (b) Running time.
Given the dataset to be processed, the required sam-ple size does not change as the cluster scale changes, sowe only show the running time when varying the num-ber of nodes in the cluster. The experimental resultsof the equi-depth histogram are illustrated in Fig.7.We can see that as the number of nodes increases, therunning time of these three approaches decreases, andthe speedup originates from the speedup of MapRe-duce processing. We can conclude from the results thatHEDC++ has scalability for both data size and clusterscale.
Fig.7. Scale-up with cluster scale for EDH.
7 Conclusions and Future Work
In this paper, we proposed an extended histogramestimator called HEDC++, which focuses on estimat-ing the equi-width and equi-depth histograms for datain the cloud. This problem is challenging to solve inthe cloud for two reasons: 1) Data in the cloud is al-
ways organized into blocks, which makes it inefficientto conduct uniform random sampling, so the estima-tor should leverage the sampling efficiency and estima-tion accuracy; 2) The typical processing mode of thecloud is batch processing, which is adverse to the re-quirements of estimator to return “early results”. Wedesigned the processing framework of HEDC++ on ex-tended MapReduce, and proposed efficient samplingmechanisms which include designing the sampling unitand determining the sampling size adaptive to the datalayout. The experimental results of our techniques onHadoop show that HEDC++ can provide efficient his-togram estimate for data of various layouts in the cloud.
For future work, we will research on the histogramestimate for dynamic data and real-time data in thecloud. As tuples in the dataset are changing continu-ously, the precomputed approximate histograms be-come outdated and should be updated correspondingly.We will explore techniques to propagate the updates tohistograms to make the summarization effective with-out affecting the performance of cloud databases.
References
[1] Thusoo A, Sarma J, Jain N et al. Hive: A warehousing solu-tion over a Map-Reduce framework. In Proc. the 35th Con-ference of Very Large Databases (VLDB2009), August 2009,pp.1626-1629.
[2] Olston C, Reed B, Srivastava U et al. Pig latin: A not-so-foreign language for data processing. In Proc. the ACMInt. Conf. Management of Data (SIGMOD2008), June 2008,pp.1099-1110.
[3] Abadi D J. Data management in the cloud: Limitations andopportunities. Bulletin of the IEEE Computer Society Tech-nical Committee on Data Engineering, 2009, 32(1): 3-12.
[4] Dean J, Ghemawat S. MapReduce: Simplified data processingon large clusters. In Proc. the 6th Symposium on OpeartingSystems Design and Implementation (OSDI2004), December2004, pp.137-150.
988 J. Comput. Sci. & Technol., Nov. 2013, Vol.28, No.6
[5] Blanas S, Patel J, Ercegovac V et al. A comparison of join al-gorithms for log processing in MapReduce. In Proc. the ACMInt. Conf. Management of Data (SIGMOD2010), June 2010,pp.975-986.
[6] Okcan A, Riedewald M. Processing theta-joins using MapRe-duce. In Proc. the ACM International Conference on Man-agement of Data (SIGMOD2011), June 2011, pp.949-960.
[7] Shi Y J, Meng X F, Wang F S et al. HEDC: A histogram es-timator for data in the cloud. In Proc. the 4th Int. Workshopon Cloud Data Management (CloudDB2012), Oct. 29-Nov. 2,2012, pp.51-58.
[8] Poosala V, Ioannidis Y E, Haas P J, Shekita E J. Improvedhistograms for selectivity estimation of range predicates. InProc. the ACM International Conference on Management ofData (SIGMOD1996), June 1996, pp.294-305.
[9] Ioannidis Y E. The history of histograms (abridged). In Proc.the 29th Conference of Very Large Databases (VLDB2003),September 2003, pp.19-30.
[10] Piatetsky-Shapiro G, Connell C. Accurate estimation of thenumber of tuples satisfying a condition. In Proc. theACM International Conference on Management of Data(SIGMOD1984), June 1984, pp.256-276.
[11] Gibbons P B, Matias Y, Poosala V. Fast incremental main-tenance of approximate histograms. ACM Transactions onDatabase Systems, 2002, 27(3): 261-298.
[12] Chaudhuri S, Motwani R, Narasayya V. Random samplingfor histogram construction: How much is enough? In Proc.ACM International Conference on Management of Data(SIGMOD1998), June 1998, pp.436-447.
[13] Chaudhuri S, Motwani R, Narasayya V. Using random sam-pling for histogram construction. Technical Report, Mi-crosoft, http://citeseerx.ist.psu.edu/showciting?cid=467221,1997.
[14] Chaudhuri S, Das G, Srivastava U. Effective use of block-levelsampling in statistics estimation. In Proc. ACM Interna-tional Conference on Management of Data (SIGMOD2004),June 2004, pp.287-298.
[15] Jestes J, Yi K, Li F F. Building wavelet histograms on largedata in MapReduce. In Proc. the 37th International Con-ference of Very Large Databases (VLDB2011), August 29-September 3, 2011, pp.109-120.
[16] Mousavi H, Zaniolo C. Fast and accurate computation ofequi-depth histograms over data streams. In Proc. the 14thInternational Conference on Extending Database Technology(EDBT2011), March 2011, pp.69-80.
[17] Cochran W G. Sampling Techniques. John Wiley and Sons,1977.
[18] Francisco C A, Fuller W A. Quantile estimation with a com-plex survey design. The Annals of Statistics, 1991, 19(1):454-469.
[19] Woodruff R S. Confidence intervals for medians and otherposition measures. Journal of the American Statistical Asso-ciation, 1952, 47(260): 635-646.
Ying-Jie Shi received the B.S.degree from Shandong University, Ji-nan, in 2005, and M.S. degree fromHuazhong University of Science andTechnology, Wuhan, in 2007, bothin computer science and technology.She is currently a Ph.D. candidate ofRenmin University of China, Beijing.Her research interests include clouddata management and online aggre-
gations of big data.
Xiao-Feng Meng is a full pro-fessor at School of Information, Ren-min University of China, Beijing. Hereceived a B.S. degree from HebeiUniversity, M.S. degree from Ren-min University of China, Ph.D. de-gree from the Institute of ComputingTechnology, Chinese Academy of Sci-ences, all in computer science. He iscurrently the vice dean of School of
Information, Renmin University of China. He is the secre-tary general of Database Technique Committee of the ChinaComputer Federation (CCF DBTC). His research interestsinclude Web data management, Cloud data management,mobile data management, XML data management, flash-aware DBMS, privacy protection in mobile Web, and socialcomputing. He has published over 100 papers in refereedinternational journals and conference proceedings includingIEEE TKDE, VLDB, SIGMOD, ICDE, EDBT, etc. Hehas served on the program committee of SIGMOD, ICDE,CIKM, MDM, DASFAA, etc., and the editorial board ofJournal of Computer Science and Technology (JCST) andFrontiers of Computer Science (FCS).
Fusheng Wang is an assis-tant professor in the Department ofBiomedical Informatics, adjunct as-sistant professor in the Departmentof Mathematics and Computer Sci-ence, and a senior research scientistat the Center for Comprehensive In-formatics, Emory University, U.S.A.Prior to joining Emory University, hewas a research scientist at Siemens
Corporate Research from 2004 to 2009. He received hisPh.D. in computer science from University of California,Los Angeles, in 2004. His research interests include big datamanagement, biomedical imaging informatics, data integra-tion, spatial and temporal data management, sensor datamanagement and processing, natural language processing,and data standardization. He has published over 70 researchpapers in international conferences, journals and book chap-ters. He received the best paper award at ICDCS 2011.He has served as program committee for nearly 20 inter-national conferences and workshops. He was the programchair of the first Extremely Large Databases Conferenceat Asia, Beijing, 2012, program co-chair of the 4th Inter-national Workshop on Cloud Data Management (CloudDB2012), and co-chair of CloudDB 2013.
Yan-Tao Gan received the B.S.degree in computer science and tech-nology from Renmin University ofChina in 2012. She is currently amaster candidate of Renmin Univer-sity of China. Her research interestsinclude cloud data management andonline aggregations of big data.