hino motors, ltd. annual report 1998€¦ · the near term. overseas, the timing of an economic...
TRANSCRIPT

HINO MOTORS, LTD. ANNUAL REPORT 1998For The Year Ended March 31, 1998

Hino Motors, Ltd. makes full use of its world-class diesel engine technology to manufactureand market diesel trucks, buses and industrial and marine engines. In the domestic market formedium- and heavy-duty trucks,* the Company has commanded the top market share for 25consecutive years.
The Japanese automotive industry today is facing a harsh operating environment amid aprolonged downturn in domestic economic activity. Hino Motors is responding by accelerat-ing the development of engines and products that meet customer needs. The Company alsoplans full-fledged entry into the light-duty truck market.
*Medium-duty trucks have payloads from 3.5 to less than 5.0 tons; heavy-duty trucks have payloads of 5.0 tons and over.
PROFILE

Thousands ofMillions of Yen U.S. Dollars
1997 1998 1998
Net sales ......................................................................................... ¥632,716 ¥589,209 $4,460,326Income before income taxes ............................................................ ¥010,611 ¥002,567 $0,019,432Net income .................................................................................... ¥007,237 ¥001,649 $0,012,483Property, plant and equipment—net................................................. ¥172,247 ¥186,356 $1,410,719Total assets ...................................................................................... ¥398,959 ¥421,363 $3,189,727Shareholders’ equity ........................................................................ ¥141,648 ¥142,452 $1,078,364
Yen U.S. Dollars
Per share amounts:Net income ................................................................................ ¥19.97 ¥4.55 $0.03Cash dividends ............................................................................ 6.00 6.00 0.05
Note 1: U.S. dollar amounts here and elsewhere in this Annual Report are translated, for convenience only, at the rate of ¥132.10=$1.Note 2: The years stated in the text are fiscal years which run from April 1 of the previous year through March 31 of the following year.Note 3: Net income per share is computed based on the weighted average number of shares of common stock outstanding during each year.Note 4: Cash dividends per share represents the cash dividends declared as applicable to the respective year.
CONSOLIDATED FINANCIAL HIGHLIGHTSYEARS ENDED OR AS OF MARCH 31, 1997 AND 1998
CONTENTS
Message from the Management .......................................2Our Basic Approach .........................................................4Review of Operations.......................................................8Diesel Trucks for the Domestic Market .........................9Diesel Buses for the Domestic Market .........................10Commissioned Vehicles ...............................................11Other Divisions ............................................................12Overseas Markets .........................................................12
Financial Section............................................................14Directors and Auditors ...................................................26Hino Motors International Network ...............................27Corporate Data ...............................................................28
1

HINO MOTORS IS RESPONDINGTO A HISTORIC DOWNTURNIN THE BUSINESS ENVIRONMENT.
Fiscal year 1998, ended March 31, 1998, was characterized
by a dramatic deterioration in the business environment. The
domestic automotive industry felt the full brunt of these con-
ditions, and truck manufacturers were forced to focus on com-
petitive strengths and concentrate resources on product areas
with growth potential. Despite these efforts, business results
fell below expectations.
With due consideration to the fiscal year’s performance,
Hino Motors has clarified its management strategy for the
years ahead. We ask for the support of our shareholders as
we position Hino Motors for future growth and value cre-
ation.
MARKETS AND PERFORMANCEIn the fiscal year under review, the Japanese economy en-
tered a period of severity that was unprecedented in the post-
war era. Consumer sentiment was adversely affected by a
hike in the consumption tax, and curbs on both public spend-
ing and private-sector capital investment led to continued
economic weakness. These factors were compounded in the
second half of the term when non-performing loan difficul-
ties at financial institutions resurfaced amid a sharp rise in
corporate bankruptcies.
In the market for medium- and heavy-duty trucks, our
mainstay products, domestic demand fell due to the economic
slowdown, which was led by cuts in public works spending
and a slump in housing investment. In the overseas market,
although exports were supported by the yen’s continued de-
preciation, economic conditions weakened in our principal
export market of Southeast Asia as a result of the currency
crisis and economic turmoil in the region. Consequently, de-
mand declined substantially overseas as well as in Japan.
MESSAGE FROM THE MANAGEMENT
Toshimi Onishi, Chairman (left) andHiroshi Yuasa, President
2

Consequently, we do not foresee an increase in demand in
the near term. Overseas, the timing of an economic recovery
in Southeast Asia, our key overseas market, remains uncer-
tain, and further declines in export volume have been incor-
porated into our forecasts.
Hino Motors will therefore concentrate on creating a cor-
porate structure that enables it to develop, manufacture and
distribute high-quality products at a low cost, while fostering
aggressive management to maintain the Company’s earning
power and market presence in the 21st century. To achieve
these objectives, we are committed to maintaining our posi-
tion as number one in the domestic market for medium- and
heavy-duty trucks, which we have held for the past 25 years.
At the same time, we aim to reinvigorate our bus business,
proceed with preparations for our full-fledged entry into the
light-duty truck market, and attain growth as a comprehen-
sive truck and bus manufacturer.
As the leading manufacturer of diesel trucks and buses, we
fully understand the importance of environmental conserva-
tion, and this is our highest priority in product development,
manufacturing and other business processes. These efforts to
protect the environment are valuable activities in the sense of
making qualitative improvements to products, such as enhanc-
ing combustion efficiency, and we believe they hold the key
to the Company’s growth.
At the Board of Directors’ meeting following the general
shareholders’ meeting on June 26, 1998, Kaneyoshi
Kusunoki, who had served with distinction as chairman for
many years, was appointed to the position of senior adviser
to the Board, and Toshimi Onishi was appointed as our new
chairman.
We ask for the continued support of our shareholders.
During the term, Hino Motors launched vehicles incorpo-
rating new technology, bolstered its product lineup and ag-
gressively boosted its R&D and marketing programs.
However, the effects of these measures were overwhelmed
by the extreme deterioration of market conditions. As a re-
sult, overall unit sales of diesel trucks and buses declined
16.1% compared with the previous term to 70,868 units.
In Japan, unit sales of medium-duty trucks fell 13.6% to
19,841 units and declined 14.5% on a value basis to ¥56,224
million. In heavy-duty trucks, unit sales were down 10.8% to
17,880 units, and sales decreased 11.7% on a value basis to
¥116,740 million. Sales of buses recorded a 3.0% decline in
unit sales to 2,739 units and a 5.5% drop in value to ¥29,052
million. Overall domestic sales of diesel vehicles, including
3.0- to 3.5-ton trucks and 2-ton trucks, which posted a rela-
tively strong performance during the year, declined 8.5% to
46,412 units, or 10.4% to ¥212,832 million. Overseas sales
in this category, however, dropped 27.5% to 24,456 units, or
20.9% in value to ¥76,406 million. In addition, commissioned
small vehicle production for Toyota Motor Corporation de-
clined 20.3% to 248,019 units, or 2.3% to ¥170,578 million,
mainly the result of a slump in knockdown production for the
Southeast Asian region.
Consolidated net sales for the year declined 6.9% to
¥589,208 million. The Company responded with aggressive
countermeasures to support earnings, including stepped up
efforts to reduce costs. These efforts, however, were insuffi-
cient to offset falling sales, and operating income fell 93.1%
to ¥728 million, with net income down 77.2% to ¥1,649
million.
OUTLOOK AND STRATEGYAlthough the government implemented a broad economic
stimulus package, the economy is unlikely to turn upward in
the near future. In the domestic medium- and heavy-duty truck
market, we do not expect an early recovery in the structural
downturn in construction-related demand, and depressed
demand for cargo transport is also likely to be prolonged.
Toshimi Onishi, Chairman
Hiroshi Yuasa, President
AGGRESSIVELY
3

4
TO MAINTAIN STRONG EARNING POIN A HARSH ENVIRONMENT, HINO STRUCTURE TO PURSUE AGGRESSIVE MANAGECUSTOMERS WITH HIGH-QUALITY PRODUCTS
OUR BASIC APPROACH
The domestic medium- and heavy-duty diesel truck market has borne the brunt of the prolonged economic downturn, and
market conditions have become increasingly severe. In addition, the countries of Southeast Asia, our principal export mar-
ket, are mired in a currency crisis. Consequently, both domestic and export demand has worsened considerably with no sign
of an end to this industrywide stagnation.
Total domestic demand for medium- and heavy-duty diesel trucks, which is a clear indicator of trends in the domestic
market, declined 25.0% from 148,702 units in fiscal 1997 to 111,547 units in fiscal 1998. In fiscal 1999, despite the expected
effects of the government’s economic stimulus package, harsh market conditions are expected with further declines in do-
mestic demand.
Under such conditions, rather than adopt a defensive stance, Hino Motors is developing an aggressive management style
tuned to the needs of product development, production and marketing. We aim to implement specific measures in the follow-
ing three core areas:
● Enhancing product quality and extending our record as the leader in the domestic market
● Expanding aggressively in overseas markets
● Fully entering the light-duty truck market
Total Domestic Demand for Medium- andHeavy- Duty Trucks (units)
’94 ’95 ’96 ’97 ’98
113,102
153,079 148,074 148,702
111,547

Combustion Efficiency of the Common-Rail System
engine speed
inje
ctio
n pr
essu
re
common-rail system
combustion efficiency
current system
5
ENHANCING PRODUCT QUALITY ANDEXTENDING OUR RECORD AS THE LEADER INTHE DOMESTIC MARKETOutstanding customer loyalty and product competitiveness
is demonstrated by 25 years as the domestic market leader in
medium- and heavy-duty diesel trucks. However, instead of
resting on past achievements, Hino Motors is enthusiastic
about accepting new challenges. We aim to extend our lead-
ership position to 26 years and beyond by placing the highest
priority on meeting customer expectations.
Hino Motors has consistently been a technological pio-
neer. We have led the industry in our responses to deregula-
tion. We have enthusiastically embraced environmental
protection through reduced emissions, lower noise levels and
active recycling in our operations. And we have made an un-
wavering commitment to improving vehicle safety. Outstand-
ing technological strength is evident in every Hino Motors
vehicle.
As we begin our second quarter century at the apex of the
industry, we have renewed our flagship strategic series,
SUPER DOLPHIN PROFIA heavy-duty trucks. In May 1998,
new models were launched with enhanced environmental fea-
tures, economy and safety.
The new series is distinguished by a common-rail, elec-
tronically controlled, high-pressure fuel injection system in a
in-line six cylinder turbo intercooler engine, which was origi-
nally incorporated in our medium-duty truck series to strong
acclaim. The system works by supplying fuel from the fuel
pump to each injector through a common rail and integrating
the electronic control of injection pressure, timing and
amounts. This process enables high-pressure fuel injection,
from low to high speeds adjusted for different loads. As a
result, we have achieved superior fuel economy by substan-
tially improving combustion cleanliness and efficiency.
This development marks a world first for adopting such a
system to heavy-duty trucks with a gross vehicle weight of
20 tons or more, again exemplifying our industry leadership.
WER AND MARKET PRESENCEMOTORS IS CREATING A CORPORATE
MENT INITIATIVES AND PROVIDEAT A LOW COST.
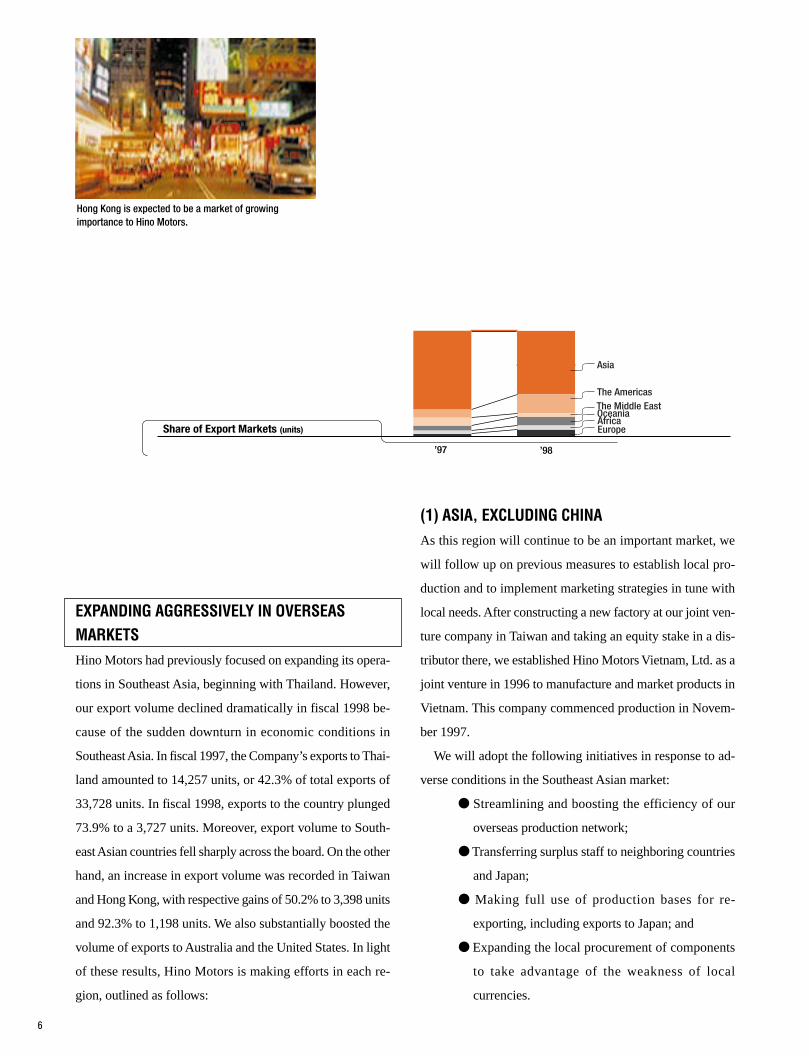
EXPANDING AGGRESSIVELY IN OVERSEASMARKETSHino Motors had previously focused on expanding its opera-
tions in Southeast Asia, beginning with Thailand. However,
our export volume declined dramatically in fiscal 1998 be-
cause of the sudden downturn in economic conditions in
Southeast Asia. In fiscal 1997, the Company’s exports to Thai-
land amounted to 14,257 units, or 42.3% of total exports of
33,728 units. In fiscal 1998, exports to the country plunged
73.9% to a 3,727 units. Moreover, export volume to South-
east Asian countries fell sharply across the board. On the other
hand, an increase in export volume was recorded in Taiwan
and Hong Kong, with respective gains of 50.2% to 3,398 units
and 92.3% to 1,198 units. We also substantially boosted the
volume of exports to Australia and the United States. In light
of these results, Hino Motors is making efforts in each re-
gion, outlined as follows:
(1) ASIA, EXCLUDING CHINAAs this region will continue to be an important market, we
will follow up on previous measures to establish local pro-
duction and to implement marketing strategies in tune with
local needs. After constructing a new factory at our joint ven-
ture company in Taiwan and taking an equity stake in a dis-
tributor there, we established Hino Motors Vietnam, Ltd. as a
joint venture in 1996 to manufacture and market products in
Vietnam. This company commenced production in Novem-
ber 1997.
We will adopt the following initiatives in response to ad-
verse conditions in the Southeast Asian market:
● Streamlining and boosting the efficiency of our
overseas production network;
● Transferring surplus staff to neighboring countries
and Japan;
● Making full use of production bases for re-
exporting, including exports to Japan; and
● Expanding the local procurement of components
to take advantage of the weakness of local
currencies.
Share of Export Markets (units)
’97 ’98
Asia
The AmericasThe Middle EastOceaniaAfricaEurope
Hong Kong is expected to be a market of growingimportance to Hino Motors.
6

(2) CHINAHino Motors views China as a promising market and will
explore the possibility of entering the market in various ways,
beginning with the establishment of joint ventures.
(3) THE UNITED STATES, AUSTRALIA, THEMIDDLE EAST AND AFRICAThe United States is an attractive market and we will focus
efforts on bolstering our product lineup as well as our mar-
keting and service networks. Australia is a crucial market for
us along with Asia, and we will aggressively expand our truck
business there through Hino Motor Sales Australia (HMSA)
Pty Ltd, a wholly owned subsidiary established in 1994. In
the Middle East and Africa, although demand is declining in
such promising markets as Pakistan and Saudi Arabia, we
will strive to uncover substantial potential demand in this
region.
FULL-SCALE ENTRY INTO THE LIGHT-DUTYTRUCK MARKETUntil recently, Hino Motors has concentrated on expanding
its medium- and heavy-duty truck business, while its share of
2-ton vehicle production has been limited to approximately
3%. However, the so-called light-duty truck market, en-
compassing 2.0- to 3.5-ton trucks, is even larger than the
medium- and heavy-duty truck market. At present, to make
full-scale market entry, we are jointly developing new light-
duty trucks with Toyota Motor Corporation, which we plan
to launch in 1999.
Light-duty trucks are strategically vital for future expan-
sion, and we are targeting a domestic market share of 5% in
fiscal 1999 and 10% in fiscal 2000. We plan to begin export-
ing these vehicles immediately after their launch in the do-
mestic market.
Total Domestic Demand for Light-Duty Trucks (units)
’94 ’95 ’96 ’97 ’98
158,511172,497 171,598
185,560
146,430
1.9%2.9% 5.0%*
10.0%*
*estimate
Hino Motors' Market Share in Light-Duty Trucks
’97 ’98 ’99 2000
We have launched an aggressive marketing program in the NorthAmerican market.
7

10
REVIEW OF OPERATIONS
8
SALES OF MAINLINEMEDIUM- AND HEADUTY DIESEL TRUC

11
DIESEL TRUCKS FOR THE DOMESTIC MARKETDomestic demand for medium- and heavy-duty trucks, Hino Motors’ main product
category, declined sharply during the term under review. Adverse factors included
the impact of the consumption tax hike, cuts in public works expenditures, a slump
in housing investment and general economic uncertainty. Signs of a recovery in
demand have yet to appear.
Owing to the steep decline in overall demand, sales in the segment, excluding
light-duty trucks, decreased in terms of both volume and value, falling 8.8% to 43,673
units and 11.1% to ¥183,780 million.
Amid an extremely harsh environment, we strove to stimulate demand through
aggressive and finely tuned product development. In the heavy-duty diesel truck
class, we expanded our SUPER DOLPHIN PROFIA L series with gross vehicle
weight of 22 tons and 25 tons, which was developed in response to the relaxation of
gross vehicle weight regulations in Japan, by adding a 20-kiloliter petroleum tank
9
Sales of Trucks in the Domestic Market (units)
’94 ’95 ’96 ’97 ’98
31,469
46,285 48,038 47,88943,673
VY-KS, AS WELL AS

BUSES DECLINED OVALUE BASIS. HOW
lorry specialty vehicle and a low-bed four-axle truck with all tires of the same size.
In the medium-duty class, we raised the maximum payload for all of our RISING
RANGER series, increased the number of vehicle-type series and introduced a new
liquefied petroleum gas (LPG) vehicle in the bedless-cab FB series. In the RANGER
2 series of light-duty trucks, we also extended the scope of engine types and up-
graded standard specifications. As a result, Hino Motors maintained the top position
in domestic medium- and heavy-duty trucks, representing 25 consecutive years of
market leadership.
DIESEL BUSES FOR THE DOMESTIC MARKETOverall domestic demand for diesel buses remained weak during the term. Sales fell
3.0% to 2,739 units and 5.5% in value to ¥29,052 million.
In addition, the market structure is changing with a decrease in the number of
overall passengers and an increase in the proportion of elderly passengers. These
trends are driving changes in the types of vehicles and specifications required.
Hino Motors developed and launched new buses that precisely meet market needs.
To improve the convenience of boarding and deboarding, we launched the RAIN-
BOW series, which eliminates different deck levels, and the LIÉSSE series, which
features a mechanical step for passengers in wheelchairs. In addition, we developed
a diesel/electric hybrid system for hill-climbing and high-speed cruising, which has
already demonstrated a low level of environmental impact for busses in urban areas
and national parks. This system was incorporated in SÉLEGA, a large tour bus that
was launched during the fiscal year in review. The system boosts the running perfor-
mance of new engine types on roads in mountainous and hilly areas and allows
Hino Motors is developing industry-leading tech-nology for our SUPER DOLPHIN PROFIA series inthe highly competitive domestic heavy-duty truckmarket.
10

We introduced a new series of buses designed formore comfortable cruising and advanced environ-mental protection.
cleaner operation through the elimination of a sub-engine for the air-conditioning
system. In February 1998, Hino buses using this system owned by Matsumoto
Electric Railway Company, Ltd. played an active role in transporting competitors
and spectators at the Nagano Winter Olympics.
COMMISSIONED VEHICLESHino Motors produces vehicles on commission for Toyota Motor Corporation. In
September 1997, full model changes were introduced for the Hilux pickup truck and
the Hilux Surf recreational vehicle, each of which posted strong sales performance.
However, as knockdown exports bound for Southeast Asia declined, overall produc-
tion of commissioned vehicles fell 20.3% to 248,019 units. Including the supply of
parts and other products to Toyota, sales in this category edged down 0.1% to
¥220,855 million.
Sales of Buses in the Domestic Market (units)
’94 ’95 ’96 ’97 ’98
3,028 2,8142,596
2,823 2,739
N BOTH A UNIT ANDWEVER, WE MADE 11

OTHER DIVISIONSDomestic sales volume of industrial diesel engines declined 14.8% to 9,391 units,
as previously strong demand for models equipped with emission control devices for
generators and compressors declined.
Sales of parts supplied to the domestic market were depressed by such factors as
restrained private-sector capital investment and fell 6.0% to ¥31,563 million. Over-
all sales of other divisions rose 2.4% to ¥62,130 million.
OVERSEAS MARKETSAs in fiscal 1997, Hino Motors endeavored to reinforce its product strength by ex-
panding the new Super F series and launching vehicles that conform with such ve-
hicle emission regulations as Euro I and EPA98. As a result, we boosted sales volume
in the United States, Central and South America and Australia. However, as condi-
tions worsened in our principal export markets of Southeast Asia, overall export
volume fell below the previous term’s level, dropping 27.5% to 24,456 units.
Exports of industrial diesel engines to China and the United States were buoyant
and in October 1997, we began full-fledged exports of engines for generators to
Taiwan. Consequently, overall sales of industrial diesel engines soared 63.8% to
2,100 units.
However, as shipments of overseas OEM (original equipment manufacturing)
components to South Korea declined substantially because of the economic turmoil
Demand for industrial diesel engines was ad-versely affected by Japan's weakening economy.
Sales of Trucks and Buses in Overseas Markets (units)
’94 ’95 ’96 ’97 ’98
32,837 32,429 31,649 33,728
24,456
busestrucks
Only 1994 figure is on a nonconsolidated basis.
STRONG EFFORTS OURSELVES FROM 12

in the country, aggregate sales of overseas OEM components and parts supplied to
overseas markets edged down 0.1% to ¥13,197 million.
As a result of these factors, total overseas sales decreased 17.6% to ¥93,388 mil-
lion.
During the fiscal year, the financial crisis in Southeast Asia led our joint venture
in Thailand, Thai Hino Industry Co., Ltd., to completely close down its production
lines in January 1998, the first time this had occurred since the venture was estab-
lished in 1964. In June, however, it resumed truck production. To bolster our prod-
uct lineup in Thailand, in February 1998 we began a mutual OEM supply arrangement
with Toyota for our 5-ton trucks and Toyota’s 2-ton trucks.
Further, November 1997 saw the start of operations at the factory of Hino Motors
Vietnam, Ltd., which we established in 1996 to develop a new market in Vietnam.
Sales in Overseas Markets (¥ millions)
’94 ’95 ’96 ’97 ’98
101,236 107,216 102,857113,386
93,389
Only 1994 figure is on a nonconsolidated basis.
Europe1,457 units
Africa1,034 units
The Middle East821 units North America
2,027 units
Central andSouth America2,398 unitsOceania
1,981 units
Asia14,738 units
Europe1,457 units
Africa1,034 units
The Middle East821 units North America
2,027 units
Central andSouth America2,398 unitsOceania
1,981 units
Asia14,738 units
Export Vehicles By RegionTotal 24,456 Units
We continue to reinforce our operations in Thai-land.
TO DIFFERENTIATETHE COMPETITION.13
FINANCIAL SECTION
MANAGEMENT’S DISCUSSION AND ANALYSIS
SCOPE OF CONSOLIDATION AND EQUITY METHOD
In accordance with generally accepted accounting principles
in Japan, the consolidated financial statements include the
accounts of Hino Motors, Ltd. and seven consolidated sub-
sidiaries, including three subsidiaries that were included in
the consolidated accounts for the first time during the fiscal
year ended March 31, 1998. In addition, 17 affiliated compa-
nies were accounted for using the equity method, compared
with 14 companies during the previous term.
NET SALES
For the fiscal year ended March 31, 1998, consolidated net
sales declined 6.9% to ¥589,209 million (US$4,460 million),
reflecting harsh conditions in domestic and overseas markets.
Total domestic sales, which include vehicles produced on
commission for Toyota Motor Corporation, were down 4.5%
to ¥495,820 million (US$3,753 million). Overseas sales fell
17.6% to ¥93,389 million (US$707 million). The overseas
sales ratio was 15.8%, compared with 17.9% during the pre-
vious fiscal year.
Domestic sales of diesel trucks and buses declined 11.6%
to ¥206,347 million (US$1,562 million). Of this amount,
heavy-duty truck sales were ¥116,740 million (US$884 mil-
lion), a decline of 11.7% from the previous term, and me-
dium-duty truck sales were ¥56,224 million (US$426
million), down 14.5%. Domestic bus sales were down 5.5%
to ¥29,053 million (US$220 million). Domestic sales of 2-
ton trucks, however, climbed 60.5% to ¥6,486 million (US$49
million).
Owing largely to adverse operating conditions in the
Company’s chief export markets of Southeast Asia, overseas
sales of diesel trucks and buses decreased 20.9% to ¥76,407
million (US$578 million), or 13.0% of net sales.
Sales of pickup trucks and recreational vehicles produced
on commission for Toyota, and related parts and others, edged
down 0.1% to ¥220,856 million (US$1,672 million), account-
ing for 37.5% of total net sales. Of this amount, vehicle sales
were ¥170,578 million (US$1,291 million), 2.3% below the
previous fiscal year.
NET INCOME
Lower sales led to a 25.0% decline in gross profit to ¥40,656
million (US$308 million). The gross profit margin deterio-
rated 1.7 percentage points to 6.9%, while the ratio of sell-
ing, general and administrative expenses to net sales was
6.8%, a slight improvement of 0.1 percentage point. The op-
erating income margin was 0.1%. Consequently, operating
income fell 93.1% to ¥728 million (US$6 million).
Interest expenses net of interest and dividend income was
¥37 million (US$0.3 million), compared with ¥32 million a
year earlier. However, with other income, net of ¥1,876 mil-
lion (US$14 million), which included a gain on the sale of
marketable securities, the Company recorded other income,
net of other income, of ¥1,839 million (US$14 million),
compared with net expenses of ¥15 million in the previous
term.
14
The above factors resulted in income before income taxes of
¥2,567 million (US$19 million), a decline of 75.8%. Follow-
ing equity in losses of unconsolidated subsidiaries of ¥1,047
million (US$8 million) and other items, net income was
¥1,649 million (US$12 million), or 77.2% below the previ-
ous term. Net income per share was ¥4.55 (US$0.03), with
cash dividends maintained at ¥6.00 (US$0.05).
CASH FLOWS AND FINANCIAL POSITION
Net cash used in operating activities was ¥4,914 million
(US$37 million), compared with net cash provided by oper-
ating activities of ¥76,235 million during the previous term.
Although the total of net income and depreciation and amor-
tization was ¥29,346 million (US$222 million), this was off-
set by other factors, especially a decrease in notes and
accounts payable of ¥17,956 million (US$136 million).
Net cash used in investing activities was ¥43,021 million
(US$326 million), a slight decrease from the previous term.
The largest use of cash in this category was addition to prop-
erty, plant and equipment of ¥50,668 million (US$384 mil-
lion).
Net cash provided by financing activities was ¥42,532 mil-
lion (US$322 million), compared with net cash used in fi-
nancing activities of ¥24,506 million during the previous term.
The largest source of cash in this category was proceeds from
long-term debt of ¥32,843 million (US$249 million), followed
by a net increase in short-term loans of ¥14,561 million
(US$110 million).
In aggregate, cash and cash equivalents at end of year de-
creased ¥5,403 million (US$41 million) to ¥36,273 million
(US$275 million).
Interest-bearing debt (short-term bank loans, the current
portion of long-term debt and long-term debt) increased
¥44,846 million to ¥125,153 million (US$947 million). Long-
term debt increased ¥19,022 million to ¥73,930 million
(US$560 million), including bond issuances of ¥10,000 mil-
lion (US$76 million) and ¥20,000 million (US$151 million)
at 2.2% and 2.6%, respectively. The current portion of long-
term debt increased ¥11,263 million to ¥13,406 million
(US$101 million).
Total assets grew ¥22,404 million to ¥421,363 million
(US$3,190 million). The equity ratio was 33.8%, compared
with 35.5% a year earlier.
15

Thousands ofMillions of Yen U.S. Dollars
ASSETS 1997 1998 1998
Current assets:Cash and cash equivalents ............................................................. ¥(041,676 ¥(036,273 $(0,274,587Short-term investments ................................................................ 11,517 13,667 103,460Trade receivables
Notes ....................................................................................... 1,234 1,058 8,009Accounts .................................................................................. 71,217 73,376 555,458
Inventories (Note 3) ..................................................................... 27,379 34,044 257,714Prepaid expenses and other current assets ...................................... 6,768 9,657 73,104Less allowance for doubtful accounts ............................................. (819) (717) (5,428)
Total current assets ................................................................ 158,972 167,358 1,266,904
Investments and advances:Investment securities .................................................................... 33,953 34,014 257,487Investments in and advances to unconsolidatedsubsidiaries and affiliates (Note 4) ................................................. 25,990 24,627 186,427Long-term loans .......................................................................... 430 355 2,687Other investments ........................................................................ 10,170 10,154 76,866Less allowance for doubtful accounts ............................................. (2,870) (1,680) (12,718)
Total investments and advances .............................................. 67,673 67,470 510,749
Property, plant and equipment (Note 7) :Land ............................................................................................ 16,640 17,888 135,413Buildings and structures ................................................................ 120,588 129,899 983,338Machinery and equipment ........................................................... 235,100 252,149 1,908,774Vehicles and tools ......................................................................... 59,965 71,686 542,665Construction in progress .............................................................. 21,059 17,462 132,187
....................................................................................................... 453,352 489,084 3,702,377Less accumulated depreciation ...................................................... (281,105) (302,728) (2,291,658)
Net property, plant and equipment ........................................ 172,247 186,356 1,410,719
Other assets .................................................................................. 67 179 1,355
....................................................................................................... ¥(398,959 ¥(421,363 $(3,189,727
See accompanying Notes to Consolidated Financial Statements.
CONSOLIDATED BALANCE SHEETSMARCH 31, 1997 AND 1998
16

Thousands ofMillions of Yen U.S. Dollars
LIABILITIES AND SHAREHOLDERS’ EQUITY 1997 1998 1998
Current liabilities:Short-term bank loans (Note 5) .................................................... ¥023,256 ¥037,817 $0,286,276Current portion of long-term debt (Note 5) ................................. 22,143 13,406 101,484Trade payables
Notes....................................................................................... 6,969 5,666 42,892Accounts .................................................................................. 108,605 91,952 696,079
Accrued income taxes (Note 9) .................................................... 4,010 455 3,444Accrued expenses ......................................................................... 12,542 11,574 87,615Other current liabilities ................................................................ 28,529 28,210 213,550
Total current liabilities .......................................................... 186,054 189,080 1,431,340
Long-term liabilities:Long-term debt (Note 5) ............................................................. 54,908 73,930 559,652Accrued severance indemnities (Note 6) ....................................... 15,749 15,523 117,509Other .......................................................................................... 29 24 182
Total long-term liabilities ...................................................... 70,686 89,477 677,343
Translation adjustments .............................................................. 203 — —
Minority interests in consolidated subsidiaries ......................... 368 354 2,680
Shareholders’ equity:Common stock, par value ¥50 per shareAuthorized—1,000,000,000 sharesIssued—362,391,898 shares in 1997 and 1998 .............................. 26,412 26,412 199,939Additional paid-in capital ............................................................. 17,787 17,787 134,648Legal reserve (Note 11) ................................................................ 6,603 6,603 49,985Retained earnings (Note 12) ........................................................ 90,846 91,651 693,800Less
Treasury common stock, at cost:176 shares in 1997 and 1,770 shares in 1998 .............................. (0) (1) (8)
Total shareholders’ equity ...................................................... 141,648 142,452 1,078,364
....................................................................................................... ¥398,959 ¥421,363 $3,189,727
17

Thousands ofMillions of Yen U.S. Dollars
1997 1998 1998
Net sales (Note 14) ........................................................................ ¥632,716 ¥ 589,209 $4,460,326Cost of sales (Note 7) .................................................................... 578,537 548,553 4,152,559
Gross profit .................................................................................. 54,179 40,656 307,767
Selling, general and administrative expenses (Note 7) ................ 43,553 39,928 302,256
Operating income ........................................................................ 10,626 728 5,511
Other income (expenses) (Note 7):Interest and dividend income ........................................................ 2,314 1,999 15,132Interest expenses .......................................................................... (2,346) (2,036) (15,413)Other, net .................................................................................... 17 1,876 14,201
....................................................................................................... (15) 1,839 13,921
Income before income taxes ...................................................... 10,611 2,567 19,432Income taxes (Note 9):
Current ....................................................................................... 5,174 488 3,694Deferred ...................................................................................... 167 (426) (3,225)
....................................................................................................... 5,341 62 469
Income before items as shown below ......................................... 5,270 2,505 18,963Minority interests in income of consolidated subsidiaries ....... (8) 191 1,446Amortization ................................................................................ (0) (0) (0)Equity in (losses) earnings of unconsolidated subsidiariesand affiliates ................................................................................ 1,975 (1,047) (7,926)
Net income .................................................................................. ¥007,237 ¥001,649 $0,012,483
Per share amounts: Yen U.S. Dollars
Net income ................................................................................. ¥0019.97 ¥0004.55 $0,0000.03Cash dividends ............................................................................. 6.00 6.00 0.05
See accompanying Notes to Consolidated Financial Statements.
CONSOLIDATED STATEMENTS OF INCOMEFOR THE YEARS ENDED MARCH 31, 1997 AND 1998
18

Millions of YenNumber of Number of
shares of shares ofcommon Additional Treasury
stock Common paid-in Legal Retained common(Thousands) stock capital reserve earnings stock
Balance at March 31, 1996 ............................. 362,392 ¥ 26,412 ¥ 17,787 ¥ 6,603 ¥ 88,588 (1,429)Net income ..................................................... — — — — 7,237 —Cash dividends paid ......................................... — — — — (2,174) —Directors’ and statutory auditors’ bonuses ........ — — — — (140) —Decrease due to the exemption of an affiliateaccounted for by the equity method ............... — — — — (2,665) —Other .............................................................. — — — — — 1,253
Balance at March 31, 1997 ............................. 362,392 26,412 17,787 6,603 90,846 (176)Net income ..................................................... — — — — 1,649 —Cash dividends paid ......................................... — — — — (2,174) —Directors’ and statutory auditors’ bonuses ........ — — — — (140) —Increase due to the addition of an affiliateaccounted for by the equity method ............... — — — — 1,470 —Other .............................................................. — — — — — (1,594)
Balance at March 31, 1998 ............................. 362,392 ¥ 26,412 ¥ 17,787 ¥ 6,603 ¥ 91,651 (1,770)
Thousands of U.S. Dollars
AdditionalCommon paid-in Legal Retained
stock capital reserve earnings
Balance at March 31, 1997 ........................................... $199,939 $134,648 $49,985 $687,706Net income ................................................................... — — — 12,483Cash dividends paid ....................................................... — — — (16,457)Directors’ and statutory auditors’ bonuses ...................... — — — (1,060)Increase due to the addition of an affiliateaccounted for by the equity method ............................. — — — 11,128
Balance at March 31, 1998 ........................................... $199,939 $134,648 $49,985 $693,800
See accompanying Notes to Consolidated Financial Statements.
CONSOLIDATED STATEMENTS OF SHAREHOLDERS’ EQUITYFOR THE YEARS ENDED MARCH 31, 1997 AND 1998
19

CONSOLIDATED STATEMENTS OF CASH FLOWSFOR THE YEARS ENDED MARCH 31, 1997 AND 1998
Thousands ofMillions of Yen U.S. Dollars
1997 1998 1998
Operating activities:Net income ................................................................................. ¥(07,237 ¥(01,649 $(012,483Adjustments to reconcile net income to net cashprovided by operating activities:
Depreciation and amortization .................................................. 26,795 27,697 209,667Provision for doubtful accounts ................................................. (138) (102) (772)Provision for severance indemnities less payments ...................... (421) (226) (1,711)Loss on sales and disposal of property, plant and equipment ........ 516 625 4,731(Decrease) increase in minority interests .................................... 6 (14) (106)
Changes in operating assets and liabilities:Notes and accounts receivable ................................................... 17,483 (1,983) (15,011)Inventories ............................................................................... 1,040 (6,665) (50,454)Prepaid expenses and other current assets .................................. 2,200 (2,889) (21,870)Notes and accounts payable ...................................................... 7,514 (17,956) (135,927)Accrued income taxes .............................................................. 3,873 (3,555) (26,911)Accrued expenses and other current liabilities ............................ 10,130 (1,495) (11,317)
Net cash (used in) provided by operating activities ............. 76,235 (4,914) (37,198)
Investing activities:(Increase) decrease in short-term investments ................................ 654 (2,150) (16,276)Net decrease (increase) in investments inunconsolidated subsidiaries and affiliates ....................................... (3,252) 2,833 21,446Net increase in investment in securities ......................................... (2,725) (61) (462)Net decrease in long-term loans ................................................... 102 75 568Addition to property, plant and equipment .................................... (49,207) (50,668) (383,558)Proceeds from sales and disposal of property, plantand equipment ............................................................................ 11,717 4,478 33,899Other .......................................................................................... (896) 2,472 18,713
Net cash used in investing activities ................................... (43,607) (43,021) (325,670)
Financing activities:Net increase (decrease) in short-term loans ................................... (650) 14,561 110,227Proceeds from long-term debt ...................................................... 1,370 32,843 248,622Repayments of long-term debt ..................................................... (22,912) (2,558) (19,364)Cash dividends paid and directors’ and statutoryauditors’ bonuses ......................................................................... (2,314) (2,314) (17,517)
Net cash provided by (used in) financing activities .............. (24,506) 42,532 321,968
Net (decrease) increase in cash and cash equivalents ........... 8,122 (5,403) (40,900)Cash and cash equivalents at beginning of year .................... 33,554 41,676 315,487
Cash and cash equivalents at end of year .............................. ¥(41,676 ¥(36,273 $(274,587
Supplemental disclosures of cash flow information:Cash paid during the year for:
Interest expense ........................................................................ ¥(03,145 ¥(01,971 $(014,921Income taxes ............................................................................ ¥(01,322 ¥(04,170 $(031,567
See accompanying Notes to Consolidated Financial Statements.
20

NOTES TO CONSOLIDATED FINANCIAL STATEMENTS
Note 1: Basis of Consolidated Financial Statements’ PresentationThe accompanying consolidated financial statements of HINOMOTORS, LTD. (the “Company”) and its consolidated subsid-iaries have been prepared in accordance with accounting prin-ciples and practices generally accepted in Japan.
In preparing these statements, certain reclassifications and re-arrangements have been made to the accompanying consoli-dated financial statements prepared domestically in Japan in orderto present these statements in a format which is more familiar toreaders outside Japan. In addition, the accompanying notes in-clude additional information, which is not required under ac-counting principles and practices generally accepted in Japan.
The U.S. dollar amounts included herein are solely for theconvenience of readers outside Japan and have been translatedfrom the Japanese yen amounts at the rate of ¥132.10=$1, theapproximate exchange rate prevailing as of March 31, 1998.
Note 2: Summary of Significant Accounting Policies(1) ConsolidationThe accompanying consolidated financial statements include theaccounts of the Company and its significant subsidiaries. Invest-ments in unconsolidated subsidiaries and affiliates are stated atcost and certain unconsolidated affiliates are accounted for bythe equity method.(2) Foreign Currency TranslationForeign currency translation of the accounts of the Companyand its subsidiaries are as follows:
Current receivables and payables in foreign currencies aretranslated at the rate of exchange in effect at the balance sheetdate or at the rates of any applicable forward exchange contract.Non-current receivables and payables are translated at historicalexchange rates.
The accounts of the consolidated foreign subsidiary are trans-lated into yen at the rate of exchange in effect at the balancesheet date.(3) Statements of Cash FlowsFor the presentation of the statements of cash flows, the Com-pany considers cash, time deposits and all other highly liquidinvestments with an original maturity of three months or less tobe cash equivalents.(4) InventoriesThe Company:Finished products are stated at cost, which is determined by theidentified cost method. Work in process, raw materials and sup-plies are stated at cost, which is determined by the moving aver-age cost method.
Subsidiaries:Inventories are principally stated at cost, which is determined bythe moving average method or at the latest purchase price.(5) Marketable Securities and Investment SecuritiesMarketable securities and investment securities are carried atcost, which is determined by the moving average cost method.(6) Property, Plant and Equipment and DepreciationProperty, plant and equipment are stated at cost. Depreciation iscomputed principally by the declining balance method basedon the estimated useful lives of the respective assets.
The range of useful lives are as follows:Buildings and structures 5 to 75 yearsMachinery and equipment 4 to 12 yearsVehicles and tools 2 to 15 years
(7) Severance Indemnities and Pension PlansEmployees who terminate their services with the Company andits subsidiaries are entitled to a lump-sum severance paymentdetermined by reference to their current basic rate of pay andlength of service. The Company and its subsidiaries generallyprovide for this liability to the extent of 40 per cent. of theamount (equal to the maximum amount allowable for incometax purposes) which would be required to be paid if allemployees voluntarily terminated their services at the balancesheet date.
The Company has a non-contributory pension plan for em-ployees. An employee who terminates employment with theCompany at age 50 or more receives 10 per cent. (mandatoryretirement at age 60 entitles an employee to receive 100 percent.) of such retirement benefits by a lump-sum payment or byannuity payments from this pension plan, and the remainder bya lump-sum payment from the unfunded retirement plan (asdescribed above). Payments to the pension fund are charged toincome when made. The past service costs relating to the pen-sion plan are being funded over a period of 20 years.
The consolidated subsidiaries have various kinds of pensionplans.(8) Allowance for Doubtful AccountsThe allowance for doubtful accounts is provided based on theestimated amount of probable bad debts and the maximumamount which can be charged to income under Japaneseincome tax laws.(9) Research and Development CostsResearch and development costs are charged to income asincurred.
21

(10) Income TaxesIncome taxes are provided for based on amounts currently payablefor each year. No tax effect is recognized by the Company andits domestic subsidiaries for timing differences which arise as aresult of the differences in the recognition of certain incomeand expenses for tax and for financial reporting purposes.
The foreign consolidated subsidiaries recognizes deferredincome tax for such timing differences.(11) Revenue RecognitionSales of products are recognized in the accounts upon shipmentto customers.(12) Net Income per ShareThe computation of net income per share is based on theweighted average number of shares outstanding during theperiod.(13) LeasesFinance leases, other than those lease agreements which stipu-late the transfer of ownership of the leased property, areaccounted for as operating leases.
Note 3: InventoriesInventories at March 31, 1997 and 1998 consisted of thefollowing:
Thousands ofMillions of Yen U.S. Dollars
1997 1998 1998
Finished products ................. ¥13,201 ¥17,341 $131,272Work in process .................... 11,203 13,377 101,264Raw materialsand supplies ......................... 2,975 3,326 25,178
¥27,379 ¥34,044 $257,714
Note 4: Advances to Unconsolidated Subsidiaries and AffiliatesLoans to unconsolidated subsidiaries and affiliates at March31, 1997 and 1998, consisted of the following:
Thousands ofMillions of Yen U.S. Dollars
1997 1998 1998
Long-term loans:Unconsolidatedsubsidiaries ...................... ¥952 ¥940 $7,116Affiliates ........................... 32 0 0
............................................ ¥984 ¥940 $7,116
Note 5: Short-Term Bank Loans and Long-Term DebtThe annual interest rates applicable to short-term bank loansoutstanding at March 31, 1997 and 1998 were principally 1.625per cent.
Long-term debt at March 31, consisted of the following:Thousands of
Millions of Yen U.S. Dollars
1997 1998 1998
Loans, principally frombanks, insurancecompanies and otherinstitutions, due 1998to 2026 withinterest rates rangingfrom 1.15% ~ 5.51%
Secured ............................ ¥05,529 ¥04,830 $036,563Unsecured ........................ 7,522 8,506 64,391
Less amount duewithin one year ................... (2,143) (9,406) (71,204)............................................ 10,908 3,930 29,7507.0% bonds due 1998 ........... 4,000 4,000 30,2803.45% bonds due 1999 ......... 15,000 15,000 113,550Floating-rate bondsdue 1999 ............................. 25,000 25,000 189,2512.2% bonds due 2002 ........... — 10,000 75,7002.6% bonds due 2003 ........... — 20,000 151,400Less amount duewithin one year ................... — (4,000) (30,280)............................................ 44,000 70,000 529,901
¥54,908 ¥73,930 $559,652
The aggregate annual maturities of long-term debt outstand-ing at March 31, 1998, were as follows:
Thousands ofYear ending March 31 Millions of Yen U.S. Dollars
1999 ........................................ ¥13,406 $101,4842000 ........................................ 0 42,306 320,2572001 ........................................ 0 1,020 7,7212002 and thereafter .................. 30,604 231,673
............................................... ¥87,336 $661,135
As is customary in Japan, short-term and long-term bank loansare made under general agreements which provide that collat-eral and guarantees for present and future indebtedness will begiven upon request of the bank with reasonable and probablecause, and that the bank shall have the right to offset cash depos-ited with it against any obligation that has become due or, in theevent of default, against all obligations due to the bank. TheCompany has never been requested to give any additional col-lateral or guarantee.
22

Note 8: LeasesLease expenses in respect of finance leases, other than those leaseagreements which stipulate the transfer of ownership of the leasedproperty, were as follows:
Year ended March 31, 1998
Thousands ofClass of property Millions of Yen U.S. Dollars
Machinery and equipment ....... ¥05,889 $44,580Vehicles and tools .................... 11,908 90,144Others ..................................... 26 197
............................................... 17,823 134,921Less accumulated depreciation .... (6,887) (52,135)
Net ......................................... 10,936 82,786
Future minimum payments1999 ........................................ 2,921 22,1122000 and thereafter .................. 8,015 60,674
............................................... 10,936 82,786
Lease expenses ......................... 2,070 15,670Accumulated depreciation ....... 2,070 15,670
Note 9: Income TaxesThe Company and its domestic subsidiaries are subject to cor-porate income tax, enterprise tax and prefectural and municipalinhabitants taxes, based on income, which in the aggregate resultin a statutory tax rate of approximately 52 per cent. However,the effective tax rates in the accompanying statements of in-come differ from the above-mentioned income tax rate. Theprincipal reasons for such differences are (a) the accounting policyof not providing for deferred income taxes arising from timingdifferences between financial and tax reporting, and (b) certainexpenses which are not deductible for income taxpurposes.
Note 10: Contingent LiabilitiesContingent liabilities at March 31, 1997 and 1998 were as follows:
Thousands ofMillions of Yen U.S. Dollars
1997 1998 1998
Trade notes receivable discounted with banks ......... ¥00,456 ¥00,643 $004,868Guarantees of housingloans of employees andfor indebtedness ofconsolidated subsidiariesand affiliates ......................... 15,578 14,866 112,536
In addition, the Company retains an obligation in respect ofbonds of ¥20,000 million (US$151,400 thousand) which wereassumed by third parties on January 17, 1995 (See Note 5).
On January 17, 1995, the Company entered into debt as-sumption agreements with certain financial institutions for thefull redemption of the 6.9 per cent. bonds due 1999 and elimi-nated the bonds from liabilities.
Under these agreements the debt was assigned as follows:
Thousands ofAssignee Millions of Yen U.S. Dollars
The Sakura Bank–London Branch .................... ¥10,000 $075,700The Fuji Bank (Luxembourg) S.A. ................. 005,000 0037,850The Dai-Ichi Kangyo Bank–London Branch .................... 005,000 0037,850
............................................... ¥20,000 $151,400
The Company retains a legal obligation as the primary obli-gator on the issuance of the bonds and consequently, has a con-tingent liability of ¥20,000 million (US$151,400 thousand) untilthe final redemption is made.
Note 6: Accrued Severance Indemnities and Pension CostsThe charges to income for accrued severance indemnities andpension costs for the years ended March 31, 1997 and 1998were as follows:
Thousands ofMillions of Yen U.S. Dollars
1997 1998 1998
Accrued severanceindemnities .......................... ¥3,331 ¥3,729 $28,229Pension costs ........................ 1,512 1,621 12,271
Note 7: DepreciationDepreciation charges of property, plant and equipment for theyears ended March 31, 1997 and 1998 were as follows:
Thousands ofMillions of Yen U.S. Dollars
1997 1998 1998
Selling, general andadministrative expenses ........ ¥00,1,167 ¥01,296 $009,811Cost of sales ......................... 24,124 24,859 188,183Other ................................... 535 397 3,005
23

Note 11: Legal ReserveThe Commercial Code of Japan provides that an amount equalto at least 10 per cent. of cash dividends and other cash appro-priations of retained earnings be appropriated as a legal reserveuntil such reserve equals 25 per cent. of common stock. Thislegal reserve is not available for dividends, but may be used toreduce a deficit by resolution of stockholders or may be trans-ferred to capital stock by resolution of the Board of Directors.
Note 12: Retained Earnings and DividendsThe amount of retained earnings available for dividends underthe Commercial Code of Japan is based on the amount stated inthe statutory financial statements of the Company.
Dividends are approved by the shareholders at a meeting heldsubsequent to the fiscal year to which the dividend is applicable.In addition, a semi-annual interim dividend payment may bemade by a resolution of the Board of Directors subject to certainlimitations imposed by the Commercial Code.
Note 13: Subsequent EventOn June 26, 1998, the shareholders of the Company approvedthe following appropriations of retained earnings:
Thousands ofMillions of Yen U.S. Dollars
Appropriations:Cash dividends .................... ¥1,087 $8,229Bonuses to directors andstatutory auditors ................ 70 530
............................................... ¥1,157 $8,759
Note 14: Segment InformationThe Company and its consolidated subsidiaries are primarilyengaged in the manufacture and sale of automobiles, particularlydiesel trucks and buses.
Business segment information is not required to be disclosedas both sales and operating income of the automobile businessexceed 90 per cent. of total sales and of operating income of allsegments not incurring an operating loss.
Geographical segment information is not required to be dis-closed as sales outside Japan are less than 10 per cent. of consoli-dated net sales.
Year ended March 31, 1998
Thousands ofMillions of Yen U.S. Dollars
Overseas sales Asia Other areas Total Total
Overseas sales (A) ......... ¥53,844 ¥39,545 ¥093,389 $0,706,949Consolidated sales (B) ... — — ¥589,209 $4,460,318(A)/(B) ....................... 9.1% 6.7% 15.8%
Year ended March 31, 1997
Thousands ofMillions of Yen U.S. Dollars
Overseas sales Total Total
Overseas sales (A) ................................ ¥113,386 $0,913,666Consolidated sales (B) ............................ ¥632,716 $5,098,437(A)/(B) ................................................ 17.9%
24

To the Board of Directors ofHINO MOTORS, LTD.
We have examined the consolidated balance sheets of Hino Motors, Ltd. and its consolidated subsidiaries as ofMarch 31, 1997 and 1998 and the related consolidated statements of income, shareholders’ equity and cash flowsfor the years then ended, all expressed in Japanese yen. Our examinations were made in accordance with auditingstandards generally accepted in Japan and, accordingly, included such tests of the accounting records and suchother auditing procedures as we considered necessary in the circumstances.
In our opinion, the consolidated financial statements referred to above, expressed in Japanese yen, present fairlythe consolidated financial position of Hino Motors, Ltd. at March 31, 1997 and 1998 and the consolidated resultsof their operations and their cash flows for the years then ended, in conformity with accounting principlesgenerally accepted in Japan applied on a consistent basis.
The accompanying consolidated financial statements with respect to the year ended March 31, 1998 have beentranslated into U.S. dollars solely for the convenience of the reader. We have reviewed the translation and, in ouropinion, the consolidated financial statements expressed in Japanese yen have been translated into U.S. dollars onthe basis described in Note 1 to the consolidated financial statements.
Tokyo, Japan SHOWA OTA & CO.June 26, 1998 Certified Public Accountants
REPORT OF INDEPENDENT CERTIFIED PUBLIC ACCOUNTANTS
25

ChairmanToshimi Onishi
PresidentHiroshi Yuasa
Executive Vice-PresidentsToshiki AmanoMasashi Shigemori
Senior Managing DirectorsYoshio YoshizawaMasahiro IshikawaMasamichi YoshimizuShohei KakizoeKazuhiko ChibaTadayoshi Nakane
Managing DirectorsShinichi FunakuboTadashi ShimizuIsao JokoYoshitaka NakamuraHideaki TobitaTakayuki SuzukiHisanobu Fujita
DirectorsAkihiro WadaKunihiko KanekoHiromitsu TanakaYutaka KobayashiTsuyoshi OhsumiNorimitsu MiyazawaKijiro OnishiMasataka MatsukataMasaharu ItoMasaharu ShibataHisaaki UgaMasayoshi HaraMitsuo KikuchiHiroyoshi KakoBunji HagiwaraTaro Yoshimura
Standing AuditorsKazuyoshi OhsakiKazuo UesugiKazuo Kadokura
AuditorsYoshinori UeyamaFujio Cho
Toshimi Onishi Hiroshi Yuasa
Toshiki Amano
Yoshio Yoshizawa
Masashi Shigemori
Masahiro Ishikawa Masamichi Yoshimizu
Chairman President
DIRECTORS AND AUDITORS
Shohei Kakizoe
Executive Vice-Presidents
Senior Managing Directors
Kazuhiko Chiba Tadayoshi Nakane
26

DOMESTIC OFFICES AND PLANTS
Head Office & Hino Plant:
1-1, Hinodai 3-chome, Hino-shi, Tokyo
191-8660
Nihonbashi Office (Overseas Business):
7-17, Nihonbashi 1-chome, Chuo-ku, Tokyo
103-8256
Tamachi Office
(Engines and Components Business):
11-1, Shiba 4-chome, Minato-ku, Tokyo
108-0014
Hamura Plant:
1-1, Midorigaoka 3-chome, Hamura-shi,
Tokyo 205-8660
Nitta Plant:
10-1, Hayakawa, Nitta-machi,
Nitta-gun, Gunma 370-0344
OVERSEAS AFFILIATES AND OFFICE
Thailand
THAI HINO INDUSTRY CO., LTD.
99 Moo3, Teparak Road, Tambol Teparak,
Amphur Muang, Samutprakarn 10270
THAI HINO MOTOR SALES, LTD.
No. 45/13 Vibhavadi Ragsit Road, Laksi,
Donmuang, Bangkok 10210
The Philippines
PILIPINAS HINO INC.
E. de los Santos Avenue Corner Madison
Street, Mandaluyong, Metro Manila
The United States of America
HINO DIESEL TRUCKS (U.S.A.), INC.
■ 25 Corporate Drive, Orangeburg, N.Y.
10962
■ 1802 Kettering Street, Irvine, California
92714
HINO ENGINE SERVICE (U.S.A.)
CORPORATION
25 Corporate Drive, Orangeburg,
N.Y. 10962
Canada
HINO DIESEL TRUCKS (CANADA) LTD.
7040 Davand Drive, Mississauga, Ontario L5T
1J5
PARTS DEPOTS
The United States of America
HINO MOTORS INTERNATIONAL
(U.S.A.), INC.
451B North Cota Street, Corona, California
91720
Belgium
HINO MOTORS (EUROPE) N.V.
Blarenberglaan 2800 Mechelen
For further information, please contact
Public Relations Division
7-17, Nihonbashi 1-chome, Chuo-ku,
Tokyo 103-8256, Japan
Telephone: 3-3272-1891
Facsimile: 3-3272-4822
Asia, Oceaniaand the Middle East
Europe and Africa The Americas
HINO’S INTERNATIONAL NETWORK
Malaysia
HINO MOTORS (MALAYSIA) SDN. BHD.
Lot P.T. 24, Jalan 223, Section 51A, Petaling
Jaya, Selangor
Indonesia
P.T. HINO INDONESIA
MANUFACTURING
Jl. Raya Bekasi Km18 Kawasan, Industri
Pulogadung, Jakarta Timur
Vietnam
HINO MOTORS VIETNAM, LTD.
Hoang Liet Hamlet, Thanh Tri District, Hanoi
Taiwan
KUOZUI MOTORS, LTD.
12F, No. 121, Sung Chiang Road,
Taipei
HO-TAI MOTOR CO., LTD.
13F, No. 121, Sung Chiang Road,
Taipei
China
LONG RI BUS CORPORATION
No. 70 Cheng Xiang Road Daoli Dist, Harbin
BEIJING OFFICE
Room No.1017 Beijing Fortune Building,
Beijing
Pakistan
HINOPAK MOTORS LIMITED
D-2, S.I.T.E. Manghopir Road, Karachi 75700
P.O. Box 10714
Australia
HINO MOTOR SALES AUSTRALIA PTY
LTD
2-10 Parraweena Road, Taren Point, NSW
2229
● Sales outlets ▲ Parts depots ■ Production plants
27

Number of Shares:Authorized: 1,000,000,000Outstanding: 362,391,898
Paid-in Capital: ¥26,412 million
Number of Shareholders: 12,091
Major Shareholders (Unit: Thousand shares)
Name Number of shares
Toyota Motor Corporation ..................................... 72,764Nippon Life Insurance Company ........................... 19,079Asahi Mutual Life Insurance Company ................. 18,648The Sakura Bank, Ltd. ........................................... 13,319The Fuji Bank, Ltd. ................................................ 11,606The Dai-Ichi Kangyo Bank, Ltd. ........................... 11,547The Mitsui Trust and Banking Co., Ltd. ................ 10,277The Tokio Marine and Fire Insurance Co., Ltd. ....... 6,800The Asahi Bank, Ltd. ............................................... 5,761The Sumitomo Trust & Banking Co., Ltd. ............... 5,722
CORPORATE DATA
Breakdown by Shareholder Category(Unit: Thousand shares)
Hino Motors’ Stock Price on the Tokyo Stock Exchange(Unit: Yen) (Face value: ¥50)
Private Individuals andOthers 26,453 7.3%
Securities Companies379 0.1%
Banks and OtherFinancial Institutions175,363 48.7%
Other DomesticCorporations138,264 38.4%
Foreigners 19,880 5.5%
300
400
200
500
600
700
800
41997
5 6 7 8 9 10 11 12 11998
2 3
681
748
736
799
729
787
628
718
500
622
485
563
411
500
335
447
267
415
269
440
345
429
391
467
28

Printed in Japan/Code No.2022-E0 '98-7-2,600(LP)
1-1, Hinodai 3-chome, Hino-shi, Tokyo 191-8660