homeowner energy source preference survey
DESCRIPTION
Homeowner Energy Source Preference Survey. Tampa Technology & Market Assessment Forum February 24, 2011. A True Marketing Story…. Newspaper Billboards Radio New Home Guides Weekend Directionals Flyers Events Realtor Deliveries/Programs Hot Dogs. Traditional Sources. Non-Traditional…. - PowerPoint PPT PresentationTRANSCRIPT

Homeowner Energy Source Preference Survey
Tampa Technology & Market Assessment Forum
February 24, 2011

A True Marketing Story…

Traditional Sources
Newspaper
Billboards
RadioNew Home Guides
Weekend Directionals
Flyers
EventsRealtor Deliveries/Programs
Hot Dogs


Non-Traditional…

Indy Racing League

Indy Racing League

As if we didn’t learn enough, we did it again …as a “secondary” sponsor

As if we didn’t learn enough, we did it again …as a “secondary” sponsor

A New Strategy…..
…..focus customers’ preferences, needs and feelings through an effective “Voice of the Customer” program.
Investing in customer research is actually investing in oneself.
.. i.e. ESC Customer Preference Survey…
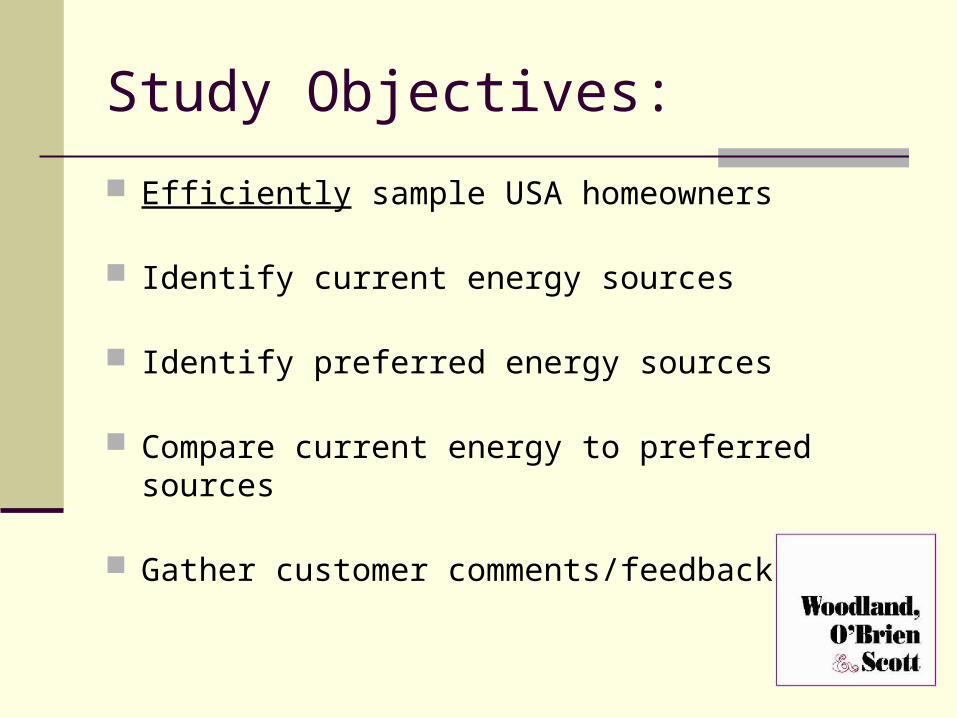
Study Objectives:
Efficiently sample USA homeowners
Identify current energy sources
Identify preferred energy sources
Compare current energy to preferred sources
Gather customer comments/feedback
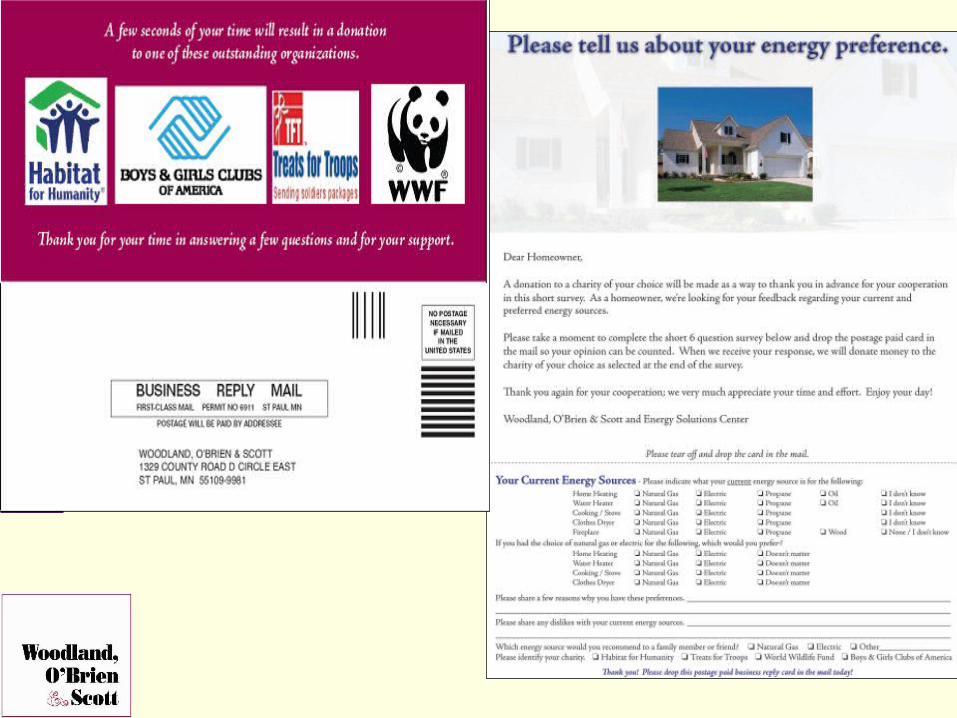
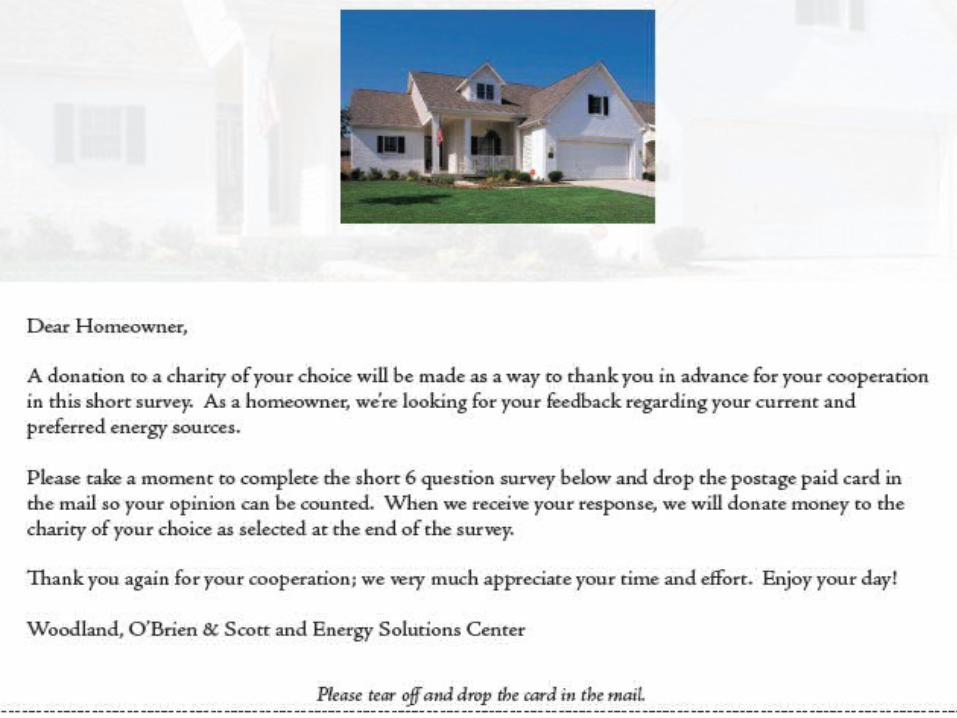
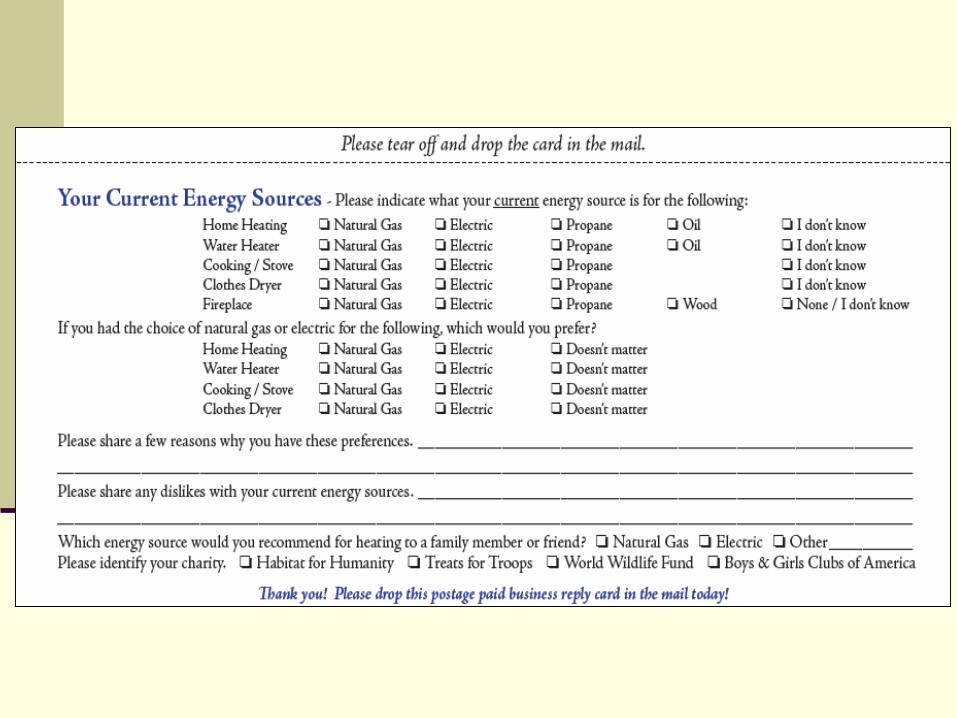

The Survey Process
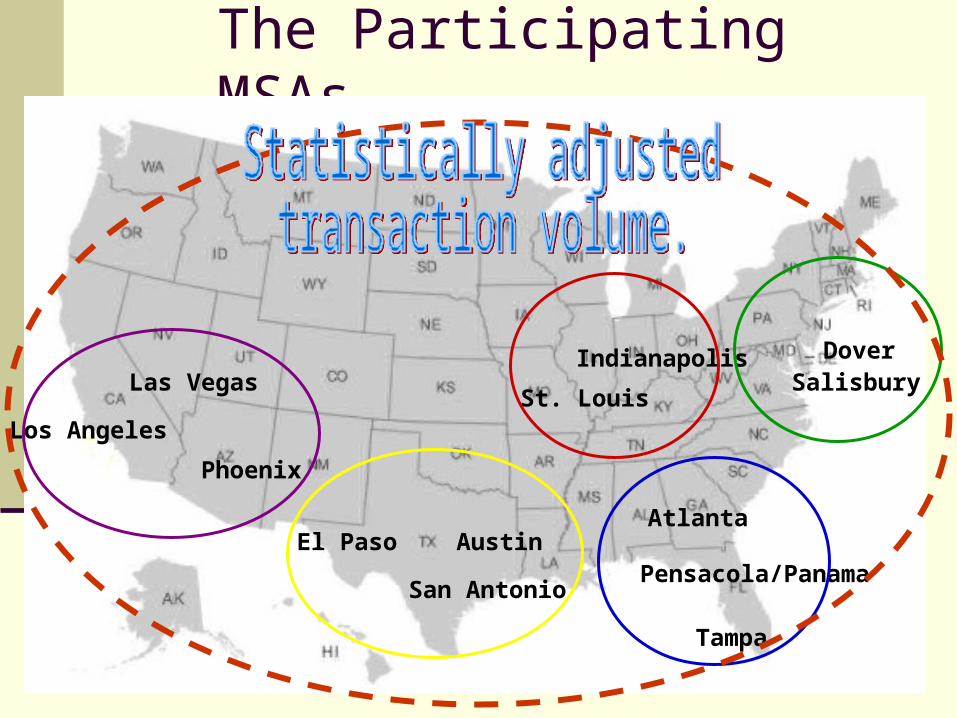
Selected 13 Metropolitan Statistical Areas (MSA) - based upon sponsoring participants.
Identified a consistent 12 month closing period* of selected “new” homeowners.
Adjusted each MSA home price range to sample 66% of the MSA transactions - (75% nationally).
Mailed 26,940 surveys to the 13 MSA (625 – 3,500) on December 10, 2010.
Anticipated a response rate of 2-3%. Achieved a 2.6% response rate (700 responses).
Completed statistical studies February 10, 2011.

The Participating MSAs
St. Louis
IndianapolisSalisburyLas Vegas
Dover
Tampa
AustinPensacola/Panama
San Antonio
AtlantaEl Paso
Los Angeles
Phoenix

The Participating MSAs
St. Louis
IndianapolisSalisburyLas Vegas
Dover
Tampa
AustinPensacola/Panama
San Antonio
AtlantaEl Paso
Los Angeles
Phoenix


Insert disclaimer here………

Insert disclaimer here………
All observations and recommendations are presented without the benefit of significant knowledge of ESC Member operations. Therefore, these results are unencumbered by any internal prejudices within those operations.

National Study Results

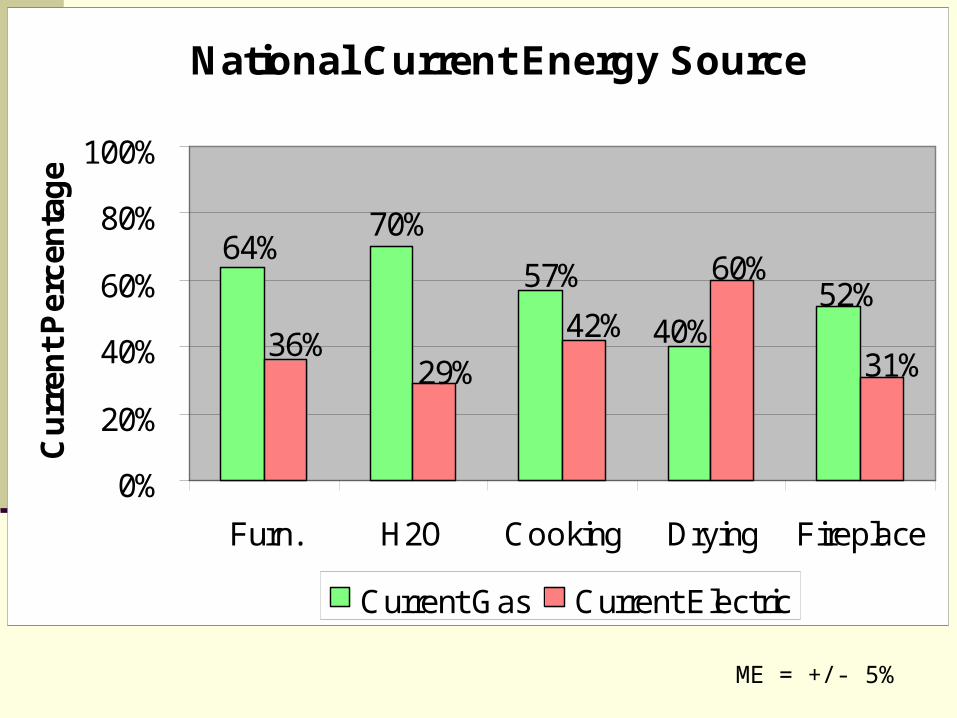
National Current Energy Source
64%70%
57%
40%52%
36%42%
29%
60%
31%
0%
20%
40%
60%
80%
100%
Furn. H2O Cooking Drying Fireplace
Cu
rren
t P
erce
nta
ge
Current Gas Current Electric
ME = +/- 5%
National Current Energy Source
64%70%
57%
40%52%
36%42%
29%
60%
31%
0%
20%
40%
60%
80%
100%
Furn. H2O Cooking Drying Fireplace
Cu
rren
t P
erce
nta
ge
Current Gas Current Electric
ME = +/- 5%
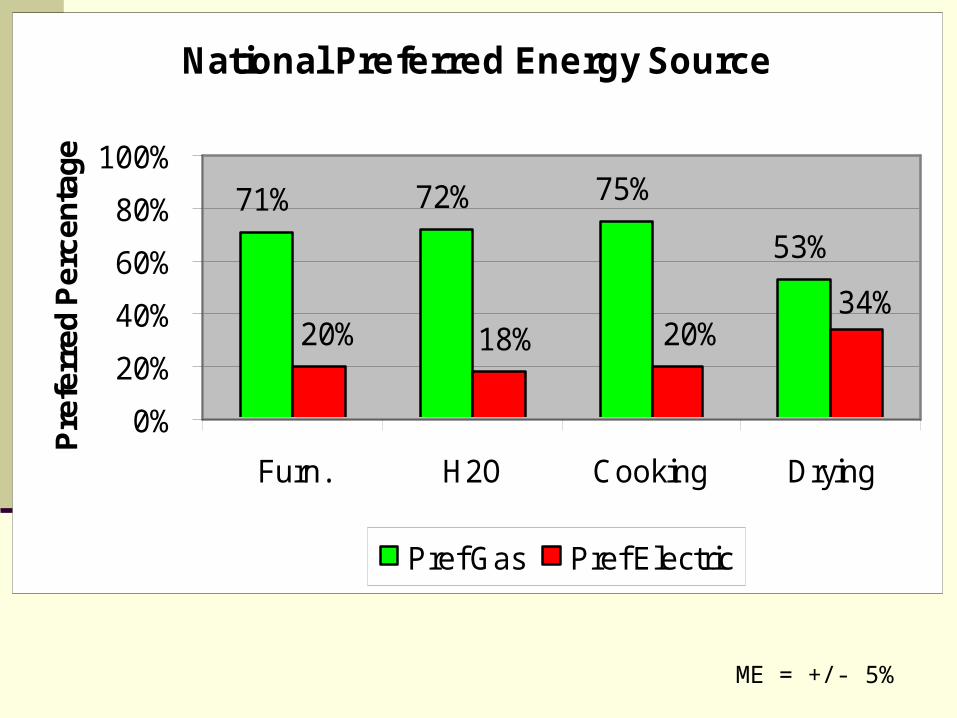
National Preferred Energy Source
71% 72% 75%
53%
34%20%18%20%
0%
20%
40%
60%
80%
100%
Furn. H2O Cooking Drying
Pre
ferr
ed P
erce
ntag
e
Pref Gas Pref Electric
ME = +/- 5%

National Current Energy Source vs. Preferred
64% 70%57%
40%
71% 72% 75%
53%36% 42%
60%
29%20% 20%
34%18%
0%
20%
40%
60%
80%
100%
Furn. H2O Cooking Drying
Per
cen
tag
e
Current Gas Pref Gas Current Electric Pref Electric
ME = +/- 5%

“Experienced” user responses -
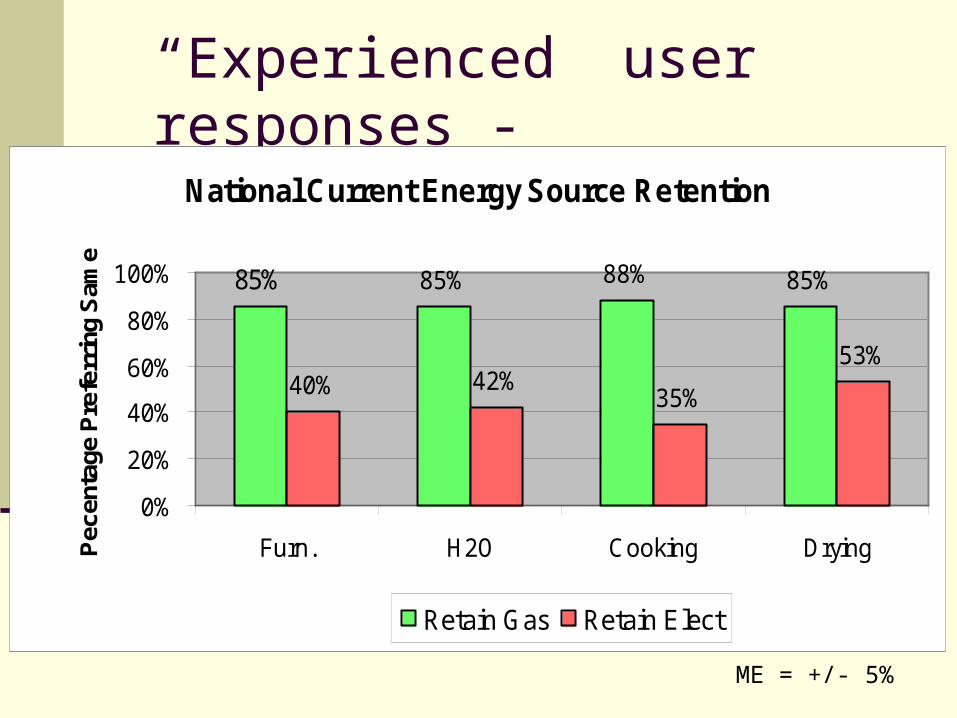
“Experienced” user responses -
National Current Energy Source Retention
85% 88% 85%
40% 42%35%
53%
85%
0%
20%
40%
60%
80%
100%
Furn. H2O Cooking DryingPec
enta
ge P
refe
rrin
g S
ame
Retain Gas Retain Elect
ME = +/- 5%

Total Gas vs. Total Electric Preference
National 1+ Gas Appliance vs. All Gas vs. All Electric
5%
24%
82%
45%
12%
74%
0%
20%
40%
60%
80%
100%
1+ Gas Appl All Gas All ElectricPerc
enta
ge o
f Res
pond
ents
ME = +/- 5%
Current Preferred All Gas All Gas
Current Preferred All Elect All Elect
Homes Preferred1+ Gas 1+ Gas
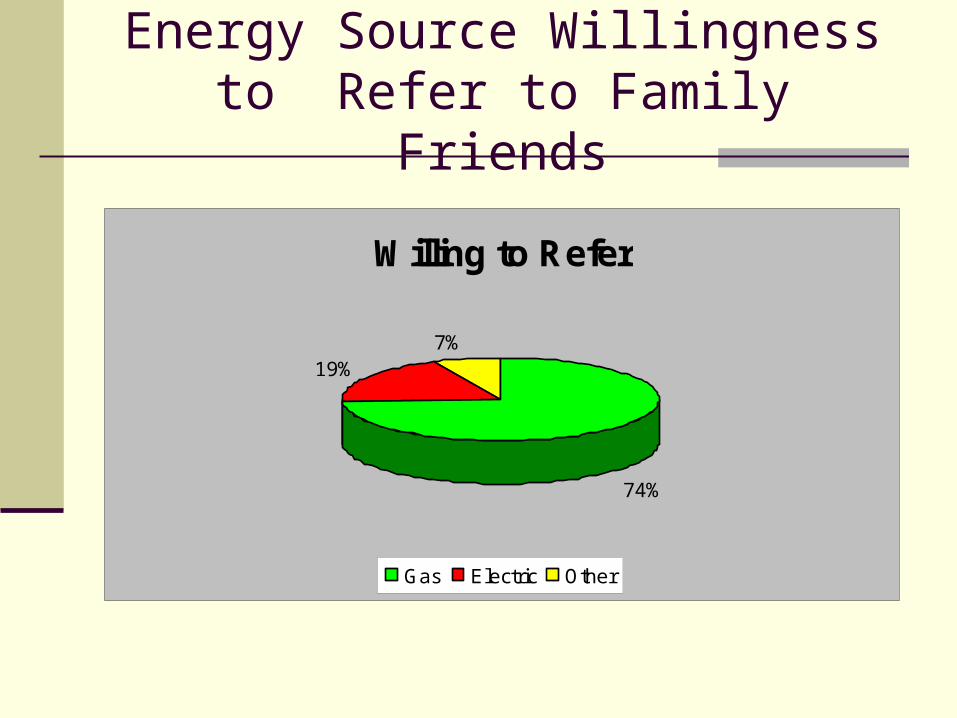
Energy Source Willingness to Refer to Family Friends
Willing to Refer
74%
7%19%
Gas Electric Other

National “Big Picture” Findings -
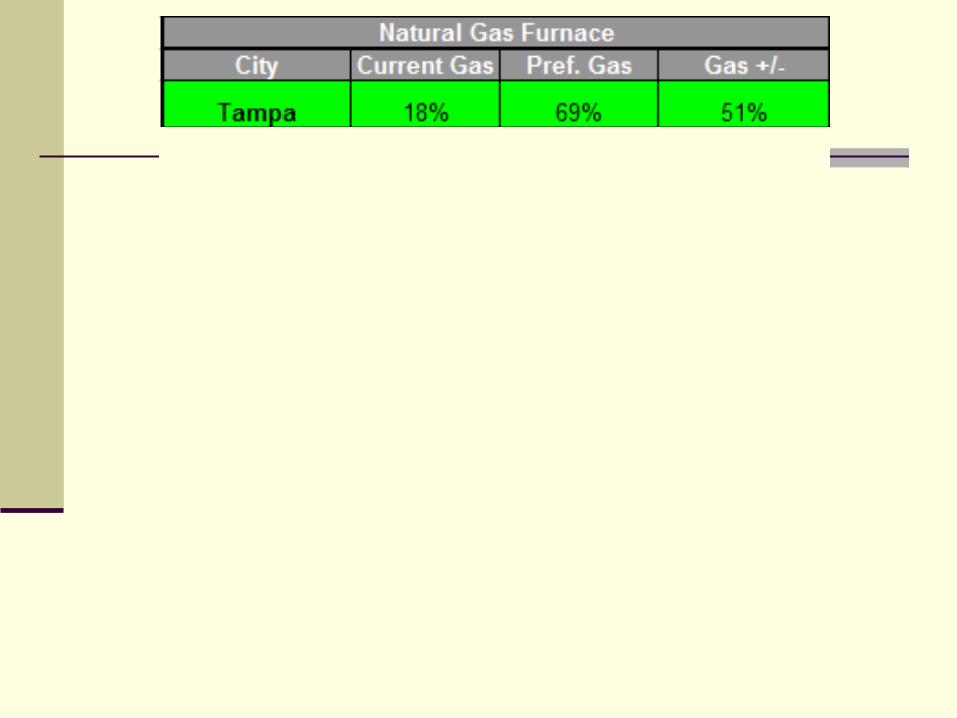
Natural gas is the predominate home heating source for furnace, water heater and cooking.
Electric is the predominate cooking energy. Natural gas is preferred more than currently utilized. Electric is less preferred than currently utilized. The preference for all-natural gas homes is 800% higher than
currently served (5% vs. 45%). Half the all-electric homeowners would prefer not to have an all-
electric home (24% vs. 12%). 57% of US homes have fireplaces and approximately half of
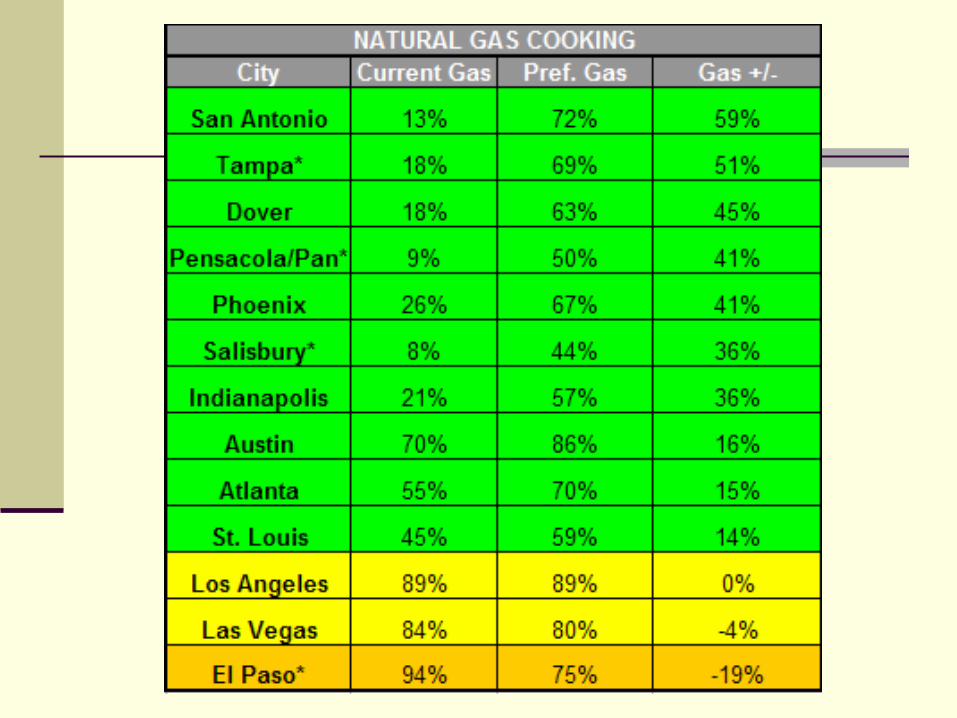
those are natural gas. There appear to be substantial opportunities in some markets to
increase specific gas appliances. Customer comments have significant marketing potential.

On the flipside of the electric cooking mirror…

On the flipside of the electric cooking mirror…

Survey reply comment sample….

Indy Gas:

Website Demo:
www.woodlandobrien.com

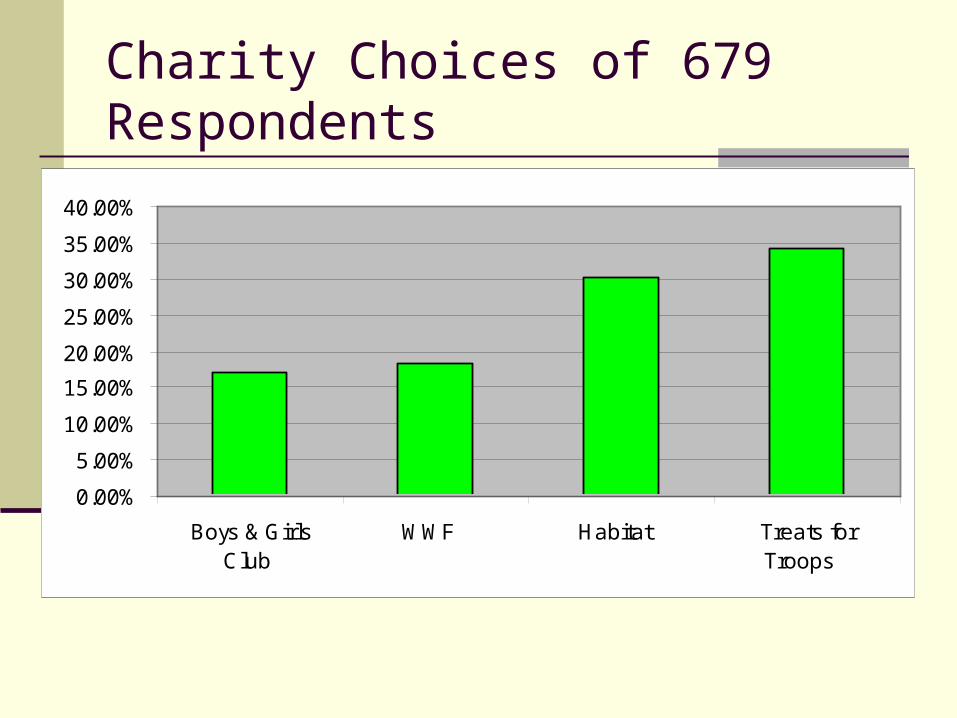
Charity Choices of 679 Respondents
Charity Choices of 679 Respondents
0.00%
5.00%
10.00%
15.00%
20.00%
25.00%
30.00%
35.00%
40.00%
Boys & GirlsClub
WWF Habitat Treats forTroops

Homeowner Energy Source Preference Survey
Tampa Technology & Market Assessment Forum
February 24, 2011