how to include hedge funds in a risk allocation framework
TRANSCRIPT
EDHEC RISK AND ASSETMANAGEMENT RESEARCH CENTRE
393-400 promenade des Anglais06202 Nice Cedex 3Tel.: +33 (0)4 93 18 32 53E-mail: [email protected]: www.edhec-risk.com
How to Include Hedge Funds in a Risk Allocation Framework
August 2006
Hilary TillPrincipal, Premia Capital Management, LLC Research Associate with the EDHEC Risk and Asset Management Research Centre

2
Author’s Note: This article originally appeared as a two-part series in the GARP Risk Review, the Journal of the Global Association of Risk Professionals, in the journal’s September/October and November/December 2002 issues, http://www.garp.com.
EDHEC is one of the top five business schools in France owing to the high quality of its academic staff (104 permanent lecturers from France and abroad) and its privileged relationship with professionals that the school has been developing since its establishment in 1906. EDHEC Business School has decided to draw on its extensive knowledge of the professional environment and has therefore concentrated its research on themes that satisfy the needs of professionals. EDHEC pursues an active research policy in the field of finance. Its “Risk and Asset Management Research Centre” carries out numerous research programs in the areas of asset allocation and risk management in both the traditional and alternative investment universes.
Copyright © 2006 EDHEC
This article will discuss the innovative ways in which academics and practitioners are enhancing asset allocation methodologies in order to incorporate hedge funds. It will begin by discussing the current practice in asset allocation work, followed by noting what unique problems occur when applying this methodology to hedge funds. Finally it will discuss a number of leading edge solutions to these problems. The article will also include anecdotes from anonymous hedge fund managers and traders, which illustrate some of the academic points made in the article.
Standard Asset Allocation PracticeA typical investment program’s asset allocation process consists of maximizing the return of a portfolio of assets subject to minimizing some risk criterion.
As behavioral finance academics have noted, this quantitative process was developed to overcome certain limitations of human decision-making. When faced with large problems, the brain breaks down big problems into little problems and then solves each little problem sequentially. The problem with this method of problem solving is that it ignores the interrelationships between each boxed-off little problem. A quantitative asset allocation process, which takes into consideration the correlations amongst individual investments, will not suffer from this limitation. The process should result in an optimal solution across all possible combinations of investments, something that conventional human decision-making would be incapable of.
Risk Allocation FrameworkThe type of process noted above is typically used in deciding how to allocate among assets. One cannot immediately use such a framework with hedge funds because they are not an asset class. Instead, hedge funds consist of a variety of strategies, risks, and exposures.
As a result, Wander and Bein (2002) recommend using a “risk allocation framework,” which focuses on risk exposures instead of asset classes. Hedge funds can then be readily included in this framework by modeling their underlying risk exposures.
The risk allocation framework consists of the following three steps. For the universe of potential investments: 1. Identify Risk Exposures 2. Optimize Risk Allocation 3. Implement Investment Strategy
Although this process sounds clear enough, once one digs into the necessary assumptions involved in each step, one realizes how complicated this process is. As Weisman and Birney (2002) noted, such instructions are like explaining how to play a flute by saying, “Blow in this end and adjust the pitch by pressing on these buttons.”
Identify Risk (or Factor) ExposuresLinear Multi-Factor ModelAs discussed in Till (July 2002), to reverse engineer hedge fund exposures, a good starting point is to use a classic linear, multi-factor model. These models were originally created to understand the fundamental drivers of mutual fund returns. Edwards and Caglayan (2001) use the following multi-factor model to characterize the fundamental risk exposures of hedge funds: • R(i) – Rf = alpha + b*(S&P500 – Rf) + h*HML + s*SMB + w*WML + g*TERM + k*DEF + e(i), where: • R(i) is the monthly return of hedge fund i; • R(f) is the 30-day T-bill rate; • HML is the monthly return on a portfolio of high book-to-market stocks minus the monthly return on a portfolio of low book-to-value stocks; • SMB is the monthly return on a portfolio of small stocks minus the monthly return on a portfolio of large stocks;
3
4
• WML is the monthly return on a portfolio of past year’s winners minus the monthly return on a stock portfolio of past year’s losers; • TERM is the monthly return on a long-term government bond portfolio minus the one-month-lagged 30-day Treasury bill return; • DEF is the monthly return on a portfolio of long-term corporate bonds minus the monthly return on a portfolio of long-term government bonds; and • e(i) is the remaining residual return.
The advantage of such a model is if its explanatory power is high enough, one can decide whether the underlying exposures of a hedge fund or a hedge fund style are appropriate additions to an investor’s overall stock-and-bond portfolio.
DifficultiesThere are several problems with the approach noted above. As pointed out by Brealey and Kaplanis (2001), hedge funds generally do not have stable exposures to market factors.
Unstable Factor ExposuresFung and Hsieh (1997) provide a dramatic example of the difficulty in identifying stable factor exposures for hedge funds. They cite the example of George Soros’s Quantum Fund. As was well publicized, the Quantum Fund made 25.5% in September 1992 by shorting the British pound. Using monthly returns, the relationship between the Quantum Fund and the British pound only has an R-squared of 23%. Using daily returns in September 1992, the R-squared is only 10%. (Quantum’s bet on the British Pound appears to have been implemented over a brief, eleven-day timeframe in September 1992.)
Given that simple statistical procedures would not have been able to pick up the relationship between Soros’ returns and the British Pound, the number of market proxies needed to model dynamic trading strategies may be “virtually infinite,” note the authors.
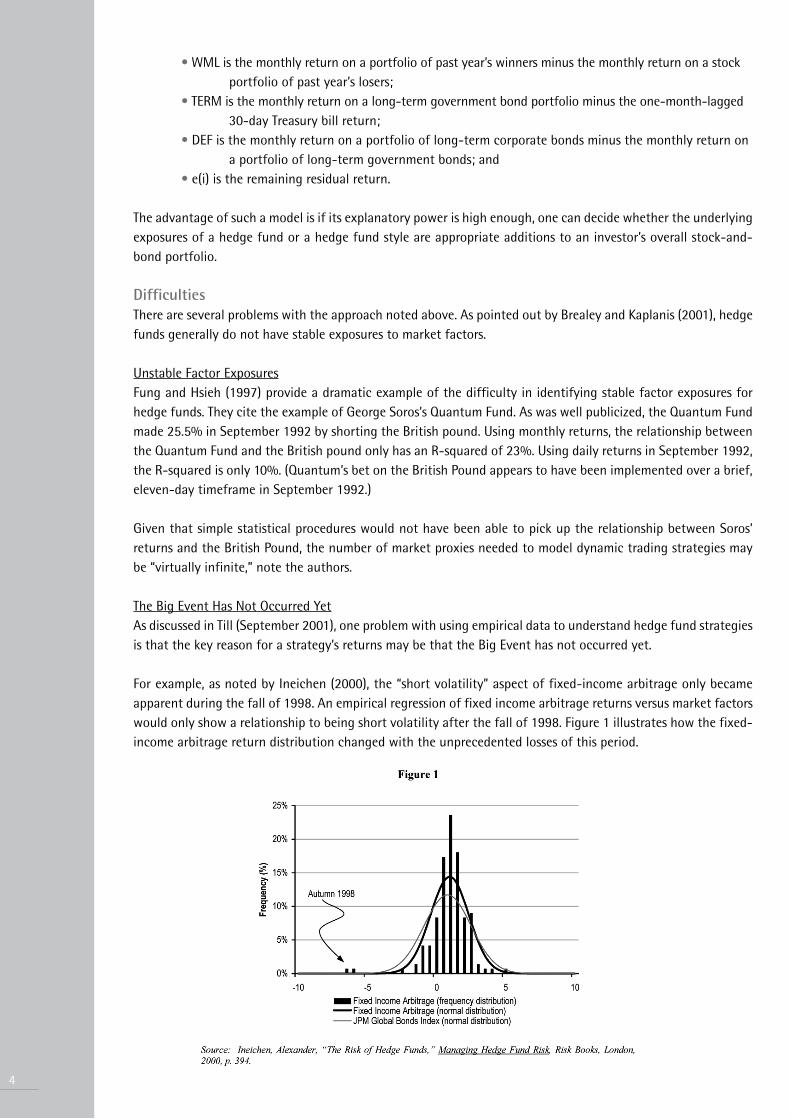
The Big Event Has Not Occurred YetAs discussed in Till (September 2001), one problem with using empirical data to understand hedge fund strategies is that the key reason for a strategy’s returns may be that the Big Event has not occurred yet.
For example, as noted by Ineichen (2000), the “short volatility” aspect of fixed-income arbitrage only became apparent during the fall of 1998. An empirical regression of fixed income arbitrage returns versus market factors would only show a relationship to being short volatility after the fall of 1998. Figure 1 illustrates how the fixed-income arbitrage return distribution changed with the unprecedented losses of this period.

Another example concerns investing in emerging market currencies. The Sharpe ratio for investing in Thai bhat deposits that were funded by US dollar denominated loans was 2.55 over the period 1980 to 1996, according to data in Shimko and Reider (1997). Given the unexpected, dramatic devaluation of the bhat in 1997, it appears that an investor was earning a well-deserved risk premium for taking on this investment.
SolutionsThe suggested solutions to the above problems are two-fold. One is to use non-linear modelsto try to capture dynamically changing risk exposures. The other solution is to attempt tounderstand the economic drivers of returns so that one is prepared for the type of losses thatcould result from the strategy, even if those losses have not occurred yet.
Non-Linear ModelsIt appears that a number of hedge fund styles have returns that have non-linear relationships to fundamental risk factors. This can be because these investments explicitly use derivatives or because their dynamic trading strategies result in option-like return profiles.
This section will cover six innovative approaches that researchers have applied recently in attempting to best model hedge fund returns.
1. Non-Linear Regression: Example: Equity Non-Hedge StrategyFavre and Galeano (2002) recommend using non-linear regressions to estimate the relationship between a hedge fund strategy and a portfolio of traditional assets. For example, they find that the equity non-hedge strategy appears to be equivalent to a long position in a traditional portfolio combined with long out-of-the-money calls and short out-of-the-money puts. For their purposes, the portfolio of traditional assets is represented by an equity -and bond benchmark of interest to Swiss institutions, the LPP Pictet Index.
2. Performance During Different Market Environments: Example: Global MacroFung and Hsieh (1997) suggest focusing on extreme events to detect non-linear correlations between hedge fund strategies and risk factors. Figure 2 illustrates how the global macro style behaves like a straddle on the U.S. dollar. (A straddle is the combination of being long a call option and long a put option.)
In a later article, Fung and Hsieh (1999) also graph the global macro style versus five equity market environments. They find that the global macro style is positively correlated with stocks:
“However, it underperforms equities in up markets and outperforms equities indown markets, behaving as if it owned collars (short calls and long puts) on US equities.”
5
6
Anecdotally, one of the largest surviving global macro funds has a consistent, structural view on investing: this fund, if it has a position, will always be long the dollar, long the stock market, and long Eurodollars. Further, the fund has a rigid risk management policy: if any of these positions starts losing money, the position will be periodically scaled back until they have no position in the losing market. This dynamic trading strategy could produce payoff diagrams of the type that Fung and Hsieh have noted in their research.
3. Rule-Based Strategies: Example: Commodity Trading AdvisorsFung and Hsieh (2001) have proposed an additional way of dealing with the dynamic aspect of some hedge fund strategies when modeling fundamental exposures. They have proposed searching for rule-based strategies that can be implemented systematically and passively, which mirror a dynamic trading strategy’s returns.
They used this approach in modeling the returns of trend-following Commodity Trading Advisors (CTAs.) In this case, they found high explanatory power in modeling the return profile of CTAs as equivalent to look-back straddles on currencies, commodities, and fixed income. In this way, they were able to capture the non-linear, option-like return of profile of CTAs better than buy-and-hold benchmarks.
4. Non-parametric, Non-linear Optimization: Example: Mortgage-Backed SecuritiesAs discussed in Till (October 2001), Weisman and Abernathy (2000) have published an innovative practitioner approach to reverse engineering hedge fund risk exposures. Based on a qualitative review of an individual hedge fund, the authors decide which assets and option types that the investment likely has an exposure to. They then use an optimization technique that fits an individual hedge fund’s returns to these exposures. The particular non parametric, non-linear optimization technique they choose is based on their experience of which characteristics are most important in evaluating a manager. They try to capture the manager’s large winning and losing months, the manager’s use of leverage, and the inflection points of the manager’s returns.
One of their examples emphasizes the utility of such an approach. The authors describe a mortgage-backed securities manager who had a historical Sharpe ratio of 4.99 using performance data from July 1995 to August 1998. (A Sharpe ratio of greater than 1.0 is considered quite good.) A decomposition of the type of exposures in such a portfolio reveals that the pattern of reported returns could also have been achieved with substantial leverage and short option exposure. And indeed, after August 1998, this manager reported a very large loss.
This approach is helpful as a forensic tool in determining the implicit short options risk of a manager, especially if one only has a short track record to analyze.
5. Volatility Timing: Example: Equity Market NeutralBusse (1999) finds that volatility timing is an important factor in the returns of mutual funds and has led to higher risk-adjusted returns. The idea is that it may be quite difficult to time market returns, but that on the other hand, market volatility is predictable because it persists. The author finds evidence that some mutual funds change their market exposure when market volatility changes.
Anecdotally, some superior equity market neutral funds may be achieving their superior riskadjusted returns by going into cash or reducing their market exposure during times of market volatility. Such a strategy would likely lead to lower returns on average, but even lower volatility on average than a market index. According to Ineichen (2000), citing Hedge Fund Research (HFR) indices, the equity market neutral strategy had 62% percent of the returns of the S&P 500, but only 23% of the volatility of the S&P 500.
One should add, though, that the claim that the fundamental strategy, which underlies the equity market neutral style, is volatility timing is highly speculative. Instead, one should say that it is likely that at least some funds in the equity market neutral universe employ this technique.
6. Stepwise Regression Including Options: Example: Arbitrage StrategiesA number of arbitrage strategies have been characterized as implicitly including short options.
For example, as discussed in Till (September 2001), in the merger arbitrage strategy, a merger candidate is bought by a hedge fund at a discount to where its intended buyer has announced it will pay for the company. An investor assumes the risk that a merger deal will fail. This strategy tends to earn consistent returns but sustains very large losses in the event that a deal does not get consummated.
A historical analysis of merger arbitrage deals conducted by Mitchell and Pulvino (2001) shows that this strategy’s return is correlated to the overall market during severe market downturns, giving a return profile similar to short index put options.
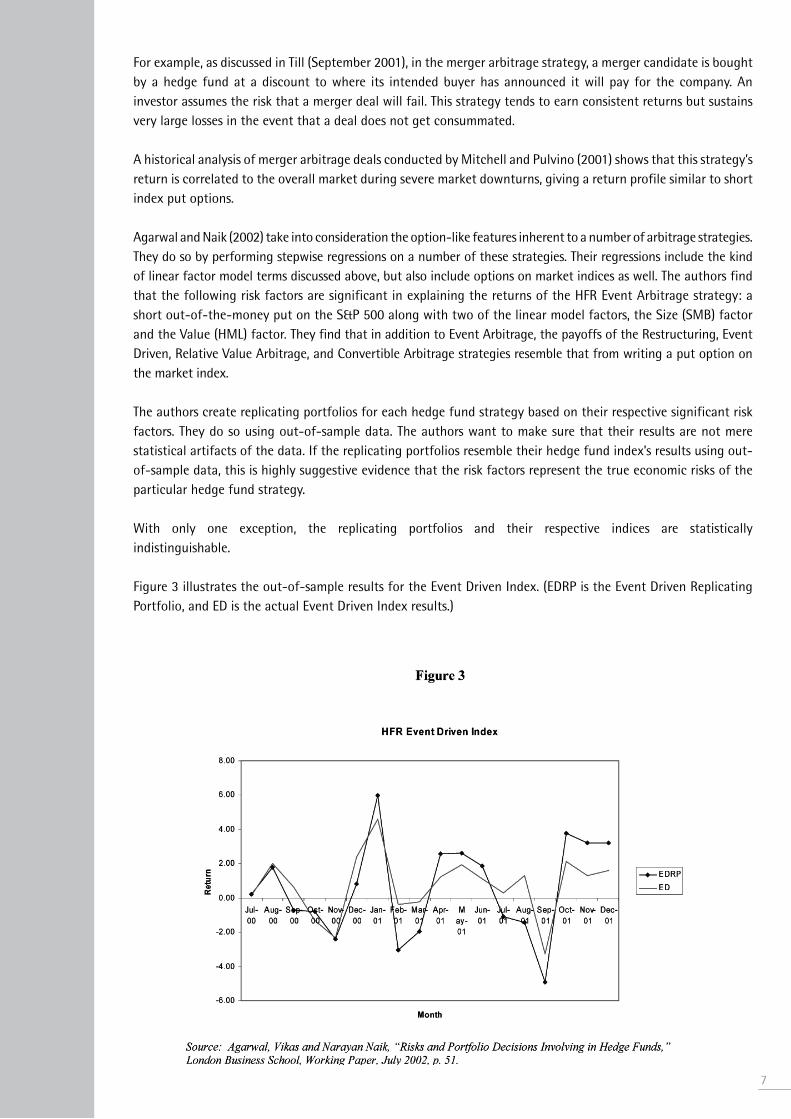
Agarwal and Naik (2002) take into consideration the option-like features inherent to a number of arbitrage strategies. They do so by performing stepwise regressions on a number of these strategies. Their regressions include the kind of linear factor model terms discussed above, but also include options on market indices as well. The authors find that the following risk factors are significant in explaining the returns of the HFR Event Arbitrage strategy: a short out-of-the-money put on the S&P 500 along with two of the linear model factors, the Size (SMB) factor and the Value (HML) factor. They find that in addition to Event Arbitrage, the payoffs of the Restructuring, Event Driven, Relative Value Arbitrage, and Convertible Arbitrage strategies resemble that from writing a put option on the market index.
The authors create replicating portfolios for each hedge fund strategy based on their respective significant risk factors. They do so using out-of-sample data. The authors want to make sure that their results are not mere statistical artifacts of the data. If the replicating portfolios resemble their hedge fund index’s results using out-of-sample data, this is highly suggestive evidence that the risk factors represent the true economic risks of the particular hedge fund strategy.
With only one exception, the replicating portfolios and their respective indices are statistically indistinguishable.
Figure 3 illustrates the out-of-sample results for the Event Driven Index. (EDRP is the Event Driven Replicating Portfolio, and ED is the actual Event Driven Index results.)
7

8
The authors go one step further. They look into whether the superior performance of arbitrage strategies is unique to the decade of the 1990s. There has not been an obvious way to determine this since the return history of hedge funds only goes back to 1990.
If the authors’ replicating portfolios, which are constructed using buy-and-hold and option based risk factors, are accurate models for describing the returns of arbitrage strategies, one can use the replicating portfolios as proxies for the strategies and therefore look into past to see how these strategies would have performed.
The authors examine the period from 1927 to 1989 to find the long-run returns and volatility of the hedge funds’ replicating portfolios. In the main, they find that the long-run returns of the replicating portfolios are smaller, and the long-run volatilities are higher compared to their performance in the 1990s. Their conclusion is that the performance of the arbitrage strategies “during the recent period appears significantly better compared with their long-run performance.”
Underlying Economic DriversAnother innovative way of identifying risk exposures is discussed by Singer, Staub, and Terhaar (2003). They discuss how alternative investment return data are problematic at best. The data “suffer from illiquidity and infrequent pricing biases … [and] also are fraught with membership and survivorship biases.”
The authors attempt to reconcile quantitative and qualitative techniques, given the problems with using historical data.
Their recommended solution is to use a factor approach to build a consistent set of return and risk characteristics for conventional and alternative asset classes alike.
Their chosen factors attempt to reflect the underlying economic exposures of the assets and strategies. They choose twelve primary factors to capture the systematic risk characteristics of both alternative and conventional assets. Each investment, including hedge funds, is represented by some combination of these systematic risk factors plus a risk premium, reflecting the investment’s level of market segmentation and illiquidity.
Optimize Risk AllocationIf one is satisfied with having identified the risk exposures for hedge funds, perhaps by using either an empirical, non-linear model or a theoretical, economic-driver approach, then the next step in the risk allocation framework is to optimize this risk allocation. Unfortunately even this step is tricky. The exact returns, risks, and correlations to use in modeling the universe of investments, including hedge funds, are not obvious. Also, there is even healthy debate about how to characterize the appropriate return-to-risk trade-off for investors.
ReturnsSinger, Staub, and Terhaar (2003) stress that as with conventional assets, the returns one assumes in coming up with a policy portfolio should be forward looking. Recent work by Argarwal and Naik ([2002) shows that it may be the case that the impressive 1990s results for at least some hedge fund strategies are unique.
RisksPenalty FunctionKoh, Lee, and Fai (2002) recommend including a penalty function to adjust returns downwards to account for the additional business risks associated with hedge fund investing. The authors recommend including the following sources of risk in computing the penalty function: style purity, asset growth, leverage, liquidity, and asset concentration.VolatilityThe common risk measure applied in portfolio optimizations is volatility. An issue with using historical data to determine volatility is that a number of hedge fund strategies include illiquid securities, so that there can be a problem with stale pricing, as discussed by Weisman and Abernathy (2000). The net result is that volatility can be understated if historical data is used.

The solution to this problem is to use some factor model that describes a hedge fund style’s returns in terms of assets that are frequently traded and have market-observable prices. One then calculates the volatility of the investment based on the investment’s replicating portfolio of frequently traded instruments. Four of the factor models described earlier satisfy this criterion.
But what if volatility does not represent the risk that risk-averse investors would prefer to avoid?
CVaRIf risk is defined as avoiding large negative returns, then another measure besides volatility may be appropriate. Agarwal and Naik (2002) suggest using Conditional Value-at-Risk (CVaR) as the measure of risk to use in an optimization. Whereas Value-at-Risk (VaR) measures the maximum loss for a given confidence level over a given period of time, CVaR corresponds to the expected loss conditional on the losses being greater than or equal to VaR.
The advantage of using a constraint such as CVaR is that it results in optimal strategies for which the magnitude of extreme losses is kept under control. When using CVaR rather than VaR as the risk measure, optimal allocations to arbitrage strategies decline because of the “tail” risk of these strategies. (Tail risk refers to the possibility of infrequent, but large losses.)
The authors use the empirical distribution of the hedge fund returns in calculating CVaR.
Measures Incorporating SkewnessBy using variance (or standard deviation) around the mean as an investment’s risk measure, one is assuming that investors are indifferent between upside risk and downside risk. In this case, investors are said to not have “skewness” preference. But investors most certainly do have a preference for upside risk and an aversion to downside risk!
Signer and Favre (2002) recognize the problem with using a symmetric risk measure for investments that may have asymmetric outcomes. Their research focuses on taking into consideration the third and fourth moments of a portfolio’s return distribution.
(The mean and variance are the first and second moments of a distribution; skewness is the third moment, which describes how asymmetric a distribution is; and kurtosis is the fourth moment, which describes how fat the tails of the distribution are. Negative skewness refers to an investment having a higher probability of a very large loss and a lower probability of a high positive return than one with equally balanced probabilities of gains and losses.)
The authors note that:“Negative skewness and positive excess kurtosis are unwelcome distribution features
for the investor, but these are not taken into account in a mean-variance world.”
While empirical studies from the 1970s showed that broadly diversified portfolios of equities have returns that appear to be distributed in a symmetric fashion, one cannot make a similar claim about hedge funds. In many cases, this class of investments may have asymmetric payoffs because these investments explicitly use derivatives or because their dynamic trading strategies result in option-like return profiles.
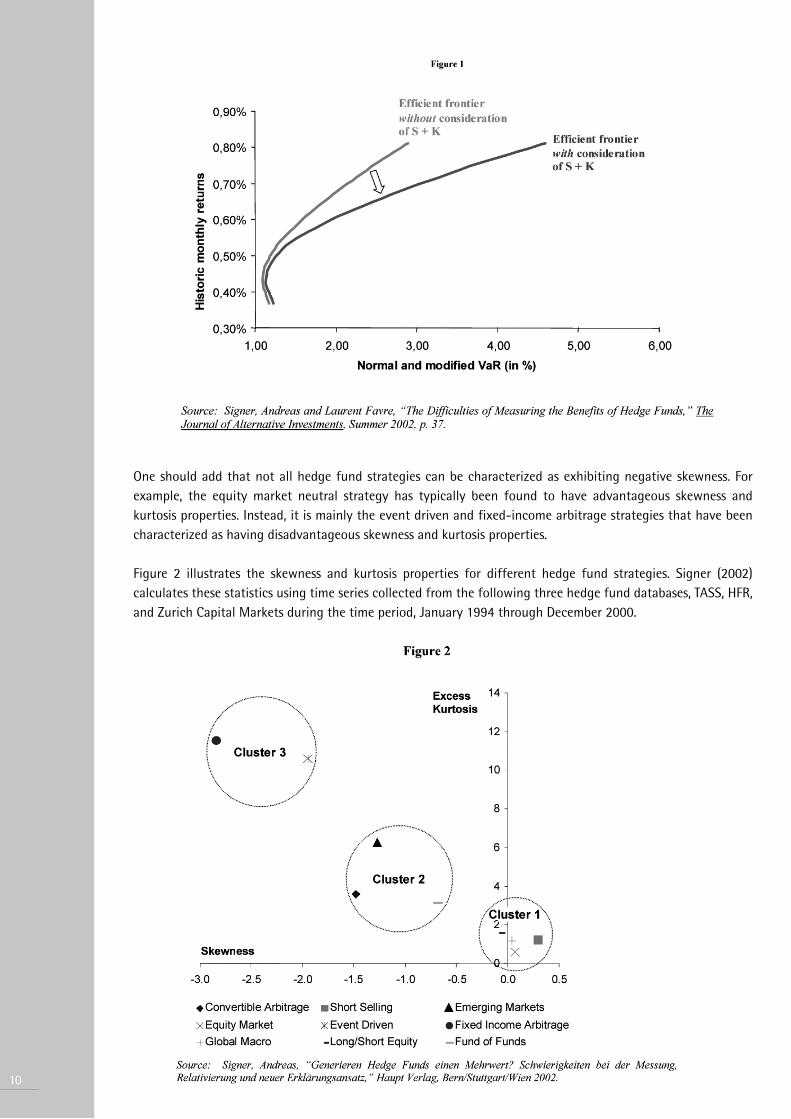
When one cannot assume that an investment’s returns are distributed normally (or symmetrically), Signer and Favre [2002] propose a risk measure that also takes into consideration the third and fourth moments of an investment’s distribution. They describe a statistical method for adjusting VaR to incorporate skewness and kurtosis; they refer to this new measure as “modified VaR.”
Figure 1 illustrates how the efficient frontier is affected when using modified VaR rather than VaR as the risk constraint. This figure shows that the benefits of hedge funds are represented too positively when not taking into consideration the extra moments of the investment’s return distributions. Specifically, figure 1 illustrates a sample portfolio with a maximum allocation to hedge funds of 10%.
9
10
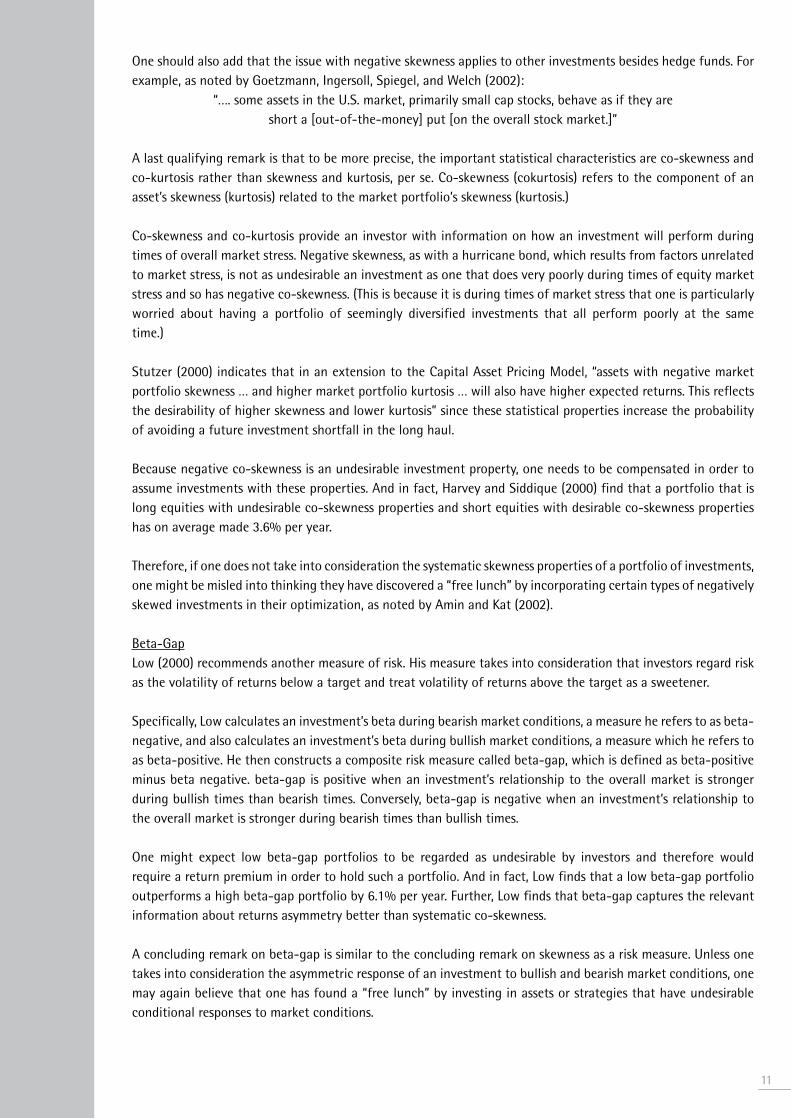
One should add that not all hedge fund strategies can be characterized as exhibiting negative skewness. For example, the equity market neutral strategy has typically been found to have advantageous skewness and kurtosis properties. Instead, it is mainly the event driven and fixed-income arbitrage strategies that have been characterized as having disadvantageous skewness and kurtosis properties.
Figure 2 illustrates the skewness and kurtosis properties for different hedge fund strategies. Signer (2002)calculates these statistics using time series collected from the following three hedge fund databases, TASS, HFR, and Zurich Capital Markets during the time period, January 1994 through December 2000.
11
One should also add that the issue with negative skewness applies to other investments besides hedge funds. For example, as noted by Goetzmann, Ingersoll, Spiegel, and Welch (2002):
“…. some assets in the U.S. market, primarily small cap stocks, behave as if they areshort a [out-of-the-money] put [on the overall stock market.]”
A last qualifying remark is that to be more precise, the important statistical characteristics are co-skewness and co-kurtosis rather than skewness and kurtosis, per se. Co-skewness (cokurtosis) refers to the component of an asset’s skewness (kurtosis) related to the market portfolio’s skewness (kurtosis.)
Co-skewness and co-kurtosis provide an investor with information on how an investment will perform during times of overall market stress. Negative skewness, as with a hurricane bond, which results from factors unrelated to market stress, is not as undesirable an investment as one that does very poorly during times of equity market stress and so has negative co-skewness. (This is because it is during times of market stress that one is particularly worried about having a portfolio of seemingly diversified investments that all perform poorly at the same time.)
Stutzer (2000) indicates that in an extension to the Capital Asset Pricing Model, “assets with negative market portfolio skewness … and higher market portfolio kurtosis … will also have higher expected returns. This reflects the desirability of higher skewness and lower kurtosis” since these statistical properties increase the probability of avoiding a future investment shortfall in the long haul.
Because negative co-skewness is an undesirable investment property, one needs to be compensated in order to assume investments with these properties. And in fact, Harvey and Siddique (2000) find that a portfolio that is long equities with undesirable co-skewness properties and short equities with desirable co-skewness properties has on average made 3.6% per year.
Therefore, if one does not take into consideration the systematic skewness properties of a portfolio of investments, one might be misled into thinking they have discovered a “free lunch” by incorporating certain types of negatively skewed investments in their optimization, as noted by Amin and Kat (2002).
Beta-GapLow (2000) recommends another measure of risk. His measure takes into consideration that investors regard risk as the volatility of returns below a target and treat volatility of returns above the target as a sweetener.
Specifically, Low calculates an investment’s beta during bearish market conditions, a measure he refers to as beta-negative, and also calculates an investment’s beta during bullish market conditions, a measure which he refers to as beta-positive. He then constructs a composite risk measure called beta-gap, which is defined as beta-positive minus beta negative. beta-gap is positive when an investment’s relationship to the overall market is stronger during bullish times than bearish times. Conversely, beta-gap is negative when an investment’s relationship to the overall market is stronger during bearish times than bullish times.
One might expect low beta-gap portfolios to be regarded as undesirable by investors and therefore would require a return premium in order to hold such a portfolio. And in fact, Low finds that a low beta-gap portfolio outperforms a high beta-gap portfolio by 6.1% per year. Further, Low finds that beta-gap captures the relevant information about returns asymmetry better than systematic co-skewness.
A concluding remark on beta-gap is similar to the concluding remark on skewness as a risk measure. Unless one takes into consideration the asymmetric response of an investment to bullish and bearish market conditions, one may again believe that one has found a “free lunch” by investing in assets or strategies that have undesirable conditional responses to market conditions.
12
Volatility RegimesEven if an investor is confident about using volatility as a risk measure, there is another complicating issue.
As noted in Till (August 2002), an investor frequently uses the normal distribution to represent the returns of a diversified portfolio since one assumes that it is acceptable to use the Central Limit Theorem.
Under this theorem, as the number of randomly distributed independent variables becomes large, the distribution of the collection’s mean approaches normality.
This would be fine for a portfolio’s return if its individual strategies were never influenced by a dominant event. But in practice, this does not happen as seen during the October 1987 stock-market crash, the Fall of 1998 bond debacle, and during the aftermath of the September 11th, 2001 terrorist attacks.
Johnson, Macleod, and Thomas (2002) suggest addressing this problem by representing an investment’s distribution as a combination of two distributions: one for peaceful times and one for eventful times.
The distribution during eventful times would not just include higher volatility, but also the greater correlation among strategies that occurs during crises. It would be down to the investor to explicitly determine the proportion of crisis returns in the combined distribution.
CorrelationsIn addition to returns and risk measures, another essential input in a portfolio optimization is the determination of the participating investments’ correlations. One important issue has already been alluded to: during crises, the only thing that seems to go up is correlations! In other words, depending on whether one is in peaceful times or eventful times, one should make different correlation assumptions.
Asness, Krail, and Liew (2001) have noted another difficulty. These authors argue that the lack of correlation of hedge fund indices to the S&P 500 is actually due to the reporting of stale prices for hedge fund positions. Once one adjusts for stale pricing of illiquid hedge fund positions, the relationship of a respected hedge fund index to the S&P is quite high using data from January 1994 to September 2000. The authors adjust for lagged pricing by regressing hedge fund index returns versus lagged S&P returns.
Return-to-Risk Trade-OffDuring this discussion on optimizing a portfolio’s risk allocation, it has been assumed that investors are risk averse and therefore that they will make some trade-off between return and risk. Interestingly, just how to mathematically characterize that trade-off is a topic of intense debate.
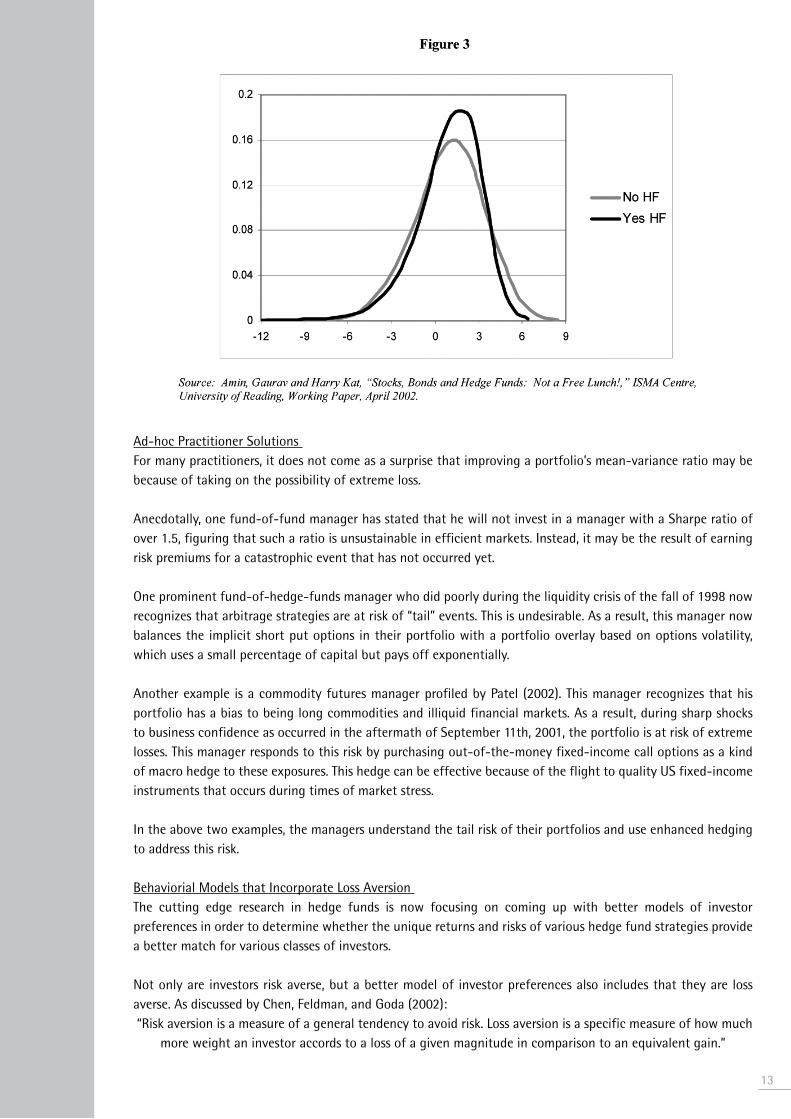
Mean-VarianceThe traditional approach in representing the trade-off between return and risk is a straightforward trade-off between a portfolio’s average returns and its variance. The problem with this technique is that as recommended allocations to hedge funds become large, one can expect lower skewness in the overall portfolio’s return distribution, as pointed out by Amin and Kat (2002). In other words, there is a trade-off between improving a portfolio’s mean-variance characteristics and taking on more risk of rare, but large losses. As shown in the return distribution graph of Figure 3, Kat and Amin have illustrated that a diversified portfolio with a large allocation to hedge funds compared to one without hedge funds has a higher probability of a very large loss and a lower probability of a high positive return.
Ad-hoc Practitioner Solutions For many practitioners, it does not come as a surprise that improving a portfolio’s mean-variance ratio may be because of taking on the possibility of extreme loss. Anecdotally, one fund-of-fund manager has stated that he will not invest in a manager with a Sharpe ratio of over 1.5, figuring that such a ratio is unsustainable in efficient markets. Instead, it may be the result of earning risk premiums for a catastrophic event that has not occurred yet. One prominent fund-of-hedge-funds manager who did poorly during the liquidity crisis of the fall of 1998 now recognizes that arbitrage strategies are at risk of “tail” events. This is undesirable. As a result, this manager now balances the implicit short put options in their portfolio with a portfolio overlay based on options volatility, which uses a small percentage of capital but pays off exponentially. Another example is a commodity futures manager profiled by Patel (2002). This manager recognizes that his portfolio has a bias to being long commodities and illiquid financial markets. As a result, during sharp shocks to business confidence as occurred in the aftermath of September 11th, 2001, the portfolio is at risk of extreme losses. This manager responds to this risk by purchasing out-of-the-money fixed-income call options as a kind of macro hedge to these exposures. This hedge can be effective because of the flight to quality US fixed-income instruments that occurs during times of market stress. In the above two examples, the managers understand the tail risk of their portfolios and use enhanced hedging to address this risk. Behaviorial Models that Incorporate Loss Aversion The cutting edge research in hedge funds is now focusing on coming up with better models of investor preferences in order to determine whether the unique returns and risks of various hedge fund strategies provide a better match for various classes of investors. Not only are investors risk averse, but a better model of investor preferences also includes that they are loss averse. As discussed by Chen, Feldman, and Goda (2002): “Risk aversion is a measure of a general tendency to avoid risk. Loss aversion is a specific measure of how much
more weight an investor accords to a loss of a given magnitude in comparison to an equivalent gain.”
13

14
In preliminary work by Chen, Feldman, and Goda, the researchers explicitly model the distributional characteristics of each hedge style, including their skewness and kurtosis properties. They then determine the optimal combination of traditional and alternative investments, given different levels of investor risk and loss aversion. For certain levels of risk and loss aversion, the researchers find that the most attractive hedge fund styles are the equity market-neutral and global macro styles. As noted above, the equity market neutral style has historically sacrificed returns in exchange for dramatically lower volatility. The global macro style has a return pattern that historically has sacrificed upside return in the U.S. equity market in return for protection on the downside. These trade-offs are obviously appropriate for “loss averse” investors. The researchers also note that there is no reason to assume that the levels of risk aversion and loss aversion are common to all investors, which means that portfolios would need to be customized for each class of investor. Alternatively, Siegmann and Lucas (2002) hypothesize that the optimal behavior of a loss-averse investor depends on whether an investor is in a situation of surplus. If one is in the happy condition of surplus, then the optimal investment strategies are ones that have long option payoffs (with particular strike prices.) If the investor is in the opposite situation, then the optimal investment strategies are ones that have income-producing, short option-like payoffs (again with particular strike prices.)
Siegmann further notes that the optimal strategy also depends on the available options (or achievable dynamic strategies). This will determine whether the long call or the straddle pay-off is optimal in the case of a positive surplus. And similarly for negative surplus and the short put and short straddle pay-off. The author also notes that it is a matter of ongoing research to interpret the properties of dynamic strategies in terms of specific option strategies. Anecdotally, the very wealthy clients of European fund-of-funds do prefer strategies that have a lot of optionality, including CTA and global macro. These funds have at times gravitated to managers who are in the midst of large drawdowns, figuring that with such a large dispersion of results, there is an increased chance of a large upside. If the Siegmann and Lucas model is correct, though, for everyone else, the appropriate hedge fund strategies are income producing, arbitrage strategies, which are implicitly short options as discussed by Agarwal and Naik.
Implement Investment Strategy The last step in the risk allocation framework is to implement and monitor the investment strategy. If one is using the risk allocation framework, that means they are assuming that they can model the underlying characteristics of the investment. It also means that one expects that the hedge fund manager will consistently follow an investment style that reflects those underlying characteristics. Style Drift That might be a heroic assumption. Anecdotally, during 2002, a number of merger arbitrage (M&A) managers gravitated towards the distressed sector of investing, given the absence of deal flow in the M&A sector. These managers were apparently negatively impacted by the credit surprises, which followed from the discovery of Worldcom’s accounting fraud this summer. Diversification Implosion Another problem with implementing a diversified portfolio, which includes a number of hedge fund styles has been noted by Fung and Hsieh (1997). While style exposures of hedge fund strategies may be diverse, market exposures can converge. They provide an example from 1993 and 1994 how three different investment strategies ended up with highly concentrated bond portfolios. If one held such a portfolio, one would have done quite poorly in February 1994 when, after a long hiatus, the Fed finally raised rates.

Conclusion In reviewing the latest research on how to apply a risk allocation framework to hedge funds, one can see that there is still a lot of debate on how to evaluate these alternative investment strategies. The conclusion may be that some hedge fund strategies offer superior returns either because of their illiquidity or because the investor is being compensated for taking on the risk of rare, but large losses. In addition, it may be that some hedge fund strategies also create return-to-risk profiles that are a better match for the preferences of certain classes of investors than is the case with traditional assets.
15

16
References
• Agarwal, Vikas, and Narayan Naik, “Risks and Portfolio Decisions Involving in Hedge Funds,” London Business School, Working Paper, July 2002. • Amin, Gaurav, and Harry Kat, “Stocks, Bonds and Hedge Funds: Not a Free Lunch!”, University of Reading, Working Paper, April 2002. • Asness, Cliff, Robert Krail, and John Liew, “Do Hedge Funds Hedge?”, Journal of Portfolio Management, Fall 2001. • Brealey, Richard, and Evi Kaplanis, “Changes in the Factor Exposures of Hedge Funds,” London Business School, Working Paper, January 2001. • Busse, Jeffrey, “Volatility Timing in Mutual Funds: Evidence from Daily Returns,” Review of Financial Studies, Winter 1999. • Chen, Peng, Barry Feldman, and Chandra Goda, “Portfolios with Hedge Funds and Other Alternative Investments: Introduction to a Work in Progress,” Ibbotson Associates, Working Paper, July 2002. • Edwards, Franklin, and Mustafa Caglayan, “Hedge Fund Performance and Manager Skill,” Journal of Futures Markets, November 2001. • Favre, Laurent, and Jose-Antonio Galeano, “An Analysis of Hedge Fund Performance Using Loess Fit Regression, “Journal of Alternative Investments, Spring 2002. • Fung, William and David Hsieh, “Empirical Characteristics of Dynamic Trading Strategies: The Case of Hedge Funds, ” Review of Financial Studies, Summer 1997. • —, “A Primer on Hedge Funds,” Journal of Empirical Finance, September 1999. • —, “The Risk in Hedge Fund Strategies: Theory and Evidence from Trend Followers,” Review of Financial Studies, Summer 2001. • Goetzmann, William, Jonathan Ingersoll, Matthew Spiegel, and Ivo Welch, “Sharpening Sharpe Ratios, “ Yale School of Management, Working Paper, February 2002. • Harvey, Campbell, and Akhtar Siddique, “Conditional Skewness in Asset Pricing Tests,” Journal of Finance, June 2000. • Ineichen, Alexander, “The Risk of Hedge Funds,” Managing Hedge Fund Risk, Risk Books, London, 2000. • Johnson, Damien, Nick Macleod, and Chris Thomas, “Modeling the Return Structure of a Fund of Hedge Funds,” AIMA Newsletter, April 2002. • Koh, Francis, David Lee, and Phoon Kok Fai, “An Evaluation of Hedge Funds: Risk, Return and Pitfalls,” (forthcoming) Singapore Economic Review, 2002.
• Low, Cheekiat, “Asymmetric Returns and Semidimensional Risks: Security Valuation with a New Volatility Metric,” Yale University and National University of Singapore, Working Paper, August 2000. • Mitchell, Mark, and Todd Pulvino, “Characteristics of Risk in Risk Arbitrage,” Journal of Finance, December 2001.
• Patel, Navroz, “Fund Manager Profiles: Premia Capital Management,” Risk magazine, July 2002. • Shimko, David, and Robert Reider, “Many Happy Returns,” Risk magazine, January 1997. • Siegmann, Arjen, and Andre Lucas, “Explaining Hedge Fund Investment Styles By Loss Aversion: A Rational Alternative,” Tinbergen Institute Discussion Paper, May 2002. • Signer, Andreas, Generieren Hedge Funds einen Mehrwert? Schwierigkeiten bei der Messung, Relativierung und neuer Erklärungsansatz, Haupt Verlag, Bern/Stuttgart/Wien 2002. • Signer, Andreas, and Laurent Favre, “The Difficulties of Measuring the Benefits of Hedge Funds,” Journal of Alternative Investments, Summer 2002. • Singer, Brian, Renato Staub, and Kevin Terhaar, “Determining the Appropriate Allocation to Alternative Investments,” (forthcoming) Journal of Portfolio Management, Spring 2003. • Stutzer, Michael, “A Portfolio Performance Index,” Financial Analysts Journal, May/June 2000. • Till, Hilary, “Life at Sharpe’s End,” Risk & Reward, September 2001. • —, “Measure for Measure,” Risk & Reward, October 2001. • —, “Returns-Based Analysis of Hedge Funds,” Derivatives Week, July 28, 2002. • —, “Measuring Risk-Adjusted Returns in Alternative Investments,” Quantitative Finance, August 2002. • Wander, Brett, and Dennis Bein, “How to Incorporate Hedge Funds and Active Portfolio Management into an Asset Allocation Framework,” Risk Management Perspectives, Analytic Investors, June 2002. • Weisman, Andrew, and Jerome Abernathy, “The Dangers of Historical Hedge Fund Data,” Risk Budgeting, Risk Books, London, 2000. • Weisman, Andrew, and Timothy Birney, “The New Diversification Testament,” Hedge Seminar Proceedings, Northfield Information Systems, Boston, March 7, 2002.
17