hpeds 2007 annual report
TRANSCRIPT

A Message From Ronald A. Rittenmeyer
2008 Annual Meeting Notice
Proxy Statement
2007 Financial Information
Behind Our Clients’ Success —Delivering on Our Commitments
2007 Annual Report


ELECTRONIC DATA SYSTEMS CORPORATION
NOTICE OF ANNUAL MEETING OF SHAREHOLDERS
TO BE HELD ON APRIL 15, 2008
The Annual Meeting of Shareholders of Electronic Data Systems Corporation (“EDS”) will be held on Tuesday, April 15, 2008, at 1:00 p.m. local time, at the offices of EDS, 5400 Legacy Drive, Plano, Texas 75024. The purpose of the meeting is to:
� elect 12 directors to hold office until the next annual shareholders’ meeting or until their respective successors have been elected or appointed;
� ratify the appointment of KPMG LLP as our independent auditors for the current year;
� re-approve the 2003 Amended and Restated Incentive Plan;
� approve the Board of Directors’ proposal to amend our Certificate of Incorporation to allow 25% of shareholders to call a special meeting;
� consider and vote upon one shareholder proposal, if presented at the meeting; and
� act upon such other matters as may be properly presented at the meeting.
The proxy statement fully describes these items. We have not received notice of other matters that may be properly presented at the meeting.
Only EDS shareholders of record at the close of business on February 19, 2008, will be entitled to vote at the meeting.
We are pleased to be among the first companies to take advantage of the new Securities and Exchange Commission rule that allows issuers to furnish proxy materials to their shareholders on the Internet. The new rule allows us to provide our shareholders with the information they need for our annual meeting while lowering the costs of delivery and reducing the environmental impact of the meeting.
Your vote is important. Whether or not you are able to attend the meeting in person, it is important that your shares be represented. To ensure that your vote is recorded promptly, please vote as soon as possible, even if you plan to attend the meeting.
By order of the Board of Directors,
Storrow M. Gordon Secretary
March 3, 2008
1
PROXY STATEMENT
FOR THE ANNUAL MEETING OF SHAREHOLDERS
TO BE HELD APRIL 15, 2008
Information About This Proxy Statement
Our Board of Directors has made this Proxy Statement and related materials available to you on the Internet, or at your request has delivered printed versions to you by mail, in connection with the Board’s solicitation of proxies for our 2008 Annual Meeting of Shareholders. Our proxy materials include this Proxy Statement and our 2007 Annual Report to Shareholders, which includes our audited consolidated financial statements. If you requested printed versions of these materials by mail, they will also include a proxy card for the Annual Meeting.
Pursuant to rules recently adopted by the Securities and Exchange Commission (“SEC”), we are providing access to our proxy materials over the Internet. Accordingly, we are sending a Notice Regarding Availability of Proxy Materials (the “Notice”) to our shareholders of record and beneficial owners. The mailing of the Notice to our shareholders is scheduled to begin on or about March 5, 2008. All shareholders will have the ability to access the proxy materials on a website referred to in the Notice or request to receive a printed set of the proxy materials. Instructions on how to access the proxy materials over the Internet or to request a printed copy may be found on the Notice. In addition, shareholders may request to receive proxy materials in printed form by mail or electronically by e-mail on an ongoing basis. If you hold shares through the EDS Stock Purchase Plan or a dividend reinvestment program, you may receive one Notice or, if you request printed copies of the proxy materials by mail, one set of proxy materials for all shares held in the same name.
Choosing to receive your future proxy materials by e-mail will save us the cost of printing and mailing documents to you and will reduce the impact of our annual shareholders meetings on the environment. If you choose to receive future proxy materials by e-mail, you will receive an e-mail next year with instructions containing a link to those materials and a link to the proxy voting site. Your election to receive proxy materials by e-mail will remain in effect until you terminate it.
The mailing address of our principal executive offices is 5400 Legacy Drive, Plano, Texas 75024.
Information About the Annual Meeting
Record Date and Share Ownership
Only holders of record of our common stock at the close of business on February 19, 2008, may vote at the meeting. On that date, 509,319,471 shares of common stock were outstanding. Each share is entitled to cast one vote. The majority of the shares of common stock outstanding on the record date must be present in person or by proxy to have a quorum for the transaction of business at the meeting. If the persons present or represented by proxy at the meeting constitute the holders of less than a majority of the shares of common stock outstanding on the record date, the meeting may be adjourned to a subsequent date for the purpose of obtaining a quorum.
Voting Your Shares
If you are a shareholder of record, you may vote in person at the meeting. We will give you a ballot when you arrive. If you hold your shares through a bank or broker and wish to vote in person at the meeting, you must obtain a valid proxy from the firm that holds your shares. If you do not wish to vote in person or will not be attending the meeting, you may vote by proxy. You can vote by proxy over the Internet by following the instructions provided in the Notice or, if you requested printed copies of the proxy materials by mail, you can also vote by mail or telephone.
- 2 -
If you have Internet access, we encourage you to vote over the Internet. It is convenient and saves significant postage and processing costs.
If you complete and submit your proxy before the meeting, the persons named as proxies will vote the shares represented by your proxy in accordance with your instructions. If you submit a proxy without giving voting instructions, your shares will be voted in the manner recommended by our Board on all matters presented in this Proxy Statement, and as the persons named as proxies may determine in their discretion with respect to any other matters properly presented at the meeting.
If a bank or broker holds your shares in its name and you do not provide that firm with specific voting instructions, it may generally vote on routine matters but cannot vote on non-routine matters. Thus, if you do not give specific instructions, your shares will not be voted on non-routine matters and will not be counted in determining the number of shares necessary for approval. When a broker votes a client’s shares on some but not all proposals, the missing votes are referred to as “broker non-votes.” Those shares will be included in determining the presence of a quorum at the meeting but would not be considered “present” for purposes of voting on a non-routine proposal. We encourage you to provide voting instructions to any firm that holds your shares by carefully following the instructions provided in the Notice. We understand that pursuant to New York Stock Exchange (“NYSE”) rules Proposal 5 will be considered a non-routine proposal for which your bank or broker may not exercise voting discretion.
If you participate in the EDS common stock fund through the EDS 401(k) Plan or EDS Puerto Rico Savings Plan, you will receive a separate notice of availability of proxy materials and voting instructions for the shares allocated to your account and your proxy will constitute authorization to the plan trustees to vote such shares.
At this year’s meeting, the polls will close at 2:00 p.m. Central time; any further votes will not be accepted after that time. We will announce preliminary results at the meeting and publish final results on our Investor Relations Web site at www.eds.com/investor shortly after the meeting and also in our Quarterly Report on Form 10-Q for the second quarter of 2008.
Revoking Your Proxy
If you are a registered holder, you may revoke your proxy at any time prior to the close of the polls by: (1) submitting a later-dated vote in person at the meeting, via the Internet, by telephone or by mail or (2) delivering instructions to our Corporate Secretary prior to the meeting by fax to (972) 605-5610 or by mail to 5400 Legacy Drive, Mail Stop H3-3A-05, Plano, TX 75024. If you hold shares through a bank or broker, you must contact that firm to revoke any prior voting instructions.
Vote Required to Adopt Proposals
Each share of our common stock outstanding on the record date will be entitled to one vote on each of the 12 director nominees and one vote on each other matter.
For Proposal 1 (Election of Directors), each director must be elected by a majority of the votes cast for that director (meaning that the number of shares voted “for” a director must exceed the number of shares voted “against” that director). See “Corporate Governance and Board Matters – Majority Vote for Election of Directors” for more information.
For Proposal 4 (Board of Directors proposal to amend EDS’ Certificate of Incorporation to allow 25% of shareholders to call a special meeting), the affirmative vote of a majority of our outstanding common stock is required for approval.
For each other proposal, the affirmative vote of a majority of the common stock represented in person or by proxy at the meeting is required for approval.
Shares not present at the meeting and shares voting “abstain” have no effect on the election of directors. For each other proposal, abstentions are treated as shares present or represented and voting, so an abstention will have the effect of a vote against the proposal.
- 3 -
Other Matters to be Acted Upon at the Meeting
We do not know of any other matters to be validly presented or acted upon at the meeting. Under our Bylaws, no business besides that stated in the meeting notice may be transacted at any meeting of shareholders. If any other matter is presented at the meeting on which a vote may properly be taken, the shares represented by proxies will be voted in accordance with the judgment of the person or persons voting those shares.
Expenses of Solicitation
EDS is making this solicitation and will pay the entire cost of preparing and distributing the Notice and these proxy materials and soliciting votes. If you choose to access the proxy materials and/or vote over the Internet, you are responsible for any Internet access charges you may incur. Our officers and employees may, but without compensation other than their regular compensation, solicit proxies by further mailing or personal conversations, or by telephone, facsimile, e-mail or otherwise. We will, upon request, reimburse brokerage firms and others for their reasonable expenses in forwarding the Notice and any proxy materials to beneficial owners of our common stock.
Corporate Governance and Board Matters
Board of Directors
The Board of Directors is elected by and accountable to the shareholders and is responsible for the strategic direction, oversight and control of EDS. Regular meetings of the Board are generally held five times per year and special meetings are scheduled when necessary. The Board held seven meetings in 2007. All directors attended at least 82% of the meetings of the Board and the Board committees of which they were members during 2007.
Committees of the Board
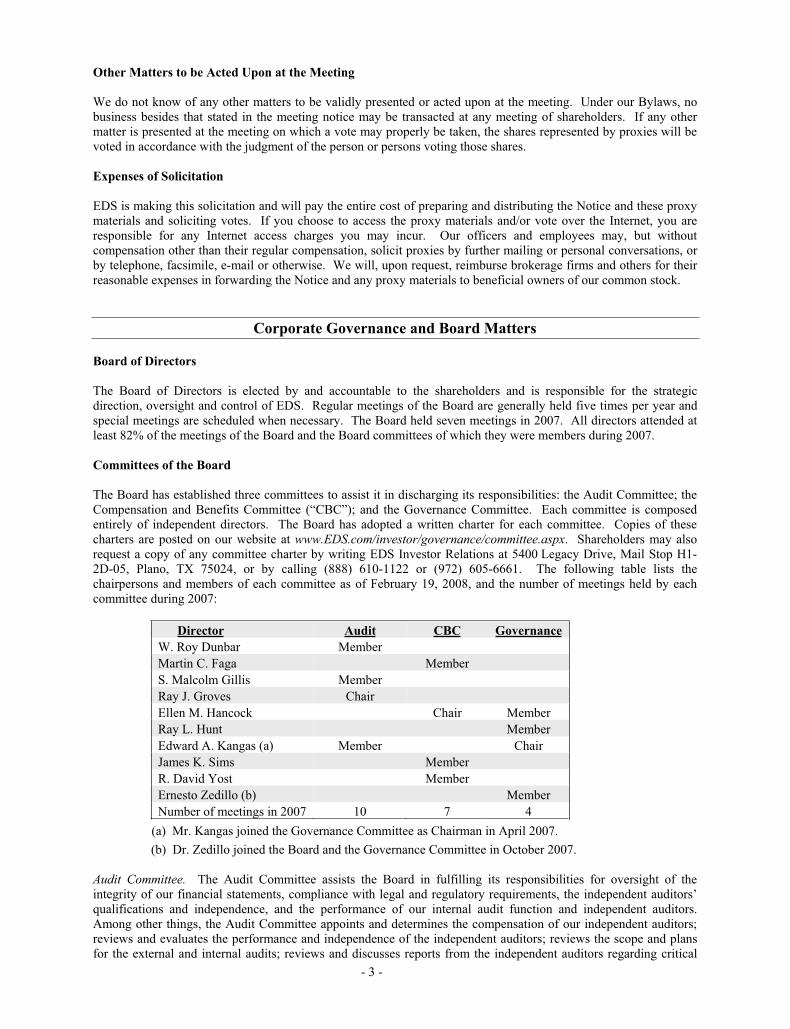
The Board has established three committees to assist it in discharging its responsibilities: the Audit Committee; the Compensation and Benefits Committee (“CBC”); and the Governance Committee. Each committee is composed entirely of independent directors. The Board has adopted a written charter for each committee. Copies of these charters are posted on our website at www.EDS.com/investor/governance/committee.aspx. Shareholders may also request a copy of any committee charter by writing EDS Investor Relations at 5400 Legacy Drive, Mail Stop H1-2D-05, Plano, TX 75024, or by calling (888) 610-1122 or (972) 605-6661. The following table lists the chairpersons and members of each committee as of February 19, 2008, and the number of meetings held by each committee during 2007:
Director Audit CBC Governance
W. Roy Dunbar Member
Martin C. Faga Member
S. Malcolm Gillis Member
Ray J. Groves Chair
Ellen M. Hancock Chair Member
Ray L. Hunt Member
Edward A. Kangas (a) Member Chair
James K. Sims Member
R. David Yost Member
Ernesto Zedillo (b) Member
Number of meetings in 2007 10 7 4
(a) Mr. Kangas joined the Governance Committee as Chairman in April 2007.
(b) Dr. Zedillo joined the Board and the Governance Committee in October 2007.
Audit Committee. The Audit Committee assists the Board in fulfilling its responsibilities for oversight of the integrity of our financial statements, compliance with legal and regulatory requirements, the independent auditors’ qualifications and independence, and the performance of our internal audit function and independent auditors. Among other things, the Audit Committee appoints and determines the compensation of our independent auditors; reviews and evaluates the performance and independence of the independent auditors; reviews the scope and plans for the external and internal audits; reviews and discusses reports from the independent auditors regarding critical
- 4 -
accounting policies, alternative treatments of financial information and other matters; reviews significant changes in the selection or application of accounting principles; reviews the internal control report of management, any issues regarding the adequacy of internal controls and any remediation efforts; reviews legal matters that could materially impact our financial statements; reviews the EDS Code of Business Conduct to determine whether it complies with applicable law and discusses reports from the Office of Ethics and Business Conduct concerning compliance with the Code of Business Conduct; and reviews our guidelines and policies with respect to risk assessment and risk management. The Audit Committee also reviews with management and the independent auditors our quarterly and annual financial statements and other public financial disclosures prior to their release. The Board of Directors has determined that Messrs. Groves and Kangas are audit committee financial experts within the meaning of SEC regulations. The report of the Audit Committee is included below.
Compensation and Benefits Committee. The CBC reviews and approves annual goals and objectives relevant to the CEO’s compensation and evaluates the CEO’s performance against such goals and objectives. The CBC approves all salary and other compensation for our other executive officers and the performance goals for our performance-based executive plans. It is also responsible for the review and approval of all new benefit and equity compensation plans and programs, as well as amendments to existing plans and programs, and reviews and makes recommendations to the Board regarding director compensation. No former employee of EDS serves on the CBC.
Governance Committee. The Governance Committee develops, and makes recommendations to the Board for approval of, our policies and practices related to corporate governance, including the EDS Corporate Governance Guidelines. In addition, the committee develops the criteria for the qualification and selection of candidates for election to the Board, including the standards and processes for determining director independence, and makes recommendations to the Board regarding such candidates as well as the appointment of directors to serve on Board committees. The committee is also responsible for the development and oversight of our director orientation and education programs. The committee recommends to the Board the election of the Chairman and the Chief Executive Officer (“CEO”), reviews the CEO’s recommendations regarding the election of other principal officers, reviews and develops with the CEO management succession plans, and makes recommendations regarding shareholder proposals. The procedures for submission by a shareholder of a director nominee or other proposal are described under “Shareholder Proposals and Nomination of Directors” below.
Corporate Governance Guidelines
The Board has adopted the EDS Corporate Governance Guidelines to assist it in the performance of its duties and the exercise of its responsibilities and in accordance with the listing requirements of the NYSE. The Governance Committee of the Board is responsible for overseeing the Guidelines and periodically reviews them and makes recommendations to the Board concerning corporate governance matters. The Guidelines are posted on our website at www.EDS.com/investor/governance/guidelines.aspx. Shareholders may also request a copy of the Guidelines by writing EDS Investor Relations at 5400 Legacy Drive, Mail Stop H1-2D-05, Plano, Texas 75024, or by calling (888) 610-1122 or (972) 605-6661. The Guidelines cover the following principal subjects:
� Expectations of individual directors, including understanding EDS’ businesses and markets, review and understanding of materials provided to the Board, objective and constructive participation in meetings and strategic decision-making processes, regular attendance at Board and Board committee meetings, and attendance at annual shareholder meetings.
� Board selection and composition, including Board size, independence of directors, process for determining director independence, number of independent directors, nomination and selection of directors, service on other boards, director retirement, separation of the Chairman and CEO positions, director orientation and a mandatory continuing director education program.
� Board operations, including number of meetings, requirement for executive sessions of non-management directors, the duties of the Presiding Director, Board access to management, annual CEO evaluation, annual Board and Committee evaluation, management development and succession planning, retention of independent advisors and operation and composition of Board committees.
� Other matters, including director compensation, prohibition on consulting agreements with directors, restrictions on charitable contributions to director-affiliated organizations, procedures implementing the majority vote requirement for the election of directors described below, procedures for avoidance or minimization of conflicts of interest, including the related party transaction approval policy described under “Related Party Transactions” below, and the rights plan policy described below.
Executive Sessions. The Guidelines require the non-employee directors to meet in executive session without management present from time to time, and at least twice per year. Executive sessions are a normal part of the
- 5 -
Board’s deliberations and activities. One of these meetings is devoted to the evaluation of the CEO and the recommendations of the Compensation and Benefits Committee regarding the CEO’s compensation.
Rights Plan Policy. The Board of Directors redeemed EDS’ shareholder rights plan, sometimes referred to as a “poison pill,” in 2005. The Board also adopted a policy to obtain shareholder approval prior to adopting any rights plan in the future unless the Board, in the exercise of its fiduciary duties and through a committee comprised of all independent Directors, determines that, under the circumstances then existing, it would be in the best interest of EDS and its shareholders to adopt a rights plan without prior shareholder approval. This policy further provides that if a rights plan is adopted by the Board without prior shareholder approval, the plan must provide that it shall expire within one year of adoption unless ratified by shareholders.
Presiding Director. The Board has an independent Presiding Director who serves as chair of the regularly conducted executive sessions of the Board and all other sessions at which the Chairman is not present. The Presiding Director facilitates communication with the Board and, at the request of any independent director, serves as the liaison between the Chairman and the independent directors. When requested by any independent director or when the Presiding Director deems it appropriate, the Presiding Director can call meetings of the independent directors. The Presiding Director reviews and approves the agenda for each Board meeting and the nature and type of materials to be sent to the Board for each meeting based on that agenda. At least annually, the independent Directors evaluate the Board’s plan for agendas for each meeting in the upcoming year and the information provided at and in advance of meetings and discuss recommendations for any changes to that plan and information in executive session with the Presiding Director, who will communicate those recommendations to the Chairman.
The Presiding Director position is rotated on an annual basis among the Chairpersons of the Board’s three standing Committees. The Chair of the Compensation and Benefits Committee, Ellen M. Hancock, currently serves as the Presiding Director through the date of the 2008 Annual Meeting of Shareholders, and the Chair of the Governance Committee, Edward A. Kangas, will serve as the Presiding Director thereafter until the 2009 Annual Meeting. The Guidelines provide that if the position of Chairman is held by an independent director, all duties and responsibilities assigned to the Presiding Director shall be performed by that independent Chairman.
Majority Vote for Election of Directors. In 2007, the Board amended our Bylaws to provide that in an uncontested election of directors (i.e., where the nominees for director equals the number of directors to be elected), a nominee must receive more votes for than against his or her election to be elected to the Board. The Guidelines provide that the Board shall nominate as director only candidates who agree to tender, prior to nomination, irrevocable resignations that will be effective upon (i) the failure to receive the required vote and (ii) the Board’s acceptance of such resignation. Similarly, the Board will fill director resignations and new directorships only with candidates who agree to tender the same form of resignation prior to any subsequent nomination.
The Guidelines further provide that if an incumbent director fails to receive the required vote for election, the Governance Committee will promptly consider whether to accept or reject that director’s previously tendered resignation. The Governance Committee will consider all factors deemed relevant including, without limitation, the stated reasons why shareholders voted against the election of the director, the length of service and qualifications of the director whose resignation has been tendered, the director’s contributions to EDS, and the impact of the resignation on any contractual and regulatory requirements. The Board will act on the Governance Committee’s recommendation no later than 90 days following the date of the shareholders’ meeting when the election occurred. In considering the Governance Committee’s recommendation, the Board will review the factors considered by the Governance Committee and such additional information and factors the Board believes to be relevant. Absent a compelling reason for the director to remain on the Board, it is the Board’s intention to accept the resignation. We will promptly publicly disclose the Board's decision, together with an explanation of the process by which the decision was reached and, if applicable, the reasons for rejecting the tendered resignation.
Any director who tenders his or her resignation pursuant to this provision is expected to not participate in the Governance Committee recommendation or Board consideration regarding whether or not to accept the tendered resignation. If a majority of the members of the Governance Committee are not duly elected under the Bylaws at the same election, then the independent directors who are elected will designate a group amongst themselves to recommend to the remaining elected independent Directors whether to accept or reject the tendered resignations.
- 6 -
Director Independence
The Board assesses the independence of each non-employee director not less frequently than annually in accordance with the Corporate Governance Guidelines. Under the Guidelines for Assessing Independence of EDS’ Directors, a director cannot be independent unless the Board affirmatively determines that he or she has no material relationship with EDS, either directly or as a partner, shareholder or officer of an organization that has a relationship with EDS, and has none of the other relationships listed in the guidelines that would disqualify the director from being independent under the rules of the NYSE. As contemplated by the NYSE rules, the Board also adopted categorical standards to assist in determining whether any material relationship with EDS exists. Directors who have any of the relationships outlined in such categorical standards are considered to have relationships that require a “full facts and circumstances review” by the Board in order to determine whether it constitutes a material relationship with EDS for purposes of his or her independence. The Independence Guidelines, including such categorical standards, are posted on our website at www.EDS.com/investor/governance/independence.aspx.
In February 2008, the Board assessed the independence of each non-employee director under the Independence Guidelines. The Board determined, after careful review, that all non-employee directors (Mr. Dunbar, Mr. Faga, Dr. Gillis, Mr. Groves, Ms. Hancock, Mr. Hunt, Mr. Kangas, Mr. Sims, Mr. Yost and Dr. Zedillo) are independent. There were no relationships outlined in the categorical standards with any non-employee director that required a “full facts and circumstances review” by the Board. The Board also determined that each member of the Audit Committee meets the additional independence standards of the NYSE and SEC applicable to Audit Committee members. Such standards require that the director not be an affiliate of EDS and cannot accept from EDS, directly or indirectly, any consulting, advisory or other compensatory fee, other than fees for serving as a director.
Communications with the Board
Individuals may communicate with the Presiding Director by e-mail to [email protected] or in writing to Presiding Director, c/o Corporate Secretary, 5400 Legacy Drive, Mail Stop H3-3A-05, Plano, Texas 75024.
Communications intended for any other non-management director should also be sent to the above address. Further information regarding the procedures for communications with the Presiding Director is posted on our website at www.EDS.com/investor/governance/communication.aspx.
EDS Code of Business Conduct
EDS is committed to conducting its business ethically and with integrity. We believe that integrity is the sum of the ethical performance of the people of EDS and fosters successful long-term relationships with clients, a better overall work environment and a culture of compliance with both the letter and spirit of the law that ultimately brings value to our shareholders. The EDS Code of Business Conduct, first adopted over a decade ago, has been continually updated to reflect the values we expect of the directors, officers and employees of the entire EDS family of companies. The Code of Business Conduct meets the standards for a “code of ethics” applicable to our principal executive officer, principal financial officer, and principal accounting officer or controller for purposes of applicable SEC rules and satisfies the requirements of the NYSE for a code of business conduct applicable to all directors, officers and employees. The Code is posted on our website at www.EDS.com/investor/governance/code.aspx. You may also request a copy of the Code by writing EDS Investor Relations at 5400 Legacy Drive, Mail Stop H1-2D-05, Plano, TX 75024, or by calling (888) 610-1122 or (972) 605-6661. We will disclose any amendment or waiver of a provision of the Code that applies to our principal executive officer, principal financial officer, principal accounting officer or controller, or that relates to any element of the definition of a “code of ethics” under applicable SEC rules, as well as any amendment or waiver of the Code for any of our directors or any executive officer, on our website at www.EDS.com/investor/governance/code.aspx not later than five business days after the amendment or waiver.
Director Qualifications
The Governance Committee will select nominees for director on the basis of their integrity, experience, achievements, judgment, intelligence, personal character, ability to make independent analytical inquiries, willingness to devote adequate time to Board duties, and the likelihood that they will be able to serve on the Board for a sustained period. To be recommended by the Governance Committee for election to the Board, a nominee must also meet the expectations for individual directors set forth in the EDS Corporate Governance Guidelines, including understanding EDS’ businesses and the marketplaces in which it operates. In addition, a nominee must not have conflicts or commitments that would impair his or her ability to attend scheduled Board meetings or annual
- 7 -
shareholders meetings, not hold positions that would result in a violation of legal requirements, and meet any applicable legal or regulatory requirements for directors of government contractors. In selecting nominees, the Governance Committee will also consider the nominee’s global experience, experience as a director of a large public company and knowledge of particular industries.
Identification and Evaluation of Director Candidates
The Governance Committee uses a variety of means for identifying nominees for director, including third-party search firms and recommendations from current Board members and shareholders. In determining whether to nominate a candidate, the Governance Committee considers the current composition and capabilities of serving Board members, as well as additional capabilities considered necessary or desirable in light of existing needs, and then assesses the need for new or additional members to provide those capabilities. In most instances, all members of the Governance Committee, as well as one or more other directors, will interview a prospective candidate. The Governance Committee will also contact any other sources, including persons serving on another board with the candidate, it deems appropriate to develop a well-rounded view of the candidate. Reports from the interview with the candidate and/or Governance Committee members with personal knowledge and experience with the candidate, information provided by other contacts, the candidate’s resume, and any other information deemed relevant by the Governance Committee will be considered in determining whether a candidate should be nominated.
In evaluating whether to nominate a director for re-election, the Governance Committee will consider the following: the director’s attendance at Board and Board committee meetings; the director’s review and understanding of the materials provided in advance of meetings and other materials provided to the Board from time to time; whether the director actively, objectively and constructively participated in such meetings and in the strategic decision-making process in general; the director’s compliance with the Corporate Governance Guidelines; and whether the director continues to possess the qualities and capabilities expected of Board members discussed above. The Governance Committee will also consider input from other Board members concerning the performance and independence of that director. Generally, the manner in which the Governance Committee evaluates nominees for director recommended by a shareholder will be the same as that for nominees from other sources. However, the Governance Committee will also seek and consider information concerning the relationship between a shareholder’s nominee and that shareholder to determine whether the nominee can effectively represent the interests of all shareholders.
Shareholder Proposals and Nomination of Directors
Shareholders may submit proposals, including director nominations, for consideration at future shareholder meetings.
Shareholder Proposals. For a shareholder proposal to be considered for inclusion in our proxy statement for an annual shareholders’ meeting, the written proposal must comply with the requirements of SEC Rule 14a-8 regarding the inclusion of shareholder proposals in company-sponsored proxy materials. Proposals should be addressed to:
Corporate Secretary Electronic Data Systems Corporation 5400 Legacy Drive, Mail Stop H3-3A-05 Plano, Texas 75024 Fax: (972) 605-5610
Our 2009 Annual Meeting of Shareholders is currently scheduled for April 21, 2009. Under SEC rules, shareholder proposals to be considered for inclusion in our proxy statement for that meeting must be received by the Corporate Secretary not later than November 5, 2008. See “Bylaw Procedures” below for a description of procedures that shareholders must follow to introduce an item of business at an annual meeting in addition to the SEC Rule 14a-8 requirements to have the proposal included in our proxy statement.
Nomination of Director Candidates. The Governance Committee will consider candidates recommended by shareholders who beneficially own not less than 1% of the outstanding common stock. Eligible shareholders wishing to make such recommendations may submit a completed “Shareholder Recommendation of Candidate for Director” form to the Secretary of the Governance Committee by e-mail to [email protected] or by mail to 5400 Legacy Drive, Mail Stop H3-3A-05, Plano, TX 75024. This form is posted on our website at www.EDS.com/investor/governance/nominations.aspx. A copy of the form may also be requested from the Secretary of the Governance Committee. Eligible shareholders who wish to recommend a nominee for election as director at the 2009 annual meeting should submit a completed form not earlier than October 1, 2008, and not later
- 8 -
than November 5, 2008. Generally, candidates recommended by an eligible shareholder will be evaluated by the Governance Committee under the same process described above. However, the Governance Committee will not evaluate a shareholder-recommended candidate unless and until the potential candidate has indicated a willingness to serve as a director, comply with the expectations and requirements for Board service described above and provide all information required to conduct an evaluation.
Shareholders who wish to nominate a person for election as a director at the next annual meeting may do so in accordance with the Bylaw procedures described below, either in addition to or in lieu of making a recommendation to the Governance Committee.
Bylaw Procedures. Our Bylaws set forth procedures that shareholders must follow to introduce an item of business at an annual meeting or nominate persons for election as a director. These requirements are separate from and in addition to the SEC Rule 14a-8 requirements that a shareholder must satisfy to have a shareholder proposal included in our proxy statement. These requirements are also separate from the procedures described above that a shareholder must follow to recommend a director candidate to the Governance Committee. Generally, our Bylaws require that a shareholder notify the Corporate Secretary of a proposal not less than 90 days or more than 270 days before the scheduled meeting date. The notice must include the name and address of the shareholder and of any other shareholders known by such shareholder to be in favor of the proposal, as well as a description of the proposed business and reason for conducting the proposed business at the annual meeting. If the notice relates to a nomination for director, it must also set forth the name, age, principal occupation and business and residence address of any nominee(s), the number of shares of common stock beneficially owned by the nominee(s) and such other information regarding each nominee as would have been required to be included in a proxy statement under the SEC’s proxy rules. Our Bylaws are posted on our website at www.EDS.com/investor/governance. Shareholders may also contact the Corporate Secretary at the above address for a copy of the relevant Bylaw provisions.
Compensation and Benefits Committee Interlocks and Insider Participation
None of the members of the Compensation and Benefits Committee are current or former officers or employees of EDS. No interlocking relationship exists between the members of our Board of Directors or our Compensation and Benefits Committee and the board of directors or compensation committee of any other company, nor has any such interlocking relationship existed in the past.

- 9 -
PROPOSALS TO BE VOTED ON
PROPOSAL 1: ELECTION OF DIRECTORS
Our Board of Directors currently has 12 members. All current directors are standing for re-election, to hold office until the next Annual Meeting of Shareholders or until their successors are elected and qualified. All nominees were previously elected by shareholders at the 2007 Annual Meeting, other than Dr. Zedillo who was appointed to the Board in October 2007. Dr. Zedillo had been recommended to the Governance Committee by a director search firm. If a director nominee becomes unavailable for election, the Board may substitute another person for the nominee, in which event your shares will be voted for that other person.
The information below regarding the director nominees is as of February 15, 2008.
The Board of Directors recommends a vote FOR each director nominee.
W. ROY DUNBAR, 46, has been a director of EDS since 2004. He has been President and Chief Executive Officer of Network Solutions, a provider of Web related services, since February 2008. Mr. Dunbar was President Global Technology and Operations of Master Card International from September 2004 to January 2008, and president, intercontinental operations of Eli Lilly and Company, responsible for its Asia, Africa/Middle East, Latin America and the Confederation of Independent States operations from January 2004 to September 2004. He had served as vice president of information technology and chief information officer of Eli Lilly since 1999 and joined Eli Lilly in 1990. Mr. Dunbar is also a director of Humana Inc.
MARTIN C. FAGA, 66, has been a director of EDS since 2006. He served as the President and Chief Executive Officer of The MITRE Corporation, a non-profit organization providing engineering, research and development services to the U.S. Federal government, from May 2000 to June 2006 and is a current member of its Board of Trustees. He was Vice President at MITRE from 1993-2000. Mr. Faga served as the United States Department of Defense, Assistant Secretary of the Air Force for Space and Director, National Reconnaissance Office, from 1989 to 1993.
S. MALCOLM GILLIS, 67, has been a director of EDS since 2005. He has served as Zingler Professor of Economics and University Professor at Rice University since June 2004. Dr. Gillis was President of Rice University from 1993 to June 2004. He is also a director of Halliburton Company, Service Corporation International, Introgen Therapeutics, Inc. and AECOM Technology Corporation.
RAY J. GROVES, 72, has been a director of EDS since 1996. He served as Senior Advisor of Marsh Inc., the insurance brokerage and risk management subsidiary of Marsh & McLennan Companies, Inc., from October 2004 to July 2005, Chairman and Chief Executive Officer from July 2003 to October 2004, President and Chief Executive Officer from January 2003 to June 2003, and President and Chief Operating Officer from October 2001 to January 2003. Mr. Groves was Chairman of Legg Mason Merchant Banking, Inc. from March 1995 to September 2001. He retired as Chairman and Chief Executive Officer of Ernst & Young LLP in September 1994, which position he held since 1977. Mr. Groves is also a director of Boston Scientific Corporation.

- 10 -
ELLEN M. HANCOCK, 64, has been a director of EDS since 2004. She served as President and Chief Operating Officer of Jazz Technologies, Inc. and its predecessor Acquicor Technology Inc., from August 2005 to June 2007 (prior to its merger with Jazz Semiconductor, Inc., a wafer foundry, in February 2007, Jazz was a blank check company formed to acquire businesses in the technology, multimedia and networking sector). Ms. Hancock was Chairman of Exodus Communications, Inc., a computer network and internet systems company, from 2000 to 2001, Chief Executive Officer from 1998 to 2001 and President from 1998 to 2000. She was Executive Vice President, Research and Development, Chief Technology Officer of Apple Computer Inc. from 1996 to 1997. Ms. Hancock previously was Executive Vice President and Chief Operating Officer of National Semiconductor and a Senior Vice President and Group Executive of International Business Machines Corporation. She is also a director of Aetna Inc. and Colgate-Palmolive Company.
JEFFREY M. HELLER, 68, rejoined EDS in March 2003. He has served as Vice Chairman of EDS since December 2006 and a director since 2003. He was President of EDS from March 2003 to December 2006 and Chief Operating Officer from March 2003 to October 2005. Mr. Heller retired from EDS in February 2002 as Vice Chairman, a position he had held since November 2000. He served as President and Chief Operating Officer of EDS from 1996 to 2000 and Senior Vice President from 1984 to 1996. Mr. Heller joined EDS in 1968 and has served in numerous technical and management capacities. He is also a director of Temple Inland Corp. and Mutual of Omaha.
RAY L. HUNT, 64, has been a director of EDS since 1996. Mr. Hunt has been Chairman of the Board, President and Chief Executive Officer of Hunt Consolidated Inc. and Chairman and Chief Executive Officer of Hunt Oil Company for more than five years. He is a director of PepsiCo, Inc., Bessemer Securities LLC, Bessemer Securities Corporation and King Ranch, Inc. and a manager of Verde Group.
EDWARD A. KANGAS, 63, has been a director of EDS since 2004. He was Chairman and Chief Executive Officer of Deloitte Touche Tohmatsu from 1989 to 2000 and Managing Partner of Deloitte & Touche (USA) from 1989 to 1994. Mr. Kangas began his career as a staff accountant at Touche Ross in 1967, where he became a partner in 1975. After his retirement from Deloitte in 2000, Mr. Kangas served as a consultant to Deloitte until 2004. He is the immediate past Chairman of the National Multiple Sclerosis Society and a director of Eclipsys Corporation, Hovnanian Enterprises Inc., Tenet Healthcare Corporation (for which he has served as non-executive Chairman since July 2003), and Intuit Inc.
RONALD A. RITTENMEYER, 60, has been Chairman of the Board of EDS since December 2007, Chief Executive Officer of EDS since September 2007 and President of EDS since December 2006. He served as Chief Operating Officer of EDS from October 2005 to September 2007 (including service as Co-Chief Operating Officer until May 2006) and as Executive Vice President, Global Service Delivery from July 2005 to December 2006. Prior to joining EDS, he was Managing Director of The Cypress Group, a private equity firm, from July 2004 to June 2005, Chairman, Chief Executive Officer and President of Safety-Kleen, Inc., a hazardous waste management company, from August 2001 to July 2004, and Chief Executive Officer and President of AmeriServe, a food services company, from February 2000 to December 2001. Prior to that time Mr. Rittenmeyer had held executive positions with RailTex, Inc., Ryder TRS, Inc., Burlington Northern Railroad, Frito-Lay, Inc., PepsiCo Food International and Merisel.
- 11 -
JAMES K. SIMS, 61, has been a director of EDS since 2006. He was Chairman of the Board of RSA Security Inc., a provider of online identity and digital asset security services, from June 2003 to September 2006 and Vice Chairman from October 2002 to June 2003. He has served as Chairman and Chief Executive Officer of GEN3 Partners, Inc., a consulting company that specializes in science-based technology development, since September 1999, and as General Partner of its affiliated private equity investment fund, GEN3 Capital I, LP, since July 2005. Mr. Sims has also served on the Board of Directors of several private companies, including as Chairman of Airgain, Inc., a developer of wireless antenna technology, since November 2004, Chairman of Groxis, Inc., an enterprise search management software firm, since November 2004 and Chairman of American EPS, Inc., a provider of online payroll and attendance solutions, since February 2005. He was a director of Enterasys Networks, Inc., a provider of infrastructure solutions, from June 2004 to March 2005, and Chief Executive Officer, President and director of Cambridge Technology Partners (Massachusetts), Inc., a consulting and systems integration firm, from 1991 to 1999.
R. DAVID YOST, 60, has been a director of EDS since 2005. He has been Chief Executive Officer of AmerisourceBergen Corporation, a pharmaceutical services company, since August 2001 and its President and Chief Executive Officer since September 2007. He had also served as President of AmerisourceBergen from August 2001 to October 2002. Mr. Yost served as Chairman and Chief Executive Officer of AmeriSource Health Corporation from December 2000 to August 2001 and President and Chief Executive Officer of AmeriSource Health Corporation from May 1997 to December 2000. He held a variety of other positions with AmeriSource Health Corporation and its predecessors since 1974, including Executive Vice President – Operations of AmeriSource Health Corporation from 1995 to 1997. Mr. Yost is a director of AmerisourceBergen Corporation and PharMerica Corporation.
ERNESTO ZEDILLO, 56, has been a director of EDS since October 2007. Dr. Zedillo is the former President of Mexico and has been a Director at the Yale Center for the Study of Globalization and a Professor in the field of International Economics and Politics at Yale University since September 2002. He is also a Director of Alcoa Inc. and The Procter & Gamble Company.
PROPOSAL 2: RATIFICATION OF APPOINTMENT OF INDEPENDENT AUDITORS
The Audit Committee has appointed KPMG LLP (“KPMG”) as EDS’ independent auditors for the year ending December 31, 2008. That firm has been EDS’ auditors since 1984. The Board of Directors is submitting the appointment of that firm for ratification by shareholders. A representative of KPMG is expected to be present at the meeting, will be available to respond to appropriate questions and will have the opportunity to make a statement, should he or she so desire.
The Board of Directors recommends a vote FOR the ratification of the appointment of KPMG as
independent auditors for 2008.
Audit and Non-Audit Fees to Independent Auditor
The following table shows the dollar amount (in millions) of the fees paid or accrued by EDS for audit and other services provided by KPMG in 2007 and 2006.
2007 2006
Audit Fees ........................................................... $17.5 $18.7 Audit-Related Fees .............................................. 1.1 1.3 Tax Fees .............................................................. .5 .3 All Other Fees ..................................................... -- -- Total ....................................................................... $19.1 $20.3
- 12 -
Audit fees represent fees for services provided in connection with the audit of our consolidated financial statements, audit of our internal control over financial reporting, review of our interim consolidated financial statements, local statutory audits, accounting consultations and SEC registration statement reviews. Audit-related fees consist primarily of fees for audits of employee benefit plans and service organizations. Tax fees include fees for domestic and international tax consultations, and international tax return preparation. Other services principally include fees for ISO 9000/14000 compliance assessments and were less than $50,000 in both 2007 and 2006. KPMG rendered no professional services to EDS in 2007 or 2006 with respect to financial information systems design and implementation.
Policy on Pre-Approval of Audit and Non-Audit Services
All audit services, audit-related services, tax services and other services were pre-approved by the Audit Committee. The Audit Committee charter provides for pre-approval of any audit or non-audit services provided to EDS by its independent auditors. However, pre-approval is not necessary for non-audit services if: (i) the aggregate amount of all such non-audit services provided to EDS constitutes not more than five percent of the total fees paid by EDS to its independent auditors during the fiscal year in which the non-audit services are provided; (ii) such services were not recognized by EDS at the time of the engagement to be non-audit services; and (iii) such services are promptly brought to the attention of the Audit Committee and approved prior to the completion of the audit by the Audit Committee. The Audit Committee may delegate to one or more of its members pre-approval authority with respect to all permitted audit and non-audit services, provided that any services pre-approved pursuant to such delegated authority shall be presented to the full Audit Committee at its next regular meeting.
Report of the Audit Committee
The Audit Committee reviewed and discussed with management of the company and KPMG LLP, independent auditors for the company, the audited financial statements to be included in the Annual Report on Form 10-K for the year ended December 31, 2007.
The Audit Committee discussed with KPMG LLP the matters required to be discussed by Statement on Auditing Standards No. 114, “The Auditor's Communication with those Charged with Governance.”
The Audit Committee received the written disclosures and the letter from KPMG LLP required by Independence Board Standard No. 1, “Independence Discussions With Audit Committees,” and has discussed with KPMG LLP its independence from the company.
The Audit Committee reviewed management’s process to assess the adequacy of the company’s system of internal control over financial reporting and management’s conclusions on the effectiveness of the company’s internal control over financial reporting. The Audit Committee also discussed with KPMG LLP their audit of the company’s system of internal control over financial reporting.
In reliance on the reviews and discussions with management of the company and KPMG LLP referred to above, the Audit Committee has recommended to the Board of Directors that the audited financial statements be included in the company’s Annual Report on Form 10-K for the year ended December 31, 2007, for filing with the Securities and Exchange Commission.
It is the responsibility of the company’s management to plan and conduct audits and determine that the company’s financial statements are complete and accurate and in accordance with generally accepted accounting principles. In giving its recommendation to the Board of Directors, the Audit Committee has relied on management’s representation that such financial statements have been prepared in conformity with generally accepted accounting principles, and the reports of the company’s independent accountants with respect to such financial statements.
Audit Committee
Ray J. Groves, Chair W. Roy Dunbar S. Malcolm Gillis Edward A. Kangas
- 13 -
PROPOSAL 3: RE-APPROVAL OF 2003 INCENTIVE PLAN
The 2003 Incentive Plan of Electronic Data Systems Corporation (the “Incentive Plan”) was most recently approved by shareholders in 2003. The Incentive Plan provides for the payment of annual bonus and long-term incentive compensation in a manner that may allow certain of such payments to qualify as “performance-based” under Section 162(m) of the Internal Revenue Code (the “Code”). Under current law, Section 162(m) limits our ability to deduct compensation of more than $1 million paid to our Chief Executive Officer and three other most highly compensated executive officers, other than the Chief Financial Officer. However, compensation which qualifies as “performance-based” is exempt from such $1 million deduction limitation. In order to qualify as “performance-based,” among other requirements the compensation must be paid solely on account of the attainment of one or more pre-established objective performance goals and the material terms of such goals (including the business criteria on which such goals are based) must be disclosed to and subsequently approved by our shareholders every five years. Accordingly, we are seeking shareholder approval of the terms of the Incentive Plan to allow certain awards under that plan to continue to qualify as performance-based compensation for purposes of Section 162(m). We are not seeking to increase the number of shares of common stock available for awards under the Incentive Plan or make any other material amendment to the Incentive Plan.
As of December 31, 2007, approximately 2,000 employees were eligible to participate in the Incentive Plan. In addition, our non-employee directors may elect to receive restricted stock under the Incentive Plan in lieu of all or part of their director fees as described under “Non-Employee Director Compensation” below. At December 31, 2007, we had 10 non-employee directors.
The material terms of the Incentive Plan are described below.
Administration. The Incentive Plan is administered by the CBC, which is comprised solely of non-employee directors. The CBC establishes the terms and conditions of awards granted under the Incentive Plan, subject to certain limitations in the plan. The CBC may delegate to the Chief Executive Officer and to other senior officers its duties under the Incentive Plan, except that no such delegation may be made in the case of actions with respect to participants who are now or may be, in the estimation of the CBC, subject to Section 16 of the Securities Exchange Act of 1934 or who are or may be “covered employees” under Section 162(m).
Employee Awards. The CBC may grant awards to employees under the Incentive Plan in the form of stock options, stock appreciation rights (“SARs”), other stock awards or cash awards. Stock options may be an incentive stock option, which complies with Section 422 of the Code, or a nonqualified stock option. SARs are rights to receive a payment, in cash or common stock, equal to the excess of the fair market value or other specified valuation of a number of shares of common stock on the date the rights are exercised over a specified strike price. SARs may be granted singly or in combination with an underlying stock option under the Incentive Plan. The CBC may also grant other stock awards in the form of shares of common stock or awards denominated in units of common stock. The CBC may include dividends or dividend equivalents as part of a stock award. The CBC may also grant a cash award under the Incentive Plan. The terms of any stock option, SAR, other stock award or cash award granted under the Incentive Plan will be established by the CBC, provided that the exercise price of any stock option may not be less than the fair market value of the common stock on the date of grant.
Business Criteria for Performance Awards. The CBC may elect to grant any of the foregoing employee awards in the form of a performance award subject to the attainment of one or more performance goals. A performance award will be paid, vested or otherwise deliverable solely upon the attainment of one or more pre-established, objective performance goals established by the CBC. A performance goal may be based upon one or more business criteria that apply to the employee, one or more business units of EDS or EDS as a whole, and may include one or more of the following criteria: revenue, net income, common stock price, stockholder return, stockholder value, economic value, earnings per share, market performance, return on net assets, return on equity, earnings, operating profits, free cash flow, free cash flow per share, working capital, revenue, organic revenue, costs, new business contract values, and/or such other financial, accounting or quantitative metric determined by the CBC. A performance goal may include or exclude items to measure specific objectives, including, without limitation, extraordinary or other non-recurring items, acquisitions and divestitures, internal restructuring and reorganizations, accounting charges and effects of accounting changes. A performance goal will be established by the CBC prior to the earlier of (x) 90 days after the start of the period of service to which the goal relates and (y) the lapse of 25% of the period of service, but in any event while the outcome is substantially uncertain. The CBC has no discretion to increase the amount of a performance award that is payable, vested, or otherwise deliverable under the Incentive Plan to an employee who is or, in the estimation of the CBC may be, a “covered employee” under Section 162(m) of the Code. In the case of an employee who is not a “covered employee” under Section 162(m) of the Code, a performance award that is payable,
- 14 -
vested or otherwise deliverable under the Incentive Plan may be increased or decreased depending on the employee’s satisfaction of one or more objective or non-objective individual goals established from time to time by our management.
Maximums. In any one calendar year, no individual may receive awards under the Plan consisting of options or
SARs that are exercisable for more than 2,000,000 shares, or awards consisting of common stock or units
denominated in common stock covering more than 500,000 shares, or a cash award in excess of $6,000,000.
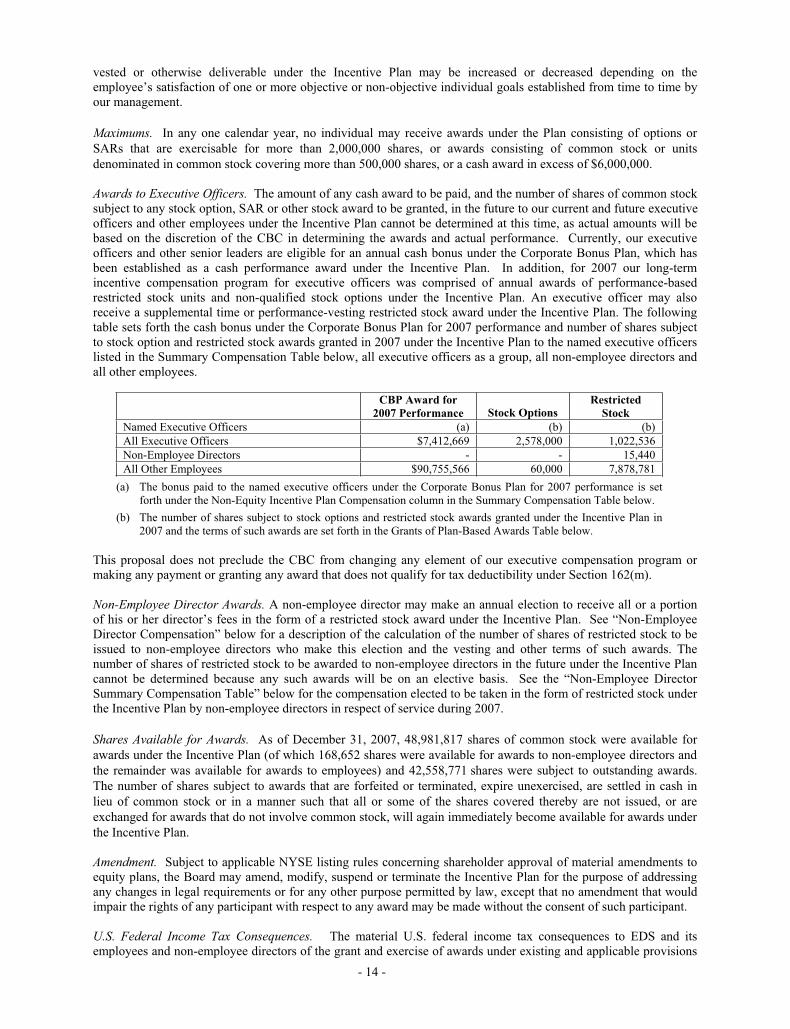
Awards to Executive Officers. The amount of any cash award to be paid, and the number of shares of common stock subject to any stock option, SAR or other stock award to be granted, in the future to our current and future executive officers and other employees under the Incentive Plan cannot be determined at this time, as actual amounts will be based on the discretion of the CBC in determining the awards and actual performance. Currently, our executive officers and other senior leaders are eligible for an annual cash bonus under the Corporate Bonus Plan, which has been established as a cash performance award under the Incentive Plan. In addition, for 2007 our long-term incentive compensation program for executive officers was comprised of annual awards of performance-based restricted stock units and non-qualified stock options under the Incentive Plan. An executive officer may also receive a supplemental time or performance-vesting restricted stock award under the Incentive Plan. The following table sets forth the cash bonus under the Corporate Bonus Plan for 2007 performance and number of shares subject to stock option and restricted stock awards granted in 2007 under the Incentive Plan to the named executive officers listed in the Summary Compensation Table below, all executive officers as a group, all non-employee directors and all other employees.
CBP Award for
2007 Performance Stock Options Restricted
Stock
Named Executive Officers (a) (b) (b)
All Executive Officers $7,412,669 2,578,000 1,022,536
Non-Employee Directors - - 15,440
All Other Employees $90,755,566 60,000 7,878,781
(a) The bonus paid to the named executive officers under the Corporate Bonus Plan for 2007 performance is set forth under the Non-Equity Incentive Plan Compensation column in the Summary Compensation Table below.
(b) The number of shares subject to stock options and restricted stock awards granted under the Incentive Plan in 2007 and the terms of such awards are set forth in the Grants of Plan-Based Awards Table below.
This proposal does not preclude the CBC from changing any element of our executive compensation program or making any payment or granting any award that does not qualify for tax deductibility under Section 162(m).
Non-Employee Director Awards. A non-employee director may make an annual election to receive all or a portion of his or her director’s fees in the form of a restricted stock award under the Incentive Plan. See “Non-Employee Director Compensation” below for a description of the calculation of the number of shares of restricted stock to be issued to non-employee directors who make this election and the vesting and other terms of such awards. The number of shares of restricted stock to be awarded to non-employee directors in the future under the Incentive Plan cannot be determined because any such awards will be on an elective basis. See the “Non-Employee Director Summary Compensation Table” below for the compensation elected to be taken in the form of restricted stock under the Incentive Plan by non-employee directors in respect of service during 2007.
Shares Available for Awards. As of December 31, 2007, 48,981,817 shares of common stock were available for
awards under the Incentive Plan (of which 168,652 shares were available for awards to non-employee directors and
the remainder was available for awards to employees) and 42,558,771 shares were subject to outstanding awards.
The number of shares subject to awards that are forfeited or terminated, expire unexercised, are settled in cash in
lieu of common stock or in a manner such that all or some of the shares covered thereby are not issued, or are
exchanged for awards that do not involve common stock, will again immediately become available for awards under
the Incentive Plan.
Amendment. Subject to applicable NYSE listing rules concerning shareholder approval of material amendments to equity plans, the Board may amend, modify, suspend or terminate the Incentive Plan for the purpose of addressing any changes in legal requirements or for any other purpose permitted by law, except that no amendment that would impair the rights of any participant with respect to any award may be made without the consent of such participant.
U.S. Federal Income Tax Consequences. The material U.S. federal income tax consequences to EDS and its employees and non-employee directors of the grant and exercise of awards under existing and applicable provisions
- 15 -
of the Code and regulations will generally be as set forth below. This summary does not purport to be complete, and does not cover, among other things, state, local and international tax treatment.
The grant of an incentive stock option or a nonqualified stock option would not result in income for the grantee or in a tax deduction for EDS. The exercise of a nonqualified stock option would result in ordinary income for the grantee and a tax deduction for EDS measured by the difference between the option price and the fair market value of the shares received at the time of exercise. Income tax withholding would be required for employees. The exercise of an incentive stock option would not result in ordinary income for the grantee if the grantee (i) does not dispose of the shares within two years from the date of option grant or one year from the date of option exercise, and (ii) is an employee of EDS or a subsidiary from the date of grant and through and until three months before the exercise date. If these requirements are met, the basis of the shares upon later disposition would be the option price. Any gain will be taxed to the grantee as long-term capital gain and EDS would not be entitled to a deduction. The excess of the market value of the shares on the exercise date over the option price is an item of tax preference, potentially subject to the alternative minimum tax. If the grantee disposes of the shares prior to the expiration of either of the holding periods, the grantee would recognize ordinary income and EDS would be entitled to a deduction equal to the lesser of the fair market value of the shares on the exercise date minus the option price or the amount realized on disposition minus the option price. Any gain in excess of the ordinary income portion would be taxable as long-term or short-term capital gain.
The grant of a SAR would not result in income for the grantee or in a deduction for EDS. Upon the exercise of a SAR, the grantee would recognize ordinary income and EDS would be entitled to a deduction measured by the fair market value of the shares plus any cash received. Income tax withholding would be required for employees.
A grantee will recognize ordinary income upon receipt of cash pursuant to a cash award or performance award. A grantee will not have taxable income upon the grant of a stock award in the form of units denominated in common stock, but rather will generally recognize ordinary income at the time he or she receives common stock or cash in satisfaction of such award in an amount equal to the fair market value of the common stock or cash received. In general, a grantee will recognize ordinary income as a result of the receipt of common stock pursuant to a stock award or performance award in an amount equal to the fair market value of the common stock when it is received, although if the stock is not transferable and is subject to a substantial risk of forfeiture when received, the grantee will recognize ordinary income in an amount equal to the fair market value of the common stock when it first becomes transferable or is no longer subject to a substantial risk of forfeiture. Income tax withholding would be required for employees.
The Board of Directors recommends a vote “FOR” the approval of the terms of the Incentive Plan.
PROPOSAL 4: AMEND CERTIFICATE OF INCORPORATION TO ALLOW 25% OF
SHAREHOLDERS TO CALL A SPECIAL MEETING
Article SIXTH of our Restated Certificate of Incorporation provides that special meetings of shareholders may be called at any time only by the Chairman of the Board or by a majority of the Board of Directors, and no such special meeting may be called by any other person or persons. The Board of Directors has adopted resolutions, subject to shareholder approval, approving and declaring the advisability of an amendment to our Restated Certificate of Incorporation to allow the holders of not less than 25% of our outstanding common stock to call a special meeting of shareholders. The following reflects the manner in which Article SIXTH of the Restated Certificate of Incorporation will be amended if this proposal is approved by shareholders, with deletions indicated by strikeout and additions indicated by underline:
S I X T H : No action required to be taken or that may be taken at any annual or special meeting of the stockholders of the Corporation may be taken without a meeting, and the power of the stockholders of the Corporation to consent in writing to the taking of any action by written consent without a meeting is specifically denied, except for action by unanimous written consent, which is expressly allowed. Unless otherwise provided by the DGCL, by the Restated Certificate of Incorporation or by any provisions established pursuant to Article FOURTH hereof with respect to the rights of holders of one or more outstanding series of Preferred Stock, special meetings of the stockholders of the Corporation may be called at any time only by the Chairman of the Board of Directors of the Corporation, or by the Board of Directors pursuant to a resolution approved by the affirmative vote of at least a majority of the Whole Board, or by the written request of the holders of record not less than twenty-five percent (25%) of the shares of Common Stock then outstanding and entitled to vote at such special meeting, and no such special meeting may be called by any other person or persons.
- 16 -
The Board of Directors is committed to principles of corporate democracy and is mindful of the approval at our 2007 annual meeting of the proposal to allow the holders of 10-25% of our outstanding common stock shareholders to call a special meeting. Following careful consideration of the implications of this proposal, the Board, upon the recommendation of the Governance Committee, has determined that it is appropriate to propose an amendment to our Restated Certificate of Incorporation to allow the holders of not less than 25% of our outstanding common stock to call a special meeting. The Board believes that establishing an ownership threshold of 25% for the right to call a special meeting strikes a reasonable balance between enhancing shareholder rights and protecting against the risk that a small minority of shareholders could trigger a special meeting and the resulting expense and disruption to our business. We will continue to have in place our existing governance mechanisms which afford management and the Board the ability to respond to proposals and concerns of all shareholders regardless of the level of share ownership.
Our Bylaws also currently provide that a special meeting of shareholders may be called only by the Chairman or a majority of the Board of Directors. If this proposal is approved, our Bylaws will be amended to allow the holders of not less than 25% of our outstanding common stock to call a special meeting of shareholders. The Bylaws would also be amended to provide for advance notice procedures for the special meeting similar to those currently in place for shareholders to bring an item of business for an annual meeting and to provide that the request for a special meeting for an item of business shall not be accepted if (i) it is delivered between the time starting on the 61st day after the earliest date of a request for an identical or substantially similar item and ending one year after such date, (ii) an identical or substantially similar item of business will be submitted for approval at a shareholder meeting within 90 days of such request, or (iii) it has been presented at the most recent annual shareholder meeting or any special meeting held within one year of such request.
The Board of Directors recommends a vote “FOR” the proposal to amend the Restated Certificate of
Incorporation to allow the holders of 25% of our outstanding common stock to call a special meeting.
SHAREHOLDER PROPOSAL
We expect Proposal 5 to be presented by a shareholder at the Annual Meeting. The proposal may contain assertions that we believe are incorrect. We have not attempted to refute any inaccuracy. However, the Board has recommended a vote against this proposal for the broader policy reasons set forth following the proposal.
PROPOSAL 5: Shareholder Proposal Regarding Shareholder Say on Executive Pay
John Chevedden, as proxy for William Steiner, has advised us that he intends to present the following resolution at the Annual Meeting:
RESOLVED, that shareholders of our company request our board of directors to adopt a policy to give shareholders the opportunity at each annual shareholder meeting to vote on an advisory resolution, proposed by management, to ratify the compensation of the named executive officers (NEOs) set forth in the proxy statement’s Summary Compensation Table (SCT) and the accompanying narrative disclosure of material factors provided to understand the SCT (but not the Compensation Discussion and Analysis). The proposal submitted to shareholders should make clear that the vote is non-binding and would not affect any compensation paid or awarded to any NEO.
Investors are increasingly concerned about mushrooming executive pay which often appears to be insufficiently aligned with the creation of shareholder value. As a result, in 2007 shareholders filed more than 60 “say on pay” resolutions with companies, averaging a 42% vote. In fact, seven resolutions exceeded a majority vote. Verizon Communications (VZ) and Aflac (AFL) decided to present such a resolution to a shareholder vote. A bill to provide for annual advisory votes on executive pay passed in the U.S. House of Representatives by a 2-to-1 margin.
Public companies in the United Kingdom allow shareholders to cast an advisory vote on executive compensation. Such a vote gives shareholders a clear voice that could help shape senior executive compensation.
The advantage of adopting this proposal should also be considered in the context of our company’s overall corporate governance. For instance in 2007 the following governance status was reported (and certain concerns are noted):
� We had no Independent Chairman – Independent oversight concern.
� Three directors were inside directors – Independence concern.
- 17 -
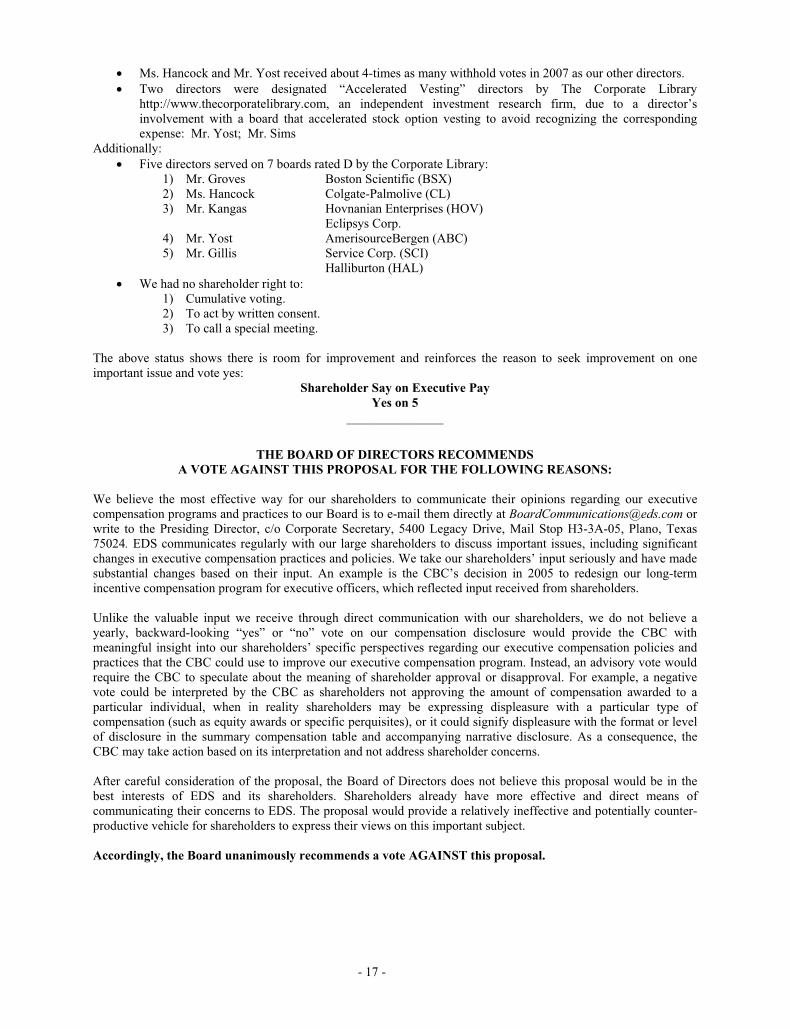
� Ms. Hancock and Mr. Yost received about 4-times as many withhold votes in 2007 as our other directors.
� Two directors were designated “Accelerated Vesting” directors by The Corporate Library http://www.thecorporatelibrary.com, an independent investment research firm, due to a director’s involvement with a board that accelerated stock option vesting to avoid recognizing the corresponding expense: Mr. Yost; Mr. Sims
Additionally:
� Five directors served on 7 boards rated D by the Corporate Library: 1) Mr. Groves Boston Scientific (BSX) 2) Ms. Hancock Colgate-Palmolive (CL) 3) Mr. Kangas Hovnanian Enterprises (HOV)
Eclipsys Corp. 4) Mr. Yost AmerisourceBergen (ABC) 5) Mr. Gillis Service Corp. (SCI)
Halliburton (HAL)
� We had no shareholder right to: 1) Cumulative voting. 2) To act by written consent. 3) To call a special meeting.
The above status shows there is room for improvement and reinforces the reason to seek improvement on one important issue and vote yes:
Shareholder Say on Executive Pay
Yes on 5
_______________
THE BOARD OF DIRECTORS RECOMMENDS
A VOTE AGAINST THIS PROPOSAL FOR THE FOLLOWING REASONS:
We believe the most effective way for our shareholders to communicate their opinions regarding our executive compensation programs and practices to our Board is to e-mail them directly at [email protected] or write to the Presiding Director, c/o Corporate Secretary, 5400 Legacy Drive, Mail Stop H3-3A-05, Plano, Texas 75024. EDS communicates regularly with our large shareholders to discuss important issues, including significant changes in executive compensation practices and policies. We take our shareholders’ input seriously and have made substantial changes based on their input. An example is the CBC’s decision in 2005 to redesign our long-term incentive compensation program for executive officers, which reflected input received from shareholders.
Unlike the valuable input we receive through direct communication with our shareholders, we do not believe a yearly, backward-looking “yes” or “no” vote on our compensation disclosure would provide the CBC with meaningful insight into our shareholders’ specific perspectives regarding our executive compensation policies and practices that the CBC could use to improve our executive compensation program. Instead, an advisory vote would require the CBC to speculate about the meaning of shareholder approval or disapproval. For example, a negative vote could be interpreted by the CBC as shareholders not approving the amount of compensation awarded to a particular individual, when in reality shareholders may be expressing displeasure with a particular type of compensation (such as equity awards or specific perquisites), or it could signify displeasure with the format or level of disclosure in the summary compensation table and accompanying narrative disclosure. As a consequence, the CBC may take action based on its interpretation and not address shareholder concerns.
After careful consideration of the proposal, the Board of Directors does not believe this proposal would be in the best interests of EDS and its shareholders. Shareholders already have more effective and direct means of communicating their concerns to EDS. The proposal would provide a relatively ineffective and potentially counter-productive vehicle for shareholders to express their views on this important subject.
Accordingly, the Board unanimously recommends a vote AGAINST this proposal.
- 18 -
Stock Ownership of Management and Certain Beneficial Owners
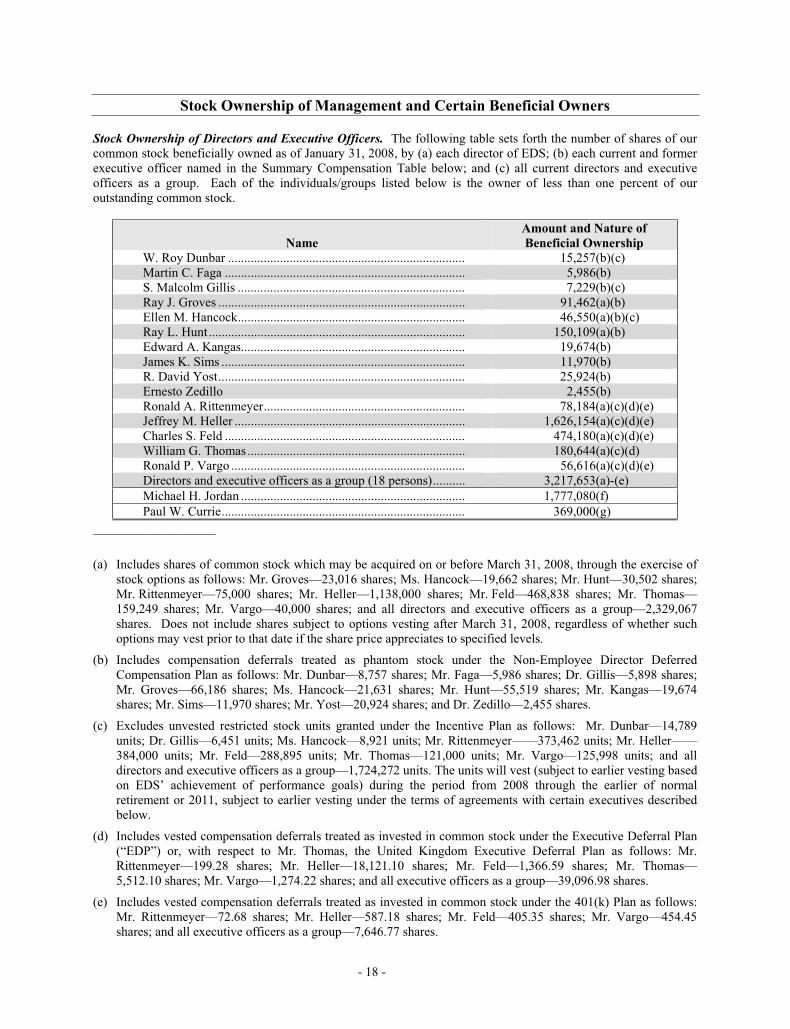
Stock Ownership of Directors and Executive Officers. The following table sets forth the number of shares of our common stock beneficially owned as of January 31, 2008, by (a) each director of EDS; (b) each current and former executive officer named in the Summary Compensation Table below; and (c) all current directors and executive officers as a group. Each of the individuals/groups listed below is the owner of less than one percent of our outstanding common stock.
Name
Amount and Nature of
Beneficial Ownership
W. Roy Dunbar ......................................................................... 15,257(b)(c) Martin C. Faga .......................................................................... 5,986(b) S. Malcolm Gillis ...................................................................... 7,229(b)(c)Ray J. Groves ............................................................................ 91,462(a)(b) Ellen M. Hancock ...................................................................... 46,550(a)(b)(c) Ray L. Hunt ............................................................................... 150,109(a)(b) Edward A. Kangas..................................................................... 19,674(b) James K. Sims ........................................................................... 11,970(b) R. David Yost ............................................................................ 25,924(b) Ernesto Zedillo 2,455(b) Ronald A. Rittenmeyer .............................................................. 78,184(a)(c)(d)(e) Jeffrey M. Heller ....................................................................... 1,626,154(a)(c)(d)(e) Charles S. Feld .......................................................................... 474,180(a)(c)(d)(e) William G. Thomas ................................................................... 180,644(a)(c)(d) Ronald P. Vargo ........................................................................ 56,616(a)(c)(d)(e) Directors and executive officers as a group (18 persons) .......... 3,217,653(a)-(e)
Michael H. Jordan ..................................................................... 1,777,080(f)
Paul W. Currie ........................................................................... 369,000(g)
___________________
(a) Includes shares of common stock which may be acquired on or before March 31, 2008, through the exercise of stock options as follows: Mr. Groves—23,016 shares; Ms. Hancock—19,662 shares; Mr. Hunt—30,502 shares; Mr. Rittenmeyer—75,000 shares; Mr. Heller—1,138,000 shares; Mr. Feld—468,838 shares; Mr. Thomas—159,249 shares; Mr. Vargo—40,000 shares; and all directors and executive officers as a group—2,329,067 shares. Does not include shares subject to options vesting after March 31, 2008, regardless of whether such options may vest prior to that date if the share price appreciates to specified levels.
(b) Includes compensation deferrals treated as phantom stock under the Non-Employee Director Deferred Compensation Plan as follows: Mr. Dunbar—8,757 shares; Mr. Faga—5,986 shares; Dr. Gillis—5,898 shares; Mr. Groves—66,186 shares; Ms. Hancock—21,631 shares; Mr. Hunt—55,519 shares; Mr. Kangas—19,674 shares; Mr. Sims—11,970 shares; Mr. Yost—20,924 shares; and Dr. Zedillo—2,455 shares.
(c) Excludes unvested restricted stock units granted under the Incentive Plan as follows: Mr. Dunbar—14,789 units; Dr. Gillis—6,451 units; Ms. Hancock—8,921 units; Mr. Rittenmeyer——373,462 units; Mr. Heller——384,000 units; Mr. Feld—288,895 units; Mr. Thomas—121,000 units; Mr. Vargo—125,998 units; and all directors and executive officers as a group—1,724,272 units. The units will vest (subject to earlier vesting based on EDS’ achievement of performance goals) during the period from 2008 through the earlier of normal retirement or 2011, subject to earlier vesting under the terms of agreements with certain executives described below.
(d) Includes vested compensation deferrals treated as invested in common stock under the Executive Deferral Plan (“EDP”) or, with respect to Mr. Thomas, the United Kingdom Executive Deferral Plan as follows: Mr. Rittenmeyer—199.28 shares; Mr. Heller—18,121.10 shares; Mr. Feld—1,366.59 shares; Mr. Thomas—5,512.10 shares; Mr. Vargo—1,274.22 shares; and all executive officers as a group—39,096.98 shares.
(e) Includes vested compensation deferrals treated as invested in common stock under the 401(k) Plan as follows: Mr. Rittenmeyer—72.68 shares; Mr. Heller—587.18 shares; Mr. Feld—405.35 shares; Mr. Vargo—454.45 shares; and all executive officers as a group—7,646.77 shares.
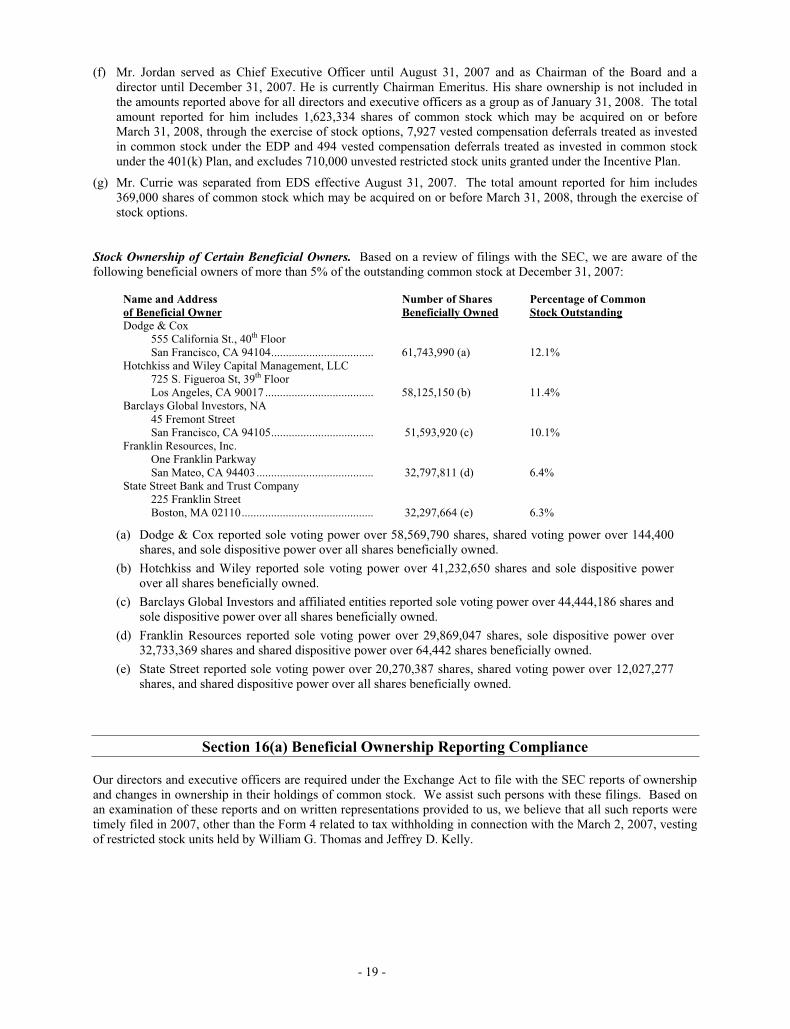
- 19 -
(f) Mr. Jordan served as Chief Executive Officer until August 31, 2007 and as Chairman of the Board and a director until December 31, 2007. He is currently Chairman Emeritus. His share ownership is not included in the amounts reported above for all directors and executive officers as a group as of January 31, 2008. The total amount reported for him includes 1,623,334 shares of common stock which may be acquired on or before March 31, 2008, through the exercise of stock options, 7,927 vested compensation deferrals treated as invested in common stock under the EDP and 494 vested compensation deferrals treated as invested in common stock under the 401(k) Plan, and excludes 710,000 unvested restricted stock units granted under the Incentive Plan.
(g) Mr. Currie was separated from EDS effective August 31, 2007. The total amount reported for him includes 369,000 shares of common stock which may be acquired on or before March 31, 2008, through the exercise of stock options.
Stock Ownership of Certain Beneficial Owners. Based on a review of filings with the SEC, we are aware of the following beneficial owners of more than 5% of the outstanding common stock at December 31, 2007:
Name and Address
of Beneficial Owner
Number of Shares
Beneficially Owned
Percentage of Common
Stock Outstanding
Dodge & Cox 555 California St., 40th Floor San Francisco, CA 94104 ................................... 61,743,990 (a) 12.1%
Hotchkiss and Wiley Capital Management, LLC 725 S. Figueroa St, 39th Floor Los Angeles, CA 90017 ..................................... 58,125,150 (b) 11.4%
Barclays Global Investors, NA 45 Fremont Street San Francisco, CA 94105 ................................... 51,593,920 (c) 10.1%
Franklin Resources, Inc. One Franklin Parkway San Mateo, CA 94403 ........................................ 32,797,811 (d) 6.4%
State Street Bank and Trust Company 225 Franklin Street Boston, MA 02110 ............................................. 32,297,664 (e) 6.3%
(a) Dodge & Cox reported sole voting power over 58,569,790 shares, shared voting power over 144,400 shares, and sole dispositive power over all shares beneficially owned.
(b) Hotchkiss and Wiley reported sole voting power over 41,232,650 shares and sole dispositive power over all shares beneficially owned.
(c) Barclays Global Investors and affiliated entities reported sole voting power over 44,444,186 shares and sole dispositive power over all shares beneficially owned.
(d) Franklin Resources reported sole voting power over 29,869,047 shares, sole dispositive power over 32,733,369 shares and shared dispositive power over 64,442 shares beneficially owned.
(e) State Street reported sole voting power over 20,270,387 shares, shared voting power over 12,027,277 shares, and shared dispositive power over all shares beneficially owned.
Section 16(a) Beneficial Ownership Reporting Compliance
Our directors and executive officers are required under the Exchange Act to file with the SEC reports of ownership and changes in ownership in their holdings of common stock. We assist such persons with these filings. Based on an examination of these reports and on written representations provided to us, we believe that all such reports were timely filed in 2007, other than the Form 4 related to tax withholding in connection with the March 2, 2007, vesting of restricted stock units held by William G. Thomas and Jeffrey D. Kelly.
- 20 -
Non-Employee Director Compensation
Our compensation program for non-employee directors is designed to attract and retain qualified directors by offering compensation that is competitive with other large, global companies and recognizes the time, expertise and accountability required by Board service. Each year, the CBC reviews the current compensation program as well as director compensation data prepared by an external consulting firm. Based upon this review, the CBC recommends to the full Board of Directors what changes, if any, should be made to the director compensation program. The Board must approve any changes to the director compensation program.
Non-employee directors receive an annual cash retainer of $200,000 and an additional $15,000 for serving as chairperson of one of the Board’s three standing committees. No additional fees are paid for attending Board or Board committee meetings. Directors are also reimbursed for travel and out-of-pocket expenses incurred in connection with their service. We do not provide retirement benefits, perquisites or other benefits to non-employee directors. Director compensation is paid at the commencement of each annual director compensation period, which begins at the Annual Meeting of Shareholders in April.
Directors may elect to receive their annual compensation in one or a combination of the following three forms:
� deferral to an interest bearing account and/or a “phantom” EDS stock unit account;
� restricted stock; or
� cash.
Compensation deferred into the interest bearing account earns interest at an annual rate equal to 120% of the applicable federal long-term rate published by the Internal Revenue Service (“IRS”). The number of units/shares granted is determined by dividing 110% of the elected compensation amount by the fair market value (average of the high and low trading prices) of EDS common stock on the date of grant. Compensation deferred into EDS stock units or granted as restricted stock receives a 10% premium to encourage directors to elect EDS equity as a form of compensation. Compensation elected in the form of deferred compensation vests immediately while restricted stock vests ratably over three years. With respect to both stock units and restricted stock, dividend equivalents are awarded at the same time and at the same rate as paid to EDS shareholders. If a director’s service terminates prior to completing 24 months of service (except due to death or disability), a pro-rata portion of cash, deferred compensation and/or restricted stock paid in respect of the compensation year in which the director’s service ended (based on months of service) will be forfeited, or, with respect to cash compensation, returned to EDS. If the director’s service terminated due to death or disability, compensation will not be forfeited and any restricted stock will vest immediately.
A director’s deferred account balance is distributed in cash following separation from the Board. At the director’s election, the account balance can be distributed in a lump sum or annually in either three or five installments beginning on a director’s last day of service. The value of a director’s stock unit account for purposes of distribution is based on the fair market value of EDS common stock on the last day of Board service. This amount is converted to the interest bearing account if a director elects the installment option.
Directors are subject to stock ownership guidelines under which they will be expected to hold EDS equity valued at not less than $400,000 by the later to occur of (i) our Annual Meeting of Shareholders in 2009 or (ii) five years from their election to the Board.
In October 2007, the Board approved certain modifications to the director compensation program beginning with the 2008/2009 director compensation year. In addition to the compensation outlined above, each director will also receive a $50,000 annual equity retainer to be granted in any combination of a restricted stock award or phantom stock units, at the annual election of each director. The chairperson of each of the Board’s three standing committees will also receive an additional $5,000 equity retainer to be granted in any combination of a restricted stock award or phantom stock units, at the election of each director. The Board also approved increasing the stock ownership guidelines for each director from $400,000 ($430,000 for committee chairpersons) to $500,000 ($540,000 for committee chairpersons) effective with the 2008/2009 director compensation year.
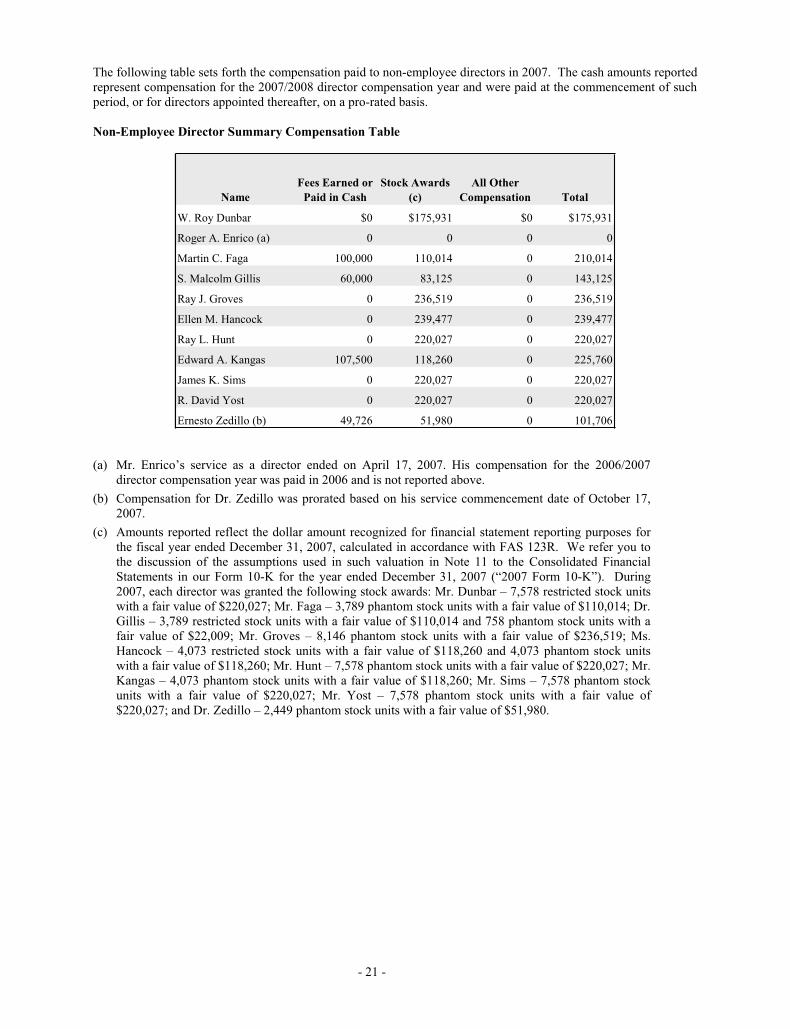
- 21 -
The following table sets forth the compensation paid to non-employee directors in 2007. The cash amounts reported represent compensation for the 2007/2008 director compensation year and were paid at the commencement of such period, or for directors appointed thereafter, on a pro-rated basis.
Non-Employee Director Summary Compensation Table
Name
Fees Earned or
Paid in Cash
Stock Awards
(c)
All Other
Compensation Total
W. Roy Dunbar $0 $175,931 $0 $175,931
Roger A. Enrico (a) 0 0 0 0
Martin C. Faga 100,000 110,014 0 210,014
S. Malcolm Gillis 60,000 83,125 0 143,125
Ray J. Groves 0 236,519 0 236,519
Ellen M. Hancock 0 239,477 0 239,477
Ray L. Hunt 0 220,027 0 220,027
Edward A. Kangas 107,500 118,260 0 225,760
James K. Sims 0 220,027 0 220,027
R. David Yost 0 220,027 0 220,027
Ernesto Zedillo (b) 49,726 51,980 0 101,706
(a) Mr. Enrico’s service as a director ended on April 17, 2007. His compensation for the 2006/2007 director compensation year was paid in 2006 and is not reported above.
(b) Compensation for Dr. Zedillo was prorated based on his service commencement date of October 17, 2007.
(c) Amounts reported reflect the dollar amount recognized for financial statement reporting purposes for the fiscal year ended December 31, 2007, calculated in accordance with FAS 123R. We refer you to the discussion of the assumptions used in such valuation in Note 11 to the Consolidated Financial Statements in our Form 10-K for the year ended December 31, 2007 (“2007 Form 10-K”). During 2007, each director was granted the following stock awards: Mr. Dunbar – 7,578 restricted stock units with a fair value of $220,027; Mr. Faga – 3,789 phantom stock units with a fair value of $110,014; Dr. Gillis – 3,789 restricted stock units with a fair value of $110,014 and 758 phantom stock units with a fair value of $22,009; Mr. Groves – 8,146 phantom stock units with a fair value of $236,519; Ms. Hancock – 4,073 restricted stock units with a fair value of $118,260 and 4,073 phantom stock units with a fair value of $118,260; Mr. Hunt – 7,578 phantom stock units with a fair value of $220,027; Mr. Kangas – 4,073 phantom stock units with a fair value of $118,260; Mr. Sims – 7,578 phantom stock units with a fair value of $220,027; Mr. Yost – 7,578 phantom stock units with a fair value of $220,027; and Dr. Zedillo – 2,449 phantom stock units with a fair value of $51,980.
- 22 -
Executive Compensation
Compensation Discussion and Analysis
Executive Compensation Program Objectives
The primary objectives of our executive compensation program are to attract and retain accomplished and high-potential executives and to motivate those executives to achieve short- and long-term goals with the ultimate objective of creating sustainable improvements in shareholder value. Consistent with that objective, our executive compensation program includes both annual incentive and stock based-compensation that rewards performance as measured against the achievement of short- and long-term goals designed to align executives’ interest with those of our shareholders.
We seek to attract and retain executives by offering total compensation competitive with the market in which we compete for executive talent. We believe that market is broader than the information technology (“IT”) industry in which we operate. Accordingly, the Compensation and Benefits Committee (“CBC”) reviews survey data from two comparator groups furnished by an external consulting firm. One group consists of large global corporations similar in revenue and/or market capitalization to EDS, most of which are outside the IT industry, with a sector weighting similar to the composition of the S&P 500 (“General Industry Comparator Group”). For 2007, this group consisted of 31 companies with median 2006 annual revenues of approximately $28.7 billion. The second group consisted of 21 companies in the IT and related industries with median 2006 annual revenues of approximately $24.0 billion. The CBC reviews these comparator groups annually to ensure they are a representative cross-section of the businesses with which we compete for executive talent, and approves any changes to the companies that comprise each comparator group. For 2007, the list of comparator companies were:
General Industry Comparator Companies Alcoa, Inc. ConocoPhillips Lockheed Martin Ameriprise Financial Countrywide Financial Marriott International Apple Computer Duke Energy McKesson Automatic Data Processing General Motors MetLife Baxter International Hartford Financial Services Motorola Best Buy Hess Nortel Networks Boeing Hewlett-Packard Occidental Petroleum Bristol-Myers Squibb Honeywell International PepsiCo Capital One Financial International Business Machines Prudential Financial Colgate-Palmolive Kellogg SAFECO UnitedHealth Group
Information Technology Comparator Companies Accenture First Data Sprint Nextel Apple Computer Hewlett-Packard Sun Microsystems AT&T International Business Machines Texas Instruments Cisco Systems L-3 Communications Unisys Convergys Microsoft United Technologies Dell Qwest Communications Verizon Communications EMC Siemens Xerox
In October 2007, the CBC reviewed EDS’ comparator groups for 2008 and approved changes in the composition of both groups. Apple Computer, ConocoPhillips, General Motors, Hartford Financial Services, and UnitedHealth Group were removed from the General Industry Comparator Group and replaced with Abbott Laboratories, J.C. Penney, Oracle, Sunoco and Travelers Companies. Apple Computer and First Data were removed from the Information Technology Comparator Group and replaced with Computer Sciences, Intel and Oracle.
The combination of base salary and annual and long-term incentive programs is designed to provide a balanced total compensation opportunity that rewards executives for the quality of both their short- and long-term performance and decisions. The mix of these components is designed to provide competitive levels of fixed compensation (e.g., base salary) with the remaining majority of compensation varying based on company, business unit or individual performance.
To motivate our executives to achieve short- and long-term goals designed to create sustainable shareholder value, we structure our annual bonus and long-term incentive programs to pay above the 50th percentile of the comparator groups when EDS exceeds such goals and below the 50th percentile when these goals are not achieved.
- 23 -
Our annual bonus program is designed to motivate executives to achieve short-term goals established by the CBC by linking the payment of an annual cash bonus to achievement of these goals. For our named executive officers, in 2007 the short-term goals related to earnings per share, free cash flow and revenue. We refer you to the discussion of “Annual Bonus” under “Elements of Compensation” below for a description of the performance goals established for each metric, the relative weightings assigned to each metric, the factors considered by the CBC in establishing such goals for 2007, why we believe the achievement of such goals helps create sustainable shareholder value, and how individual executive performance is used by the CBC to determine actual payouts.
For 2007, our long-term incentive compensation program was designed to motivate executives to achieve long-term goals through the grant of stock options as well as performance-based restricted stock units (“P-RSUs”), the vesting of which is dependent on our achievement of three-year goals approved by the CBC. For the “named executive officers” in the Summary Compensation Table below, the long-term metrics for the 2007 P-RSU grant related to three-year compound annual growth in free cash flow per share, return on net assets and top-line revenue growth for the three-year period that began on January 1, 2007. We refer you to the discussion of “Long-Term Incentive Compensation” under “Elements of Compensation” below for a description of the relative weighting assigned to each metric, the factors considered by the CBC in establishing such goals for the three-year performance period and why we believe the achievement of such goals helps create sustainable shareholder value.
This Compensation Discussion and Analysis sets forth all material factors considered by the CBC in determining executive compensation.
Role of the CBC and Management in Executive Compensation
The CBC determines the total compensation of our CEO and all other executive officers and oversees the design and administration of compensation and benefit plans for all EDS employees. The CBC is responsible for the review, establishment and approval of:
� executive compensation and benefits strategy, programs and policies;
� goals and objectives related to CEO performance, evaluating the CEO’s performance relative to such goals and objectives and approving the CEO’s total compensation based on such performance;
� salary, annual bonus, equity-based compensation and other remuneration for executive officers;
� performance metrics and goals for any performance-based cash or equity incentive compensation plan in which executive officers participate;
� design of all compensation plans that include EDS equity as a component;
� severance agreements for executive officers and change-of-control agreements for any EDS employee;
� significant changes to employee benefit plans; and
� making recommendations to the full Board regarding non-employee director compensation.
During CBC meetings, our internal human resources personnel present topical issues for discussion and education as well as specific recommendations for review. Certain executive officers, including the Chairman, President and CEO, and the Senior Executive Vice President and Chief Administrative Officer, attend a portion of most regularly scheduled CBC meetings, excluding executive sessions. The CBC also obtains input from our legal, finance and tax functions, as appropriate, as well as one or more executive compensation consulting firms regarding matters under consideration. The CBC has delegated to management certain responsibilities related to employee benefit matters. The CBC has formed three management committees that (i) oversee the investment of U.S. retirement plan assets and savings plan investment funds, (ii) approve the design/redesign of any employee benefit plan that does not result in a cost greater than $10 million in net present value over five years, and (iii) administer benefit plans for U.S. employees and former employees, their families and beneficiaries. These three committees are made up of EDS employees and report to the CBC on an annual basis. Additionally, the CBC has delegated to management the ability to periodically grant equity compensation to non-executive officers. These grants are generally for new hires, transitions and promotions and cannot exceed certain levels established by the CBC.
The CBC utilizes two consulting firms for executive compensation matters. Mercer Human Resource Consulting (“Mercer”) has been retained by the CBC for advice in connection with the CBC’s periodic review of the CEO’s compensation. Specifically, the CBC requested Mercer to provide advice and recommendations regarding the compensation of Mr. Jordan for 2007 and Mr. Rittenmeyer for 2008. Prior to 2007, EDS management had retained Mercer for assistance in connection with employee benefit design for certain countries outside the United States. Such projects were completed in 2007. To eliminate any potential conflict of interest, at the request of the CBC, EDS management will no longer retain Mercer for any other consulting engagements (excluding purchases of
- 24 -
compensation surveys for de minimus amounts). The trustees of certain non-United States pension plans, who are independent and not controlled by EDS, may elect to use Mercer for certain administrative functions. Towers Perrin, which has been retained by management, provides survey market data to the CBC and management on competitive pay practices for executives at and above the Vice President level. Towers Perrin also provides EDS management with consulting advice and services related to the ongoing compliance and administration of its retirement plans globally, the design and communication of its health and welfare benefit plans in select countries where EDS has a significant number of employees, and assistance with due diligence for select acquisitions or other employee transitions. Towers Perrin holds a minority interest in ExcellerateHRO LLP, our human resources outsourcing subsidiary.
Elements of Executive Compensation
In addition to health/welfare benefit plans and programs generally available to all employees, our executive compensation program comprises the following principal elements:
� base salary
� annual bonus
� long-term incentive compensation
� perquisites
� deferred compensation/retirement
� executive severance and change-of-control agreements
In allocating between cash and non-cash compensation, and current and long-term compensation, we utilize the 50th
percentile of the comparator groups described above as a guideline. To consider all elements of compensation in total rather than each element in isolation, management has prepared total compensation “tally sheets” for executive officers for annual review by the CBC since 2005. These tally sheets summarize the value of each compensation element (including base salary, annual bonus, long-term incentive awards, deferred compensation, benefits and perquisites) plus the potential cost to EDS and benefit to the executive officers of change-of-control and severance payments. The CBC uses tally sheets to review the reasonableness of each compensation element, gain a holistic view of the total compensation provided to each executive, review the mix of how compensation is delivered, and provide greater equity in compensation among our executive officers. The CBC also reviews elements of the tally sheets during the year as it makes decisions pertaining to base salary adjustments, setting bonus targets, stock awards, and any changes to executive severance and change-of-control agreements.
Base Salary
We utilize the 50th percentile base salary for each comparator group (adjusted using regression analysis to minimize differences in revenues) for comparable positions as a guideline to establish base salaries for executive officers. However, the CBC may establish an executive officer’s base salary higher or lower than the 50th percentile based on a number of factors, including individual performance, relevant experience, job responsibility, time interval since the last salary adjustment, the weight placed on base salary versus long-term incentive compensation and the executive officer’s salary as compared internally. For example, when Mr. Jordan transitioned from Chairman and Chief Executive Officer to executive Chairman in September 2007, and then to Chairman Emeritus at the end of 2007, the CBC did not adjust his base salary at that time in light of the CBC’s expectations regarding his continued role and plans to significantly reduce other elements of his compensation going forward. However, the CBC will review Mr. Jordan’s base salary again in 2008.
Base salaries are generally reviewed annually during the first quarter and at other times if an executive officer’s responsibilities have materially changed. For example, Mr. Rittenmeyer’s base salary was reviewed and increased in connection with his September 2007 appointment as Chief Executive Officer. Messrs. Vargo, Thomas and Currie received base salary increases effective April 1, 2007, to more closely align with the 50th percentile base salary for comparable executives at our comparator companies. Mr. Vargo’s salary increased from $500,000 to $600,000, Mr. Thomas’ reference salary increased from £335,000 to £370,000 and Mr. Currie’s salary increased from CAD 640,000 to CAD 675,000 No other named executive officer received a base salary increase during 2007.
While we recognize performance-based compensation, such as annual bonus and long-term incentive compensation, more effectively motivates executive officers to achieve corporate goals, we believe the base salary element of total compensation is critical to attract and retain executive talent.
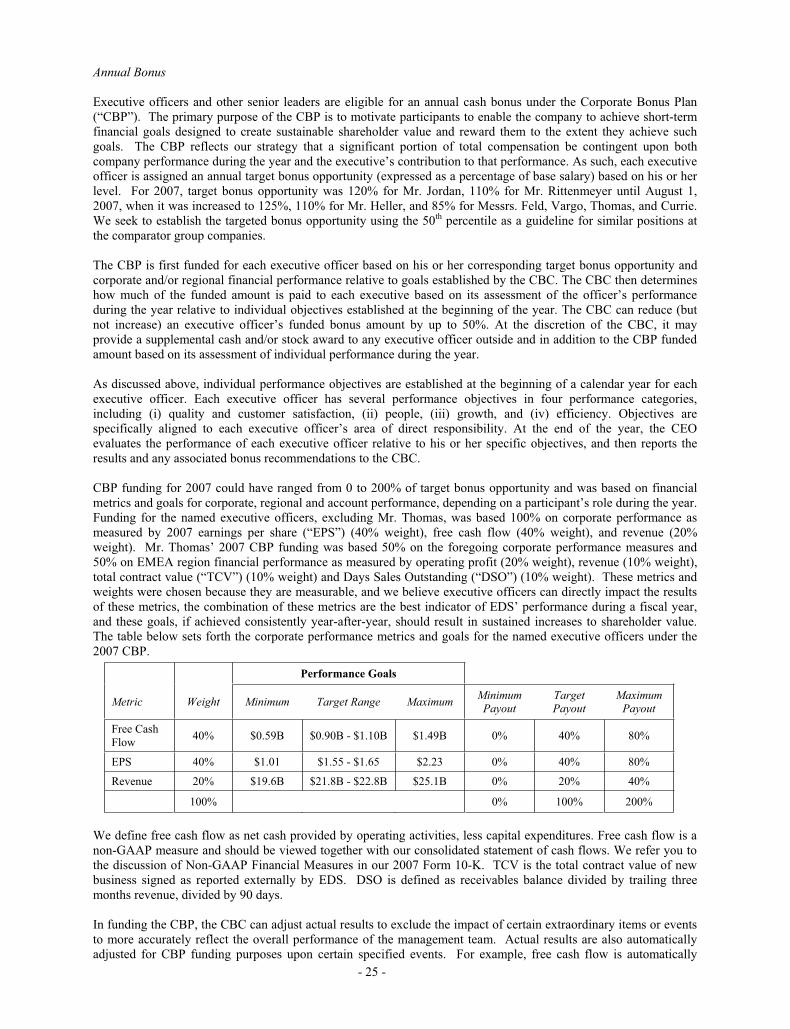
- 25 -
Annual Bonus
Executive officers and other senior leaders are eligible for an annual cash bonus under the Corporate Bonus Plan (“CBP”). The primary purpose of the CBP is to motivate participants to enable the company to achieve short-term financial goals designed to create sustainable shareholder value and reward them to the extent they achieve such goals. The CBP reflects our strategy that a significant portion of total compensation be contingent upon both company performance during the year and the executive’s contribution to that performance. As such, each executive officer is assigned an annual target bonus opportunity (expressed as a percentage of base salary) based on his or her level. For 2007, target bonus opportunity was 120% for Mr. Jordan, 110% for Mr. Rittenmeyer until August 1, 2007, when it was increased to 125%, 110% for Mr. Heller, and 85% for Messrs. Feld, Vargo, Thomas, and Currie. We seek to establish the targeted bonus opportunity using the 50th percentile as a guideline for similar positions at the comparator group companies.
The CBP is first funded for each executive officer based on his or her corresponding target bonus opportunity and corporate and/or regional financial performance relative to goals established by the CBC. The CBC then determines how much of the funded amount is paid to each executive based on its assessment of the officer’s performance during the year relative to individual objectives established at the beginning of the year. The CBC can reduce (but not increase) an executive officer’s funded bonus amount by up to 50%. At the discretion of the CBC, it may provide a supplemental cash and/or stock award to any executive officer outside and in addition to the CBP funded amount based on its assessment of individual performance during the year.
As discussed above, individual performance objectives are established at the beginning of a calendar year for each executive officer. Each executive officer has several performance objectives in four performance categories, including (i) quality and customer satisfaction, (ii) people, (iii) growth, and (iv) efficiency. Objectives are specifically aligned to each executive officer’s area of direct responsibility. At the end of the year, the CEO evaluates the performance of each executive officer relative to his or her specific objectives, and then reports the results and any associated bonus recommendations to the CBC.
CBP funding for 2007 could have ranged from 0 to 200% of target bonus opportunity and was based on financial metrics and goals for corporate, regional and account performance, depending on a participant’s role during the year. Funding for the named executive officers, excluding Mr. Thomas, was based 100% on corporate performance as measured by 2007 earnings per share (“EPS”) (40% weight), free cash flow (40% weight), and revenue (20% weight). Mr. Thomas’ 2007 CBP funding was based 50% on the foregoing corporate performance measures and 50% on EMEA region financial performance as measured by operating profit (20% weight), revenue (10% weight), total contract value (“TCV”) (10% weight) and Days Sales Outstanding (“DSO”) (10% weight). These metrics and weights were chosen because they are measurable, and we believe executive officers can directly impact the results of these metrics, the combination of these metrics are the best indicator of EDS’ performance during a fiscal year, and these goals, if achieved consistently year-after-year, should result in sustained increases to shareholder value. The table below sets forth the corporate performance metrics and goals for the named executive officers under the 2007 CBP.
Performance Goals
Metric Weight Minimum Target Range Maximum MinimumPayout
TargetPayout
MaximumPayout
Free Cash Flow
40% $0.59B $0.90B - $1.10B $1.49B 0% 40% 80%
EPS 40% $1.01 $1.55 - $1.65 $2.23 0% 40% 80%
Revenue 20% $19.6B $21.8B - $22.8B $25.1B 0% 20% 40%
100% 0% 100% 200%
We define free cash flow as net cash provided by operating activities, less capital expenditures. Free cash flow is a non-GAAP measure and should be viewed together with our consolidated statement of cash flows. We refer you to the discussion of Non-GAAP Financial Measures in our 2007 Form 10-K. TCV is the total contract value of new business signed as reported externally by EDS. DSO is defined as receivables balance divided by trailing three months revenue, divided by 90 days.
In funding the CBP, the CBC can adjust actual results to exclude the impact of certain extraordinary items or events to more accurately reflect the overall performance of the management team. Actual results are also automatically adjusted for CBP funding purposes upon certain specified events. For example, free cash flow is automatically
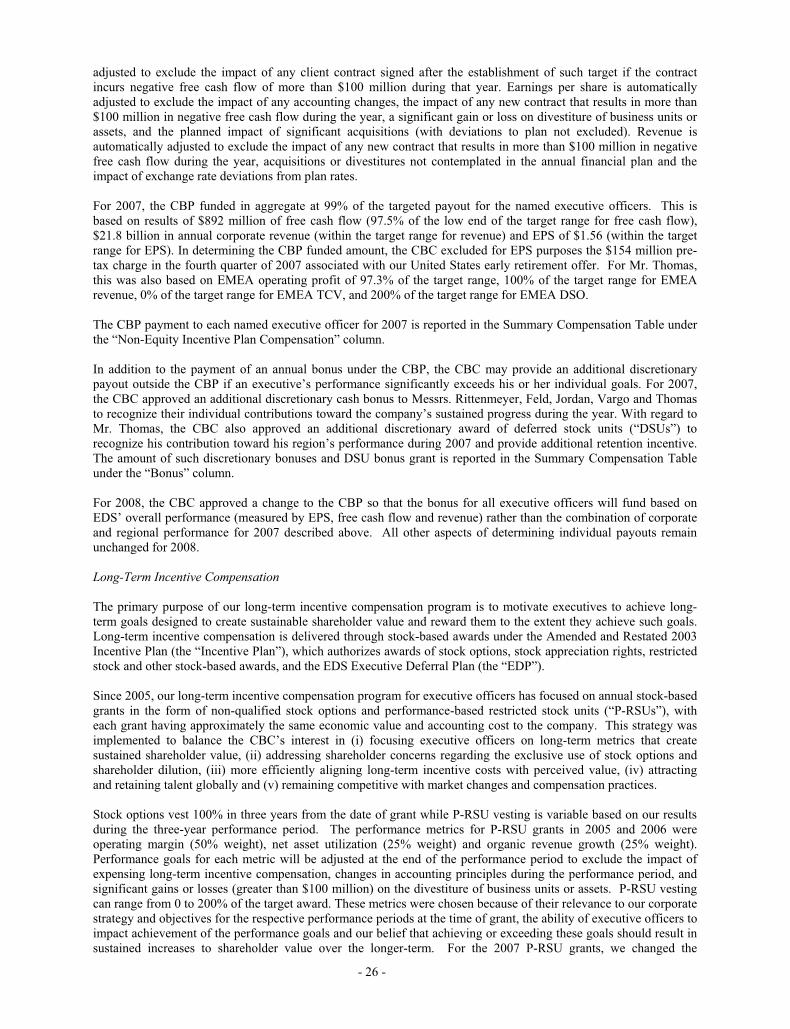
- 26 -
adjusted to exclude the impact of any client contract signed after the establishment of such target if the contract incurs negative free cash flow of more than $100 million during that year. Earnings per share is automatically adjusted to exclude the impact of any accounting changes, the impact of any new contract that results in more than $100 million in negative free cash flow during the year, a significant gain or loss on divestiture of business units or assets, and the planned impact of significant acquisitions (with deviations to plan not excluded). Revenue is automatically adjusted to exclude the impact of any new contract that results in more than $100 million in negative free cash flow during the year, acquisitions or divestitures not contemplated in the annual financial plan and the impact of exchange rate deviations from plan rates.
For 2007, the CBP funded in aggregate at 99% of the targeted payout for the named executive officers. This is based on results of $892 million of free cash flow (97.5% of the low end of the target range for free cash flow), $21.8 billion in annual corporate revenue (within the target range for revenue) and EPS of $1.56 (within the target range for EPS). In determining the CBP funded amount, the CBC excluded for EPS purposes the $154 million pre-tax charge in the fourth quarter of 2007 associated with our United States early retirement offer. For Mr. Thomas, this was also based on EMEA operating profit of 97.3% of the target range, 100% of the target range for EMEA revenue, 0% of the target range for EMEA TCV, and 200% of the target range for EMEA DSO.
The CBP payment to each named executive officer for 2007 is reported in the Summary Compensation Table under the “Non-Equity Incentive Plan Compensation” column.
In addition to the payment of an annual bonus under the CBP, the CBC may provide an additional discretionary payout outside the CBP if an executive’s performance significantly exceeds his or her individual goals. For 2007, the CBC approved an additional discretionary cash bonus to Messrs. Rittenmeyer, Feld, Jordan, Vargo and Thomas to recognize their individual contributions toward the company’s sustained progress during the year. With regard to Mr. Thomas, the CBC also approved an additional discretionary award of deferred stock units (“DSUs”) to recognize his contribution toward his region’s performance during 2007 and provide additional retention incentive. The amount of such discretionary bonuses and DSU bonus grant is reported in the Summary Compensation Table under the “Bonus” column.
For 2008, the CBC approved a change to the CBP so that the bonus for all executive officers will fund based on EDS’ overall performance (measured by EPS, free cash flow and revenue) rather than the combination of corporate and regional performance for 2007 described above. All other aspects of determining individual payouts remain unchanged for 2008.
Long-Term Incentive Compensation
The primary purpose of our long-term incentive compensation program is to motivate executives to achieve long-term goals designed to create sustainable shareholder value and reward them to the extent they achieve such goals. Long-term incentive compensation is delivered through stock-based awards under the Amended and Restated 2003 Incentive Plan (the “Incentive Plan”), which authorizes awards of stock options, stock appreciation rights, restricted stock and other stock-based awards, and the EDS Executive Deferral Plan (the “EDP”).
Since 2005, our long-term incentive compensation program for executive officers has focused on annual stock-based grants in the form of non-qualified stock options and performance-based restricted stock units (“P-RSUs”), with each grant having approximately the same economic value and accounting cost to the company. This strategy was implemented to balance the CBC’s interest in (i) focusing executive officers on long-term metrics that create sustained shareholder value, (ii) addressing shareholder concerns regarding the exclusive use of stock options and shareholder dilution, (iii) more efficiently aligning long-term incentive costs with perceived value, (iv) attracting and retaining talent globally and (v) remaining competitive with market changes and compensation practices.
Stock options vest 100% in three years from the date of grant while P-RSU vesting is variable based on our results during the three-year performance period. The performance metrics for P-RSU grants in 2005 and 2006 were operating margin (50% weight), net asset utilization (25% weight) and organic revenue growth (25% weight). Performance goals for each metric will be adjusted at the end of the performance period to exclude the impact of expensing long-term incentive compensation, changes in accounting principles during the performance period, and significant gains or losses (greater than $100 million) on the divestiture of business units or assets. P-RSU vesting can range from 0 to 200% of the target award. These metrics were chosen because of their relevance to our corporate strategy and objectives for the respective performance periods at the time of grant, the ability of executive officers to impact achievement of the performance goals and our belief that achieving or exceeding these goals should result in sustained increases to shareholder value over the longer-term. For the 2007 P-RSU grants, we changed the
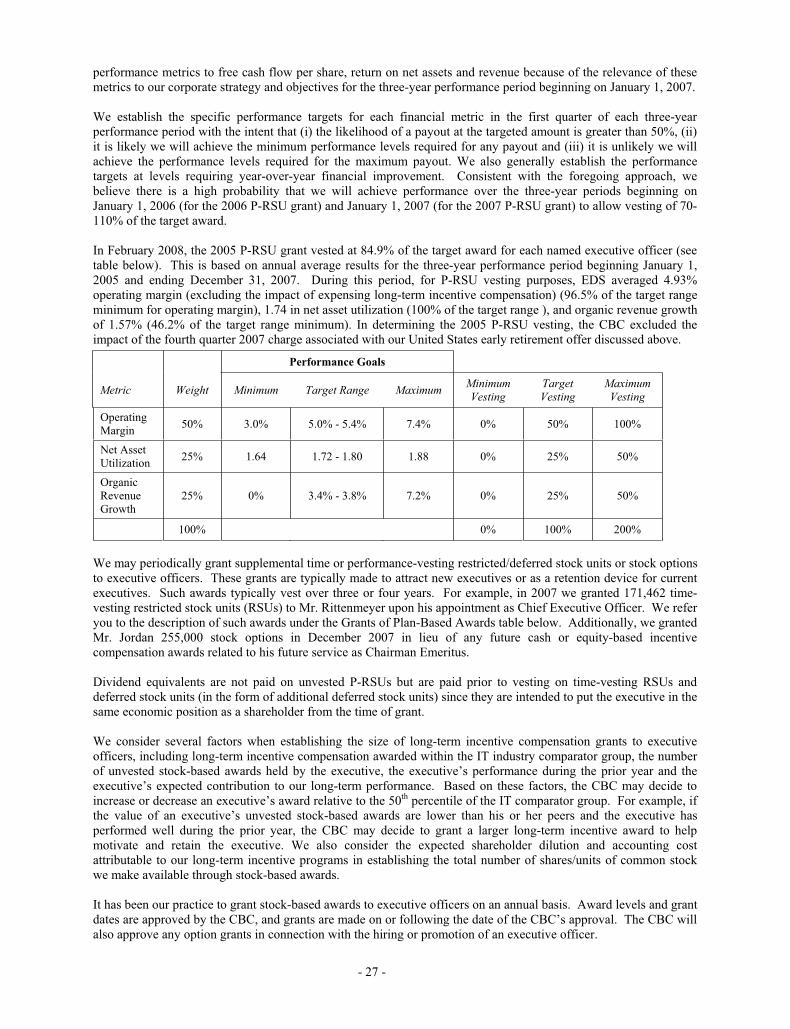
- 27 -
performance metrics to free cash flow per share, return on net assets and revenue because of the relevance of these metrics to our corporate strategy and objectives for the three-year performance period beginning on January 1, 2007.
We establish the specific performance targets for each financial metric in the first quarter of each three-year performance period with the intent that (i) the likelihood of a payout at the targeted amount is greater than 50%, (ii) it is likely we will achieve the minimum performance levels required for any payout and (iii) it is unlikely we will achieve the performance levels required for the maximum payout. We also generally establish the performance targets at levels requiring year-over-year financial improvement. Consistent with the foregoing approach, we believe there is a high probability that we will achieve performance over the three-year periods beginning on January 1, 2006 (for the 2006 P-RSU grant) and January 1, 2007 (for the 2007 P-RSU grant) to allow vesting of 70-110% of the target award.
In February 2008, the 2005 P-RSU grant vested at 84.9% of the target award for each named executive officer (see table below). This is based on annual average results for the three-year performance period beginning January 1, 2005 and ending December 31, 2007. During this period, for P-RSU vesting purposes, EDS averaged 4.93% operating margin (excluding the impact of expensing long-term incentive compensation) (96.5% of the target range minimum for operating margin), 1.74 in net asset utilization (100% of the target range ), and organic revenue growth of 1.57% (46.2% of the target range minimum). In determining the 2005 P-RSU vesting, the CBC excluded the impact of the fourth quarter 2007 charge associated with our United States early retirement offer discussed above.
Performance Goals
Metric Weight Minimum Target Range Maximum MinimumVesting
TargetVesting
MaximumVesting
Operating Margin
50% 3.0% 5.0% - 5.4% 7.4% 0% 50% 100%
Net Asset Utilization
25% 1.64 1.72 - 1.80 1.88 0% 25% 50%
OrganicRevenueGrowth
25% 0% 3.4% - 3.8% 7.2% 0% 25% 50%
100% 0% 100% 200%
We may periodically grant supplemental time or performance-vesting restricted/deferred stock units or stock options to executive officers. These grants are typically made to attract new executives or as a retention device for current executives. Such awards typically vest over three or four years. For example, in 2007 we granted 171,462 time-vesting restricted stock units (RSUs) to Mr. Rittenmeyer upon his appointment as Chief Executive Officer. We refer you to the description of such awards under the Grants of Plan-Based Awards table below. Additionally, we granted Mr. Jordan 255,000 stock options in December 2007 in lieu of any future cash or equity-based incentivecompensation awards related to his future service as Chairman Emeritus.
Dividend equivalents are not paid on unvested P-RSUs but are paid prior to vesting on time-vesting RSUs and deferred stock units (in the form of additional deferred stock units) since they are intended to put the executive in the same economic position as a shareholder from the time of grant.
We consider several factors when establishing the size of long-term incentive compensation grants to executive officers, including long-term incentive compensation awarded within the IT industry comparator group, the number of unvested stock-based awards held by the executive, the executive’s performance during the prior year and the executive’s expected contribution to our long-term performance. Based on these factors, the CBC may decide to increase or decrease an executive’s award relative to the 50th percentile of the IT comparator group. For example, if the value of an executive’s unvested stock-based awards are lower than his or her peers and the executive has performed well during the prior year, the CBC may decide to grant a larger long-term incentive award to help motivate and retain the executive. We also consider the expected shareholder dilution and accounting cost attributable to our long-term incentive programs in establishing the total number of shares/units of common stock we make available through stock-based awards.
It has been our practice to grant stock-based awards to executive officers on an annual basis. Award levels and grant dates are approved by the CBC, and grants are made on or following the date of the CBC’s approval. The CBC will also approve any option grants in connection with the hiring or promotion of an executive officer.
- 28 -
Prior to 2008, we generally granted annual stock-based awards to executive officers on March 15 of each year, with CBC approval of such awards at its regularly scheduled meeting in February. The annual stock option grants have an exercise price equal to the average of the high and low trading prices of our common stock on the date of grant. Grants outside of the annual award process, such as grants to a newly hired or promoted executive officer, generally occur on the first trading day of the month following the date of the hiring or promotion. Stock option grants outside of the annual award process also have an exercise price equal to the average of the high and low trading prices of our common stock on the date of grant.
For 2008, the CBC approved establishment of the annual grant at seven calendar days following the release of full-year earnings. This change was made to more closely align the timing of the annual grant with our annual compensation actions, such as individual performance reviews, base salary increases and annual bonus payments. In addition, the CBC modified the long-term incentive program design to: (i) award the restricted stock unit portion (intended to represent one-half of the total 2008 long-term incentive award value) in equal number of P-RSUs (with a 0-300% vesting opportunity) and time-vesting RSUs (vesting equally over three years); (ii) eliminate the required holding period following vesting of P-RSUs; (iii) eliminate the requirement that any exercise of stock options within 12 months of vesting be for shares only and that such shares be held for such 12-month period, and (iv) provide for accelerated vesting of all equity awards (including DSUs), including awards granted prior to 2008, in the event of an employee’s death or total disability.
Deferred Compensation
The EDP, a non-qualified deferred compensation plan, provides executive officers and other eligible employees the ability to defer base salary and annual bonus compensation into deferred stock units or a fixed income accumulation account. The purpose of this plan is to allow executives the opportunity to accumulate additional ownership of EDS equity, provide a tax-efficient way to defer compensation to future years, and make up for any company match not made in respect of the executive’s 401(k) plan contributions due to IRS limitations.
Retirement
The named executive officers, excluding Mr. Thomas, participate in the same tax-qualified defined benefit retirement plan, the Amended and Restated EDS Retirement Plan (“Retirement Plan”), as other U.S. employees. They also participate in the EDS Benefit Restoration Plan (the “Restoration Plan”), a non-qualified and unfunded retirement plan intended to pay benefits to employees whose benefits under the Retirement Plan are reduced due to certain IRS limitations. Mr. Thomas participates in the U.K. Retirement Plan, a contributory defined benefit retirement plan that was closed to new employees in 2003. The portion of the benefit above the government imposed limits is paid by the company and has been included in the values shown in this disclosure.
We also provide a Supplemental Executive Retirement Plan (“SERP”) to three named executive officers (Messrs. Rittenmeyer, Heller and Feld). The SERP, a non-qualified unfunded retirement plan, is intended to provide a target retirement income based on final average earnings (base salary plus bonus) during a 60 consecutive month period prior to retirement, offset by benefits under the Retirement Plan and Restoration Plan. The SERP was established several years ago to provide competitive retirement income benefits and to retain certain key employees. In 2005, in response to changes in comparator company practices, the CBC approved a policy under which no new participants could be added to the SERP without its approval. The CBC also expressed its intent to not approve new SERP participants except in extraordinary new-hire or retention situations.
The CBC may approve the award of additional years of service to an executive officer for the calculation of benefits and vesting purposes under the SERP. For example, we agreed to provide to Mr. Rittenmeyer an enhanced benefit as an inducement of employment and to make up for retirement benefits and economic value forfeited as a result of his joining the company. Prior to his becoming an executive officer, we agreed to provide Mr. Thomas with an unreduced retirement income benefit in the event he is involuntarily terminated (other than for cause) or upon retirement after he attains the age of 50. We refer you to the discussion of these agreements under “Pension Benefits” below.
Perquisites
We make available four primary perquisites for executive officers: personal use of aircraft; a car and driver for transportation (for Messrs. Jordan, Rittenmeyer and Thomas); financial counseling and tax preparation services; and annual physicals. For Messrs. Jordan and Rittenmeyer, the CBC has approved the use of corporate aircraft for all personal air travel and the use of a company provided car and driver for ground travel in the Dallas area to facilitate
- 29 -
their personal travel in as safe a manner as possible and with the most efficient use of their time. The CBC has delegated to the CEO the authority to approve all requests for personal air travel for other executive officers. We offer an Executive Physical Program that reimburses executive officers for the cost of an annual physical, up to $1,500. This benefit is provided to encourage executives to focus on their physical health and well-being. We also offer an Executive Financial Counseling Program which provides an annual allowance of up to $15,000 in the first year and $10,000 in subsequent years for financial counseling, plus reimbursement for tax preparation services. Thisprogram is intended to maximize the value of compensation provided by EDS and minimize an executive’s time spent managing personal affairs. Executives do not receive a “gross-up” payment for any taxes associated with perquisites.
With the exception of personal use of aircraft, the value of which is highly dependent on an executive officer’s usage, perquisites are intended to be competitive with comparator company practices. The CBC considers the total value of perquisites when establishing the amounts of other forms of compensation.
Executive Severance and Change-of-Control Agreements
We have entered into an Executive Severance Benefit Agreement with each named executive officer other than Messrs. Jordan and Heller, and a Change-of-Control Employment Agreement with each named executive officer. An executive entitled to receive benefits following a termination of employment under an Executive Severance Benefit Agreement or a Change-of-Control Employment Agreement would receive benefits under the agreement providing the greater benefits, but not under both agreements. We believe these agreements enable us to retain executive officers during times of unforeseen events when the executive’s future is uncertain but continued employment of the executive may be necessary for the company. We also believe it is beneficial to have agreements in place that specify the exact terms and benefits an executive receives if we elect to separate an executive officer from the company involuntarily.
The agreements with named executive officers include an expiration or “sunset” date which may not be extended without CBC approval. Benefits payable under these agreements are benchmarked periodically, including prior to any extension, relative to comparator company practices. We periodically review the prevalence of severance and change-of-control agreements among our comparator groups’ executives as well as the provisions of such agreements to benchmark the competitiveness of EDS’ agreements. Specifically, we review the cash severance multiple, equity vesting provisions, benefit continuation practices, excise tax gross-up prevalence, and the length of the protection period in the event of a change of control. Based upon our review, we believe our agreements are generally consistent with those of our comparator groups. In July 2007, the CBC approved certain modifications to the Executive Severance Benefit Agreements and Change-of-Control Agreements in order to comply with Internal Revenue Code Section 409A. Additionally, in December 2007, the CBC approved modifications to Mr. Jordan’s Change-of-Control Agreement to eliminate the cash severance component. Given Mr. Jordan’s reduced role, the CBC and Mr. Jordan believed it was appropriate to reduce his benefits in the event of a change of control.
The CBC has established a policy requiring shareholder approval before we can agree to provide a separation benefit to an executive officer that exceeds 2.99 times annual base salary plus target bonus. Prior to July 2007, this limitation applied to cash severance and the present value of retirement/fringe benefits in excess of what would normally be provided to all employees. The value of continued or accelerated vesting of stock-based awards is not subject to this limit. In July 2007, the CBC amended this limitation by also excluding any tax cost to the executive associated with complying with Section 409A and any income tax gross-up associated with Section 409A and Section 280G under the Change-of-Control Employment Agreements and Executive Severance Benefit Agreements.
Additional information regarding the terms of the Executive Severance Benefit and Change-of-Control Employment Agreements with the named executive officers, including estimates of the amounts payable under such agreements assuming termination of employment as of December 31, 2007, is set forth under the heading “Agreements Related to Potential Payments Upon Termination or Change-of-Control” below.
Policy on Stock Trading and Hedging
We have in place a pre-clearance process for trades in EDS securities which all executive officers must follow. Executive officers and other insiders are also prohibited from engaging in any transaction involving a put, call or other option on EDS securities (other than exercises of an option granted under an EDS incentive plan) at any time.
- 30 -
Stock Ownership Guidelines
Executive officers are subject to stock ownership guidelines under which they will be expected to hold EDS equity valued at not less than the following amount (expressed as a multiple of annual base salary) by the later of (i) December 31, 2008, or (ii) five years from an executive’s change of level.
Executive Level Stock Ownership Guideline
Chairman, President & CEO/Vice Chairman
5x annual base salary
Senior Executive Vice President/Executive Vice President
3x annual base salary
Senior Vice President/
Vice President & General Manager
2x annual base salary
Vice President (Level 3) 1x annual base salary
All forms of direct and indirect ownership are included in determining stock ownership, including shares held outright, unvested restricted stock units, vested and unvested deferred stock units, and units held in a 401(k) account. As of December 31, 2007, all named executive officers had sufficient ownership to achieve the relevant stock ownership multiple.
Recovery of Incentive Compensation in the Event of a Financial Restatement
The CBC does not have a policy that would recover cash or equity compensation received by an executive officer if the company’s performance upon which the payments were based is adjusted or restated and the adjusted performance would have resulted in reduced compensation. However, the CBC would consider any such event when making future compensation decisions for executive officers who continue to be employed by the company.
Section 162(m) Compliance
We generally seek to grant stock options and establish performance goals under our bonus and long-term incentive compensation plans in a manner that qualifies as “performance-based” under Section 162(m) of the Internal Revenue Code, which provides that we may not deduct compensation of more than $1 million paid to certain individuals. However, certain forms and amounts of compensation may not be performance-based and may result in our exceeding the $1 million deduction limitation from year to year, including time-vesting RSUs, any cash bonus outside of the CBP, and base salary in excess of $1 million.
The $1 million performance-based level was exceeded in 2007 with respect to each of the former Chairman, the Chairman, President and Chief Executive Officer, the Vice Chairman, the Senior Executive Vice President, Applications Services, and the Executive Vice President, EMEA, principally as a result of (i) the additional discretionary bonus paid outside the CBP described above, (ii) the vesting of restricted stock units (see ”Stock Option Exercises and Restricted Stock Vesting” table below) and (iii) for the Senior Executive Vice President, Applications Services, a retention payment made in 2007 related to EDS’ acquisition of The Feld Group.
Report of the Compensation and Benefits Committee
The Compensation and Benefits Committee reviewed and discussed with management of EDS the foregoing Compensation Discussion and Analysis. Based on such review and discussion, the Compensation and Benefits Committee has recommended to the Board of Directors that the Compensation Discussion and Analysis be included in this proxy statement and in EDS’ Annual Report on Form 10-K for the year ended December 31, 2007.
Compensation and Benefits Committee
Ellen M. Hancock, Chair Martin C. Faga James K. Sims R. David Yost
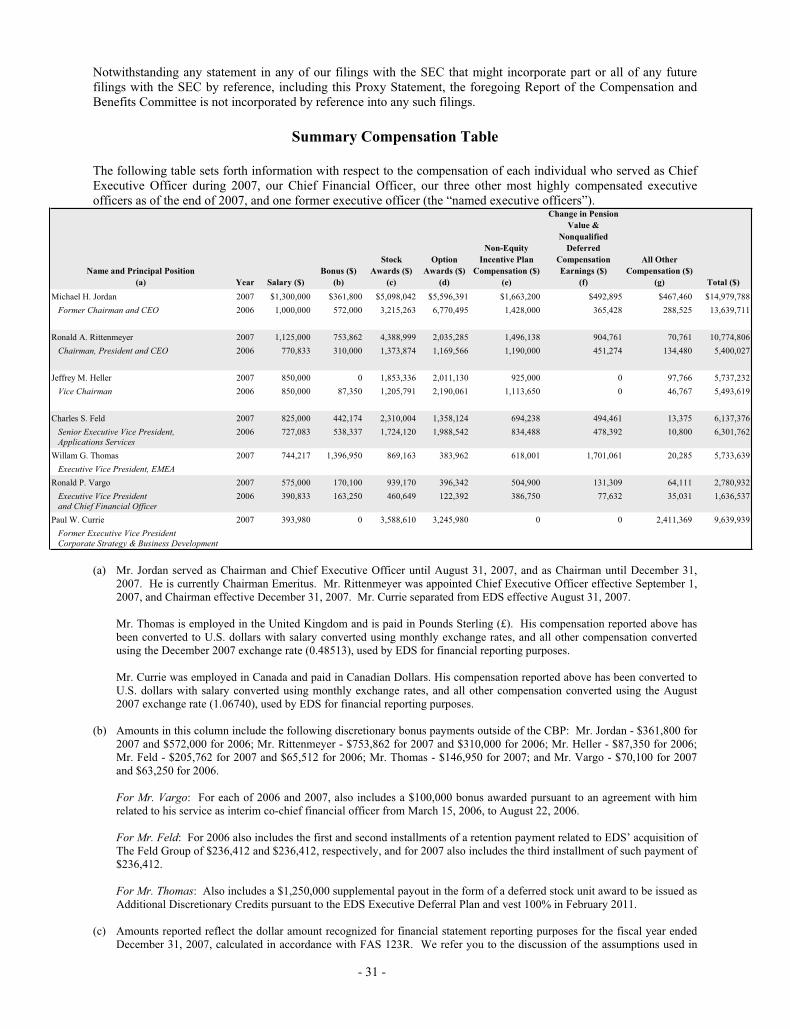
- 31 -
Notwithstanding any statement in any of our filings with the SEC that might incorporate part or all of any future filings with the SEC by reference, including this Proxy Statement, the foregoing Report of the Compensation and Benefits Committee is not incorporated by reference into any such filings.
Summary Compensation Table
The following table sets forth information with respect to the compensation of each individual who served as Chief Executive Officer during 2007, our Chief Financial Officer, our three other most highly compensated executive officers as of the end of 2007, and one former executive officer (the “named executive officers”).
Name and Principal Position
(a) Year Salary ($)
Bonus ($)
(b)
Stock
Awards ($)
(c)
Option
Awards ($)
(d)
Non-Equity
Incentive Plan
Compensation ($)
(e)
Change in Pension
Value &
Nonqualified
Deferred
Compensation
Earnings ($)
(f)
All Other
Compensation ($)
(g) Total ($)
Michael H. Jordan 2007 $1,300,000 $361,800 $5,098,042 $5,596,391 $1,663,200 $492,895 $467,460 $14,979,788
Former Chairman and CEO 2006 1,000,000 572,000 3,215,263 6,770,495 1,428,000 365,428 288,525 13,639,711
Ronald A. Rittenmeyer 2007 1,125,000 753,862 4,388,999 2,035,285 1,496,138 904,761 70,761 10,774,806
Chairman, President and CEO 2006 770,833 310,000 1,373,874 1,169,566 1,190,000 451,274 134,480 5,400,027
Jeffrey M. Heller 2007 850,000 0 1,853,336 2,011,130 925,000 0 97,766 5,737,232
Vice Chairman 2006 850,000 87,350 1,205,791 2,190,061 1,113,650 0 46,767 5,493,619
Charles S. Feld 2007 825,000 442,174 2,310,004 1,358,124 694,238 494,461 13,375 6,137,376
Senior Executive Vice President, 2006 727,083 538,337 1,724,120 1,988,542 834,488 478,392 10,800 6,301,762 Applications ServicesWillam G. Thomas 2007 744,217 1,396,950 869,163 383,962 618,001 1,701,061 20,285 5,733,639
Executive Vice President, EMEARonald P. Vargo 2007 575,000 170,100 939,170 396,342 504,900 131,309 64,111 2,780,932
Executive Vice President 2006 390,833 163,250 460,649 122,392 386,750 77,632 35,031 1,636,537 and Chief Financial OfficerPaul W. Currie 2007 393,980 0 3,588,610 3,245,980 0 0 2,411,369 9,639,939
Former Executive Vice President Corporate Strategy & Business Development
(a) Mr. Jordan served as Chairman and Chief Executive Officer until August 31, 2007, and as Chairman until December 31, 2007. He is currently Chairman Emeritus. Mr. Rittenmeyer was appointed Chief Executive Officer effective September 1, 2007, and Chairman effective December 31, 2007. Mr. Currie separated from EDS effective August 31, 2007.
Mr. Thomas is employed in the United Kingdom and is paid in Pounds Sterling (£). His compensation reported above has been converted to U.S. dollars with salary converted using monthly exchange rates, and all other compensation converted using the December 2007 exchange rate (0.48513), used by EDS for financial reporting purposes.
Mr. Currie was employed in Canada and paid in Canadian Dollars. His compensation reported above has been converted to U.S. dollars with salary converted using monthly exchange rates, and all other compensation converted using the August 2007 exchange rate (1.06740), used by EDS for financial reporting purposes.
(b) Amounts in this column include the following discretionary bonus payments outside of the CBP: Mr. Jordan - $361,800 for 2007 and $572,000 for 2006; Mr. Rittenmeyer - $753,862 for 2007 and $310,000 for 2006; Mr. Heller - $87,350 for 2006; Mr. Feld - $205,762 for 2007 and $65,512 for 2006; Mr. Thomas - $146,950 for 2007; and Mr. Vargo - $70,100 for 2007 and $63,250 for 2006.
For Mr. Vargo: For each of 2006 and 2007, also includes a $100,000 bonus awarded pursuant to an agreement with him related to his service as interim co-chief financial officer from March 15, 2006, to August 22, 2006.
For Mr. Feld: For 2006 also includes the first and second installments of a retention payment related to EDS’ acquisition of The Feld Group of $236,412 and $236,412, respectively, and for 2007 also includes the third installment of such payment of $236,412.
For Mr. Thomas: Also includes a $1,250,000 supplemental payout in the form of a deferred stock unit award to be issued as Additional Discretionary Credits pursuant to the EDS Executive Deferral Plan and vest 100% in February 2011.
(c) Amounts reported reflect the dollar amount recognized for financial statement reporting purposes for the fiscal year ended December 31, 2007, calculated in accordance with FAS 123R. We refer you to the discussion of the assumptions used in
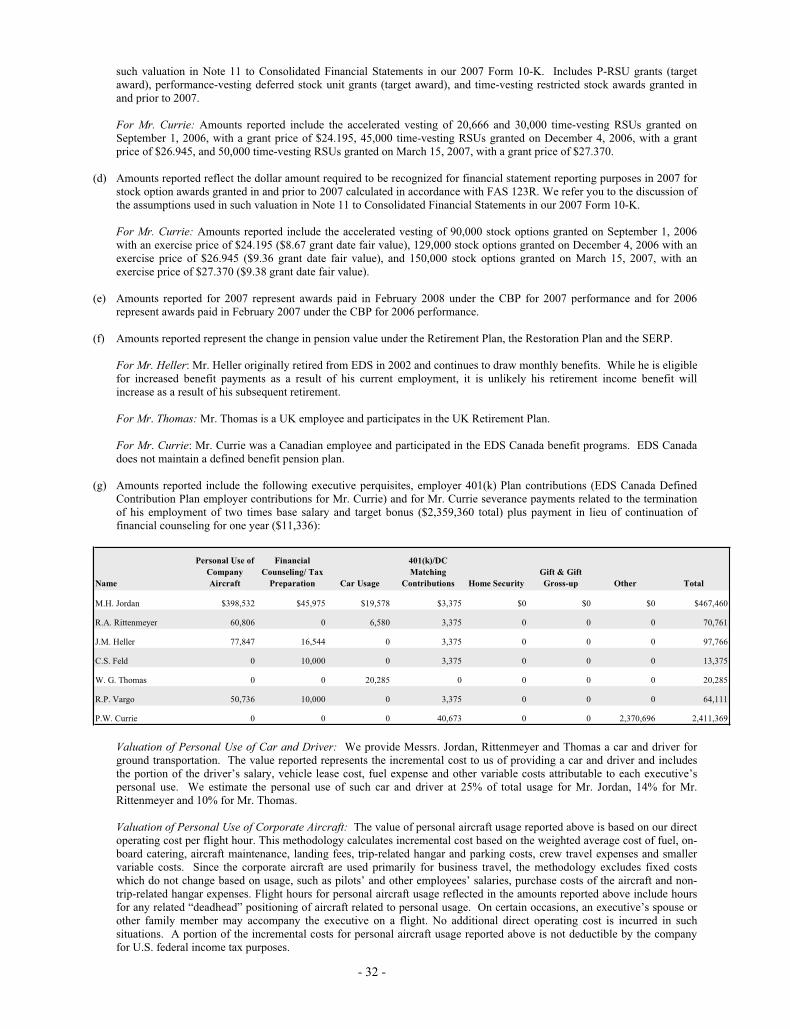
- 32 -
such valuation in Note 11 to Consolidated Financial Statements in our 2007 Form 10-K. Includes P-RSU grants (target award), performance-vesting deferred stock unit grants (target award), and time-vesting restricted stock awards granted in and prior to 2007.
For Mr. Currie: Amounts reported include the accelerated vesting of 20,666 and 30,000 time-vesting RSUs granted on September 1, 2006, with a grant price of $24.195, 45,000 time-vesting RSUs granted on December 4, 2006, with a grant price of $26.945, and 50,000 time-vesting RSUs granted on March 15, 2007, with a grant price of $27.370.
(d) Amounts reported reflect the dollar amount required to be recognized for financial statement reporting purposes in 2007 for stock option awards granted in and prior to 2007 calculated in accordance with FAS 123R. We refer you to the discussion of the assumptions used in such valuation in Note 11 to Consolidated Financial Statements in our 2007 Form 10-K.
For Mr. Currie: Amounts reported include the accelerated vesting of 90,000 stock options granted on September 1, 2006 with an exercise price of $24.195 ($8.67 grant date fair value), 129,000 stock options granted on December 4, 2006 with an exercise price of $26.945 ($9.36 grant date fair value), and 150,000 stock options granted on March 15, 2007, with an exercise price of $27.370 ($9.38 grant date fair value).
(e) Amounts reported for 2007 represent awards paid in February 2008 under the CBP for 2007 performance and for 2006 represent awards paid in February 2007 under the CBP for 2006 performance.
(f) Amounts reported represent the change in pension value under the Retirement Plan, the Restoration Plan and the SERP.
For Mr. Heller: Mr. Heller originally retired from EDS in 2002 and continues to draw monthly benefits. While he is eligible for increased benefit payments as a result of his current employment, it is unlikely his retirement income benefit will increase as a result of his subsequent retirement.
For Mr. Thomas: Mr. Thomas is a UK employee and participates in the UK Retirement Plan.
For Mr. Currie: Mr. Currie was a Canadian employee and participated in the EDS Canada benefit programs. EDS Canada does not maintain a defined benefit pension plan.
(g) Amounts reported include the following executive perquisites, employer 401(k) Plan contributions (EDS Canada Defined Contribution Plan employer contributions for Mr. Currie) and for Mr. Currie severance payments related to the termination of his employment of two times base salary and target bonus ($2,359,360 total) plus payment in lieu of continuation of financial counseling for one year ($11,336):
Name
Personal Use of
Company
Aircraft
Financial
Counseling/ Tax
Preparation Car Usage
401(k)/DC
Matching
Contributions Home Security
Gift & Gift
Gross-up Other Total
M.H. Jordan $398,532 $45,975 $19,578 $3,375 $0 $0 $0 $467,460
R.A. Rittenmeyer 60,806 0 6,580 3,375 0 0 0 70,761
J.M. Heller 77,847 16,544 0 3,375 0 0 0 97,766
C.S. Feld 0 10,000 0 3,375 0 0 0 13,375
W. G. Thomas 0 0 20,285 0 0 0 0 20,285
R.P. Vargo 50,736 10,000 0 3,375 0 0 0 64,111
P.W. Currie 0 0 0 40,673 0 0 2,370,696 2,411,369
Valuation of Personal Use of Car and Driver: We provide Messrs. Jordan, Rittenmeyer and Thomas a car and driver for ground transportation. The value reported represents the incremental cost to us of providing a car and driver and includes the portion of the driver’s salary, vehicle lease cost, fuel expense and other variable costs attributable to each executive’s personal use. We estimate the personal use of such car and driver at 25% of total usage for Mr. Jordan, 14% for Mr. Rittenmeyer and 10% for Mr. Thomas.
Valuation of Personal Use of Corporate Aircraft: The value of personal aircraft usage reported above is based on our direct operating cost per flight hour. This methodology calculates incremental cost based on the weighted average cost of fuel, on-board catering, aircraft maintenance, landing fees, trip-related hangar and parking costs, crew travel expenses and smaller variable costs. Since the corporate aircraft are used primarily for business travel, the methodology excludes fixed costs which do not change based on usage, such as pilots’ and other employees’ salaries, purchase costs of the aircraft and non-trip-related hangar expenses. Flight hours for personal aircraft usage reflected in the amounts reported above include hours for any related “deadhead” positioning of aircraft related to personal usage. On certain occasions, an executive’s spouse or other family member may accompany the executive on a flight. No additional direct operating cost is incurred in such situations. A portion of the incremental costs for personal aircraft usage reported above is not deductible by the company for U.S. federal income tax purposes.
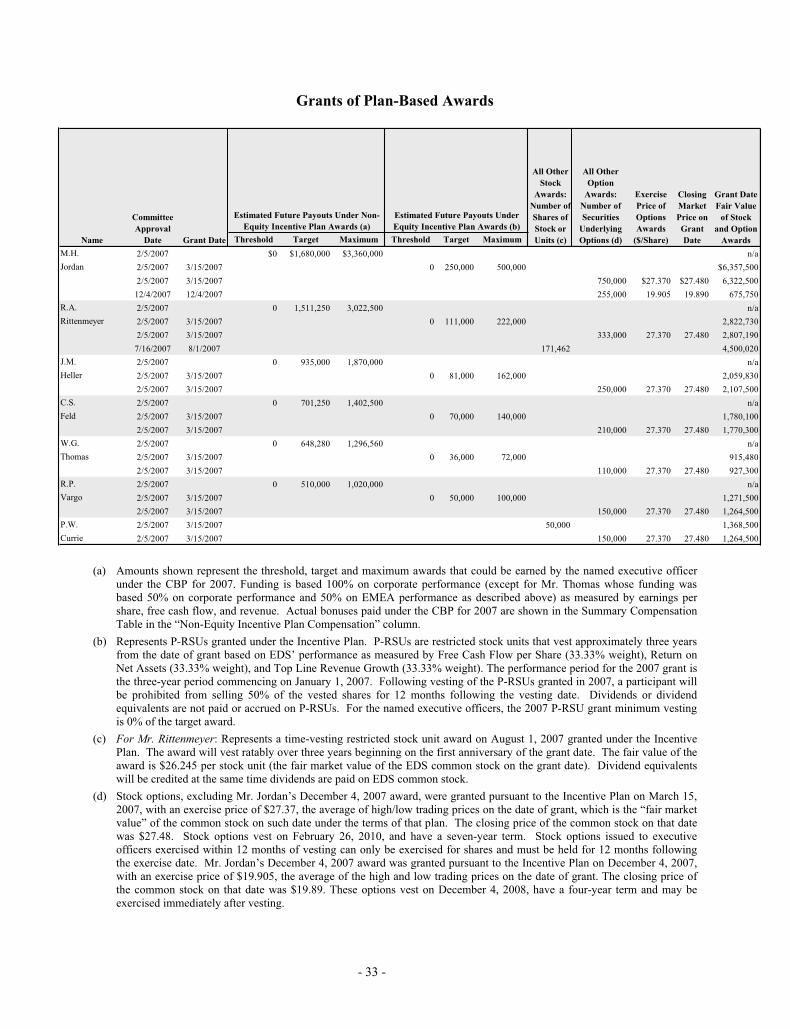
- 33 -
Grants of Plan-Based Awards
Threshold Target Maximum Threshold Target Maximum
M.H. 2/5/2007 $0 $1,680,000 $3,360,000 n/a
Jordan 2/5/2007 3/15/2007 0 250,000 500,000 $6,357,500
2/5/2007 3/15/2007 750,000 $27.370 $27.480 6,322,500
12/4/2007 12/4/2007 255,000 19.905 19.890 675,750
R.A. 2/5/2007 0 1,511,250 3,022,500 n/a
Rittenmeyer 2/5/2007 3/15/2007 0 111,000 222,000 2,822,730
2/5/2007 3/15/2007 333,000 27.370 27.480 2,807,190
7/16/2007 8/1/2007 171,462 4,500,020
J.M. 2/5/2007 0 935,000 1,870,000 n/a
Heller 2/5/2007 3/15/2007 0 81,000 162,000 2,059,830
2/5/2007 3/15/2007 250,000 27.370 27.480 2,107,500
C.S. 2/5/2007 0 701,250 1,402,500 n/a
Feld 2/5/2007 3/15/2007 0 70,000 140,000 1,780,100
2/5/2007 3/15/2007 210,000 27.370 27.480 1,770,300
W.G. 2/5/2007 0 648,280 1,296,560 n/a
Thomas 2/5/2007 3/15/2007 0 36,000 72,000 915,480
2/5/2007 3/15/2007 110,000 27.370 27.480 927,300
R.P. 2/5/2007 0 510,000 1,020,000 n/a
Vargo 2/5/2007 3/15/2007 0 50,000 100,000 1,271,500
2/5/2007 3/15/2007 150,000 27.370 27.480 1,264,500
P.W. 2/5/2007 3/15/2007 50,000 1,368,500
Currie 2/5/2007 3/15/2007 150,000 27.370 27.480 1,264,500
Grant Date
Fair Value
of Stock
and Option
Awards
Closing
Market
Price on
Grant
Date
Estimated Future Payouts Under
Equity Incentive Plan Awards (b)
All Other
Stock
Awards:
Number of
Shares of
Stock or
Units (c)
All Other
Option
Awards:
Number of
Securities
Underlying
Options (d)
Exercise
Price of
Options
Awards
($/Share)Name
Committee
Approval
Date Grant Date
Estimated Future Payouts Under Non-
Equity Incentive Plan Awards (a)
(a) Amounts shown represent the threshold, target and maximum awards that could be earned by the named executive officer under the CBP for 2007. Funding is based 100% on corporate performance (except for Mr. Thomas whose funding was based 50% on corporate performance and 50% on EMEA performance as described above) as measured by earnings per share, free cash flow, and revenue. Actual bonuses paid under the CBP for 2007 are shown in the Summary Compensation Table in the “Non-Equity Incentive Plan Compensation” column.
(b) Represents P-RSUs granted under the Incentive Plan. P-RSUs are restricted stock units that vest approximately three years from the date of grant based on EDS’ performance as measured by Free Cash Flow per Share (33.33% weight), Return on Net Assets (33.33% weight), and Top Line Revenue Growth (33.33% weight). The performance period for the 2007 grant is the three-year period commencing on January 1, 2007. Following vesting of the P-RSUs granted in 2007, a participant will be prohibited from selling 50% of the vested shares for 12 months following the vesting date. Dividends or dividend equivalents are not paid or accrued on P-RSUs. For the named executive officers, the 2007 P-RSU grant minimum vesting is 0% of the target award.
(c) For Mr. Rittenmeyer: Represents a time-vesting restricted stock unit award on August 1, 2007 granted under the Incentive Plan. The award will vest ratably over three years beginning on the first anniversary of the grant date. The fair value of theaward is $26.245 per stock unit (the fair market value of the EDS common stock on the grant date). Dividend equivalents will be credited at the same time dividends are paid on EDS common stock.
(d) Stock options, excluding Mr. Jordan’s December 4, 2007 award, were granted pursuant to the Incentive Plan on March 15, 2007, with an exercise price of $27.37, the average of high/low trading prices on the date of grant, which is the “fair market value” of the common stock on such date under the terms of that plan. The closing price of the common stock on that date was $27.48. Stock options vest on February 26, 2010, and have a seven-year term. Stock options issued to executive officers exercised within 12 months of vesting can only be exercised for shares and must be held for 12 months following the exercise date. Mr. Jordan’s December 4, 2007 award was granted pursuant to the Incentive Plan on December 4, 2007, with an exercise price of $19.905, the average of the high and low trading prices on the date of grant. The closing price of the common stock on that date was $19.89. These options vest on December 4, 2008, have a four-year term and may be exercised immediately after vesting.
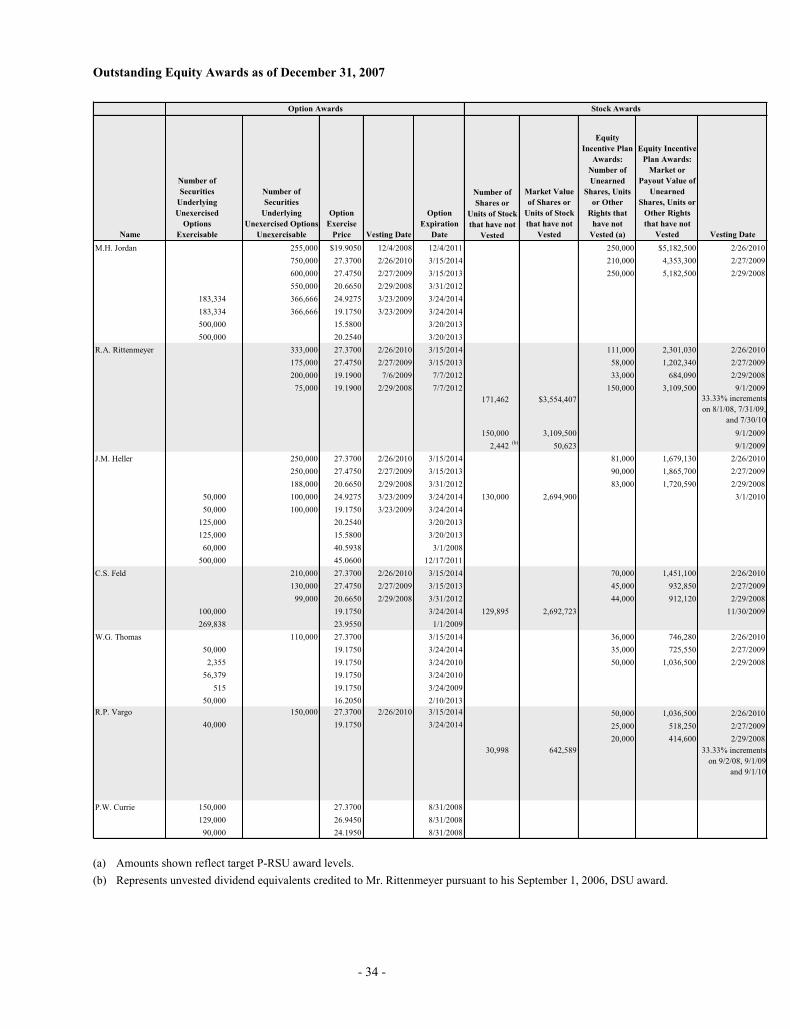
- 34 -
Outstanding Equity Awards as of December 31, 2007
Option Awards Stock Awards
Name
Number of
Securities
Underlying
Unexercised
Options
Exercisable
Number of
Securities
Underlying
Unexercised Options
Unexercisable
Option
Exercise
Price Vesting Date
Option
Expiration
Date
Market Value
of Shares or
Units of Stock
that have not
Vested
Equity
Incentive Plan
Awards:
Number of
Unearned
Shares, Units
or Other
Rights that
have not
Vested (a)
Equity Incentive
Plan Awards:
Market or
Payout Value of
Unearned
Shares, Units or
Other Rights
that have not
Vested Vesting Date
M.H. Jordan 255,000 $19.9050 12/4/2008 12/4/2011 250,000 $5,182,500 2/26/2010
750,000 27.3700 2/26/2010 3/15/2014 210,000 4,353,300 2/27/2009
600,000 27.4750 2/27/2009 3/15/2013 250,000 5,182,500 2/29/2008
550,000 20.6650 2/29/2008 3/31/2012
183,334 366,666 24.9275 3/23/2009 3/24/2014
183,334 366,666 19.1750 3/23/2009 3/24/2014
500,000 15.5800 3/20/2013
500,000 20.2540 3/20/2013
R.A. Rittenmeyer 333,000 27.3700 2/26/2010 3/15/2014 111,000 2,301,030 2/26/2010
175,000 27.4750 2/27/2009 3/15/2013 58,000 1,202,340 2/27/2009
200,000 19.1900 7/6/2009 7/7/2012 33,000 684,090 2/29/2008
75,000 19.1900 2/29/2008 7/7/2012 150,000 3,109,500 9/1/2009
171,462 $3,554,407 33.33% increments
on 8/1/08, 7/31/09,
and 7/30/10
150,000 3,109,500 9/1/2009
2,442(b)
50,623 9/1/2009
J.M. Heller 250,000 27.3700 2/26/2010 3/15/2014 81,000 1,679,130 2/26/2010
250,000 27.4750 2/27/2009 3/15/2013 90,000 1,865,700 2/27/2009
188,000 20.6650 2/29/2008 3/31/2012 83,000 1,720,590 2/29/2008
50,000 100,000 24.9275 3/23/2009 3/24/2014 130,000 2,694,900 3/1/2010
50,000 100,000 19.1750 3/23/2009 3/24/2014
125,000 20.2540 3/20/2013
125,000 15.5800 3/20/2013
60,000 40.5938 3/1/2008
500,000 45.0600 12/17/2011
C.S. Feld 210,000 27.3700 2/26/2010 3/15/2014 70,000 1,451,100 2/26/2010
130,000 27.4750 2/27/2009 3/15/2013 45,000 932,850 2/27/2009
99,000 20.6650 2/29/2008 3/31/2012 44,000 912,120 2/29/2008
100,000 19.1750 3/24/2014 129,895 2,692,723 11/30/2009
269,838 23.9550 1/1/2009
W.G. Thomas 110,000 27.3700 3/15/2014 36,000 746,280 2/26/2010
50,000 19.1750 3/24/2014 35,000 725,550 2/27/2009
2,355 19.1750 3/24/2010 50,000 1,036,500 2/29/2008
56,379 19.1750 3/24/2010
515 19.1750 3/24/2009
50,000 16.2050 2/10/2013
R.P. Vargo 150,000 27.3700 2/26/2010 3/15/2014 50,000 1,036,500 2/26/2010
40,000 19.1750 3/24/2014 25,000 518,250 2/27/2009
20,000 414,600 2/29/2008
30,998 642,589 33.33% increments
on 9/2/08, 9/1/09
and 9/1/10
P.W. Currie 150,000 27.3700 8/31/2008
129,000 26.9450 8/31/2008
90,000 24.1950 8/31/2008
Number of
Shares or
Units of Stock
that have not
Vested
(a) Amounts shown reflect target P-RSU award levels.
(b) Represents unvested dividend equivalents credited to Mr. Rittenmeyer pursuant to his September 1, 2006, DSU award.
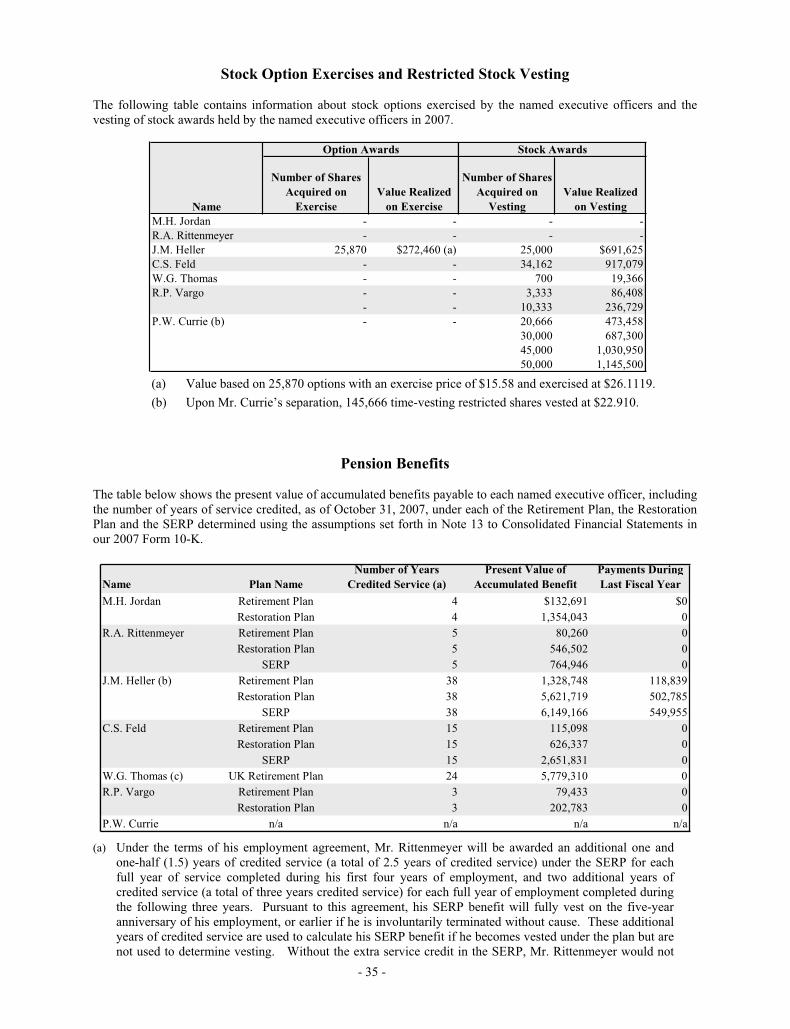
- 35 -
Stock Option Exercises and Restricted Stock Vesting
The following table contains information about stock options exercised by the named executive officers and the vesting of stock awards held by the named executive officers in 2007.
Number of Shares
Acquired on
Exercise
Value Realized
on Exercise
Number of Shares
Acquired on
Vesting
Value Realized
on Vesting
M.H. Jordan - - - -
R.A. Rittenmeyer - - - -
J.M. Heller 25,870 $272,460 (a) 25,000 $691,625
C.S. Feld - - 34,162 917,079
W.G. Thomas - - 700 19,366
R.P. Vargo - - 3,333 86,408
- - 10,333 236,729
P.W. Currie (b) - - 20,666 473,458
30,000 687,300
45,000 1,030,950
50,000 1,145,500
Name
Option Awards Stock Awards
(a) Value based on 25,870 options with an exercise price of $15.58 and exercised at $26.1119.
(b) Upon Mr. Currie’s separation, 145,666 time-vesting restricted shares vested at $22.910.
Pension Benefits
The table below shows the present value of accumulated benefits payable to each named executive officer, including the number of years of service credited, as of October 31, 2007, under each of the Retirement Plan, the Restoration Plan and the SERP determined using the assumptions set forth in Note 13 to Consolidated Financial Statements in our 2007 Form 10-K.
Name Plan Name
Number of Years
Credited Service (a)
Present Value of
Accumulated Benefit
Payments During
Last Fiscal Year
M.H. Jordan Retirement Plan 4 $132,691 $0
Restoration Plan 4 1,354,043 0
R.A. Rittenmeyer Retirement Plan 5 80,260 0
Restoration Plan 5 546,502 0
SERP 5 764,946 0
J.M. Heller (b) Retirement Plan 38 1,328,748 118,839
Restoration Plan 38 5,621,719 502,785
SERP 38 6,149,166 549,955
C.S. Feld Retirement Plan 15 115,098 0
Restoration Plan 15 626,337 0
SERP 15 2,651,831 0
W.G. Thomas (c) UK Retirement Plan 24 5,779,310 0
R.P. Vargo Retirement Plan 3 79,433 0
Restoration Plan 3 202,783 0
P.W. Currie n/a n/a n/a n/a
(a) Under the terms of his employment agreement, Mr. Rittenmeyer will be awarded an additional one and one-half (1.5) years of credited service (a total of 2.5 years of credited service) under the SERP for each full year of service completed during his first four years of employment, and two additional years of credited service (a total of three years credited service) for each full year of employment completed during the following three years. Pursuant to this agreement, his SERP benefit will fully vest on the five-year anniversary of his employment, or earlier if he is involuntarily terminated without cause. These additional years of credited service are used to calculate his SERP benefit if he becomes vested under the plan but are not used to determine vesting. Without the extra service credit in the SERP, Mr. Rittenmeyer would not
- 36 -
have an accrued benefit under the SERP (the value of the Retirement and Restoration plan benefit values are not impacted by the extra service grant).
(b) Mr. Heller, who originally retired from EDS in 2002, continues to draw monthly benefits from the Retirement Plan, the Restoration Plan, and the SERP of $9,903.25, $41,898.75 and $45,829.60 respectively, all payable as a 75% joint and survivor annuity. While he is eligible for increased benefit payments as a result of his current employment, it is unlikely his retirement income benefit will increase as a result of his subsequent retirement. Mr. Heller’s employment agreement provides that his service will not result in a decrease in the retirement benefit he had been entitled to receive at the time he rejoined the company.
(c) EDS entered into an agreement with Mr. Thomas which provides an enhanced retirement income benefit if he is involuntarily terminated (not for cause) or he voluntarily terminates his employment after attaining age 50. The enhanced benefit provides a pension reduced only prior to age 60, rather than age 65.
Benefits under the Retirement Plan provide for accruals, which are expressed as monthly credits added to participants’ “personal pension accounts,” or PPA. The Restoration Plan provides for a supplemental benefit to employees equal to the amount they would have received under the Retirement Plan if compensation and annual accruals were not limited under the Internal Revenue Code. Under the Restoration Plan, EDS maintains a “restoration account,” or RA, reflecting benefit and interest credits made on behalf of a participant. Monthly credits are based on a participant’s credited years of service together with age, divided by 12. The resulting quotient is the monthly allocation percentage, which is multiplied by the participant’s monthly earnings to determine the monthly amount credited to the PPA and RA. Participants receive additional credits (i) if annual compensation exceeded $97,500 (Social Security wage base) and (ii) generally if the participant was hired or rehired by EDS after age 35.
The annual benefit payable under the SERP for normal retirement will generally equal (i) 55% of the average of the participant’s total compensation (based on the highest five consecutive years within the last 10 years of employment) less (ii) the maximum covered compensation offset allowance, then prorated downward for service less than 30 years and reduced for commencement date beginning prior to age 62. The resulting benefit is then offset by any benefit accrued under the Retirement Plan and the Restoration Plan. The normal form of payment under the SERP is a single life annuity but the plan provides several actuarial equivalent forms of payment.
The final average compensation as defined under the SERP for the highest five consecutive years over the last 10-year period was as follows: Mr. Rittenmeyer, $1,875,000; and Mr. Feld, $1,254,152. Messrs. Jordan and Vargo do not participate in the SERP but do participate in the Retirement Plan and the Restoration Plan. Mr. Currie was an employee of EDS Canada and did not participate in a defined benefit retirement plan. Compensation under the retirement plans refers to total annual cash compensation plus any contributions to the EDS 401(k) Plan and EDS Flexible Benefits Plan, but excludes stock-based compensation under the Incentive Plan (except stock options granted in 2003 under the annual bonus plan and subsequently exercised) and extraordinary compensation (such as moving allowances and retention bonuses). For the Retirement Plan, compensation is limited to $225,000 for 2007 by the Internal Revenue Code.
Employees are eligible for early retirement if they are age 55, have five years of service, and their age plus service is greater than or equal to 70. Benefits under the Retirement and Restoration plans are determined based on the participant’s cash balance converted to an annuity. SERP benefits are based on average pay, the maximum covered compensation offset allowance and service at retirement, offset by Retirement and Restoration Plan benefits. SERP benefits are unreduced at age 62.
Calculations are based on the 1994 group annuity mortality table, a 6.35% annual discount rate and 5.85% interest crediting rate. Mr. Jordan’s calculations assume that he is currently eligible to retire. Mr. Rittenmeyer’s calculations assume an age 64 plus one month retirement, which is the age at which he is eligible for unreduced benefits. Mr. Vargo’s calculation is based on an age 65 retirement assumption.
The UK Retirement Plan is a contributory defined benefit scheme that provides an annuity benefit for the employee's lifetime of 1.7% of final pensionable salary for each year of pensionable service in the plan. In Mr. Thomas’ case, the benefits payable from the plan are restricted, and we will pay the additional amounts as necessary. Calculations are based on the PA00 Medium Cohort mortality table and a 5.60% annual discount rate.
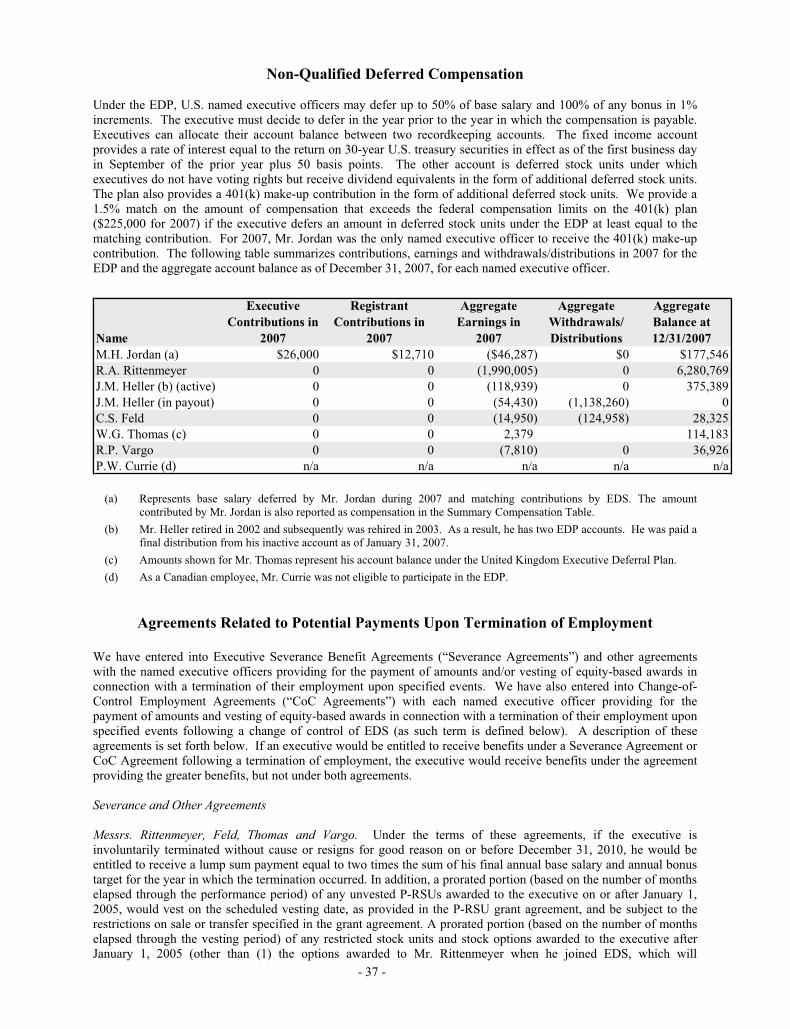
- 37 -
Non-Qualified Deferred Compensation
Under the EDP, U.S. named executive officers may defer up to 50% of base salary and 100% of any bonus in 1% increments. The executive must decide to defer in the year prior to the year in which the compensation is payable. Executives can allocate their account balance between two recordkeeping accounts. The fixed income account provides a rate of interest equal to the return on 30-year U.S. treasury securities in effect as of the first business day in September of the prior year plus 50 basis points. The other account is deferred stock units under which executives do not have voting rights but receive dividend equivalents in the form of additional deferred stock units. The plan also provides a 401(k) make-up contribution in the form of additional deferred stock units. We provide a 1.5% match on the amount of compensation that exceeds the federal compensation limits on the 401(k) plan ($225,000 for 2007) if the executive defers an amount in deferred stock units under the EDP at least equal to the matching contribution. For 2007, Mr. Jordan was the only named executive officer to receive the 401(k) make-up contribution. The following table summarizes contributions, earnings and withdrawals/distributions in 2007 for the EDP and the aggregate account balance as of December 31, 2007, for each named executive officer.
Name
Executive
Contributions in
2007
Registrant
Contributions in
2007
Aggregate
Earnings in
2007
Aggregate
Withdrawals/
Distributions
Aggregate
Balance at
12/31/2007
M.H. Jordan (a) $26,000 $12,710 ($46,287) $0 $177,546
R.A. Rittenmeyer 0 0 (1,990,005) 0 6,280,769
J.M. Heller (b) (active) 0 0 (118,939) 0 375,389
J.M. Heller (in payout) 0 0 (54,430) (1,138,260) 0
C.S. Feld 0 0 (14,950) (124,958) 28,325
W.G. Thomas (c) 0 0 2,379 114,183
R.P. Vargo 0 0 (7,810) 0 36,926
P.W. Currie (d) n/a n/a n/a n/a n/a
(a) Represents base salary deferred by Mr. Jordan during 2007 and matching contributions by EDS. The amount contributed by Mr. Jordan is also reported as compensation in the Summary Compensation Table.
(b) Mr. Heller retired in 2002 and subsequently was rehired in 2003. As a result, he has two EDP accounts. He was paid a final distribution from his inactive account as of January 31, 2007.
(c) Amounts shown for Mr. Thomas represent his account balance under the United Kingdom Executive Deferral Plan.
(d) As a Canadian employee, Mr. Currie was not eligible to participate in the EDP.
Agreements Related to Potential Payments Upon Termination of Employment
We have entered into Executive Severance Benefit Agreements (“Severance Agreements”) and other agreements with the named executive officers providing for the payment of amounts and/or vesting of equity-based awards in connection with a termination of their employment upon specified events. We have also entered into Change-of-Control Employment Agreements (“CoC Agreements”) with each named executive officer providing for the payment of amounts and vesting of equity-based awards in connection with a termination of their employment upon specified events following a change of control of EDS (as such term is defined below). A description of these agreements is set forth below. If an executive would be entitled to receive benefits under a Severance Agreement or CoC Agreement following a termination of employment, the executive would receive benefits under the agreement providing the greater benefits, but not under both agreements.
Severance and Other Agreements
Messrs. Rittenmeyer, Feld, Thomas and Vargo. Under the terms of these agreements, if the executive is involuntarily terminated without cause or resigns for good reason on or before December 31, 2010, he would be entitled to receive a lump sum payment equal to two times the sum of his final annual base salary and annual bonus target for the year in which the termination occurred. In addition, a prorated portion (based on the number of months elapsed through the performance period) of any unvested P-RSUs awarded to the executive on or after January 1, 2005, would vest on the scheduled vesting date, as provided in the P-RSU grant agreement, and be subject to the restrictions on sale or transfer specified in the grant agreement. A prorated portion (based on the number of months elapsed through the vesting period) of any restricted stock units and stock options awarded to the executive after January 1, 2005 (other than (1) the options awarded to Mr. Rittenmeyer when he joined EDS, which will
- 38 -
immediately vest and be exercisable through the earlier of (x) one year from the date of termination, (y) the latest expiration date of the original applicable stock option award or (z) the tenth anniversary of the original date of grant of the applicable stock option award and (2) the DSUs awarded to Mr. Rittenmeyer in September 2006, the disposition of which would be governed by that award agreement) that remain unvested on the date of termination shall immediately vest, be free of any restrictions on sale or transfer and, with regard to stock options, the executive may exercise such options through the earlier of (x) one year from the date of termination, (y) the latest expiration date of the original applicable stock option award or (z) the tenth anniversary of the original date of grant of the applicable stock option award. All other then unvested equity-based awards granted prior to 2005 will immediately vest, be free of any restrictions on sale or transfer and, with regard to stock options, the executive may exercise such options through the earlier of (x) one year from the date of termination, (y) the latest expiration date of the original applicable stock option award or (z) the tenth anniversary of the original date of grant of the applicable stock option award (other than options awarded to Mr. Feld as part of EDS’ acquisition of The Feld Group, which would be exercisable for the period provided for in that award agreement). These agreements also provide for the lump sum payment of $10,000 as equivalent to the annual amount for financial planning/counseling services currently provided to the executive and a lump sum payment equal to the estimated cost of 18 months of health care premiums. If any payment under the Severance Agreement is subject to federal excise taxes imposed pursuant to Section 409A of the Internal Revenue Code, the executive will receive an additional amount to cover any such tax payable by him as well as a gross-up payment on all taxes due.
In addition, with respect to Mr. Rittenmeyer, if he is involuntarily terminated without cause or resigns for good reason prior to his three-year anniversary of employment (excluding an involuntary termination following a change of control), his SERP benefit will immediately vest but will be limited to 99% of his then current base salary plus annual target bonus. Mr. Rittenmeyer is provided an enhanced benefit under the SERP described under “Pension Benefits” above.
Further, if the executive is a “Specified Employee” (as such term is defined and determined under the terms of the EDS Benefit Restoration Plan or successor plan(s)), and unless prohibited by law, the cash payments to be provided pursuant to his Severance Agreement (as described above) and an amount equal to the fair market value of the restricted stock units that would have immediately vested upon the executive’s separation will, instead of being provided to the executive, be paid into a rabbi trust for the benefit of executive and will be distributed to the executive on the first business day after the six-month anniversary of his separation.
For purposes of these Severance Agreements, “good reason” means a reduction in the executive’s base salary or annual target bonus (other than a reduction in which he is treated no less favorably than similarly situated executives). “Cause” means the executive has: (a) been convicted of, or pleaded guilty to, a felony involving theft or moral turpitude; (b) willfully and materially failed to follow EDS’ lawful and appropriate policies, directives or orders applicable to employees holding comparable positions that resulted in significant harm to EDS; (c) willfully and intentionally destroyed or stole EDS property or falsified EDS documents; (d) willfully and materially violated the EDS Code of Business Conduct that resulted in significant harm to EDS; or (e) engaged in conduct that constitutes willful gross neglect with respect to employment duties that resulted in significant harm to EDS.
Employment Agreement with Mr. Heller. Under the terms of our employment agreement with Mr. Heller, if we terminate his employment without cause, or if he voluntarily terminates his employment or becomes subject to total disability or dies, he would be entitled to a payment equal to the pro rata portion (through his termination date) of any bonus payable under the CBP if and when payment is made to other executives. For purposes of this agreement, “cause” has the same meaning as in the Severance Agreements described above.
Change-of-Control Employment Agreements
Messrs. Jordan, Rittenmeyer, Heller, Feld, Thomas and Vargo. Pursuant to these CoC Agreements, in the event of the occurrence of a “change of control” of EDS, the executive’s employment will be continued for a period of two years and, in the case of Messrs. Jordan, Heller and Rittenmeyer, all then unvested equity-based awards would immediately vest (with P-RSUs and P-DSUs vesting at the targeted amount), be free of any restrictions on sale or transfer (other than with respect to DSUs, which will be governed by the executive deferral plan and applicable grant agreements) and, with respect to stock options, be exercisable through the earlier of (x) one year from the date of termination, (y) the latest expiration date of the original applicable stock option award or (z) the tenth anniversary of the original date of grant of the applicable stock option award. Throughout the two-year employment period, the executive will continue to receive at least the same base salary and target bonus he was receiving immediately prior to the change of control and will remain eligible to participate in all incentive and benefit plans generally available to peer executives until the end of the employment period. If during the employment period the executive’s
- 39 -
employment is terminated by the company other than for “cause” or by the executive for “good reason,” he would receive his unpaid salary through the date of termination and (except for Mr. Jordan) a lump sum payment equal to 2.99 times the sum of his final annual base salary and annual performance bonus target for the year in which he is terminated.
In addition (except for Messrs. Jordan, Heller and Rittenmeyer, whose equity-based awards will have vested at the time of the change of control as noted above), all equity-based awards held by the executive on the date of termination will vest (with P-RSUs vesting at the targeted amount), be free of any restrictions on sale or transfer and, with regard to stock options, be exercisable through the earlier of (x) one year from the date of termination, (y) the latest expiration date of the original applicable stock option award or (z) the tenth anniversary of the original date of grant of the applicable stock option award (other than those stock options awarded to Mr. Feld as part of EDS’ acquisition of The Feld Group, which would be exercisable for the period provided for in the award). If the executive’s employment is terminated for cause or he voluntarily terminates his employment other than for good reason during the employment period, he will receive all accrued but unpaid salary through the date of termination and be entitled to no other severance under the CoC Agreement. If any payment under the CoC Agreement is subject to federal excise taxes imposed on excess parachute payments or imposed pursuant to Section 409A of the Internal Revenue Code, the executive will receive an additional amount to cover any such tax payable by him as well as a gross-up payment on all taxes due. The CoC Agreements have a termination date of December 31, 2010.
Further, if the executive is a “Specified Employee” (as such term is defined and determined under the terms of the EDS Benefit Restoration Plan or successor plan(s)), and unless prohibited by law, the cash payments (other than accrued but unpaid salary) to be provided on separation pursuant to his CoC Agreement (as described above) and, with respect to Messrs. Feld and Vargo, an amount equal to the fair market value of the P-RSUs and restricted stock units that would have immediately vested upon the executive’s separation will, instead of being provided to the executive, be paid into a rabbi trust for the benefit of executive and will be distributed to the executive on the first business day after the six-month anniversary of his separation.
For purposes of the CoC Agreements, a “change of control” of EDS includes the following: (i) any person acquires ownership of stock of the company that, together with stock held by that person, constitutes more than 50% of the fair market value or total voting power of the company; (ii) any person acquires (or has acquired in the preceding 12 month period) ownership of stock of the company possessing 30% or more of the total voting power of the company; (iii) a majority of the Board of Directors is replaced during any 12 month period by directors whose appointment or election is not endorsed by a majority of the Board of Directors prior to the date of the appointment of election; or (iv) any person acquires (or has acquired in the preceding 12 month period) assets from the company that have a total gross fair market value equal to 40% or more of all the assets of the company immediately before such acquisition(s). “Good Reason” means: (i) a reduction in the executive’s base salary or annual target bonus opportunity; (ii) requiring the executive to be based at a location more than 50 miles from his principal work location preceding the change of control; or (iii) a reduction in the executive’s title, position, authority, duties or responsibilities inconsistent with his role prior to the change of control. “Cause” shall have the same meaning as in the Severance Agreements described above.
Potential Payments Upon Termination or Change of Control
The following table sets forth the payments required to be made to each named executive officer in connection with the termination of their employment upon specified events assuming a $20.73 per share price for our common stock (closing price on December 31, 2007). The amounts shown assume that the termination was effective December 31, 2007, and thus include amounts earned through such time and are estimates of the amounts which would be paid out to the executives upon their termination. The actual amounts paid out can only be determined at the time of such executive’s separation from the company. Paul W. Currie was separated involuntarily (not for cause) effective August 31, 2007. The cash severance paid to him is reported in the All Other Compensation column under the Summary Compensation Table above, and the value of the restricted stock units that vested upon his separation is set forth under the Stock Option Exercises and Restricted Stock Vesting Table above.
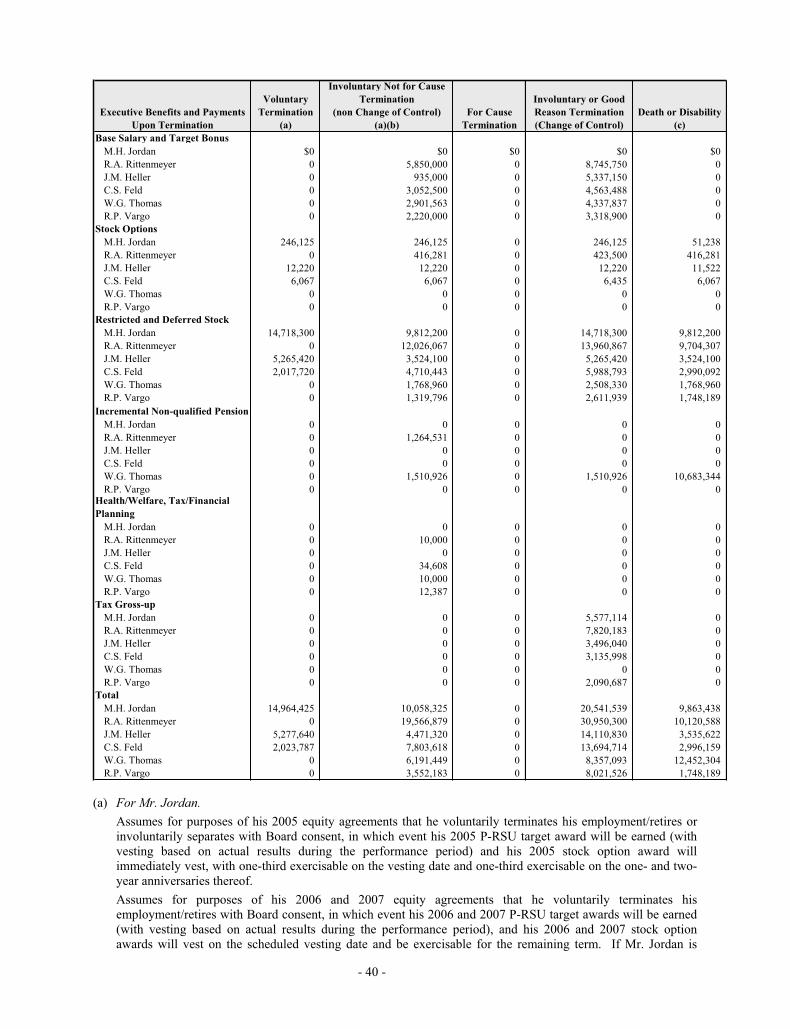
- 40 -
Executive Benefits and Payments
Upon Termination
Voluntary
Termination
(a)
Involuntary Not for Cause
Termination
(non Change of Control)
(a)(b)
For Cause
Termination
Involuntary or Good
Reason Termination
(Change of Control)
Death or Disability
(c)
Base Salary and Target Bonus
M.H. Jordan $0 $0 $0 $0 $0
R.A. Rittenmeyer 0 5,850,000 0 8,745,750 0
J.M. Heller 0 935,000 0 5,337,150 0
C.S. Feld 0 3,052,500 0 4,563,488 0
W.G. Thomas 0 2,901,563 0 4,337,837 0
R.P. Vargo 0 2,220,000 0 3,318,900 0
Stock Options
M.H. Jordan 246,125 246,125 0 246,125 51,238
R.A. Rittenmeyer 0 416,281 0 423,500 416,281
J.M. Heller 12,220 12,220 0 12,220 11,522
C.S. Feld 6,067 6,067 0 6,435 6,067
W.G. Thomas 0 0 0 0 0
R.P. Vargo 0 0 0 0 0
Restricted and Deferred Stock
M.H. Jordan 14,718,300 9,812,200 0 14,718,300 9,812,200
R.A. Rittenmeyer 0 12,026,067 0 13,960,867 9,704,307
J.M. Heller 5,265,420 3,524,100 0 5,265,420 3,524,100
C.S. Feld 2,017,720 4,710,443 0 5,988,793 2,990,092
W.G. Thomas 0 1,768,960 0 2,508,330 1,768,960
R.P. Vargo 0 1,319,796 0 2,611,939 1,748,189
Incremental Non-qualified Pension
M.H. Jordan 0 0 0 0 0
R.A. Rittenmeyer 0 1,264,531 0 0 0
J.M. Heller 0 0 0 0 0
C.S. Feld 0 0 0 0 0
W.G. Thomas 0 1,510,926 0 1,510,926 10,683,344
R.P. Vargo 0 0 0 0 0Health/Welfare, Tax/Financial
Planning
M.H. Jordan 0 0 0 0 0
R.A. Rittenmeyer 0 10,000 0 0 0
J.M. Heller 0 0 0 0 0
C.S. Feld 0 34,608 0 0 0
W.G. Thomas 0 10,000 0 0 0
R.P. Vargo 0 12,387 0 0 0
Tax Gross-up
M.H. Jordan 0 0 0 5,577,114 0
R.A. Rittenmeyer 0 0 0 7,820,183 0
J.M. Heller 0 0 0 3,496,040 0
C.S. Feld 0 0 0 3,135,998 0
W.G. Thomas 0 0 0 0 0
R.P. Vargo 0 0 0 2,090,687 0
Total
M.H. Jordan 14,964,425 10,058,325 0 20,541,539 9,863,438
R.A. Rittenmeyer 0 19,566,879 0 30,950,300 10,120,588
J.M. Heller 5,277,640 4,471,320 0 14,110,830 3,535,622
C.S. Feld 2,023,787 7,803,618 0 13,694,714 2,996,159
W.G. Thomas 0 6,191,449 0 8,357,093 12,452,304
R.P. Vargo 0 3,552,183 0 8,021,526 1,748,189
(a) For Mr. Jordan.Assumes for purposes of his 2005 equity agreements that he voluntarily terminates his employment/retires or involuntarily separates with Board consent, in which event his 2005 P-RSU target award will be earned (with vesting based on actual results during the performance period) and his 2005 stock option award will immediately vest, with one-third exercisable on the vesting date and one-third exercisable on the one- and two-year anniversaries thereof.
Assumes for purposes of his 2006 and 2007 equity agreements that he voluntarily terminates his employment/retires with Board consent, in which event his 2006 and 2007 P-RSU target awards will be earned (with vesting based on actual results during the performance period), and his 2006 and 2007 stock option awards will vest on the scheduled vesting date and be exercisable for the remaining term. If Mr. Jordan is
- 41 -
involuntarily separated, a prorated portion of his 2006 and 2007 P-RSU target awards will be earned (with vesting based on actual results during the performance period) and a prorated portion of his 2006 and 2007 stock option awards will immediately vest, be free of any restrictions on sale, and be exercisable for two years.
For Mr. Heller.Assumes for purposes of his 2005 equity agreements that he voluntarily terminates his employment/retires or involuntarily separates with Board consent, in which event his 2005 P-RSU target award will be earned (with vesting based on actual results during the performance period) and his 2005 stock option award will immediately vest, with one-third exercisable on the vesting date and one-third exercisable on the one- and two-year anniversaries thereof.
Assumes for purposes of his 2006 and 2007 equity agreements that he voluntarily terminates his employment/retires with Board consent, his 2006 and 2007 P-RSU target awards will be earned (with vesting based on actual results during the performance period) and his 2006 and 2007 stock option awards will vest as scheduled and be exercisable for the remaining term. If he is involuntarily separated, a prorated portion of his 2006 and 2007 P-RSU target awards will be earned (with vesting based on actual results during the performance period) and a prorated portion of his 2006 and 2007 stock option awards will immediately vest, be free of any restrictions on sale and be exercisable for two years.
For Mr. Rittenmeyer. Assumes that, under the terms of his 2006 DSU award agreements, his 2006 DSU awards will be forfeited if he voluntarily terminates his employment prior to vesting, other than for good reason. If he voluntarily terminates his employment for good reason, his 2006 time-vesting DSUs will immediately vest (value of $3,109,500 based on closing price of EDS stock on December 31, 2007). If he voluntarily terminates his employment for good reason, his 2006 performance DSUs will immediately be earned based on actual EDS results during a portion of the performance period. The earned/vested portion of DSU awards will be distributed in shares of common stock on the later to occur of (i) January 31 in the year following the date of his separation or (ii) the first day of the month following six completed calendar months after the date of such separation. All other unvested equity awards are forfeited upon voluntary termination.
With respect to an involuntary termination (non change of control), assumes that any unvested time-vesting RSU and/or stock option awards granted to Mr. Rittenmeyer in 2005, 2006, and 2007 will be prorated based on completed months of service and will immediately vest and be free of any restrictions regarding their sale or transfer, with the exception of the stock options awarded to Mr. Rittenmeyer when he joined EDS, which will fully and immediately vest, and that any P-RSU awards granted to Mr. Rittenmeyer in 2005, 2006, and 2007 will be prorated based on completed months of service, will vest on their regular vesting date and will be subject to the restrictions on sale or transfer specified in the grant agreements.
For Mr. Feld. With respect to a voluntary termination after the age of 62 or an involuntary termination (non change of control), assumes that any unvested time-vesting RSU and/or stock option awards granted to Mr. Feld in 2005, 2006, and 2007 will be prorated based on completed months of service and will immediately vest and be free of any restrictions regarding their sale or transfer, and that any P-RSU awards granted to Mr. Feld in 2005, 2006, and 2007 will be prorated based on completed months of service, will vest on their regular vesting date and will be subject to the restrictions on sale or transfer specified in the grant agreements.
For Mr. Thomas. With respect to an involuntary termination (non change of control), assumes that any unvested stock option awards granted to Mr. Thomas in 2007 will be prorated based on completed months of service and will immediately vest and be free of any restrictions regarding their sale or transfer, and that any P-RSU awards granted to Mr. Thomas in 2005, 2006, and 2007 will be prorated based on completed months of service, will vest on their regular vesting date and will be subject to the restrictions on sale or transfer specified in the grant agreements.
For Mr. Vargo. With respect to an involuntary termination (non change of control), assumes that any unvested time-vesting RSU and/or stock option awards granted to Mr. Vargo in 2005, 2006, and 2007 will be prorated based on completed months of service and will immediately vest and be free of any restrictions regarding their sale or transfer, and that any P-RSU awards granted to Mr. Vargo in 2005, 2006, and 2007 will be prorated based on
- 42 -
completed months of service, will vest on their regular vesting date and will be subject to the restrictions on sale or transfer specified in the grant agreements.
(b) For Mr. Rittenmeyer. Incremental non-qualified pension value represents value of additional years of credited service under SERP as of December 31, 2007 pursuant to agreement with Mr. Rittenmeyer described in note (a) under Pension Benefits Table above. If Mr. Rittenmeyer is involuntarily terminated without cause or resigns for good reason prior to his three-year anniversary of employment (excluding an involuntary termination following a change of control), his SERP benefit will immediately vest but will be limited to 99% of his then current base salary plus annual target bonus.
For Mr. Thomas. Incremental non-qualified pension value represents the present value of providing a pension benefit reduced only from age 60 in the event he is involuntarily terminated without cause.
(c) For Mr. Jordan.Reflects immediate vesting of his 2004 equity awards and a prorated vesting of his 2005, 2006, and 2007 P-RSU target awards and stock option awards.
For Mr. Heller.Reflects immediate vesting of his 2004 equity awards and a prorated vesting of his 2005, 2006, and 2007 P-RSU target awards and stock option awards.
For Mr. Rittenmeyer. Reflects prorated vesting of DSUs, performance DSUs and P-RSUs, and stock options (excluding his sign-on stock option grant for 200,000 options). Reflects full-vesting (100%) of his 2005 sign-on stock option award and his August 1, 2007 retention RSU grant. Additionally, in accordance with his time-vesting and performance DSUs, a minimum of 50% of the target award is assumed vested.
For Mr. Feld. Reflects immediate prorated vesting of all equity awards.
For Mr. Thomas. Reflects immediate prorated vesting of all equity awards. If Mr. Thomas were to die while employed by EDS, his beneficiary would receive a lump sum of four times his pensionable salary along with a return of his contributions paid to the Plan (prior to April 2006), along with a pension equal to 30% of that salary. The lump sum payment equal to four times his pensionable salary is funded through a separate life insurance policy and trust. Children’s pensions would also be payable if appropriate. The values shown above are the present value of the lump sum and spouse’s benefits payable upon his death in service; the calculations are based on the PA00 Medium Cohort mortality table and a 5.60% annual discount rate.
For Mr. Vargo. Reflects immediate vesting of RSU award and prorated vesting of stock options, P-RSUs and DSUs.
- 43 -
Related Party Transactions
Related Party Transaction Approval Policy
The Board recognizes that related party transactions can present conflicts of interest and questions as to whether the transactions are in the best interest of EDS. The EDS Corporate Governance Guidelines sets forth our policy and procedures for the review, approval and ratification of such transactions. For purposes of this policy, a “related party transaction” is a transaction or relationship involving a director, executive officer or 5% shareholder or their immediate family members that is reportable under the SEC’s rules regarding such transactions.
Under this policy, a related party transaction should be approved or ratified based upon a determination that the transaction is in, or not opposed to, the best interest of EDS. The policy provides for the Governance Committee to review and approve a transaction involving a director, the CEO or 5% shareholder, and for the CEO to review and approve a transaction involving any executive officer (other than the CEO and any executive who is also a director). Notice of a decision by the CEO to approve a related party transaction should be sent to the Governance Committee prior to finalizing the transaction, which may seek more information or call a meeting to review the transaction in greater detail. If a director or executive officer becomes aware of a transaction that should have been but was not approved in advance under this policy, he or she should report the transaction to whomever would have approved the transaction had it been submitted for advance approval. If the transaction is ongoing and revocable, it should be reviewed to determine whether ratification or other action should be taken. If the transaction is completed and not revocable, it should be evaluated to determine if any mitigation or other action should be taken.
The employment of an immediate family member of an executive officer (other than the CEO) does not need to be reported to the Governance Committee prior to approval unless the employee is “pay-banded” under EDS’ compensation structure or his or her compensation is reasonably expected to exceed $200,000 per year. In all other circumstances, the hiring should be approved in accordance with the process described above.
Management is expected to report to the Governance Committee any transaction with a related party that is not covered by this policy because it is not reportable under the SEC rules or that involves employment of an immediate family member not reported to the Governance Committee in advance as described above.
Certain Relationships and Related Party Transactions
In 2005 we retained Navigator Systems, Inc. to provide staff augmentation services related to our development of a Business Intelligence team to support our corporate metrics, analytics and dashboards initiatives. This engagement followed a competitive bid process conducted by our purchasing organization. The project was expanded to include our ExcellerateHRO business in 2006. Jon Feld, a son of Senior Executive Vice President Charles Feld, is a co-founder, director, Chief Executive Officer and approximately 20% shareholder of Navigator. In February 2006, substantially all of the business and assets of Navigator were sold to Hitachi Consulting Corporation. Following that transaction, Jon Feld became a Vice President of Hitachi Consulting and, in his capacity as a shareholder of Navigator, will have an economic interest through 2007 in revenues of Hitachi Consulting attributable to the former Navigator business. In 2006, we retained Hitachi Consulting for services related to the strategy and planning of a new and expanded knowledge management program following a competitive bid process. We paid or will pay Hitachi Consulting approximately $6,456,240 in respect of services provided in 2007 and expect to pay additional amounts to Hitachi Consulting in 2008.
Senior Executive Vice President Charles Feld’s son, Kenny Feld, is an employee of EDS. Kenny Feld and Charles Feld joined EDS in connection with our purchase of The Feld Group in January 2004. Kenny Feld received a salary of $329,127 in 2007 and a bonus of $133,400 in respect of 2007 performance. He was awarded 20,000 P-RSUs in connection with our 2007 long-term incentive grant. Charles Feld disclaims any interest in his son’s compensation.
Chairman, President and Chief Executive Officer Ronald Rittenmeyer’s son, Chris Rittenmeyer, has been employed by EDS since 2001, prior to Ronald Rittenmeyer’s joining the company in July 2005. At December 31, 2007, Chris Rittenmeyer was Vice President of U.S. operations for our ExcellerateHRO subsidiary. He received salary in 2007 of $215,000, a bonus of $105,000 in respect of 2007 performance and an award in 2007 of 8,000 P-RSUs. In addition, he received certain expatriate and relocation benefits in 2007 in connection with his service during part of that year as Vice President of ExcellerateHRO’s European, Middle East and Africa business. Ronald Rittenmeyer disclaims any interest in his son’s compensation.
AR-1
2007 Annual Report
This Annual Report contains an overview of our business and information regarding our operations during 2007 and otherinformation that our shareholders may find useful.
BUSINESS
Overview
Electronic Data Systems Corporation, or EDS, is a leading global technology services company that delivers business solutions.EDS founded the information technology outsourcing industry more than 45 years ago. Today, we deliver a broad portfolio ofinformation technology and business process outsourcing services to clients in the manufacturing, financial services, healthcare,communications, energy, transportation, and consumer and retail industries and to governments around the world.
As of January 31, 2008, EDS and its subsidiaries employed approximately 139,500 persons in the United States and 65 othercountries around the world. Our principal executive offices are located at 5400 Legacy Drive, Plano, Texas 75024, telephonenumber: (972) 604-6000.
Our predecessor was incorporated in Texas under the name Electronic Data Systems Corporation in 1962. In 1984, General Motors Corporation, or GM, acquired all of the capital stock of our predecessor, and we remained a wholly owned subsidiary of GM untilour split-off in 1996. As a result of the split-off, we became an independent, publicly held Delaware corporation. Unless thecontext otherwise requires, references to EDS include its predecessor and subsidiaries.
EDS Services
Infrastructure Services. EDS Infrastructure Services delivers hosting, workplace (desktop), storage, security and privacy, andcommunications services that enable clients to drive down their total cost of ownership and increase the productivity of theirinformation technology (IT) environment across the globe. Infrastructure Services include:
• Data Center Services. EDS Data Center Services address the business and technology needs of our clients for hosting and storage services. These services establish the client’s infrastructure using a set of highly modular, standard componentsthat can be provisioned quickly and easily, serving as the integrated base platform to support business processes andapplications. Data Center Services is composed of eight principal offerings:
– Server Management. We provide management, monitoring and a flexible set of services for our clients’ servers.Services are delivered from our secure data center facilities with standard operational best practices and advanced technologies, including virtualization and automation.
– Enterprise Application Hosting Services. We provide data center services including managed servers, storage,network and support for mission-critical, packaged enterprise applications. This service extends our full continuum of applications support, providing our clients’ application infrastructure and enabling security, privacy, andcompliancy.
– Web Hosting Services. This service includes the operational management and infrastructure for Web-enabledenvironments including managed servers, storage, network, and support. EDS Web Hosting Services offers clients base and uplift services provided in EDS leveraged data centers as well as in client data centers.
– Managed Mainframe Services. We offer a complete spectrum of secure, usage-based mainframe managementservices, including mainframe platform, storage hardware, operating software and disaster recovery support.
AR-2
– Data Center Modernization. These transformational services rationalize, consolidate, automate and virtualize theclient’s IT infrastructure and applications environment to enable reduced cost, increased quality of service andgreater flexibility.
– Storage Management Services. We provide a full spectrum of storage tiers on both Network Attached Storage(NAS) and Storage Area Network (SAN) platforms.
– Backup & Restore Services. These services protect and recover lost data for improved system availability and rapid response to a single system failure or widespread disaster. We offer protection for end user laptops, remote servers, data center storage, and high-end mission critical applications.
– Archive & Compliance Services. We provide long-term data retention services to support regulatory and legalrequirements. We offer a range of storage archiving tiers designed for end user files, e-mail, file server data, and archival of Enterprise Resource Planning (ERP) system reports.
• Workplace Services. EDS Workplace Services delivers expert management and support of the end user’s workenvironment from the software applications that support the client’s business practices to the supporting networkcommunications infrastructure. Workplace Services include:
– Mobile Workplace Services. We provide an end-to-end managed mobility solution that delivers voice andenterprise data regardless of a user’s locality, device, network or application.
– Asset Management Services. We offer a system of integrated management processes, strategies and technologies to enable a client to control its IT assets throughout their life cycle.
– Thin Client Management Services. Through these services we centralize clients’ applications to deliver them from a data center, not the desktop.
– Workplace Software Management Services. We assist in the planning and automated deployment of operatingsystems, software upgrades and security patches.
– Workplace Server Management Services. We provide IT management for server platforms deployed in complexenvironments.
– Managed Output Services. We provide comprehensive enterprise wide management of office output, offeringmanagement and maintenance of existing office equipment, consumables replenishment and technology refresh.
– Managed Messaging Services. We offer management of the client’s e-mail environment including implementation, upgrades and management of end user e-mail infrastructures.
– Collaboration Services. These services enable workers to come together in virtual ways to communicate, share,manage and use information. Services include secure instant messaging, collaborative workspaces and presenceawareness.
– Service Desk and Site Support Services. We provide a single point of contact for issues related to networks,servers, desktops and mobile devices through Web accessible self-help, on-site support and live agents using fully integrated tools.
• Security and Privacy Services. We offer defined security, privacy and business continuity features embedded at the onset in every EDS offering. These features are the people, tools, processes and controls used by EDS across all portfolioofferings to meet clients’ expectations and industry-specific standards and regulations for security, privacy, businesscontinuity management and risk management. Our Security and Privacy Services offerings include governance, risk and compliance management services, identity & access management services, information security management services and threat & vulnerability management services.
• EDS Networking Services. EDS assists clients in optimizing in-house network operations by leveraging our significantnetwork experience, network management tools, processes, assets and global delivery capabilities. Our networkingservices include the following:
– Network Management Services. EDS Network Management Services increase operational efficiencies and network scalability and align network operations to support client business requirements. Services include: design,deployment, monitoring and management of network devices; asset management; problem, configuration andchange management; performance reporting; and problem resolution.
– IP Communications Services. Our solutions enable secure, integrated enterprise-wide convergence of voice, dataand communications applications and reduce the complexity of enterprise communications. Services includeproject management, site assessment, engineering, call plan development, migration planning, implementation to
AR-3
operation, asset and operating system management, hardware and software upgrades and ongoing support services with focus on device management.
– Enterprise Networking Services. We manage wide area networks and carrier relationships globally on behalf of our clients.
Applications Services. EDS Applications Services help organizations plan, develop, integrate and manage custom applications,packaged software and industry-specific solutions. Services range from outsourcing of applications development and management to project-based work that includes custom application development, the implementation of third-party software and application integration. Benefits to clients for these services can include reduced costs, extended value of technology investments, informationsharing and enhanced ability to adapt to market changes. Our Applications Services include the following:
• Applications Development Services. We create new applications, providing full lifecycle support through delivery. Wedefine the application requirements, analyze application characteristics, implement to a production environment andmonitor performance for a warranted time. Services include custom application development, application testing, mobile applications, workforce enhancement, and enterprise application integration. We also provide implementation, upgradeand consolidation services for enterprise packages such as SAP®, Oracle® and PeopleSoft®.
• Applications Management Services. We offer managed services for specific applications or entire applications portfolios,both custom and packaged, including services for enterprise applications and support for SAP®, Oracle® and PeopleSoft®
software. We assess the specified applications, plan the transition and provide ongoing management to improve clientproductivity and operating efficiency. We also provide applications rationalization, content management integration and legacy application migration services.
• Integrated Applications Services. We engineer solutions such as Service-Oriented Architecture, Portals and Dashboards Services, Web Services and Enterprise Applications Integration Services to support the overall integration of a client’sarchitecture or our own Agile Application Architecture. These services integrate and extend existing packaged and legacy applications.
• Industry-Specific Applications Solutions. These solutions are designed to support industry-specific needs. Our industrysolutions span eight vertical industry segments: communications, energy, financial, government, healthcare,manufacturing, retail and transportation.
Applications Services offerings and capabilities are delivered via the EDS Global Delivery Model, which includes the EDS Best Shore® delivery approach that allows EDS to develop and manage applications in one or more of our Solution Centres strategically located in cost-effective countries. The delivery of our services offers a lifecycle approach with globally integrated, consistentwork processes and tools and project-sharing at multiple facilities on a 24 hours a day, seven days a week basis.
Business Process Outsourcing Services. Our Business Process Outsourcing (BPO) services enable clients to drive operational and organizational efficiency, business process integration, application integration and cost savings. By coupling our IT managementand BPO services with in-depth, industry-specific knowledge, we provide business-focused solutions tailored to meet clients’strategic goals. Our BPO services include the following:
• Billing and Clearing Services. These services help clients manage their business and billing processes, bill paymentservices and content in multiple formats.
• Card Processing Services. We provide a full range of card capabilities that enable clients to manage card issuance,processing and servicing for card issuers and merchant processors.
• Credit Services. We provide credit processing utilities that support a comprehensive, integrated solution, enablingimproved process efficiencies, lower operational costs and improved channel management.
• CRM Services. Our customer relationship management (CRM) services assist our clients in identifying, acquiring,servicing and retaining their customers.
• Document Processing Services. These services enable enterprises to create, capture, customize, archive, manage and share information in any format, including scanned images, print, mail, electronic documents, legacy data, audio or video.
• Finance & Accounting Services. We provide end-to-end services to decrease clients’ costs, reduce time to resolve issues, improve accuracy and cycle time of processes, and create a more cost-effective path to regulatory compliance.
AR-4
• Human Resources (HR) Outsourcing Services. Through ExcellerateHRO, our 86% owned joint venture with TowersPerrin, we provide comprehensive, integrated HR offerings to help enterprises manage their HR knowledge andinformation, enhance decision-making, control program costs and drive efficiency in HR operations.
• Insurance Services. We provide back-office support to streamline payment and administrative processes for life andannuity, property and casualty, and healthcare related claims.
• Payment Services. Our array of electronic, image- and paper-based payment services help businesses increase settlement speed, improve accuracy and manage costs.
• Supply Management Services. Through a combination of processes, strategies and technology, we enable clients totransform their supply chain function and achieve greater economies of scale, automated procurement workflows andreduced operational expenses.
We also deliver industry-specific offerings and provide industry experts to assist clients in key process improvement redesign. One example is our suite of Government BPO Services. For more than 40 years we have provided Medicare and Medicaid claimsprocessing to the U.S. federal and state governments, helping to lower program costs while increasing efficiency and performance.Our offerings to governments also include: fiscal agent services; decision support services; fraud, waste and abuse protectionservices; integrated pharmacy services; Health Insurance Portability and Accountability Act (HIPAA) compliance services;immunization registry and tracking services; and case management services. We also offer Web-based enrollment and eligibility inquiry capabilities. Our industry-specific BPO offerings also support the financial services, manufacturing, healthcare,transportation, communications, energy and consumer and retail industries.
Many BPO services are supported by our reusable, multi-client utility platform. This platform is comprised of key components of our BPO portfolio, including: CRM and call center services; financial process services such as credit services and insuranceservices, payment and settlement, card processing and billing and clearing transactions; and content management services.
EDS Agile Enterprise
The EDS Agile Enterprise Platform is our network-based utility architecture designed to create a more flexible and cost-effectivetechnology foundation for the delivery of a significant portion of our services. By leveraging this platform with our industry widealliance relationships with leading technology companies, we offer flexible IT systems designed to allow clients to manage changethrough agile processes, applications and technology architectures.
Our Website and Availability of Information
We make available free of charge on our Website at www.eds.com/investor our Annual Report on Form 10-K, Quarterly Reportson Form 10-Q, Current Reports on Form 8-K and all amendments to those reports as soon as reasonably practicable after such material is filed with the Securities and Exchange Commission (“SEC”). We also make available on our Website other reportsfiled with the SEC under the Securities Exchange Act of 1934, including our proxy statements and reports filed by officers anddirectors under Section 16(a) of that Act.
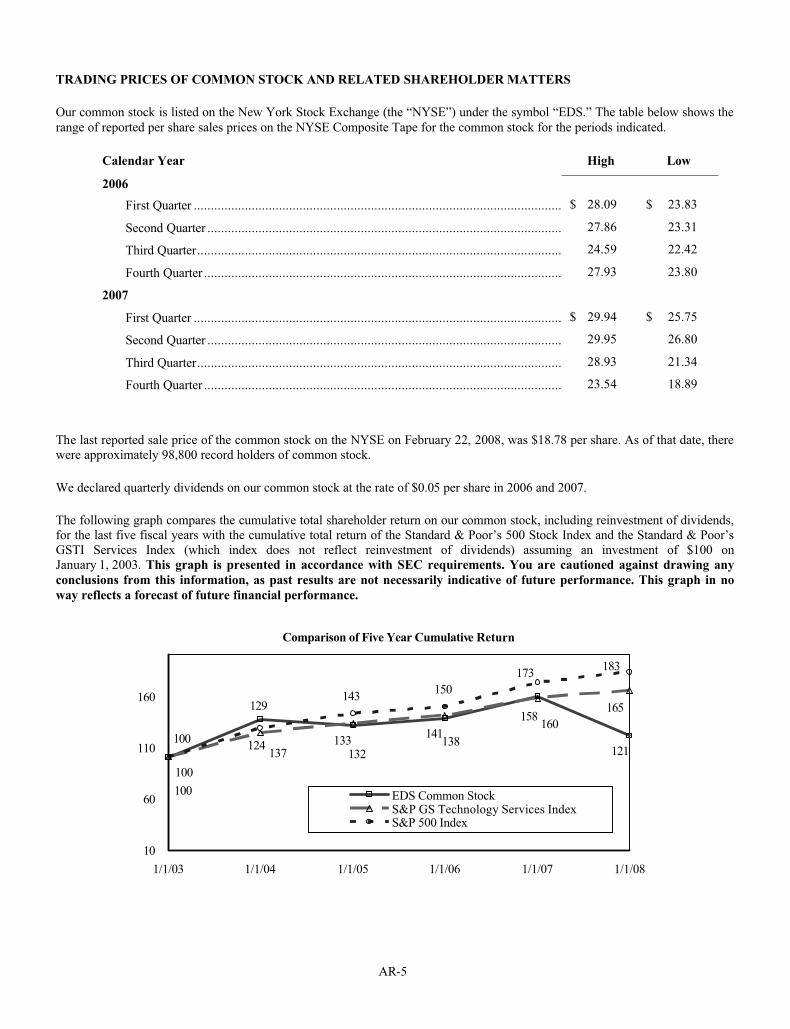
AR-5
TRADING PRICES OF COMMON STOCK AND RELATED SHAREHOLDER MATTERS
Our common stock is listed on the New York Stock Exchange (the “NYSE”) under the symbol “EDS.” The table below shows the range of reported per share sales prices on the NYSE Composite Tape for the common stock for the periods indicated.
Calendar Year High Low
2006
First Quarter ............................................................................................................. $ 28.09 $ 23.83
Second Quarter ......................................................................................................... 27.86 23.31
Third Quarter............................................................................................................ 24.59 22.42
Fourth Quarter .......................................................................................................... 27.93 23.80
2007
First Quarter ............................................................................................................. $ 29.94 $ 25.75
Second Quarter ......................................................................................................... 29.95 26.80
Third Quarter............................................................................................................ 28.93 21.34
Fourth Quarter .......................................................................................................... 23.54 18.89
The last reported sale price of the common stock on the NYSE on February 22, 2008, was $18.78 per share. As of that date, therewere approximately 98,800 record holders of common stock.
We declared quarterly dividends on our common stock at the rate of $0.05 per share in 2006 and 2007.
The following graph compares the cumulative total shareholder return on our common stock, including reinvestment of dividends, for the last five fiscal years with the cumulative total return of the Standard & Poor’s 500 Stock Index and the Standard & Poor’sGSTI Services Index (which index does not reflect reinvestment of dividends) assuming an investment of $100 onJanuary 1, 2003. This graph is presented in accordance with SEC requirements. You are cautioned against drawing any
conclusions from this information, as past results are not necessarily indicative of future performance. This graph in no
way reflects a forecast of future financial performance.
Comparison of Five Year Cumulative Return
150
160
132 121138
100
137124
158
133
165
141
100
173
143129
183
100
10
60
110
160
1/1/03 1/1/04 1/1/05 1/1/06 1/1/07 1/1/08
EDS Common StockS&P GS Technology Services IndexS&P 500 Index
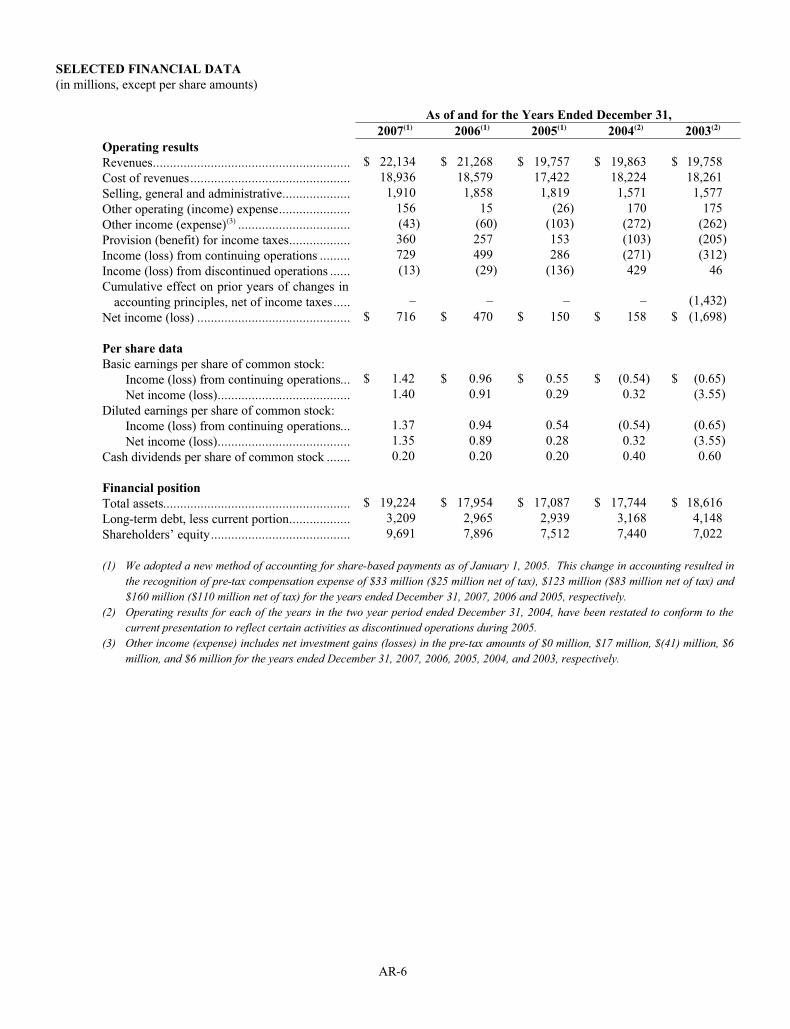
AR-6
SELECTED FINANCIAL DATA
(in millions, except per share amounts)
As of and for the Years Ended December 31,
2007(1) 2006(1) 2005(1) 2004(2) 2003(2)
Operating results
Revenues.......................................................... $ 22,134 $ 21,268 $ 19,757 $ 19,863 $ 19,758
Cost of revenues............................................... 18,936 18,579 17,422 18,224 18,261
Selling, general and administrative.................... 1,910 1,858 1,819 1,571 1,577
Other operating (income) expense..................... 156 15 (26) 170 175
Other income (expense)(3) ................................. (43) (60) (103) (272) (262)
Provision (benefit) for income taxes.................. 360 257 153 (103) (205)
Income (loss) from continuing operations ......... 729 499 286 (271) (312)
Income (loss) from discontinued operations ...... (13) (29) (136) 429 46
Cumulative effect on prior years of changes in
accounting principles, net of income taxes..... – – – – (1,432)
Net income (loss) ............................................. $ 716 $ 470 $ 150 $ 158 $ (1,698)
Per share data
Basic earnings per share of common stock:
Income (loss) from continuing operations... $ 1.42 $ 0.96 $ 0.55 $ (0.54) $ (0.65)
Net income (loss)....................................... 1.40 0.91 0.29 0.32 (3.55)
Diluted earnings per share of common stock:
Income (loss) from continuing operations... 1.37 0.94 0.54 (0.54) (0.65)
Net income (loss)....................................... 1.35 0.89 0.28 0.32 (3.55)
Cash dividends per share of common stock ....... 0.20 0.20 0.20 0.40 0.60
Financial position
Total assets....................................................... $ 19,224 $ 17,954 $ 17,087 $ 17,744 $ 18,616
Long-term debt, less current portion.................. 3,209 2,965 2,939 3,168 4,148
Shareholders’ equity......................................... 9,691 7,896 7,512 7,440 7,022
(1) We adopted a new method of accounting for share-based payments as of January 1, 2005. This change in accounting resulted inthe recognition of pre-tax compensation expense of $33 million ($25 million net of tax), $123 million ($83 million net of tax) and$160 million ($110 million net of tax) for the years ended December 31, 2007, 2006 and 2005, respectively.
(2) Operating results for each of the years in the two year period ended December 31, 2004, have been restated to conform to thecurrent presentation to reflect certain activities as discontinued operations during 2005.
(3) Other income (expense) includes net investment gains (losses) in the pre-tax amounts of $0 million, $17 million, $(41) million, $6 million, and $6 million for the years ended December 31, 2007, 2006, 2005, 2004, and 2003, respectively.
AR-7
MANAGEMENT’S DISCUSSION AND ANALYSIS OF FINANCIAL CONDITION AND RESULTS OF OPERATIONS
The following discussion should be read in conjunction with the consolidated financial statements and related notes that appearelsewhere in this document.
Overview
We are a leading provider of IT infrastructure, applications development and business process outsourcing services to corporateand government clients around the world. This section provides an overview of the principal factors and events that impacted our2007 financial results and may impact future financial results.
Results. We reported revenues of $22.1 billion in 2007, an increase of 4% over 2006 revenues of $21.3 billion. Revenues were flatcompared to 2006 on an organic basis which excludes the impact of currency fluctuations, acquisitions and divestitures. Income from continuing operations was $729 million ($1.42 per basic share and $1.37 per diluted share) in 2007, compared to $499million ($0.96 per basic share and $0.94 per diluted share) in 2006 and $286 million ($0.55 per basic share and $0.54 per dilutedshare) in 2005. Net income was $716 million ($1.40 per basic share and $1.35 per diluted share) in 2007, compared to $470million ($0.91 per basic share and $0.89 per diluted share) in 2006 and $150 million ($0.29 per basic share and $0.28 per dilutedshare) in 2005.
We refer you to “Results of Operations” below for additional information about our results for 2007, 2006 and 2005.
Investments in Infrastructure and Workforce Alignment. We continued to invest significant amounts in our infrastructure andworkforce alignment initiatives in 2007. These investments represented approximately $0.51 per share of expenses during the yearended December 31, 2007, compared to approximately $0.80 per share during the year ended December 31, 2006, and $0.44 per share during the year ended December 31, 2005.
The principal focus of our infrastructure investments in 2007 continued to be the development of our “Agile Enterprise” platform,a network-based utility architecture designed to create a flexible, open and cost-effective technology foundation for the delivery of a significant portion of our IT infrastructure, applications and BPO services, and investments in automation and monitoring toolsand products to improve productivity. This initiative includes investments to drive standardization and automation in our servicedelivery platforms. We completed the migration of certain large clients to our new service delivery platforms in 2006 and 2007.Our infrastructure investments represented approximately $0.38 per share of expenses in 2007, compared to approximately $0.46 per share of expenses in 2006.
Our workforce alignment investments are focused on increasing our capabilities in lower-cost, Best Shore geographies, includingIndia, Latin America, Hungary and China. We increased the number of employees in Best Shore locations from approximately32,000 persons at the end of 2006 to approximately 41,000 at the end of 2007, including approximately 27,000 in India. Our Indiaworkforce includes employees of our majority-owned MphasiS Limited subsidiary, which in 2007 was integrated with our former EDS India operations. Our 2007 initiatives to increase capabilities in Best Shore locations included the transfer of certain internaladministrative functions, which was a principal component of our efforts to reduce our selling, general and administrative(“SG&A”) expenses as a percentage of revenue. Our investments in workforce alignment represented approximately $0.13 pershare of expenses in 2007 (excluding expenses related to the U.S. early retirement offer described below) compared to $0.34 pershare of expenses in 2006.
We expect to significantly increase our overall investment in workforce alignment in 2008 compared to 2007. We expect our 2008 investment in workforce alignment, comprised principally of severance expense and training costs for employees in Best Shorelocations, to be approximately $200 million-$250 million in 2008, or approximately $0.25-0.31 per share. This represents anincremental increase of approximately $100 million-$150 million, or $0.12-0.18 per share, compared to 2007. We expect to incur amajority of the incremental workforce alignment expense during the first half of 2008.
During the third quarter of 2007, we announced an early retirement offer (“ERO”) for approximately 12,000 U.S. employees.Approximately 2,400 employees accepted the ERO. Employees accepting the offer will receive enhanced retirement benefitspayable through normal payment options under the EDS Retirement Plan. In connection with the ERO, we incurred expenses of approximately $154 million, or $0.18 per share, in the fourth quarter of 2007, substantially all of which is attributable to theenhanced retirement benefits. Because substantially all of the ERO cash expenditures will be funded by the EDS Retirement Plan,we do not expect the ERO to result in any material cash expenditures in the future based on the current funded status of that plan.
AR-8
Total Contract Value of New Contract Signings. A significant portion of our revenue is generated by long-term IT servicescontracts. Accordingly, the total contract value, or TCV, of new business signings is a key metric used by management to monitornew business activity. We refer you to the discussion of our calculation of TCV under the heading “Non-GAAP FinancialMeasures” below. The TCV of contract signings (excluding contracts related to discontinued operations) was: 2007 – $19.5billion; 2006 – $26.5 billion; 2005 – $20.1 billion; 2004 – $14.0 billion; and 2003 – $12.6 billion. The TCV of contract signingscan fluctuate significantly from year to year depending on a number of factors, including the number and timing of significant newand renewal contracts (sometimes referred to as “mega-deals”) and the length of those contracts. TCV in 2006 included contract renewals with General Motors and the U.S. Navy totaling $7.5 billion. See “2008 Priorities and Expectations” below for ourexpectations regarding the TCV of new contract signings in 2008.
Acquisition of Saber Government Solutions. On November 30, 2007, we completed the acquisition of an approximate 93 percent equity interest in Saber Government Solutions, a leading provider of software and services to U.S. state and local governments, for approximately $423 million in cash. The acquisition provides us with leverageable platforms for state and local governmentagencies on a global basis. Saber’s current product line includes market-leading software and services that underpin essential,federally funded government functions such as voter registration, election management, public retirement programs, humanservices, public health services, motor vehicle registration and unemployment insurance.
MphasiS. On June 20, 2006, we acquired a controlling interest in MphasiS Limited, an applications and business processoutsourcing services company based in Bangalore, India. The acquisition of MphasiS enhances our capabilities in priority growthareas of applications development and business process outsourcing services. In July 2007, we completed the merger of ElectronicData Systems (India) Private Limited, our wholly-owned Indian subsidiary, into MphasiS. As of December 31, 2007, we owned approximately 61% of MphasiS.
NMCI Contract. We provide end-to-end IT infrastructure on a seat management basis to the Department of Navy (the “DoN”), which includes the U.S. Navy and Marine Corps. Seats are ordered on a governmental fiscal year basis, which runs from October 1through September 30. Under the terms of our contract with the DoN, seat prices were reduced commencing with the three months ended December 31, 2007, which offset the revenue and earnings growth attributable to this contract during the first three quartersof 2007 and will impact year-over-year comparisons of the performance of this contract through the third quarter of 2008. On March 24, 2006, we entered into a contract modification with the DoN pursuant to which, among other amendments, the DoNexercised its option to extend this contract by three years through September 2010. As a result of the contract modification, incompliance with Emerging Issues Task Force 01-8, Determining Whether an Arrangement Contains a Lease, we recognized sales-type capital lease revenue of $116 million in the first quarter of 2006 associated with certain assets previously accounted for asoperating leases, and certain assets previously accounted for as capital leases with an aggregate net investment balance of $113million are now accounted for as operating leases based on revised estimates of economic lives as agreed in the contractmodification (20 years). As a result of the activity on the contract during the first quarter of 2006, including the sales-type capital lease revenue resulting from the contract modification, we recognized net non-recurring income of $0.02 per share during thatquarter. We expect to recover a significant portion of our investment in this contract through the sale of NMCI infrastructure anddesktop assets to the client at the end of the contract term, including amounts in excess of the expected carrying amounts ofcontract assets. Long-lived assets and lease receivables associated with the contract totaled approximately $405 million and $288million, respectively, at December 31, 2007.
U.K. Ministry of Defence Contract. In March 2005, a consortium led by EDS was awarded a 10-year contract for the firstincrement of the U.K. Ministry of Defence (MoD) project to consolidate numerous existing information networks into a singlenext-generation infrastructure (the Defence Information Infrastructure Future project). The total contract value of the initialcontract was approximately $3.9 billion over 10 years. Amendments to this contract in December 2006 and September 2007increased the total contract value by approximately $1.7 billion over the remaining years of the contract. Our upfront expenditureand capital investment requirements for this contract have adversely impacted our free cash flow and earnings during certain fiscalperiods since inception of the contract and may continue to do so in the future. There have occurred and may occur in the futureprogram changes and inabilities to achieve certain related dependencies that extend the initial development timeline. This contractprovides for adjustments to be made to reflect the financial impact to EDS of certain program changes and any inability to achievedependencies. During 2007, we reached a mutually satisfactory agreement with the client regarding some billing adjustmentsunder the contract to reflect part of the financial impact to us of an extended development timeline. We will continue in theongoing course of this contract to work with the client to agree upon any future appropriate adjustments under the contract whichmay be necessary. If we are unable to reach agreement with the client regarding such adjustments, our revenues, earnings and freecash flow for this contract, or the timing of the recognition thereof, could be adversely impacted.
AR-9
Verizon. We provided IT services to MCI, Inc. pursuant to an IT services agreement that included minimum annual purchaseobligations through January 2008. We also procured network telecommunications services from MCI pursuant to an agreementthat included minimum annual purchase obligations through 2010. MCI was acquired by Verizon Communications, Inc. in January 2006. In December 2006, Verizon in-sourced most of the IT services we had been providing to MCI. We received a $90 million payment from Verizon in the fourth quarter of 2006 for assets and transition services. We also received a payment of $225 millionfrom Verizon in the first quarter of 2007 related to the termination of the services we had been providing to MCI. Due to certaincontingencies in our agreement with this client, $100 million of this amount was recognized in the first quarter of 2007 and $125million was deferred and recognized in the third quarter of 2007. We do not expect to recognize any significant revenue orearnings or generate any significant cash flow from this client after 2007. In addition to the changes to our IT services agreement,the agreement pursuant to which we procure telecommunications network services was also amended to, among other things,reduce our minimum annual spend commitment by approximately 50% and provide additional flexibility in our ability to meet that commitment.
Share Count. The weighted-average number of shares used to compute basic and diluted earnings per share were 512 million and 542 million, respectively, for the year ended December 31, 2007, 519 million and 529 million, respectively, for the year endedDecember 31, 2006, and 519 million and 526 million, respectively, for the year ended December 31, 2005. Our share count reflectsshare repurchases as well as shares issued under our employee stock-based compensation programs. Factors that could affect basicand dilutive share counts in the future include the share price and additional repurchases of shares, offset by the dilutive effects of all our employee stock-based compensation plans and our contingently convertible senior notes. The effect of our contingentlyconvertible debt was dilutive for the year ended December 31, 2007. Accordingly, $19 million of tax-effected interest was addedto income from continuing operations and net income and 20 million shares were added to weighted-average shares outstanding in the computation of diluted earnings per share. On a full-year 2008 weighted-average basis, we expect the number of shares used tocompute diluted earnings per share to be approximately 530 million shares, which includes the full effect of our contingentlyconvertible debt.
In April 2007, we completed the $1 billion share repurchase program announced in February 2006. We purchased an aggregate of 37.6 million shares of common stock at a cost of $1 billion (excluding transaction costs) under this program. On December 4,2007, the Board of Directors authorized another $1 billion share repurchase program over 18 months. Through December 31,2007, we had purchased 2.7 million shares at a cost of $57 million under this repurchase program.
2008 Priorities and Expectations. In 2008, we will continue to invest in improving our cost competitiveness, expanding our sales capabilities, growing our applications services business and improving our service quality, client satisfaction and client innovation.We expect that the successful execution of these initiatives in 2008 will position us for free cash flow and operating marginimprovement in 2009.
We currently expect revenues of $22.5 billion plus in 2008, representing growth of approximately 2 percent, including the impactof our Saber acquisition but excluding the impact of currency exchange rates.
We currently expect 2008 adjusted earnings of approximately $1.35 per diluted share. This estimate reflects the expectedworkforce alignment investments discussed above, a planned increase in sales expenses to support growth opportunities and an increase in Other expense (as described under Other income (expense) below), offset by expected improvements in productivityfrom our operations, growth and improved contract performance. We refer you to the discussion of adjusted net income andadjusted earnings per share under “Non-GAAP Financial Measures” below.
We currently expect to generate free cash flow of approximately $900 million in 2008. This reflects the positive impact ofanticipated improvements in our working capital compared to 2007, offset by higher capital expenditures attributable principally to data center expansions and the investments in workforce alignment discussed above. We refer you to the discussion of free cash flow under “Non-GAAP Financial Measures” below.
We currently expect the TCV of new contract signings in 2008 to be in excess of $20 billion. We refer you to the discussion of thecalculation of TCV under the heading “Non-GAAP Financial Measures” below.
The estimates for 2008 financial performance set forth in this Management’s Discussion and Analysis of Financial Condition and Results of Operations rely on management’s current assumptions, including assumptions concerning future events, and are subjectto a number of uncertainties and other factors, many of which are outside the control of management, that could cause actualresults to differ materially from such estimates. For a discussion of these factors, we refer you to the discussion under “RiskFactors” below.
AR-10
Non-GAAP Financial Measures
In addition to generally accepted accounting principles, or GAAP, results, we disclose the non-GAAP measures of adjusted net income, adjusted earnings per share (EPS), and free cash flow. Adjusted net income and adjusted earnings per share exclude the impact of certain special amounts, specifically asset write-offs and other uncapitalized costs associated with acquisitions,earnings/losses from discontinued operations net of taxes, gains and losses from divestitures, reversals of previously recognizedrestructuring expense, charges to earnings attributable to early retirement offers, and other identified items that managementbelieves are not reflective of our core operating business. Such amounts may have a material impact on our net income andearnings per share. We define free cash flow as net cash provided by operating activities, less capital expenditures. Capitalexpenditures is the sum of (i) net cash used in investing activities, excluding proceeds from sales of marketable securities,proceeds related to divested assets and non-marketable equity investments, payments for acquisitions, net of cash acquired, andnon-marketable equity investments, and payments for purchases of marketable securities, and (ii) payments on capital leases. Freecash flow excludes items that are actual expenditures that impact cash available to EDS for other uses and should not beconsidered a measure of liquidity or an alternative to the cash flow measurements required by GAAP, such as net cash provided byoperating activities or net increase (decrease) in cash and cash equivalents. Refer to “Liquidity and Capital Resources” below for a reconciliation of free cash flow to the net increase (decrease) in cash and cash equivalents for the years ended December 31, 2007,2006 and 2005. Management considers these non-GAAP measures an important measure of EDS’ performance. Management uses these measures to evaluate EDS’ core operating performance period-over-period, analyze underlying trends in EDS’ business and establish operational goals and forecasts, including targets for performance-based compensation. EDS may not define adjusted netincome, adjusted earnings per share or free cash flow in the same manner as other companies and, accordingly, the amountsreported by EDS for such measures may not be comparable to similarly titled measures reported by other companies.
We also disclose the TCV of new business signings. Management considers TCV to be an important metric to monitor newbusiness activity. There are no third-party standards or requirements governing the calculation of TCV. The TCV of a clientcontract represents our estimate at contract signing of the total revenue expected over the term of that contract. Contract signingsinclude contracts with new clients and renewals, extensions and add-on business with existing clients. TCV does not includepotential revenues that could be earned from a client relationship as a result of future expansion of service offerings to that client, nor does it reflect option years under non-governmental contracts that are subject to client discretion. TCV reflects a number ofmanagement estimates and judgments regarding the contract, including assumptions regarding demand-driven usage, scope ofwork and client requirements. In addition, our contracts may be subject to currency fluctuations and, for contracts with the U.S.federal government, annual funding constraints and indefinite delivery/indefinite quantity characteristics. Accordingly, the TCVwe report should not be considered firm orders or predictive of future operating results.
Non-GAAP measures are a supplement to, and not a replacement for, GAAP financial measures. To gain a complete picture of our performance, management does (and investors should) rely on our GAAP financial statements.
Results of Operations
Revenues. As-reported growth percentages are calculated using revenues reported in the consolidated statements of income.Organic growth percentages are calculated by removing from current year as-reported revenues the impact of the change inexchange rates between the local currency and the U.S. dollar from the current period and the comparable prior period. It furtherexcludes revenue growth due to acquisitions in the period presented if the comparable prior period had no revenue from the sameacquisition, and revenue decreases due to businesses divested in the period presented or the comparable prior period. Segmentrevenues for non-U.S. operations are measured using fixed currency exchange rates. Differences between the fixed and actualexchange rates are included in the “all other” category.
AR-11
Following is a summary of revenues for the years ended December 31, 2007 and 2006 (in millions):
As-Reported Organic
Consolidated revenues: 2007 2006 Growth % Growth %
Revenues..................................................................... $ 22,134 $ 21,268 4% 0%
% Increase
Segment revenues: 2007 2006 (Decrease)
Americas..................................................................... $ 10,403 $ 10,584 (2)%EMEA......................................................................... 6,433 6,470 (1)%Asia Pacific................................................................. 1,800 1,490 21%U.S. Government......................................................... 2,576 2,520 2%Other........................................................................... 5 3 –
Total Outsourcing................................................. 21,217 21,067 1%All other ...................................................................... 917 201
Total..................................................................... $ 22,134 $ 21,268 4%
The decrease in Americas revenues was primarily attributable to the Verizon contract termination. As discussed above, Verizon in-sourced most of the IT services we had been providing to MCI in December 2006. The decrease in revenues from the Verizon contract was partially offset by revenue growth attributable to a contract with a new client in our consumer and retail industriesgroup and add-on business with an existing client in our financial services industry group. The decrease in EMEA revenues was attributable to the November 2006 divestiture of Global Field Services (“GFS”), our desktop service and support business locatedin Europe, which generated approximately $250 million in revenue in 2006. The decrease in EMEA revenues attributable to this divestiture was substantially offset by a net increase in revenues from client contracts due to certain new contracts in Central andSouth EMEA offset by decreased revenues from certain client contracts, including terminated contracts, in the U.K. Revenuegrowth in Asia Pacific was primarily attributable to our acquisition of MphasiS in the second quarter of 2006, partially offset by a decline in revenues from a client in the financial services industry in Australia. Revenue growth in U.S. Government was primarilyattributable to the NMCI contract partially offset by certain contractual price reductions commencing in the fourth quarter of 2007.Refer to the “Overview” section above for a further discussion of the NMCI contract.
Following is a summary of revenues for the years ended December 31, 2006 and 2005 (in millions):
As-Reported Organic
Consolidated revenues: 2006 2005 Growth % Growth %
Revenues..................................................................... $ 21,268 $ 19,757 8% 7%
% Increase
Segment revenues: 2006 2005 (Decrease)
Americas..................................................................... $ 10,584 $ 10,156 4%EMEA......................................................................... 6,470 5,956 9%Asia Pacific................................................................. 1,490 1,384 8%U.S. Government......................................................... 2,520 2,093 20%Other........................................................................... 3 1 –
Total Outsourcing................................................. 21,067 19,590 8%All other ...................................................................... 201 167
Total..................................................................... $ 21,268 $ 19,757 8%
Revenue growth in the Americas from 2005 to 2006 was primarily attributable to contracts with new clients in our retail, energyand transportation industry groups, add-on business with existing clients in our financial services industry group and in LatinAmerica, and our ExcellerateHRO business which began operations in March 2005. Americas revenues in 2006 includes therecognition of a $90 million payment for assets and transition services related to the in-sourcing of services by Verizon describedabove. Revenue growth in EMEA was primarily attributable to revenues from the U.K. MoD contract, for which 2006 was the first full year of operations, and clients in North and South EMEA, partially offset by a decline in revenues from clients in CentralEMEA and the U.K. Revenue growth in Asia Pacific was primarily attributable to our acquisition of MphasiS in the secondquarter of 2006, partially offset by a decline in revenues from a client in the financial services industry in Australia. Revenuegrowth in U.S. Government was primarily attributable to the NMCI contract and several state Medicaid contracts, partially offsetby the impact of the completion of a large federal contract in 2005. Refer to “Overview” above for a further discussion of the U.K.MoD, NMCI and Verizon contracts.
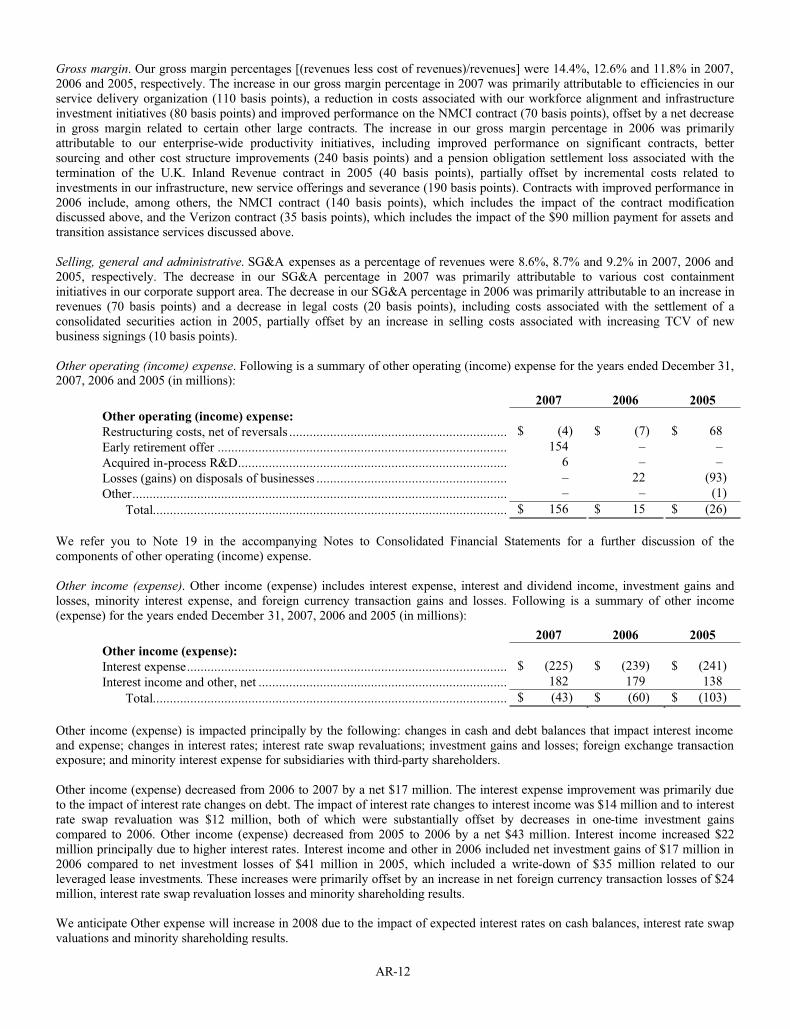
AR-12
Gross margin. Our gross margin percentages [(revenues less cost of revenues)/revenues] were 14.4%, 12.6% and 11.8% in 2007, 2006 and 2005, respectively. The increase in our gross margin percentage in 2007 was primarily attributable to efficiencies in ourservice delivery organization (110 basis points), a reduction in costs associated with our workforce alignment and infrastructureinvestment initiatives (80 basis points) and improved performance on the NMCI contract (70 basis points), offset by a net decreasein gross margin related to certain other large contracts. The increase in our gross margin percentage in 2006 was primarilyattributable to our enterprise-wide productivity initiatives, including improved performance on significant contracts, bettersourcing and other cost structure improvements (240 basis points) and a pension obligation settlement loss associated with thetermination of the U.K. Inland Revenue contract in 2005 (40 basis points), partially offset by incremental costs related toinvestments in our infrastructure, new service offerings and severance (190 basis points). Contracts with improved performance in2006 include, among others, the NMCI contract (140 basis points), which includes the impact of the contract modificationdiscussed above, and the Verizon contract (35 basis points), which includes the impact of the $90 million payment for assets andtransition assistance services discussed above.
Selling, general and administrative. SG&A expenses as a percentage of revenues were 8.6%, 8.7% and 9.2% in 2007, 2006 and 2005, respectively. The decrease in our SG&A percentage in 2007 was primarily attributable to various cost containmentinitiatives in our corporate support area. The decrease in our SG&A percentage in 2006 was primarily attributable to an increase in revenues (70 basis points) and a decrease in legal costs (20 basis points), including costs associated with the settlement of aconsolidated securities action in 2005, partially offset by an increase in selling costs associated with increasing TCV of newbusiness signings (10 basis points).
Other operating (income) expense. Following is a summary of other operating (income) expense for the years ended December 31, 2007, 2006 and 2005 (in millions):
2007 2006 2005
Other operating (income) expense:
Restructuring costs, net of reversals ................................................................ $ (4) $ (7) $ 68
Early retirement offer ..................................................................................... 154 – –
Acquired in-process R&D............................................................................... 6 – –
Losses (gains) on disposals of businesses ........................................................ – 22 (93)
Other.............................................................................................................. – – (1)
Total........................................................................................................ $ 156 $ 15 $ (26)
We refer you to Note 19 in the accompanying Notes to Consolidated Financial Statements for a further discussion of thecomponents of other operating (income) expense.
Other income (expense). Other income (expense) includes interest expense, interest and dividend income, investment gains andlosses, minority interest expense, and foreign currency transaction gains and losses. Following is a summary of other income(expense) for the years ended December 31, 2007, 2006 and 2005 (in millions):
2007 2006 2005
Other income (expense):
Interest expense.............................................................................................. $ (225) $ (239) $ (241)
Interest income and other, net ......................................................................... 182 179 138
Total........................................................................................................ $ (43) $ (60) $ (103)
Other income (expense) is impacted principally by the following: changes in cash and debt balances that impact interest income and expense; changes in interest rates; interest rate swap revaluations; investment gains and losses; foreign exchange transactionexposure; and minority interest expense for subsidiaries with third-party shareholders.
Other income (expense) decreased from 2006 to 2007 by a net $17 million. The interest expense improvement was primarily due to the impact of interest rate changes on debt. The impact of interest rate changes to interest income was $14 million and to interestrate swap revaluation was $12 million, both of which were substantially offset by decreases in one-time investment gainscompared to 2006. Other income (expense) decreased from 2005 to 2006 by a net $43 million. Interest income increased $22million principally due to higher interest rates. Interest income and other in 2006 included net investment gains of $17 million in 2006 compared to net investment losses of $41 million in 2005, which included a write-down of $35 million related to ourleveraged lease investments. These increases were primarily offset by an increase in net foreign currency transaction losses of $24million, interest rate swap revaluation losses and minority shareholding results.
We anticipate Other expense will increase in 2008 due to the impact of expected interest rates on cash balances, interest rate swapvaluations and minority shareholding results.
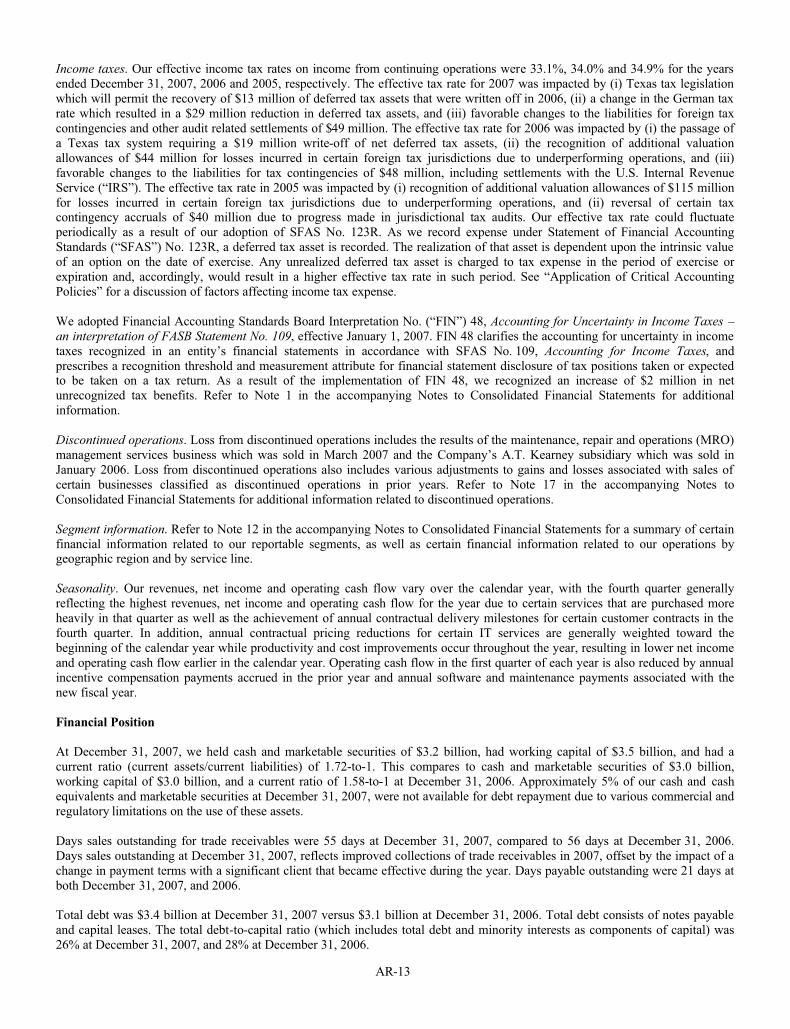
AR-13
Income taxes. Our effective income tax rates on income from continuing operations were 33.1%, 34.0% and 34.9% for the years ended December 31, 2007, 2006 and 2005, respectively. The effective tax rate for 2007 was impacted by (i) Texas tax legislationwhich will permit the recovery of $13 million of deferred tax assets that were written off in 2006, (ii) a change in the German taxrate which resulted in a $29 million reduction in deferred tax assets, and (iii) favorable changes to the liabilities for foreign taxcontingencies and other audit related settlements of $49 million. The effective tax rate for 2006 was impacted by (i) the passage of a Texas tax system requiring a $19 million write-off of net deferred tax assets, (ii) the recognition of additional valuationallowances of $44 million for losses incurred in certain foreign tax jurisdictions due to underperforming operations, and (iii)favorable changes to the liabilities for tax contingencies of $48 million, including settlements with the U.S. Internal RevenueService (“IRS”). The effective tax rate in 2005 was impacted by (i) recognition of additional valuation allowances of $115 millionfor losses incurred in certain foreign tax jurisdictions due to underperforming operations, and (ii) reversal of certain taxcontingency accruals of $40 million due to progress made in jurisdictional tax audits. Our effective tax rate could fluctuateperiodically as a result of our adoption of SFAS No. 123R. As we record expense under Statement of Financial AccountingStandards (“SFAS”) No. 123R, a deferred tax asset is recorded. The realization of that asset is dependent upon the intrinsic valueof an option on the date of exercise. Any unrealized deferred tax asset is charged to tax expense in the period of exercise orexpiration and, accordingly, would result in a higher effective tax rate in such period. See “Application of Critical AccountingPolicies” for a discussion of factors affecting income tax expense.
We adopted Financial Accounting Standards Board Interpretation No. (“FIN”) 48, Accounting for Uncertainty in Income Taxes –an interpretation of FASB Statement No. 109, effective January 1, 2007. FIN 48 clarifies the accounting for uncertainty in income taxes recognized in an entity’s financial statements in accordance with SFAS No. 109, Accounting for Income Taxes, andprescribes a recognition threshold and measurement attribute for financial statement disclosure of tax positions taken or expectedto be taken on a tax return. As a result of the implementation of FIN 48, we recognized an increase of $2 million in netunrecognized tax benefits. Refer to Note 1 in the accompanying Notes to Consolidated Financial Statements for additionalinformation.
Discontinued operations. Loss from discontinued operations includes the results of the maintenance, repair and operations (MRO) management services business which was sold in March 2007 and the Company’s A.T. Kearney subsidiary which was sold inJanuary 2006. Loss from discontinued operations also includes various adjustments to gains and losses associated with sales of certain businesses classified as discontinued operations in prior years. Refer to Note 17 in the accompanying Notes toConsolidated Financial Statements for additional information related to discontinued operations.
Segment information. Refer to Note 12 in the accompanying Notes to Consolidated Financial Statements for a summary of certain financial information related to our reportable segments, as well as certain financial information related to our operations bygeographic region and by service line.
Seasonality. Our revenues, net income and operating cash flow vary over the calendar year, with the fourth quarter generallyreflecting the highest revenues, net income and operating cash flow for the year due to certain services that are purchased moreheavily in that quarter as well as the achievement of annual contractual delivery milestones for certain customer contracts in thefourth quarter. In addition, annual contractual pricing reductions for certain IT services are generally weighted toward thebeginning of the calendar year while productivity and cost improvements occur throughout the year, resulting in lower net incomeand operating cash flow earlier in the calendar year. Operating cash flow in the first quarter of each year is also reduced by annualincentive compensation payments accrued in the prior year and annual software and maintenance payments associated with thenew fiscal year.
Financial Position
At December 31, 2007, we held cash and marketable securities of $3.2 billion, had working capital of $3.5 billion, and had acurrent ratio (current assets/current liabilities) of 1.72-to-1. This compares to cash and marketable securities of $3.0 billion,working capital of $3.0 billion, and a current ratio of 1.58-to-1 at December 31, 2006. Approximately 5% of our cash and cashequivalents and marketable securities at December 31, 2007, were not available for debt repayment due to various commercial and regulatory limitations on the use of these assets.
Days sales outstanding for trade receivables were 55 days at December 31, 2007, compared to 56 days at December 31, 2006.Days sales outstanding at December 31, 2007, reflects improved collections of trade receivables in 2007, offset by the impact of a change in payment terms with a significant client that became effective during the year. Days payable outstanding were 21 days atboth December 31, 2007, and 2006.
Total debt was $3.4 billion at December 31, 2007 versus $3.1 billion at December 31, 2006. Total debt consists of notes payableand capital leases. The total debt-to-capital ratio (which includes total debt and minority interests as components of capital) was26% at December 31, 2007, and 28% at December 31, 2006.
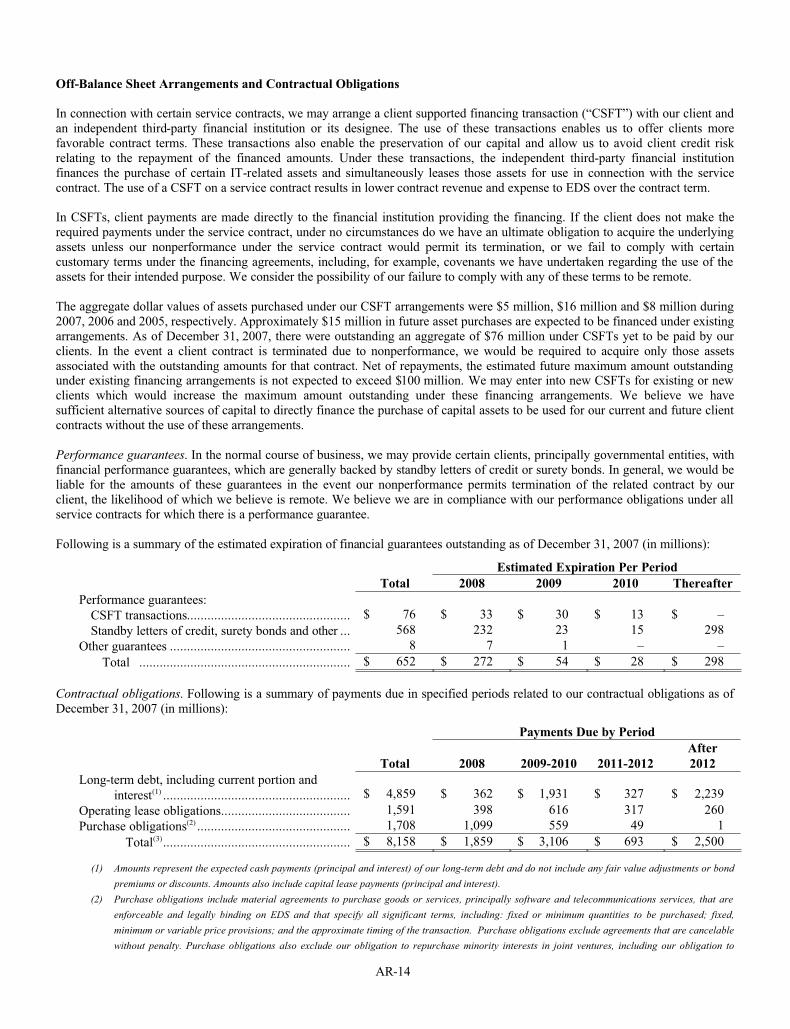
AR-14
Off-Balance Sheet Arrangements and Contractual Obligations
In connection with certain service contracts, we may arrange a client supported financing transaction (“CSFT”) with our client andan independent third-party financial institution or its designee. The use of these transactions enables us to offer clients morefavorable contract terms. These transactions also enable the preservation of our capital and allow us to avoid client credit riskrelating to the repayment of the financed amounts. Under these transactions, the independent third-party financial institutionfinances the purchase of certain IT-related assets and simultaneously leases those assets for use in connection with the servicecontract. The use of a CSFT on a service contract results in lower contract revenue and expense to EDS over the contract term.
In CSFTs, client payments are made directly to the financial institution providing the financing. If the client does not make therequired payments under the service contract, under no circumstances do we have an ultimate obligation to acquire the underlyingassets unless our nonperformance under the service contract would permit its termination, or we fail to comply with certaincustomary terms under the financing agreements, including, for example, covenants we have undertaken regarding the use of the assets for their intended purpose. We consider the possibility of our failure to comply with any of these terms to be remote.
The aggregate dollar values of assets purchased under our CSFT arrangements were $5 million, $16 million and $8 million during 2007, 2006 and 2005, respectively. Approximately $15 million in future asset purchases are expected to be financed under existingarrangements. As of December 31, 2007, there were outstanding an aggregate of $76 million under CSFTs yet to be paid by our clients. In the event a client contract is terminated due to nonperformance, we would be required to acquire only those assetsassociated with the outstanding amounts for that contract. Net of repayments, the estimated future maximum amount outstanding under existing financing arrangements is not expected to exceed $100 million. We may enter into new CSFTs for existing or new clients which would increase the maximum amount outstanding under these financing arrangements. We believe we havesufficient alternative sources of capital to directly finance the purchase of capital assets to be used for our current and future client contracts without the use of these arrangements.
Performance guarantees. In the normal course of business, we may provide certain clients, principally governmental entities, withfinancial performance guarantees, which are generally backed by standby letters of credit or surety bonds. In general, we would be liable for the amounts of these guarantees in the event our nonperformance permits termination of the related contract by ourclient, the likelihood of which we believe is remote. We believe we are in compliance with our performance obligations under allservice contracts for which there is a performance guarantee.
Following is a summary of the estimated expiration of financial guarantees outstanding as of December 31, 2007 (in millions):
Estimated Expiration Per Period
Total 2008 2009 2010 Thereafter
Performance guarantees:
CSFT transactions................................................ $ 76 $ 33 $ 30 $ 13 $ –
Standby letters of credit, surety bonds and other ... 568 232 23 15 298
Other guarantees ..................................................... 8 7 1 – –
Total .............................................................. $ 652 $ 272 $ 54 $ 28 $ 298
Contractual obligations. Following is a summary of payments due in specified periods related to our contractual obligations as of December 31, 2007 (in millions):
Payments Due by Period
Total 2008 2009-2010 2011-2012
After
2012
Long-term debt, including current portion and
interest(1) ....................................................... $ 4,859 $ 362 $ 1,931 $ 327 $ 2,239
Operating lease obligations...................................... 1,591 398 616 317 260
Purchase obligations(2) ............................................. 1,708 1,099 559 49 1
Total(3)....................................................... $ 8,158 $ 1,859 $ 3,106 $ 693 $ 2,500
(1) Amounts represent the expected cash payments (principal and interest) of our long-term debt and do not include any fair value adjustments or bond premiums or discounts. Amounts also include capital lease payments (principal and interest).
(2) Purchase obligations include material agreements to purchase goods or services, principally software and telecommunications services, that are enforceable and legally binding on EDS and that specify all significant terms, including: fixed or minimum quantities to be purchased; fixed,minimum or variable price provisions; and the approximate timing of the transaction. Purchase obligations exclude agreements that are cancelable without penalty. Purchase obligations also exclude our obligation to repurchase minority interests in joint ventures, including our obligation to
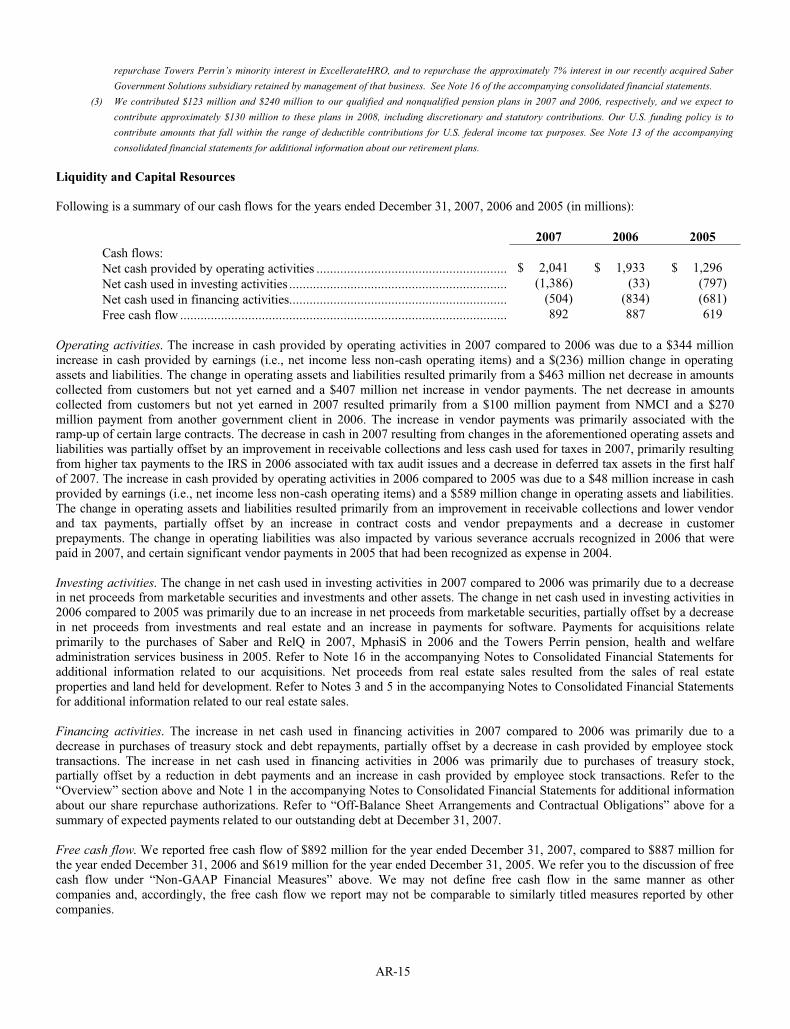
AR-15
repurchase Towers Perrin’s minority interest in ExcellerateHRO, and to repurchase the approximately 7% interest in our recently acquired Saber Government Solutions subsidiary retained by management of that business. See Note 16 of the accompanying consolidated financial statements.
(3) We contributed $123 million and $240 million to our qualified and nonqualified pension plans in 2007 and 2006, respectively, and we expect to contribute approximately $130 million to these plans in 2008, including discretionary and statutory contributions. Our U.S. funding policy is to contribute amounts that fall within the range of deductible contributions for U.S. federal income tax purposes. See Note 13 of the accompanying consolidated financial statements for additional information about our retirement plans.
Liquidity and Capital Resources
Following is a summary of our cash flows for the years ended December 31, 2007, 2006 and 2005 (in millions):
2007 2006 2005
Cash flows:
Net cash provided by operating activities ........................................................ $ 2,041 $ 1,933 $ 1,296
Net cash used in investing activities ................................................................ (1,386) (33) (797)
Net cash used in financing activities................................................................ (504) (834) (681)
Free cash flow ................................................................................................ 892 887 619
Operating activities. The increase in cash provided by operating activities in 2007 compared to 2006 was due to a $344 million increase in cash provided by earnings (i.e., net income less non-cash operating items) and a $(236) million change in operatingassets and liabilities. The change in operating assets and liabilities resulted primarily from a $463 million net decrease in amountscollected from customers but not yet earned and a $407 million net increase in vendor payments. The net decrease in amountscollected from customers but not yet earned in 2007 resulted primarily from a $100 million payment from NMCI and a $270million payment from another government client in 2006. The increase in vendor payments was primarily associated with theramp-up of certain large contracts. The decrease in cash in 2007 resulting from changes in the aforementioned operating assets andliabilities was partially offset by an improvement in receivable collections and less cash used for taxes in 2007, primarily resultingfrom higher tax payments to the IRS in 2006 associated with tax audit issues and a decrease in deferred tax assets in the first half of 2007. The increase in cash provided by operating activities in 2006 compared to 2005 was due to a $48 million increase in cashprovided by earnings (i.e., net income less non-cash operating items) and a $589 million change in operating assets and liabilities.The change in operating assets and liabilities resulted primarily from an improvement in receivable collections and lower vendorand tax payments, partially offset by an increase in contract costs and vendor prepayments and a decrease in customerprepayments. The change in operating liabilities was also impacted by various severance accruals recognized in 2006 that werepaid in 2007, and certain significant vendor payments in 2005 that had been recognized as expense in 2004.
Investing activities. The change in net cash used in investing activities in 2007 compared to 2006 was primarily due to a decrease in net proceeds from marketable securities and investments and other assets. The change in net cash used in investing activities in 2006 compared to 2005 was primarily due to an increase in net proceeds from marketable securities, partially offset by a decreasein net proceeds from investments and real estate and an increase in payments for software. Payments for acquisitions relateprimarily to the purchases of Saber and RelQ in 2007, MphasiS in 2006 and the Towers Perrin pension, health and welfareadministration services business in 2005. Refer to Note 16 in the accompanying Notes to Consolidated Financial Statements for additional information related to our acquisitions. Net proceeds from real estate sales resulted from the sales of real estateproperties and land held for development. Refer to Notes 3 and 5 in the accompanying Notes to Consolidated Financial Statementsfor additional information related to our real estate sales.
Financing activities. The increase in net cash used in financing activities in 2007 compared to 2006 was primarily due to adecrease in purchases of treasury stock and debt repayments, partially offset by a decrease in cash provided by employee stock transactions. The increase in net cash used in financing activities in 2006 was primarily due to purchases of treasury stock,partially offset by a reduction in debt payments and an increase in cash provided by employee stock transactions. Refer to the“Overview” section above and Note 1 in the accompanying Notes to Consolidated Financial Statements for additional information about our share repurchase authorizations. Refer to “Off-Balance Sheet Arrangements and Contractual Obligations” above for asummary of expected payments related to our outstanding debt at December 31, 2007.
Free cash flow. We reported free cash flow of $892 million for the year ended December 31, 2007, compared to $887 million forthe year ended December 31, 2006 and $619 million for the year ended December 31, 2005. We refer you to the discussion of free cash flow under “Non-GAAP Financial Measures” above. We may not define free cash flow in the same manner as othercompanies and, accordingly, the free cash flow we report may not be comparable to similarly titled measures reported by other companies.
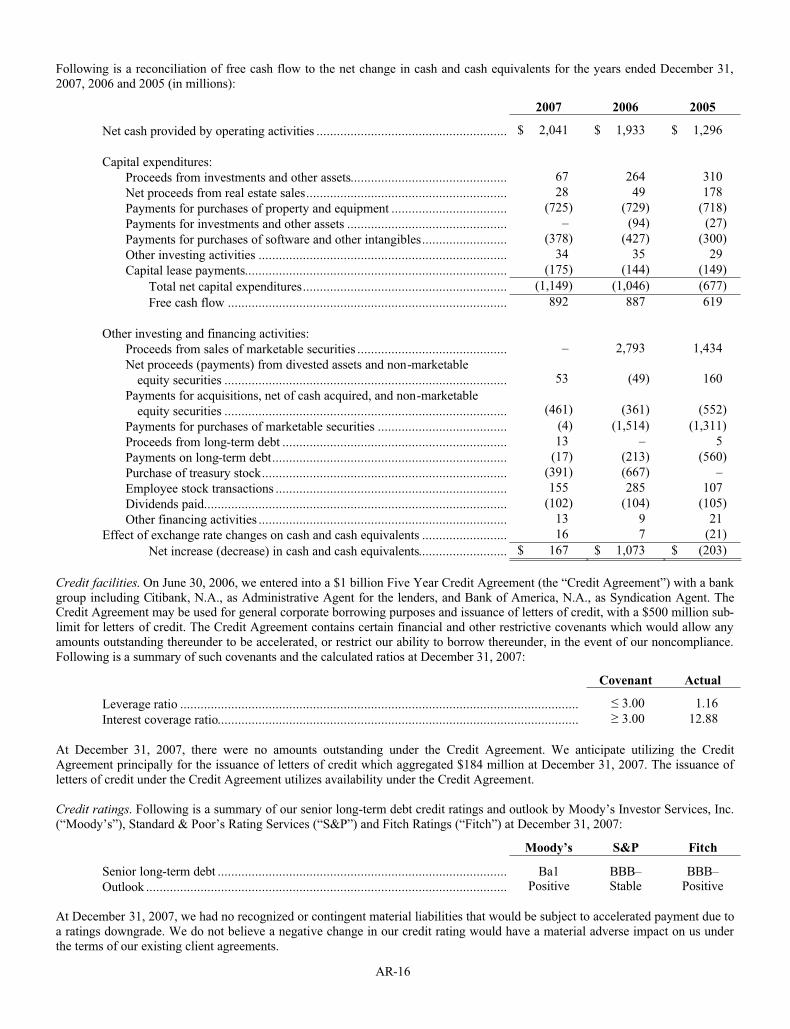
AR-16
Following is a reconciliation of free cash flow to the net change in cash and cash equivalents for the years ended December 31,2007, 2006 and 2005 (in millions):
2007 2006 2005
Net cash provided by operating activities ........................................................ $ 2,041 $ 1,933 $ 1,296
Capital expenditures:
Proceeds from investments and other assets.............................................. 67 264 310
Net proceeds from real estate sales........................................................... 28 49 178
Payments for purchases of property and equipment .................................. (725) (729) (718)
Payments for investments and other assets ............................................... – (94) (27)
Payments for purchases of software and other intangibles......................... (378) (427) (300)
Other investing activities ......................................................................... 34 35 29
Capital lease payments............................................................................. (175) (144) (149)
Total net capital expenditures............................................................ (1,149) (1,046) (677)
Free cash flow .................................................................................. 892 887 619
Other investing and financing activities:
Proceeds from sales of marketable securities ............................................ – 2,793 1,434
Net proceeds (payments) from divested assets and non-marketable
equity securities ................................................................................... 53 (49) 160
Payments for acquisitions, net of cash acquired, and non-marketable
equity securities ................................................................................... (461) (361) (552)
Payments for purchases of marketable securities ...................................... (4) (1,514) (1,311)
Proceeds from long-term debt .................................................................. 13 – 5
Payments on long-term debt..................................................................... (17) (213) (560)
Purchase of treasury stock........................................................................ (391) (667) –
Employee stock transactions .................................................................... 155 285 107
Dividends paid......................................................................................... (102) (104) (105)
Other financing activities ......................................................................... 13 9 21
Effect of exchange rate changes on cash and cash equivalents ......................... 16 7 (21)
Net increase (decrease) in cash and cash equivalents.......................... $ 167 $ 1,073 $ (203)
Credit facilities. On June 30, 2006, we entered into a $1 billion Five Year Credit Agreement (the “Credit Agreement”) with a bank group including Citibank, N.A., as Administrative Agent for the lenders, and Bank of America, N.A., as Syndication Agent. TheCredit Agreement may be used for general corporate borrowing purposes and issuance of letters of credit, with a $500 million sub-limit for letters of credit. The Credit Agreement contains certain financial and other restrictive covenants which would allow anyamounts outstanding thereunder to be accelerated, or restrict our ability to borrow thereunder, in the event of our noncompliance.Following is a summary of such covenants and the calculated ratios at December 31, 2007:
Covenant Actual
Leverage ratio ..................................................................................................................... 3.00 1.16
Interest coverage ratio.......................................................................................................... 3.00 12.88
At December 31, 2007, there were no amounts outstanding under the Credit Agreement. We anticipate utilizing the CreditAgreement principally for the issuance of letters of credit which aggregated $184 million at December 31, 2007. The issuance ofletters of credit under the Credit Agreement utilizes availability under the Credit Agreement.
Credit ratings. Following is a summary of our senior long-term debt credit ratings and outlook by Moody’s Investor Services, Inc. (“Moody’s”), Standard & Poor’s Rating Services (“S&P”) and Fitch Ratings (“Fitch”) at December 31, 2007:
Moody’s S&P Fitch
Senior long-term debt ..................................................................................... Ba1 BBB– BBB–
Outlook .......................................................................................................... Positive Stable Positive
At December 31, 2007, we had no recognized or contingent material liabilities that would be subject to accelerated payment due toa ratings downgrade. We do not believe a negative change in our credit rating would have a material adverse impact on us under the terms of our existing client agreements.
AR-17
Liquidity. At December 31, 2007, we had total liquidity of $3.8 billion, comprised of unrestricted cash and marketable securities of $3.0 billion and availability under our unsecured credit facilities of $816 million. Management currently intends to maintainunrestricted cash and marketable securities in an amount equal to at least $1 billion.
New Accounting Pronouncements
In December 2007, the Financial Accounting Standards Board (“FASB”) issued Statement No. 141R, Business Combinations, and Statement No. 160, Noncontrolling Interests in Consolidated Financial Statements, an amendment of ARB No. 51. Statement No. 141R modifies the accounting and disclosure requirements for business combinations and broadens the scope of the previousstandard to apply to all transactions in which one entity obtains control over another business. Statement No. 160 establishes newaccounting and reporting standards for noncontrolling interests in subsidiaries. We will be required to apply the provisions of the new standards in the first quarter of 2009.
In February 2007, the FASB issued Statement No. 159, The Fair Value Option for Financial Assets and Financial Liabilities. This new standard will allow companies to elect to measure specified financial instruments and warranty and insurance contracts at fairvalue on a contract-by-contract basis, with changes in fair value recognized in earnings in each reporting period. We will berequired to adopt this new standard in the first quarter of 2008.
In September 2006, the FASB issued Statement No. 157, Fair Value Measurements. This new standard defines fair value,establishes a framework for measuring fair value in generally accepted accounting principles, and expands disclosures about fairvalue measurements. The new standard is effective for financial statements issued for fiscal years beginning after November 15,2007, and interim periods within those years. The provisions of the new standard are to be applied prospectively for most financialinstruments and retrospectively for others as of the beginning of the fiscal year in which the standard is initially applied. We will be required to adopt this new standard in the first quarter of 2008.
We adopted FIN 48 effective January 1, 2007. We refer you to “Results of Operations” above and Note 1 in the accompanyingNotes to Consolidated Financial Statements for additional information about this accounting change.
Application of Critical Accounting Policies
The preparation of our financial statements in conformity with generally accepted accounting principles in the United States(“GAAP”) requires us to make estimates, judgments and assumptions that affect the reported amounts of assets and liabilities anddisclosure of contingent assets and liabilities at the date of the consolidated financial statements and the reported amounts ofrevenues and expenses during the reporting period. Our estimates, judgments and assumptions are continually evaluated based on available information and experience. Because of the use of estimates inherent in the financial reporting process, actual resultscould differ from those estimates. Areas in which significant judgments and estimates are used include, but are not limited to,revenue recognition and associated cost deferral, accounts receivable collectibility, accounting for long-lived assets, deferredincome taxes, liabilities for tax contingencies, retirement plans, stock-based compensation, performance guarantees and litigation.
Revenue recognition and associated cost deferral. We provide IT and business process outsourcing services under time-and-material, unit-price and fixed-price contracts, which may extend up to 10 or more years. Services provided over the term of thesearrangements may include one or more of the following: IT infrastructure support and management; IT system and softwaremaintenance; application hosting; the design, development, or construction of software and systems (“Construct Service”);transaction processing; and business process management.
If a contract involves the provision of a single element, revenue is generally recognized when the product or service is providedand the amount earned is not contingent upon any future event. If the service is provided evenly during the contract term butservice billings are irregular, revenue is recognized on a straight-line basis over the contract term. However, if the single service is a Construct Service, revenue is recognized under the percentage-of-completion method usually using a zero-profit methodology. Under this method, costs are deferred until contractual milestones are met, at which time the milestone billing is recognized asrevenue and an amount of deferred costs is recognized as expense so that cumulative profit equals zero. If the milestone billingexceeds deferred costs, then the excess is recorded as deferred revenue. When the Construct Service is completed and the finalmilestone met, all unrecognized costs, milestone billings and profit are recognized in full. If the contract does not containcontractual milestones, costs are expensed as incurred and revenue is recognized in an amount equal to costs incurred untilcompletion of the Construct Service, at which time any profit would be recognized in full. If total costs are estimated to exceedrevenue for the Construct Service, then a provision for the estimated loss is made in the period in which the loss first becomesapparent.
If a contract involves the provision of multiple service elements, total estimated contract revenue is allocated to each elementbased on the relative fair value of each element. The amount of revenue allocated to each element is limited to the amount that is
AR-18
not contingent upon the delivery of another element in the future. Revenue is then recognized for each element as described above for single-element contracts, except revenue recognized on a straight-line basis for a non-Construct Service will not exceedamounts currently billable unless the excess revenue is recoverable from the client upon any contract termination event. If theamount of revenue allocated to a Construct Service is less than its relative fair value, costs to deliver such service equal to thedifference between allocated revenue and the relative fair value are deferred and amortized over the contract term. If totalConstruct Service costs are estimated to exceed the relative fair value for the Construct Service contained in a multiple-elementarrangement, then a provision for the estimated loss is made in the period in which the loss first becomes apparent.
In the rare event that fair value is not determinable for each service element of a multiple-element contract, the contract isconsidered one accounting unit, and revenue is recognized using the proportional performance method. Under this method,contract revenue is recognized for each service element based on the proportional performance of each service element to the totalexpected performance of each service element over the life of the contract.
We also defer and subsequently amortize certain set-up costs related to activities that enable the provision of contracted services to the client. Such activities include the relocation of transitioned employees, the migration of client systems or processes, and theexit of client facilities. Deferred contract costs, including set-up costs, are amortized on a straight-line basis over the remainingoriginal contract term unless billing patterns indicate a more accelerated method is appropriate. The recoverability of deferredcontract costs associated with a particular contract is analyzed whenever events or circumstances indicate that their carrying valuemay not be recoverable using the undiscounted estimated cash flows of the whole contract over its remaining contract term. If suchundiscounted cash flows are insufficient to recover the long-lived assets and deferred contract costs, including contractconcessions paid to the client, the deferred contract costs and contract concessions are written down by the amount of the cashflow deficiency. If a cash flow deficiency remains after reducing the balance of the deferred contract costs and contractconcessions to zero, any remaining long-lived assets are evaluated for impairment. Any such impairment recognized would equal the amount by which the carrying value of the long-lived assets exceeds the fair value of those assets.
Accounts receivable. Reserves for uncollectible trade receivables are established when collection of amounts due from clients isdeemed improbable. Indicators of improbable collection include client bankruptcy, client litigation, industry downturns, client cash flow difficulties or ongoing service or billing disputes. Receivables more than 180 days past due are automatically reserved unlesspersuasive evidence of probable collection exists. Our allowances for doubtful accounts as a percentage of total gross tradereceivables were 1.4% and 1.9% at December 31, 2007 and 2006, respectively.
Long-lived assets. Our property and equipment, software and definite-lived intangible asset policies require the amortization or depreciation of assets over their estimated useful lives. An asset’s useful life is the period over which the asset is expected tocontribute directly or indirectly to our future cash flows. The useful lives of property and equipment are limited to the standarddepreciable lives or, for certain assets dedicated to client contracts, the related contract term. The useful lives of capitalizedsoftware are limited to the shorter of the license period or the related contract term. The estimated useful lives of definite-livedintangible assets are based on the expected use of the asset and factors that may limit the use of the asset. We may utilize theassistance of a third-party appraiser in the assessment of the useful life of an intangible asset.
Goodwill is not amortized, but instead tested for impairment at least annually. The goodwill impairment test requires us to identifyour reporting units, obtain estimates of the fair values of those units as of the testing date and compare the estimated fair value of each unit to its carrying value. Our reporting units are identified based on a review of our internal reporting structure and arecomprised of the components of our operating segments that share similar economic characteristics. The fair value of a reportingunit is the amount at which the unit as a whole could be bought or sold in a current transaction between willing parties. Weestimate the fair values of our reporting units using discounted cash flow valuation models. Those models require estimates offuture revenues, profits, capital expenditures and working capital for each unit. We estimate these amounts by evaluating historicaltrends, current budgets, operating plans and industry data. We utilize our weighted-average cost of capital to discount theestimated expected future cash flows of each unit. We conducted our annual goodwill impairment test for 2007 as of December 1, 2007. The estimated fair value of each of our reporting units exceeded its respective carrying value in 2007 indicating theunderlying goodwill of each unit was not impaired.
We plan to conduct our annual impairment test as of December 1st of each year when our budgets and operating plans for theforthcoming year are expected to be finalized. The timing and frequency of additional goodwill impairment tests are based on anongoing assessment of events and circumstances that would more than likely reduce the fair value of a reporting unit below its carrying value. We will continue to monitor our goodwill balance for impairment and conduct formal tests when impairmentindicators are present. A decline in the fair value of any of our reporting units below its carrying value is an indicator that theunderlying goodwill of the unit is potentially impaired. This situation would require the second step of the goodwill impairmenttest to determine whether the unit’s goodwill is impaired. The second step of the goodwill impairment test is a comparison of theimplied fair value of a reporting unit’s goodwill to its carrying value. An impairment loss is required for the amount which the
AR-19
carrying value of a reporting unit’s goodwill exceeds its implied fair value. The implied fair value of the reporting unit’s goodwillwould become the new cost basis of the unit’s goodwill.
Deferred income taxes. We must make certain estimates and judgments in determining income tax expense for financial statement purposes. These estimates and judgments occur in the calculation of certain tax assets and liabilities, which arise from differencesin the timing of recognition of revenue and expense for tax and financial statement purposes. We must assess the likelihood thatwe will be able to recover our deferred tax assets. In assessing the realizability of deferred tax assets, we consider whether it ismore likely than not that some portion or all of the deferred tax assets will not be realized and adjust the valuation allowancesaccordingly. Factors considered in making this determination include the period of expiration of the tax asset, planned use of thetax asset, tax planning strategies and historical and projected taxable income as well as tax liabilities for the tax jurisdiction in which the tax asset is located. Valuation allowances will be subject to change in each future reporting period as a result of changesin one or more of these factors. A majority of the tax assets are associated with tax jurisdictions in which we have a large scale of operations and long history of generating taxable income, thereby reducing the estimation risk associated with recoverabilityanalysis. However, in smaller tax jurisdictions in which we have less historical experience or smaller scale of operations, theassessment of recoverability of tax assets is largely based on projections of taxable income over the expiration period of the taxasset and is subject to greater estimation risk. Accordingly, it is reasonably possible the recoverability of tax assets in these smaller jurisdictions could be impaired as a result of poor operating performance over extended periods of time or a future decision toreduce or eliminate operating activity in such jurisdictions. Such an impairment would result in an increase in our effective tax rate and related tax expense in the period of impairment.
Liabilities for tax contingencies. We have recorded liabilities for tax contingencies related to positions we have taken that could be challenged by taxing authorities. These potential exposures result from the uncertainties in application of statutes, rules,regulations and interpretations. We recognize liabilities for anticipated tax audit issues in the U.S. and other tax jurisdictions based on our estimate of whether and the extent to which additional taxes will be due. Our estimate of the ultimate tax liability containsassumptions based on past experiences, judgments about potential actions by taxing jurisdictions as well as judgments about thelikely outcome of issues that have been raised by taxing jurisdictions. Although we believe our reserves for tax contingencies arereasonable, they may change in the future due to new developments with each issue. We record an additional charge or benefit inour provision for taxes in the period in which we determine that the recorded tax liability is more or less than we expect theultimate assessment to be.
Retirement plans. We offer pension and other postretirement benefits to our employees through multiple global pension plans. Our largest pension plans are funded through our cash contributions and earnings on plan assets. We use the actuarial models requiredby SFAS No. 87, Employers’ Accounting for Pensions, to account for our pension plans. Two of the most significant actuarialassumptions used to calculate the net periodic pension benefit expense and the related pension benefit obligation for our definedpension benefit plans are the expected long-term rate of return on plan assets and the discount rate assumptions.
SFAS No. 87 requires the use of an expected long-term rate of return that, over time, will approximate the actual long-term returnsearned on pension plan assets. We base this assumption on historical actual returns as well as anticipated future returns based onour investment mix. Given our relatively young workforce, we are able to take a long-term view of our pension investmentstrategy. Accordingly, plan assets are weighted heavily towards equity investments. Equity investments are susceptible tosignificant short-term fluctuations but have historically outperformed most other investment alternatives on a long-term basis. At December 31, 2007, 86% of pension assets were invested in public and private equity and real estate investments with theremaining assets being invested in fixed income securities. Such mix is consistent with that assumed in determining the expectedlong-term rate of return on plan assets. Rebalancing our actual asset allocations to our planned allocations based on actualperformance has not been a significant issue.
An 8.5% and 8.4% weighted-average expected long-term rate of return on plan assets assumption was used for the pension plan actuarial valuations in 2007 and 2006, respectively. A 100 basis point increase or decrease in this assumption results in anestimated pension expense decrease or increase, respectively, of $96 million in the subsequent year’s pension expense (based onthe most recent pension valuation and assuming all other variables are constant).
An assumed discount rate is required to be used in each pension plan actuarial valuation. This rate reflects the underlying ratedetermined on the measurement date at which the pension benefits could effectively be settled. High-quality bond yields on our measurement date, October 31, 2007, with maturities consistent with expected pension payment periods are used to determine the appropriate discount rate assumption. For the countries with the largest pension plans, actual participant data is used by ouractuaries to determine the maturity of the benefit obligation which is matched to bonds available at the measurement date. In othercountries, we use the average age of the participants to determine the maturity of the benefit obligation. The weighted-averagediscount rate assumptions used for the 2007 and 2006 pension plan actuarial valuations were 5.9% and 5.4%, respectively. Themethodology used to determine the appropriate discount rate assumption has been consistently applied. A 100 basis point increasein the discount rate assumption will result in an estimated decrease of approximately $195 million in the subsequent year’s pension
AR-20
expense, and a 100 basis point decrease in the discount rate assumption will result in an estimated increase of approximately $147million in the subsequent year’s pension expense (based on the most recent pension valuation and assuming all other variables areconstant).
Our long-standing policy has been to make consistent cash pension plan contributions and invest plan assets in diversifiedportfolios to provide investment returns that will fund a substantial portion of the ongoing benefit costs. Actual pension plan asset returns have exceeded expected returns reflected in our assumptions in recent years, and we have also experienced rising discountrates that have resulted in substantial improvements to our pension plans’ funded status. The overall funded status increased by$973 million from October 31, 2006, to October 31, 2007, resulting in an increase in shareholders’ equity of $842 million from December 31, 2006, to December 31, 2007. Deferred pension costs were $565 million at December 31, 2007, an increase of $473 million from December 31, 2006. Pension benefit liabilities were $989 million at December 31, 2007, a decrease of $415 millionfrom December 31, 2006.
Our weighted-average long-term rate of return assumption for plan assets as of January 1, 2008, is 8.5%. Our 2008 net periodic benefit cost is expected to decrease from 2007 due to additional cash contributions made in recent years, returns on plan assets in excess of expectations and increases in the discount rates of most countries. Our required minimum amount of 2008 contributionswill be approximately the same as actual contributions made in 2007.
Stock-based compensation. We estimate the fair value of stock options using a Black-Scholes-Merton pricing model. Theoutstanding term of an option is estimated using a simplified method, which is the average of the vesting term and contractual termof the option. Expected volatility during the estimated outstanding term of the option is based on historical volatility during aperiod equivalent to the estimated outstanding term of the option and implied volatility as determined based on observed marketprices of our publicly traded options. Expected dividends during the estimated outstanding term of the option are based on recentdividend activity. Risk-free interest rates are based on the U.S. Treasury yield in effect at the time of the grant. We estimate the fair value of restricted stock units based on the market value of our stock on the date of grant, adjusted for any restrictiveprovisions affecting fair value, such as required holding periods after the date of vesting. Compensation expense for share-basedpayment is charged to operations over the vesting period of the award, and includes an estimate for the number of awards expectedto vest. The initial estimate is based on historical results, and compensation expense is adjusted for actual results. If vesting of such an award is conditioned upon the achievement of performance goals, compensation expense during the performance period isestimated using the most probable outcome of the performance goals, and adjusted as the expected outcome changes.
Other liabilities. In the normal course of business, we may provide certain clients, principally governmental entities, with financial performance guarantees, which are generally backed by standby letters of credit or surety bonds. In general, we would only beliable for the amounts of these guarantees in the event that our nonperformance permits termination of the related contract by ourclient, the likelihood of which we believe is remote. We believe we are in compliance with our performance obligations under allservice contracts for which there is a performance guarantee.
There are various claims and pending actions against EDS arising in the ordinary course of our business. See Note 15 in theaccompanying Notes to Consolidated Financial Statements for a discussion of one current action. Certain of these actions seekdamages in significant amounts. In determining whether a loss accrual or disclosure in our consolidated financial statements isrequired, we consider, among other things, the degree to which we can make a reasonable estimate of the loss, the degree ofprobability of an unfavorable outcome, and the applicability of insurance coverage for a loss. The degree of probability and theloss related to a particular claim are typically estimated with the assistance of legal counsel.
QUANTITATIVE AND QUALITATIVE DISCLOSURES ABOUT MARKET RISK
We are exposed to market risk from changes in interest rates and foreign currency exchange rates. We enter into various hedgingtransactions to manage this risk. We do not hold or issue derivative financial instruments for trading purposes. A discussion of our accounting policies for financial instruments, and further disclosure relating to financial instruments, are included in the notes to the accompanying consolidated financial statements.
Interest rate risk. Interest rate risk is managed through our debt portfolio of fixed- and variable-rate instruments including interest rate swaps. Risk can be estimated by measuring the impact of a near-term adverse movement of 10% in short-term market interest rates. If these rates average 10% more in 2008 than in 2007, there would be no material adverse impact on our results of operationsor financial position. During 2007, had short-term market interest rates averaged 10% more than in 2006, there would have been no material adverse impact on our results of operations or financial position.
Foreign exchange risk. We conduct business in the United States and around the world. Our most significant foreign currencytransaction exposures relate to Canada, Mexico, the United Kingdom, Western European countries that use the euro as a common currency, Australia, India, Israel and Switzerland. The primary purpose of our foreign currency hedging activities is to protectagainst foreign currency exchange risk from intercompany financing and trading transactions. We enter into foreign currency
AR-21
forward contracts and may enter into currency options with durations of generally less than 30 days to hedge such transactions. We have not entered into foreign currency forward contracts for speculative or trading purposes.
Generally, foreign currency forward contracts are not designated as hedges for accounting purposes and changes in the fair valueof these instruments are recognized immediately in earnings. In addition, since we enter into forward contracts only as aneconomic hedge, any change in currency rates would not result in any material gain or loss, as any gain or loss on the underlyingforeign-denominated balance would be offset by the loss or gain on the forward contract. Risk can be estimated by measuring theimpact of a near-term adverse movement of 10% in foreign currency rates against the U.S. dollar. If these rates average 10% morein 2008 than in 2007, there would be no material adverse impact on our results of operations or financial position. During 2007,had foreign currency rates averaged 10% more than in 2006, there would have been no material adverse impact on our results of operations or financial position.
RISK FACTORS
Because of the following factors, as well as other variables affecting our operating results, past financial performance may not be a reliable indicator of future performance, and historical trends should not be used to anticipate results or trends in future periods.
Our engagements with clients may not be profitable. The pricing and other terms of our client contracts, particularly our long-termIT outsourcing agreements, require us to make estimates and assumptions at the time we enter into these contracts that could differfrom actual results. These estimates reflect our best judgments regarding the nature of the engagement and our expected costs to provide the contracted services. Any increased or unexpected costs or unanticipated delays in connection with the performance ofthese engagements, including delays caused by factors outside our control, could make these contracts less profitable orunprofitable, which would have an adverse affect on our profit margin. Our exposure to this risk increases generally in proportionto the scope of the client contract and is higher in the early stages of such contract. In addition, a majority of our IT outsourcingcontracts contain some fixed-price, incentive-based or other pricing terms that condition our fee on our ability to meet definedgoals. Our failure to meet a client’s expectations in any type of contract may result in an unprofitable engagement.
Our ability to recover significant capital investments in certain construct contracts is subject to risks. Some of our client contracts require significant investment in the early stages which is expected to be recovered through billings over the life of the contract.These contracts often involve the construction of new computer systems and communications networks and the development and deployment of new technologies. Substantial performance risk exists in each contract with these characteristics, and some or allelements of service delivery under these contracts are dependent upon successful completion of the development, construction anddeployment phases. At December 31, 2007, approximately $535 million of our deferred construct and set-up costs related tocontracts with active construct activities. We normally have approximately 20 to 25 active construct contracts with deferred costsin excess of $1 million. Some of these contracts experience delays in their development and construction phases and certainmilestones may be missed. Therefore, it is reasonably possible that deferred costs associated with one or more of these contractscould become impaired due to changes in estimates of future contract cash flows.
A decline in revenues from or loss of significant clients could reduce our revenues and profitability. Our success is to a significant degree dependent on our ability to retain our significant clients and maintain or increase the level of revenues from these clients,including in particular revenues from certain “mega-deal” long-term IT outsourcing agreements. We may lose clients due to theirmerger or acquisition, business failure, contract expiration or their conversion to a competing service provider or decision to in-source services. We may not be able to retain or renew relationships with our significant clients in the future. As a result ofbusiness downturns or for other business reasons, we are also vulnerable to reduced processing volumes from our clients, which can reduce the scope of services provided and the prices for those services. We may not be able to replace the revenue andearnings from any such lost client or reduction in services in the short or long-term. In addition, our contracts may allow a client to terminate the contract for convenience. In these cases we seek, through the terms of the contract, to recover our investment in the contract. There is no assurance we will be able to fully recover our investments in such circumstances.
Pending litigation could have a material adverse affect on our liquidity and financial condition. We are defendants in variousclaims and pending actions arising in the ordinary course of business or otherwise. We refer you to the discussion of “PendingLitigation and Proceedings” under Note 15 to the accompanying consolidated financial statements for a description of one of thesematters. We are not able to predict the ultimate impact of these matters on us or our consolidated financial statements. However,we may be required to pay judgments or settlements and incur expenses in aggregate amounts that could have a material adverse affect on our liquidity and earnings.
If we are unable to protect client information from theft or loss, our reputation could be harmed, and we could suffer significantfinancial loss. As with all IT outsourcing companies, we are vulnerable to negative impacts if sensitive information from ourclients or their customers is inadvertently compromised or lost. We routinely process, store and transmit large amounts of data for our clients which includes sensitive and personally identifiable information, such as Social Security numbers, healthcareinformation, credit card and personal financial information. We are subject to numerous U.S. and foreign laws designed to protectthis information. Loss or compromise of this data could cost us both monetarily and in terms of client good will and lost business.In order to reduce the risk of such an incident and minimize the consequences should one occur, we continually enhance our
AR-22
comprehensive security program combining industry best practices, specific industry regulatory requirements, and various globalsecurity standards. Notwithstanding this comprehensive security program, there can be no assurance that we will not experience adata loss or security breach that would materially adversely impact our earnings or liquidity.
Our exposure to certain industries and financially troubled customers may adversely affect our financial results. Our exposure to certain industries and financially troubled customers has had, and could in the future have, a material adverse affect on ourfinancial position and our results of operations. For example, we are a leading provider of IT outsourcing services to the UnitedStates automobile and airline industries, which sectors have experienced significant financial difficulties.
Impact of rating agency downgrades. Any adverse action by Moody’s, S&P or Fitch with respect to our long-term credit ratings could materially adversely impact our ability to compete for new business, our cost of capital and our ability to access capital.
Some of our contracts contain benchmarking provisions that could decrease our revenues and profitability. Some of our IToutsourcing agreements contain pricing provisions that permit a client to request a benchmark study by a mutually acceptablethird-party benchmarker. Typically, benchmarking may not be conducted during the initial years of the contract term but may be requested by a client periodically thereafter, subject to restrictions which limit benchmarking to certain groupings of services and limit the number of times benchmarking may be conducted during the term of the contract. Generally, the benchmarking compares the contractual price of our services against the price of similar services offered by other specified providers in a peer comparisongroup, subject to agreed upon adjustment and normalization factors. Generally, if the benchmarking study shows that our pricinghas a difference outside a specified range, and the difference is not due to the unique requirements of the client, then the partieswill negotiate in good faith any appropriate adjustments to the pricing. This may result in the reduction of our rates for thebenchmarked services. Due to the enhanced focus of our clients on reducing their technology costs, as well as the uncertainties and complexities inherent in benchmarking comparisons, our clients may increasingly attempt to obtain additional price reductionsbeyond those already embedded in our contract rates through the exercise of benchmarking provisions. Also, if we cannot agree with our client on post-benchmarking pricing adjustments, the contract may permit the client to exercise an early termination right,which may or may not involve payment of a termination fee. Such activities could negatively impact our results of operations orcash flow in 2008 or thereafter to a greater extent than has been our prior experience.
The markets in which we operate are highly competitive, and we may not be able to compete effectively. The markets in which we operate include a large number of participants and are highly competitive. Our primary competitors are IT service providers, largeconsulting and other professional service firms, applications service providers, telecommunications companies, packaged softwarevendors and resellers and service groups of computer equipment companies. We also experience competition from numeroussmaller, niche-oriented and regionalized service providers. Our business experiences rapid changes in the competitive landscape,with our competitors moving operations offshore to reduce their costs as well as increased competition from offshore providers,primarily India-based competitors. The competition from India-based companies continues to grow in intensity due to theabundance of highly skilled workers in the country, a pro-business regulatory environment and significantly lower costs of labor.Although we have significantly increased our labor resources in India and other lower cost locations in recent years, competitorswith a greater presence in such areas may be able to offer lower prices than we are able to offer. Any of these factors may imposeadditional pricing pressure on us, which could have an adverse affect on our revenues and profit margin.
Unanticipated changes in our tax provisions or exposure to additional tax liabilities could affect our profitability. We are subjectto income taxes in the United States and numerous foreign jurisdictions. We are subject to ongoing tax audits in variousjurisdictions. Tax authorities may disagree with our intercompany charges or other matters and assess additional taxes. Ourprovision for income taxes and cash tax liability in the future could be adversely affected by numerous factors including, but notlimited to, income before taxes being lower than anticipated in countries with accumulated tax losses and higher than anticipated incountries with higher statutory tax rates, changes in the valuation of deferred tax assets and liabilities, changes in tax laws,regulations, accounting principles or interpretations thereof, and the discovery of new information in the course of our tax returnpreparation process, which could adversely impact our results of operations and financial condition in future periods. In particular,the carrying value of deferred tax assets is dependent on our ability to generate future taxable income over the expiration period of the tax asset. An impairment of deferred tax assets would result in an increase in our effective tax rate and related tax expense in the period of impairment and could affect our profitability.
Risks associated with our non-U.S. operations could negatively affect our earnings. Non-U.S. operations accounted forapproximately 48% of our revenues in 2007 and will continue to represent a substantial portion of our business. Our results of operations are affected by our ability to manage risks inherent in doing business abroad. These risks include exchange ratefluctuation, regulatory concerns, terrorist activity, restrictions with respect to the movement of currency, access to highly skilledlabor, political and economic instability and our ability to protect our intellectual property. Any of these risks could result inincreased costs or otherwise materially adversely affect our financial condition or results of operations and may also impede ourability to expand our international business.
As of December 31, 2007, we owned an approximately 61% interest in MphasiS Limited, a publicly traded applications andbusiness process outsourcing services company based in Bangalore, India. In connection with this investment, we are exposed to additional international risks, including being subject to Indian securities laws and regulations. If we fail to comply with the
AR-23
requirements of the Stock Exchange Board of India, the stock exchanges upon which MphasiS is listed or any of the otherapplicable Indian regulatory authorities, our investment in MphasiS could be materially adversely affected, and such violationcould result in significant legal consequences to us.
Our services or products may infringe upon the intellectual property rights of others. We cannot be sure that our services andproducts, or the products of others that we offer to our clients, do not infringe on the intellectual property rights of third parties,and we may have infringement claims asserted against us. These claims may harm our reputation, cost us money and prevent usfrom offering some services or products. We generally agree in our contracts to indemnify our clients for any expenses orliabilities they may incur resulting from claimed infringements of the intellectual property rights of third parties. In some instances,the amount of these indemnities may be greater than the revenues we receive from the client. Any claims or litigation in this area,whether we ultimately win or lose, could be time-consuming and costly, injure our reputation or require us to enter into royalty or licensing arrangements. We may, in limited cases, be required to forego rights to the use of intellectual property we help create,which limits our ability to also provide that intellectual property to other clients. Any limitation on our ability to provide a service or product could cause us to lose revenue-generating opportunities and require us to incur additional expenses to develop new ormodified solutions for future projects.
A material weakness in our internal controls could have a material adverse affect on us. Effective internal controls are necessary for us to provide reasonable assurance with respect to our financial reports and to effectively prevent fraud. If we cannot providereasonable assurance with respect to our financial reports and effectively prevent fraud, our reputation and operating results couldbe harmed. Pursuant to the Sarbanes-Oxley Act of 2002, we are required to furnish a report by management on internal control over financial reporting, including management’s assessment of the effectiveness of such control. Internal control over financialreporting may not prevent or detect misstatements because of its inherent limitations, including the possibility of human error, the circumvention or overriding of controls, or fraud. Therefore, even effective internal controls can provide only reasonable assurancewith respect to the preparation and fair presentation of financial statements. In addition, projections of any evaluation ofeffectiveness of internal control over financial reporting to future periods are subject to the risk that the control may becomeinadequate because of changes in conditions, or that the degree of compliance with the policies or procedures may deteriorate. Ifwe fail to maintain the adequacy of our internal controls, including any failure to implement required new or improved controls, or if we experience difficulties in their implementation, our business and operating results could be adversely impacted, we could fail to meet our reporting obligations, and our business and stock price could be adversely affected.
Cautionary Statement Regarding Forward-Looking Statements
The statements in this Report that are not historical statements are “forward-looking statements” within the meaning of the PrivateSecurities Litigation Reform Act of 1995. These forward-looking statements include statements regarding estimated revenues,earnings, free cash flow, total contract value (“TCV”) of new contract signings, operating margins and other forward-lookingfinancial information. In addition, we have made in the past and may make in the future other written or oral forward-lookingstatements, including statements regarding future financial and operating performance (including revenue, earnings, free cash flowand operating margins), future cost savings, the timing of the revenue, earnings and free cash flow impact of new and existingcontracts, liquidity, future revenues from new or existing clients, the TCV of new contract signings, business pipeline, industrygrowth rates and our performance relative thereto, the impact of acquisitions and divestitures, and the impact of clientbankruptcies. Any forward-looking statement may rely on a number of assumptions concerning future events and be subject to a number of uncertainties and other factors, many of which are outside our control, that could cause actual results to differ materiallyfrom such statements. In addition to the factors outlined above, these factors include, but are not limited to, the following: theperformance of current and future client contracts in accordance with our cost, revenue and cash flow estimates, including ourability to achieve any operational efficiencies in our estimates; for contracts with U.S. federal government clients, including our NMCI contract, the government’s ability to cancel the contract or impose additional terms and conditions due to changes ingovernment funding, deployment schedules, military action or otherwise; our ability to access the capital markets, including ourability to obtain capital leases, surety bonds and letters of credit; the impact of third-party benchmarking provisions in certainclient contracts; the impact on a historical and prospective basis of accounting rules and pronouncements; the impact of claims,litigation and governmental investigations; the success of our cost-cutting initiatives and the timing and amount of any resultingbenefits; the impact of acquisitions and divestitures; a reduction in the carrying value of our assets; the impact of a bankruptcy or financial difficulty of a significant client on the financial and other terms of our agreements with that client; with respect to the funding of pension plan obligations, the performance of our investments relative to our assumed rate of return; changes in tax lawsand interpretations and failure to obtain treaty relief from double taxation; failure to obtain or protect intellectual property rights; fluctuations in foreign currency, exchange rates and interest rates; the impact of competition on pricing, revenues and margins; and the degree to which third parties continue to outsource IT and business processes. We disclaim any intention or obligation toupdate or revise any forward-looking statements whether as a result of new information, future events or otherwise, except as maybe required by law.
AR-24
FINANCIAL STATEMENTS AND SUPPLEMENTARY DATA
MANAGEMENT REPORT
MANAGEMENT RESPONSIBILITY FOR FINANCIAL INFORMATION
Responsibility for the objectivity, integrity, and presentation of the accompanying financial statements and other financialinformation presented in this report rests with EDS management. The accompanying financial statements have been prepared in accordance with accounting principles generally accepted in the United States. The financial statements include amounts that arebased on estimates and judgments which management believes are reasonable under the circumstances.
KPMG LLP, independent auditors, is retained to audit EDS’ consolidated financial statements and the effectiveness of thecompany’s internal control over financial reporting. Its accompanying report is based on audits conducted in accordance with thestandards of the Public Company Accounting Oversight Board (United States).
The Audit Committee of the Board of Directors is composed solely of independent, non-employee directors, and is responsible forrecommending to the Board the independent auditing firm to be retained for the coming year. The Audit Committee meetsregularly and privately with the independent auditors, with the company’s internal auditors, and with management to reviewaccounting, auditing, internal control and financial reporting matters.
MANAGEMENT’S REPORT ON INTERNAL CONTROL OVER FINANCIAL REPORTING
Management of EDS is responsible for establishing and maintaining adequate internal control over financial reporting as defined in Rule 13a-15(f) or 15d-15(f) promulgated under the Securities Exchange Act of 1934. Those rules define internal control over financial reporting as a process designed to provide reasonable assurance regarding the reliability of financial reporting and thepreparation of financial statements for external purposes in accordance with accounting principles generally accepted in the UnitedStates of America. EDS’ internal control over financial reporting includes those policies and procedures that:
• pertain to the maintenance of records that, in reasonable detail, accurately and fairly reflect the transactions anddispositions of the assets of EDS;
• provide reasonable assurance that transactions are recorded as necessary to permit preparation of financial statements in accordance with accounting principles generally accepted in the United States of America;
• provide reasonable assurance that receipts and expenditures of EDS are being made only in accordance withauthorization of management and directors of EDS; and
• provide reasonable assurance regarding prevention or timely detection of unauthorized acquisition, use or disposition of EDS’ assets that could have a material effect on the consolidated financial statements.
Because of its inherent limitations, internal control over financial reporting may not prevent or detect misstatements. Also,projections of any evaluation of effectiveness to future periods are subject to the risk that controls may become inadequate becauseof changes in conditions, or that the degree of compliance with the policies or procedures may deteriorate. EDS management assessed the effectiveness of EDS’ internal control over financial reporting as of December 31, 2007. In making this assessment, management used the criteria described in “Internal Control – Integrated Framework” issued by the Committee of Sponsoring Organizations of the Treadway Commission. Management’s assessment included an evaluation of the design of EDS’ internal control over financial reporting and testing of the operational effectiveness of its internal control over financial reporting.Management reviewed the results of its assessment with the Audit Committee of our Board of Directors.
Based on this assessment and those criteria, management believes that EDS maintained, in all material respects, effective internalcontrol over financial reporting as of December 31, 2007.
Ronald A. RittenmeyerCHAIRMAN OF THE BOARD, PRESIDENTAND CHIEF EXECUTIVE OFFICERFebruary 27, 2008
Ronald P. VargoEXECUTIVE VICE PRESIDENT ANDCHIEF FINANCIAL OFFICERFebruary 27, 2008
AR-25
REPORT OF INDEPENDENT REGISTERED PUBLIC ACCOUNTING FIRM
The Board of DirectorsElectronic Data Systems Corporation:
We have audited Electronic Data Systems Corporation and subsidiaries’ (the “Company”) internal control over financial reporting as of December 31, 2007, based on criteria established in Internal Control – Integrated Framework issued by the Committee of Sponsoring Organizations of the Treadway Commission (“COSO”). The Company’s management is responsible for maintainingeffective internal control over financial reporting and for its assessment of the effectiveness of internal control over financialreporting. Our responsibility is to express an opinion on the Company’s internal control over financial reporting based on ouraudit.
We conducted our audit in accordance with the standards of the Public Company Accounting Oversight Board (United States).Those standards require that we plan and perform the audit to obtain reasonable assurance about whether effective internal controlover financial reporting was maintained in all material respects. Our audit included obtaining an understanding of internal controlover financial reporting, assessing the risk that a material weakness exists, and testing and evaluating the design and operatingeffectiveness of internal control based on the assessed risk. Our audit also included performing such other procedures as weconsidered necessary in the circumstances. We believe that our audit provides a reasonable basis for our opinion.
A company’s internal control over financial reporting is a process designed to provide reasonable assurance regarding thereliability of financial reporting and the preparation of financial statements for external purposes in accordance with generallyaccepted accounting principles. A company’s internal control over financial reporting includes those policies and procedures that(1) pertain to the maintenance of records that, in reasonable detail, accurately and fairly reflect the transactions and dispositions of the assets of the company; (2) provide reasonable assurance that transactions are recorded as necessary to permit preparation of financial statements in accordance with generally accepted accounting principles, and that receipts and expenditures of thecompany are being made only in accordance with authorizations of management and directors of the company; and (3) providereasonable assurance regarding prevention or timely detection of unauthorized acquisition, use, or disposition of the company’sassets that could have a material effect on the financial statements.
Because of its inherent limitations, internal control over financial reporting may not prevent or detect misstatements. Also,projections of any evaluation of effectiveness to future periods are subject to the risk that controls may become inadequate becauseof changes in conditions, or that the degree of compliance with the policies or procedures may deteriorate.
In our opinion, the Company maintained, in all material respects, effective internal control over financial reporting as ofDecember 31, 2007, based on criteria established in Internal Control – Integrated Framework issued by COSO.
We also have audited, in accordance with the standards of the Public Company Accounting Oversight Board (United States), the consolidated balance sheets of Electronic Data Systems Corporation and subsidiaries as of December 31, 2007 and 2006, and the related consolidated statements of income, shareholders’ equity and comprehensive income (loss), and cash flows for each of theyears in the three-year period ended December 31, 2007, and the related financial statement schedule, and our report datedFebruary 27, 2008, expressed an unqualified opinion on those consolidated financial statements and schedule.
KPMG LLPDallas, TexasFebruary 27, 2008
AR-26
REPORT OF INDEPENDENT REGISTERED PUBLIC ACCOUNTING FIRM
The Board of DirectorsElectronic Data Systems Corporation:
We have audited the accompanying consolidated balance sheets of Electronic Data Systems Corporation and subsidiaries as ofDecember 31, 2007 and 2006, and the related consolidated statements of income, shareholders’ equity and comprehensive income (loss), and cash flows for each of the years in the three-year period ended December 31, 2007. In connection with our audits of the consolidated financial statements, we have also audited the related financial statement schedule. These consolidated financialstatements and financial statement schedule are the responsibility of the Company’s management. Our responsibility is to expressan opinion on these consolidated financial statements and financial statement schedule based on our audits.
We conducted our audits in accordance with the standards of the Public Company Accounting Oversight Board (United States).Those standards require that we plan and perform the audit to obtain reasonable assurance about whether the financial statementsare free of material misstatement. An audit includes examining, on a test basis, evidence supporting the amounts and disclosures in the financial statements. An audit also includes assessing the accounting principles used and significant estimates made bymanagement, as well as evaluating the overall financial statement presentation. We believe that our audits provide a reasonablebasis for our opinion.
In our opinion, the consolidated financial statements referred to above present fairly, in all material respects, the financial position of Electronic Data Systems Corporation and subsidiaries as of December 31, 2007 and 2006, and the results of their operations andtheir cash flows for each of the years in the three-year period ended December 31, 2007, in conformity with U.S. generallyaccepted accounting principles. Also in our opinion, the related financial statement schedule, when considered in relation to thebasic consolidated financial statements taken as a whole, presents fairly, in all material respects, the information set forth therein.
As discussed in Note 1 to the consolidated financial statements, during 2007, the Company adopted Financial Standards BoardInterpretation No. 48, Accounting for Uncertainty in Income Taxes, during 2006, the Company adopted Statement of FinancialAccounting Standards (SFAS) No. 158, Employers’ Accounting for Defined Benefit Pension and Other Post Retirement Plans – an Amendment of FASB Statements No. 87, 88, 106, and 132R, and, during 2005, the Company adopted SFAS No. 123R, Share-Based Payment.
We also have audited, in accordance with the standards of the Public Company Accounting Oversight Board (United States),Electronic Data Systems Corporation and subsidiaries’ internal control over financial reporting as of December 31, 2007, based oncriteria established in Internal Control – Integrated Framework issued by the Committee of Sponsoring Organizations of theTreadway Commission (COSO), and our report dated February 27, 2008, expressed an unqualified opinion on the effectiveness of the Company’s internal control over financial reporting.
KPMG LLPDallas, TexasFebruary 27, 2008
AR-27
ELECTRONIC DATA SYSTEMS CORPORATION AND SUBSIDIARIES
CONSOLIDATED STATEMENTS OF INCOME(in millions, except per share amounts)
Years Ended December 31,
2007 2006 2005
Revenues ..................................................................................................................... $ 22,134 $ 21,268 $ 19,757
Costs and expenses
Cost of revenues.................................................................................................... 18,936 18,579 17,422
Selling, general and administrative ........................................................................ 1,910 1,858 1,819
Other operating (income) expense.......................................................................... 156 15 (26)
Total costs and expenses................................................................................. 21,002 20,452 19,215
Operating income ........................................................................................... 1,132 816 542
Interest expense ........................................................................................................... (225) (239) (241)
Interest income and other, net ....................................................................................... 182 179 138
Other income (expense) .................................................................................. (43) (60) (103)
Income from continuing operations before income taxes ................................. 1,089 756 439
Provision for income taxes ........................................................................................... 360 257 153
Income from continuing operations................................................................. 729 499 286
Loss from discontinued operations, net of income taxes ................................................ (13) (29) (136)
Net income..................................................................................................... $ 716 $ 470 $ 150
Basic earnings per share of common stock
Income from continuing operations................................................................. $ 1.42 $ 0.96 $ 0.55
Loss from discontinued operations.................................................................. (0.02) (0.05) (0.26)
Net income..................................................................................................... $ 1.40 $ 0.91 $ 0.29
Diluted earnings per share of common stock
Income from continuing operations................................................................. $ 1.37 $ 0.94 $ 0.54
Loss from discontinued operations.................................................................. (0.02) (0.05) (0.26)
Net income..................................................................................................... $ 1.35 $ 0.89 $ 0.28
See accompanying notes to consolidated financial statements.
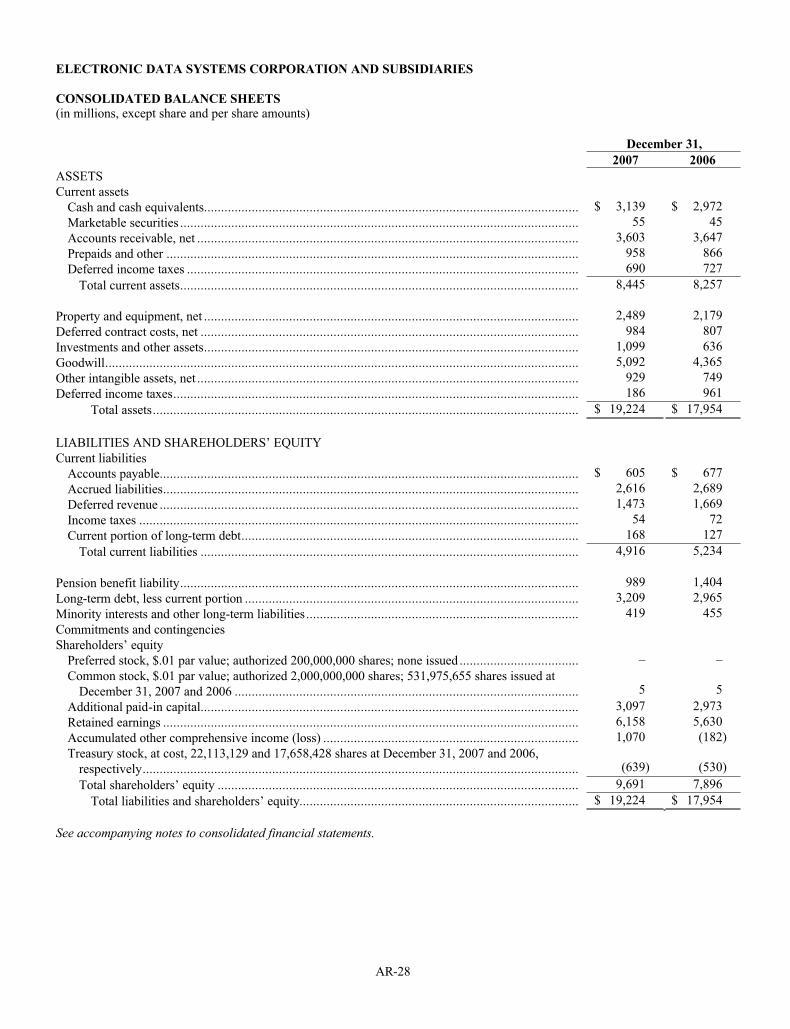
AR-28
ELECTRONIC DATA SYSTEMS CORPORATION AND SUBSIDIARIES
CONSOLIDATED BALANCE SHEETS(in millions, except share and per share amounts)
December 31,
2007 2006
ASSETS
Current assets
Cash and cash equivalents.............................................................................................................. $ 3,139 $ 2,972
Marketable securities ..................................................................................................................... 55 45
Accounts receivable, net ................................................................................................................ 3,603 3,647
Prepaids and other ......................................................................................................................... 958 866
Deferred income taxes ................................................................................................................... 690 727
Total current assets..................................................................................................................... 8,445 8,257
Property and equipment, net .............................................................................................................. 2,489 2,179
Deferred contract costs, net ............................................................................................................... 984 807
Investments and other assets.............................................................................................................. 1,099 636
Goodwill........................................................................................................................................... 5,092 4,365
Other intangible assets, net ................................................................................................................ 929 749
Deferred income taxes....................................................................................................................... 186 961
Total assets............................................................................................................................. $ 19,224 $ 17,954
LIABILITIES AND SHAREHOLDERS’ EQUITY
Current liabilities
Accounts payable........................................................................................................................... $ 605 $ 677
Accrued liabilities.......................................................................................................................... 2,616 2,689
Deferred revenue ........................................................................................................................... 1,473 1,669
Income taxes ................................................................................................................................. 54 72
Current portion of long-term debt................................................................................................... 168 127
Total current liabilities ............................................................................................................... 4,916 5,234
Pension benefit liability..................................................................................................................... 989 1,404
Long-term debt, less current portion .................................................................................................. 3,209 2,965
Minority interests and other long-term liabilities................................................................................ 419 455
Commitments and contingencies
Shareholders’ equity
Preferred stock, $.01 par value; authorized 200,000,000 shares; none issued ................................... – –
Common stock, $.01 par value; authorized 2,000,000,000 shares; 531,975,655 shares issued at
December 31, 2007 and 2006 ..................................................................................................... 5 5
Additional paid-in capital............................................................................................................... 3,097 2,973
Retained earnings .......................................................................................................................... 6,158 5,630
Accumulated other comprehensive income (loss) ........................................................................... 1,070 (182)
Treasury stock, at cost, 22,113,129 and 17,658,428 shares at December 31, 2007 and 2006,
respectively................................................................................................................................ (639) (530)
Total shareholders’ equity .......................................................................................................... 9,691 7,896
Total liabilities and shareholders’ equity.................................................................................. $ 19,224 $ 17,954
See accompanying notes to consolidated financial statements.
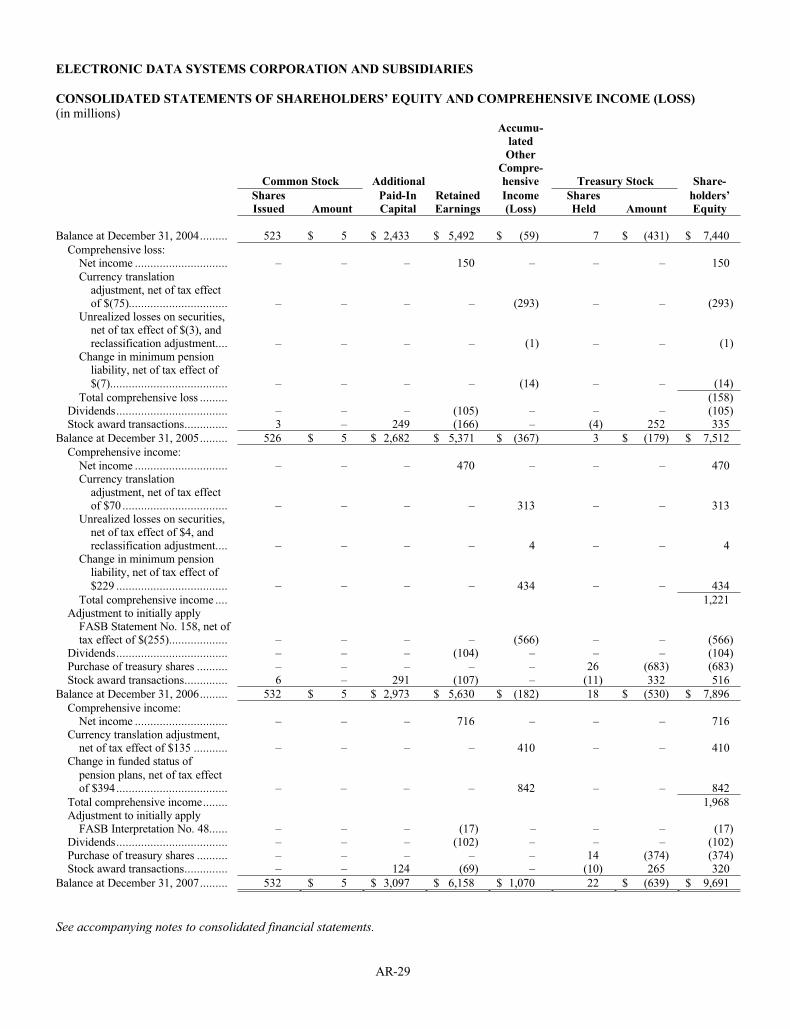
AR-29
ELECTRONIC DATA SYSTEMS CORPORATION AND SUBSIDIARIES
CONSOLIDATED STATEMENTS OF SHAREHOLDERS’ EQUITY AND COMPREHENSIVE INCOME (LOSS)(in millions)
Accumu-
lated
Other
Compre-
Common Stock Additional hensive Treasury Stock Share-
Shares Paid-In Retained Income Shares holders’
Issued Amount Capital Earnings (Loss) Held Amount Equity
Balance at December 31, 2004......... 523 $ 5 $ 2,433 $ 5,492 $ (59) 7 $ (431) $ 7,440
Comprehensive loss:Net income .............................. – – – 150 – – – 150Currency translation
adjustment, net of tax effect of $(75)................................ – – – – (293) – – (293)
Unrealized losses on securities, net of tax effect of $(3), and reclassification adjustment.... – – – – (1) – – (1)
Change in minimum pension liability, net of tax effect of $(7)...................................... – – – – (14) – – (14)
Total comprehensive loss ......... (158)Dividends.................................... – – – (105) – – – (105)Stock award transactions.............. 3 – 249 (166) – (4) 252 335
Balance at December 31, 2005......... 526 $ 5 $ 2,682 $ 5,371 $ (367) 3 $ (179) $ 7,512
Comprehensive income:Net income .............................. – – – 470 – – – 470Currency translation
adjustment, net of tax effectof $70 .................................. – – – – 313 – – 313
Unrealized losses on securities, net of tax effect of $4, and reclassification adjustment.... – – – – 4 – – 4
Change in minimum pension liability, net of tax effect of $229 .................................... – – – – 434 – – 434
Total comprehensive income .... 1,221Adjustment to initially apply
FASB Statement No. 158, net of tax effect of $(255)................... – – – – (566) – – (566)
Dividends.................................... – – – (104) – – – (104)Purchase of treasury shares .......... – – – – – 26 (683) (683)Stock award transactions.............. 6 – 291 (107) – (11) 332 516
Balance at December 31, 2006......... 532 $ 5 $ 2,973 $ 5,630 $ (182) 18 $ (530) $ 7,896
Comprehensive income:Net income .............................. – – – 716 – – – 716
Currency translation adjustment, net of tax effect of $135 ........... – – – – 410 – – 410
Change in funded status of pension plans, net of tax effect of $394.................................... – – – – 842 – – 842
Total comprehensive income........ 1,968Adjustment to initially apply
FASB Interpretation No. 48...... – – – (17) – – – (17)Dividends.................................... – – – (102) – – – (102)Purchase of treasury shares .......... – – – – – 14 (374) (374)Stock award transactions.............. – – 124 (69) – (10) 265 320
Balance at December 31, 2007......... 532 $ 5 $ 3,097 $ 6,158 $ 1,070 22 $ (639) $ 9,691
See accompanying notes to consolidated financial statements.
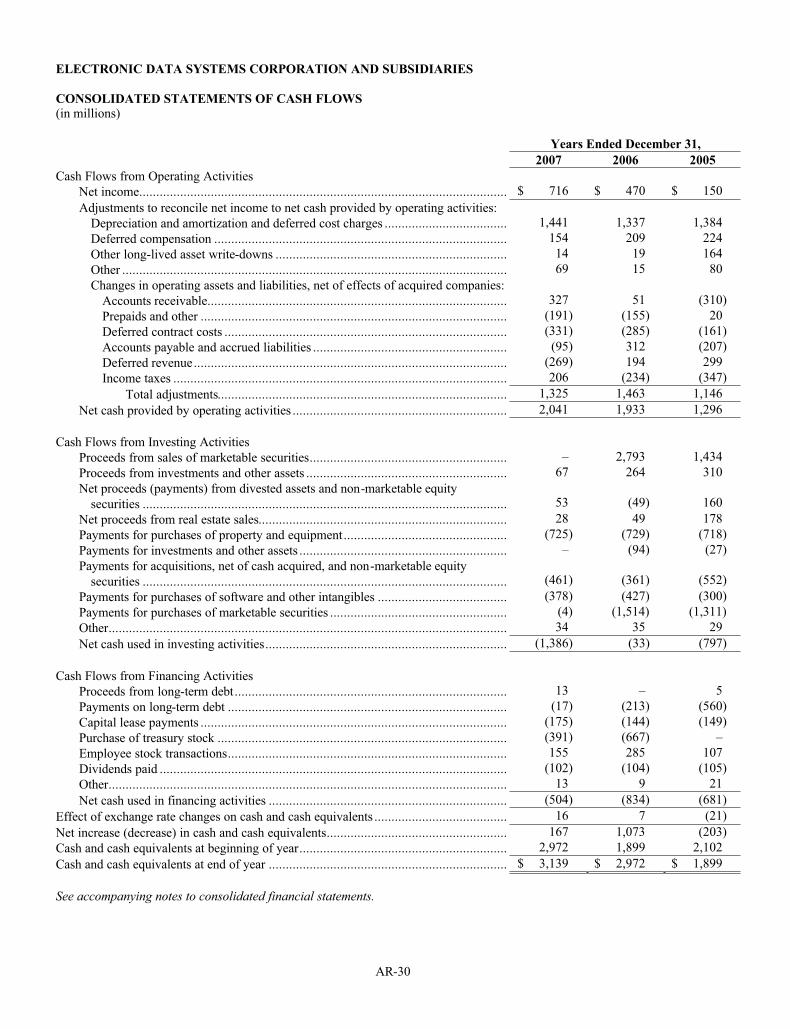
AR-30
ELECTRONIC DATA SYSTEMS CORPORATION AND SUBSIDIARIES
CONSOLIDATED STATEMENTS OF CASH FLOWS(in millions)
Years Ended December 31,
2007 2006 2005
Cash Flows from Operating Activities
Net income............................................................................................................ $ 716 $ 470 $ 150
Adjustments to reconcile net income to net cash provided by operating activities:
Depreciation and amortization and deferred cost charges .................................... 1,441 1,337 1,384
Deferred compensation ...................................................................................... 154 209 224
Other long-lived asset write-downs .................................................................... 14 19 164
Other ................................................................................................................. 69 15 80
Changes in operating assets and liabilities, net of effects of acquired companies:
Accounts receivable........................................................................................ 327 51 (310)
Prepaids and other .......................................................................................... (191) (155) 20
Deferred contract costs ................................................................................... (331) (285) (161)
Accounts payable and accrued liabilities ......................................................... (95) 312 (207)
Deferred revenue............................................................................................ (269) 194 299
Income taxes .................................................................................................. 206 (234) (347)
Total adjustments..................................................................................... 1,325 1,463 1,146
Net cash provided by operating activities ............................................................... 2,041 1,933 1,296
Cash Flows from Investing Activities
Proceeds from sales of marketable securities.......................................................... – 2,793 1,434
Proceeds from investments and other assets ........................................................... 67 264 310
Net proceeds (payments) from divested assets and non-marketable equity
securities ........................................................................................................... 53 (49) 160
Net proceeds from real estate sales......................................................................... 28 49 178
Payments for purchases of property and equipment................................................ (725) (729) (718)
Payments for investments and other assets ............................................................. – (94) (27)
Payments for acquisitions, net of cash acquired, and non-marketable equity
securities ........................................................................................................... (461) (361) (552)
Payments for purchases of software and other intangibles ...................................... (378) (427) (300)
Payments for purchases of marketable securities .................................................... (4) (1,514) (1,311)
Other..................................................................................................................... 34 35 29
Net cash used in investing activities....................................................................... (1,386) (33) (797)
Cash Flows from Financing Activities
Proceeds from long-term debt................................................................................ 13 – 5
Payments on long-term debt .................................................................................. (17) (213) (560)
Capital lease payments .......................................................................................... (175) (144) (149)
Purchase of treasury stock ..................................................................................... (391) (667) –
Employee stock transactions.................................................................................. 155 285 107
Dividends paid ...................................................................................................... (102) (104) (105)
Other..................................................................................................................... 13 9 21
Net cash used in financing activities ...................................................................... (504) (834) (681)
Effect of exchange rate changes on cash and cash equivalents ....................................... 16 7 (21)
Net increase (decrease) in cash and cash equivalents..................................................... 167 1,073 (203)
Cash and cash equivalents at beginning of year............................................................. 2,972 1,899 2,102
Cash and cash equivalents at end of year ...................................................................... $ 3,139 $ 2,972 $ 1,899
See accompanying notes to consolidated financial statements.
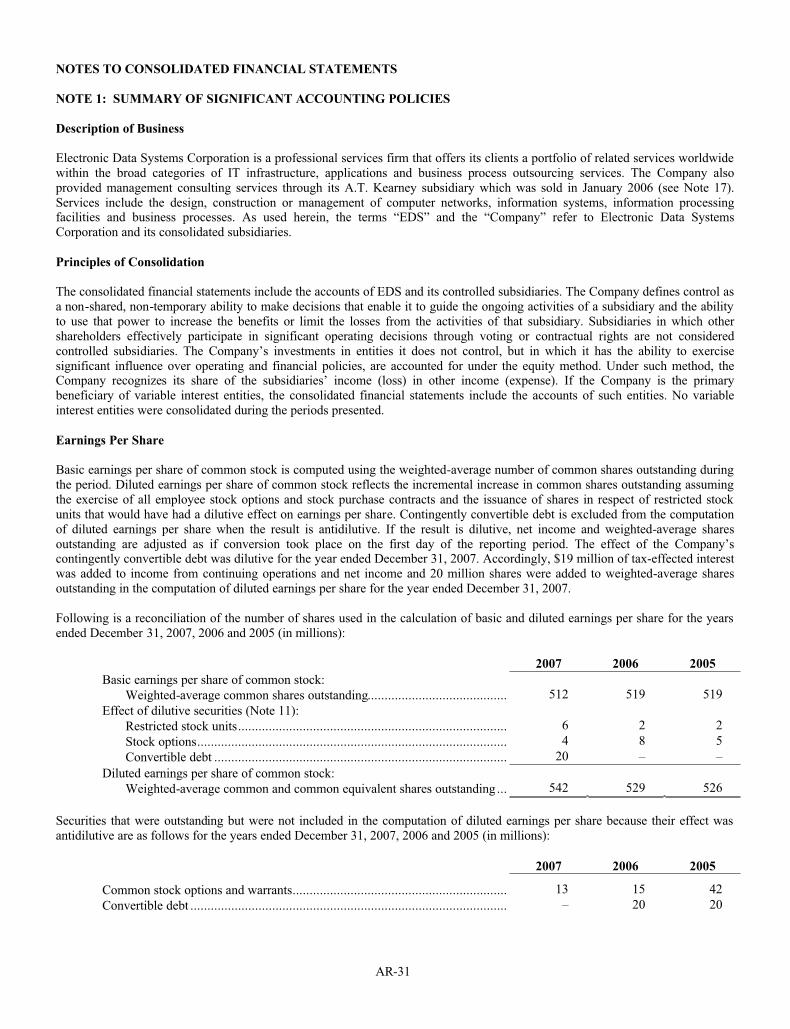
AR-31
NOTES TO CONSOLIDATED FINANCIAL STATEMENTS
NOTE 1: SUMMARY OF SIGNIFICANT ACCOUNTING POLICIES
Description of Business
Electronic Data Systems Corporation is a professional services firm that offers its clients a portfolio of related services worldwidewithin the broad categories of IT infrastructure, applications and business process outsourcing services. The Company alsoprovided management consulting services through its A.T. Kearney subsidiary which was sold in January 2006 (see Note 17).Services include the design, construction or management of computer networks, information systems, information processingfacilities and business processes. As used herein, the terms “EDS” and the “Company” refer to Electronic Data SystemsCorporation and its consolidated subsidiaries.
Principles of Consolidation
The consolidated financial statements include the accounts of EDS and its controlled subsidiaries. The Company defines control asa non-shared, non-temporary ability to make decisions that enable it to guide the ongoing activities of a subsidiary and the abilityto use that power to increase the benefits or limit the losses from the activities of that subsidiary. Subsidiaries in which othershareholders effectively participate in significant operating decisions through voting or contractual rights are not consideredcontrolled subsidiaries. The Company’s investments in entities it does not control, but in which it has the ability to exercisesignificant influence over operating and financial policies, are accounted for under the equity method. Under such method, theCompany recognizes its share of the subsidiaries’ income (loss) in other income (expense). If the Company is the primarybeneficiary of variable interest entities, the consolidated financial statements include the accounts of such entities. No variableinterest entities were consolidated during the periods presented.
Earnings Per Share
Basic earnings per share of common stock is computed using the weighted-average number of common shares outstanding during the period. Diluted earnings per share of common stock reflects the incremental increase in common shares outstanding assuming the exercise of all employee stock options and stock purchase contracts and the issuance of shares in respect of restricted stockunits that would have had a dilutive effect on earnings per share. Contingently convertible debt is excluded from the computationof diluted earnings per share when the result is antidilutive. If the result is dilutive, net income and weighted-average sharesoutstanding are adjusted as if conversion took place on the first day of the reporting period. The effect of the Company’scontingently convertible debt was dilutive for the year ended December 31, 2007. Accordingly, $19 million of tax-effected interestwas added to income from continuing operations and net income and 20 million shares were added to weighted-average sharesoutstanding in the computation of diluted earnings per share for the year ended December 31, 2007.
Following is a reconciliation of the number of shares used in the calculation of basic and diluted earnings per share for the yearsended December 31, 2007, 2006 and 2005 (in millions):
2007 2006 2005
Basic earnings per share of common stock:
Weighted-average common shares outstanding......................................... 512 519 519
Effect of dilutive securities (Note 11):
Restricted stock units............................................................................... 6 2 2
Stock options........................................................................................... 4 8 5
Convertible debt ...................................................................................... 20 – –
Diluted earnings per share of common stock:
Weighted-average common and common equivalent shares outstanding ... 542 529 526
Securities that were outstanding but were not included in the computation of diluted earnings per share because their effect wasantidilutive are as follows for the years ended December 31, 2007, 2006 and 2005 (in millions):
2007 2006 2005
Common stock options and warrants............................................................... 13 15 42
Convertible debt ............................................................................................. – 20 20
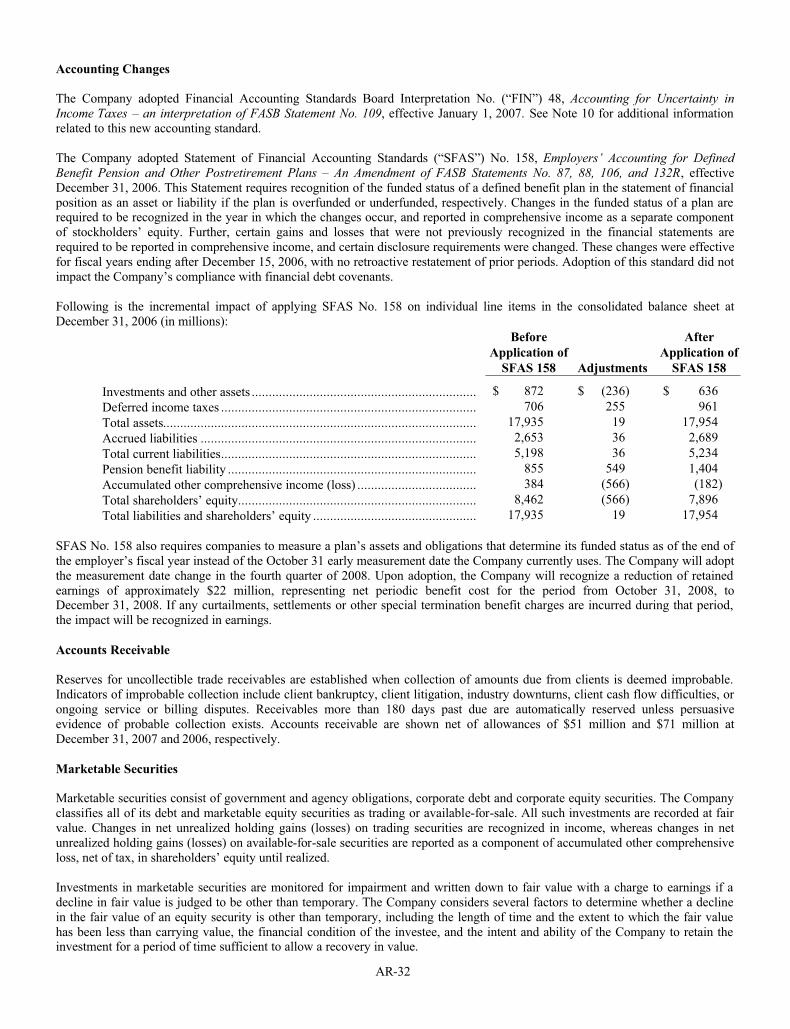
AR-32
Accounting Changes
The Company adopted Financial Accounting Standards Board Interpretation No. (“FIN”) 48, Accounting for Uncertainty inIncome Taxes – an interpretation of FASB Statement No. 109, effective January 1, 2007. See Note 10 for additional information related to this new accounting standard.
The Company adopted Statement of Financial Accounting Standards (“SFAS”) No. 158, Employers’ Accounting for DefinedBenefit Pension and Other Postretirement Plans – An Amendment of FASB Statements No. 87, 88, 106, and 132R, effectiveDecember 31, 2006. This Statement requires recognition of the funded status of a defined benefit plan in the statement of financialposition as an asset or liability if the plan is overfunded or underfunded, respectively. Changes in the funded status of a plan are required to be recognized in the year in which the changes occur, and reported in comprehensive income as a separate component of stockholders’ equity. Further, certain gains and losses that were not previously recognized in the financial statements arerequired to be reported in comprehensive income, and certain disclosure requirements were changed. These changes were effectivefor fiscal years ending after December 15, 2006, with no retroactive restatement of prior periods. Adoption of this standard did not impact the Company’s compliance with financial debt covenants.
Following is the incremental impact of applying SFAS No. 158 on individual line items in the consolidated balance sheet atDecember 31, 2006 (in millions):
Before
Application of
SFAS 158 Adjustments
After
Application of
SFAS 158
Investments and other assets .................................................................. $ 872 $ (236) $ 636
Deferred income taxes ........................................................................... 706 255 961
Total assets............................................................................................ 17,935 19 17,954
Accrued liabilities ................................................................................. 2,653 36 2,689
Total current liabilities........................................................................... 5,198 36 5,234
Pension benefit liability ......................................................................... 855 549 1,404
Accumulated other comprehensive income (loss) ................................... 384 (566) (182)
Total shareholders’ equity...................................................................... 8,462 (566) 7,896
Total liabilities and shareholders’ equity ................................................ 17,935 19 17,954
SFAS No. 158 also requires companies to measure a plan’s assets and obligations that determine its funded status as of the end ofthe employer’s fiscal year instead of the October 31 early measurement date the Company currently uses. The Company will adopt the measurement date change in the fourth quarter of 2008. Upon adoption, the Company will recognize a reduction of retained earnings of approximately $22 million, representing net periodic benefit cost for the period from October 31, 2008, toDecember 31, 2008. If any curtailments, settlements or other special termination benefit charges are incurred during that period,the impact will be recognized in earnings.
Accounts Receivable
Reserves for uncollectible trade receivables are established when collection of amounts due from clients is deemed improbable. Indicators of improbable collection include client bankruptcy, client litigation, industry downturns, client cash flow difficulties, or ongoing service or billing disputes. Receivables more than 180 days past due are automatically reserved unless persuasiveevidence of probable collection exists. Accounts receivable are shown net of allowances of $51 million and $71 million atDecember 31, 2007 and 2006, respectively.
Marketable Securities
Marketable securities consist of government and agency obligations, corporate debt and corporate equity securities. The Companyclassifies all of its debt and marketable equity securities as trading or available-for-sale. All such investments are recorded at fair value. Changes in net unrealized holding gains (losses) on trading securities are recognized in income, whereas changes in netunrealized holding gains (losses) on available-for-sale securities are reported as a component of accumulated other comprehensiveloss, net of tax, in shareholders’ equity until realized.
Investments in marketable securities are monitored for impairment and written down to fair value with a charge to earnings if adecline in fair value is judged to be other than temporary. The Company considers several factors to determine whether a declinein the fair value of an equity security is other than temporary, including the length of time and the extent to which the fair valuehas been less than carrying value, the financial condition of the investee, and the intent and ability of the Company to retain the investment for a period of time sufficient to allow a recovery in value.
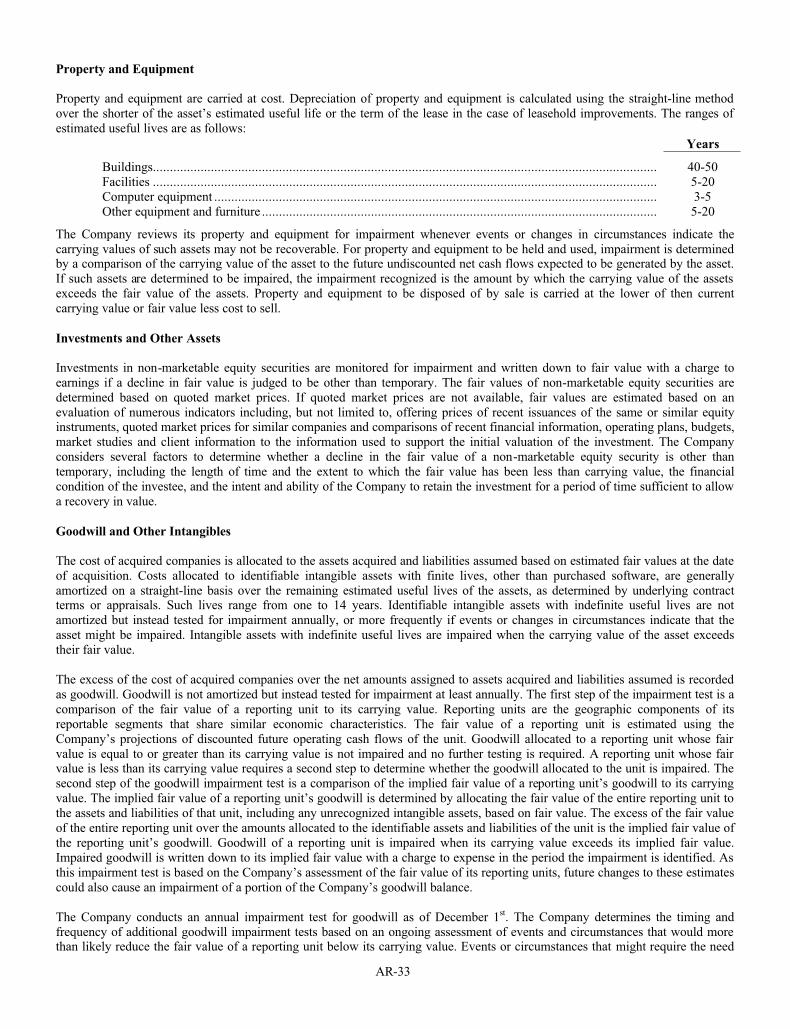
AR-33
Property and Equipment
Property and equipment are carried at cost. Depreciation of property and equipment is calculated using the straight-line methodover the shorter of the asset’s estimated useful life or the term of the lease in the case of leasehold improvements. The ranges of estimated useful lives are as follows:
Years
Buildings.................................................................................................................................................... 40-50Facilities .................................................................................................................................................... 5-20Computer equipment .................................................................................................................................. 3-5Other equipment and furniture .................................................................................................................... 5-20
The Company reviews its property and equipment for impairment whenever events or changes in circumstances indicate thecarrying values of such assets may not be recoverable. For property and equipment to be held and used, impairment is determinedby a comparison of the carrying value of the asset to the future undiscounted net cash flows expected to be generated by the asset.If such assets are determined to be impaired, the impairment recognized is the amount by which the carrying value of the assetsexceeds the fair value of the assets. Property and equipment to be disposed of by sale is carried at the lower of then currentcarrying value or fair value less cost to sell.
Investments and Other Assets
Investments in non-marketable equity securities are monitored for impairment and written down to fair value with a charge toearnings if a decline in fair value is judged to be other than temporary. The fair values of non-marketable equity securities aredetermined based on quoted market prices. If quoted market prices are not available, fair values are estimated based on anevaluation of numerous indicators including, but not limited to, offering prices of recent issuances of the same or similar equityinstruments, quoted market prices for similar companies and comparisons of recent financial information, operating plans, budgets,market studies and client information to the information used to support the initial valuation of the investment. The Companyconsiders several factors to determine whether a decline in the fair value of a non-marketable equity security is other thantemporary, including the length of time and the extent to which the fair value has been less than carrying value, the financialcondition of the investee, and the intent and ability of the Company to retain the investment for a period of time sufficient to allow a recovery in value.
Goodwill and Other Intangibles
The cost of acquired companies is allocated to the assets acquired and liabilities assumed based on estimated fair values at the date of acquisition. Costs allocated to identifiable intangible assets with finite lives, other than purchased software, are generallyamortized on a straight-line basis over the remaining estimated useful lives of the assets, as determined by underlying contractterms or appraisals. Such lives range from one to 14 years. Identifiable intangible assets with indefinite useful lives are notamortized but instead tested for impairment annually, or more frequently if events or changes in circumstances indicate that theasset might be impaired. Intangible assets with indefinite useful lives are impaired when the carrying value of the asset exceedstheir fair value.
The excess of the cost of acquired companies over the net amounts assigned to assets acquired and liabilities assumed is recordedas goodwill. Goodwill is not amortized but instead tested for impairment at least annually. The first step of the impairment test is a comparison of the fair value of a reporting unit to its carrying value. Reporting units are the geographic components of itsreportable segments that share similar economic characteristics. The fair value of a reporting unit is estimated using theCompany’s projections of discounted future operating cash flows of the unit. Goodwill allocated to a reporting unit whose fair value is equal to or greater than its carrying value is not impaired and no further testing is required. A reporting unit whose fair value is less than its carrying value requires a second step to determine whether the goodwill allocated to the unit is impaired. The second step of the goodwill impairment test is a comparison of the implied fair value of a reporting unit’s goodwill to its carryingvalue. The implied fair value of a reporting unit’s goodwill is determined by allocating the fair value of the entire reporting unit to the assets and liabilities of that unit, including any unrecognized intangible assets, based on fair value. The excess of the fair value of the entire reporting unit over the amounts allocated to the identifiable assets and liabilities of the unit is the implied fair value of the reporting unit’s goodwill. Goodwill of a reporting unit is impaired when its carrying value exceeds its implied fair value.Impaired goodwill is written down to its implied fair value with a charge to expense in the period the impairment is identified. As this impairment test is based on the Company’s assessment of the fair value of its reporting units, future changes to these estimatescould also cause an impairment of a portion of the Company’s goodwill balance.
The Company conducts an annual impairment test for goodwill as of December 1st. The Company determines the timing andfrequency of additional goodwill impairment tests based on an ongoing assessment of events and circumstances that would more than likely reduce the fair value of a reporting unit below its carrying value. Events or circumstances that might require the need
AR-34
for more frequent tests include, but are not limited to: the loss of a number of significant clients, the identification of otherimpaired assets within a reporting unit, the disposition of a significant portion of a reporting unit, or a significant adverse change in business climate or regulations. The Company also considers the amount by which the fair value of a particular reporting unitexceeded its carrying value in the most recent goodwill impairment test to determine whether more frequent tests are necessary.
Purchased or licensed software not subject to a subscription agreement is capitalized and amortized on a straight-line basis,generally over two to five years. Costs of developing and maintaining software systems incurred primarily in connection withclient contracts are considered contract costs. Purchased software and certain development costs for computer software sold, leasedor otherwise marketed as a separate product or as part of a product or process are capitalized and amortized on a product-by-product basis over their remaining estimated useful lives at the greater of straight-line or the ratio that current gross revenues for a product bear to the total of current and anticipated future gross revenues for that product. The estimated useful lives of softwareproducts to be sold, leased or otherwise marketed are generally three years or less. Software development costs incurred to meetthe Company’s internal needs are capitalized and amortized on a straight-line basis over three to five years. Software undersubscription arrangements, whereby the software provider makes available current software products as well as productsdeveloped or acquired during the term of the arrangement, are executory contracts and expensed ratably over the subscription term.
Sales of Financial Assets
The Company accounts for the sale of financial assets when control over the financial asset is relinquished. In most cases, theCompany sold lease receivables to a legally isolated securitization trust. If a trust is not used, the receivables are sold to anindependent substantive financial institution. None of these transactions resulted in any significant gain or loss, or servicing asset or servicing liability.
Revenue Recognition and Deferred Contract Costs
The Company provides IT and business process outsourcing services under time-and-material, unit-price and fixed-price contracts,which may extend up to 10 or more years. Services provided over the term of these arrangements may include one or more of the following: IT infrastructure support and management; IT system and software maintenance; application hosting; the design,development, and/or construction of software and systems (“Construct Service”); transaction processing; business processmanagement and consulting services.
If a contract involves the provision of a single element, revenue is generally recognized when the product or service is providedand the amount earned is not contingent upon any future event. If the service is provided evenly during the contract term butservice billings are irregular, revenue is recognized on a straight-line basis over the contract term. However, if the single service is a Construct Service, revenue is recognized under the percentage-of-completion method usually using a zero-profit methodology. Under this method, costs are deferred until contractual milestones are met, at which time the milestone billing is recognized asrevenue and an amount of deferred costs is recognized as expense so that cumulative profit equals zero. If the milestone billingexceeds deferred costs, then the excess is recorded as deferred revenue. When the Construct Service is completed and the finalmilestone met, all unrecognized costs, milestone billings, and profit are recognized in full. If the contract does not containcontractual milestones, costs are expensed as incurred and revenue is recognized in an amount equal to costs incurred untilcompletion of the Construct Service, at which time any profit would be recognized in full. If total costs are estimated to exceedrevenue for the Construct Service, then a provision for the estimated loss is made in the period in which the loss first becomesapparent.
If a contract involves the provision of multiple service elements, total estimated contract revenue is allocated to each elementbased on the relative fair value of each element. The amount of revenue allocated to each element is limited to the amount that is not contingent upon the delivery of another element in the future. Revenue is then recognized for each element as described abovefor single-element contracts, except revenue recognized on a straight-line basis for a non-Construct Service will not exceedamounts currently billable unless the excess revenue is recoverable from the client upon any contract termination event. If theamount of revenue allocated to a Construct Service is less than its relative fair value, costs to deliver such service equal to thedifference between allocated revenue and the relative fair value are deferred and amortized over the contract term. If totalConstruct Service costs are estimated to exceed the relative fair value for the Construct Service contained in a multiple-elementarrangement, then a provision for the estimated loss is made in the period in which the loss first becomes apparent. If fair value is not determinable for all elements, the contract is treated as one accounting unit and revenue is recognized using the proportionalperformance method.
The Company also defers and subsequently amortizes certain set-up costs related to activities that enable the provision ofcontracted services to the client. Such activities include the relocation of transitioned employees, the migration of client systems or processes, and the exit of client facilities acquired upon entering into the client contract. Deferred contract costs, including set-upcosts, are amortized on a straight-line basis over the remaining original contract term unless billing patterns indicate a more
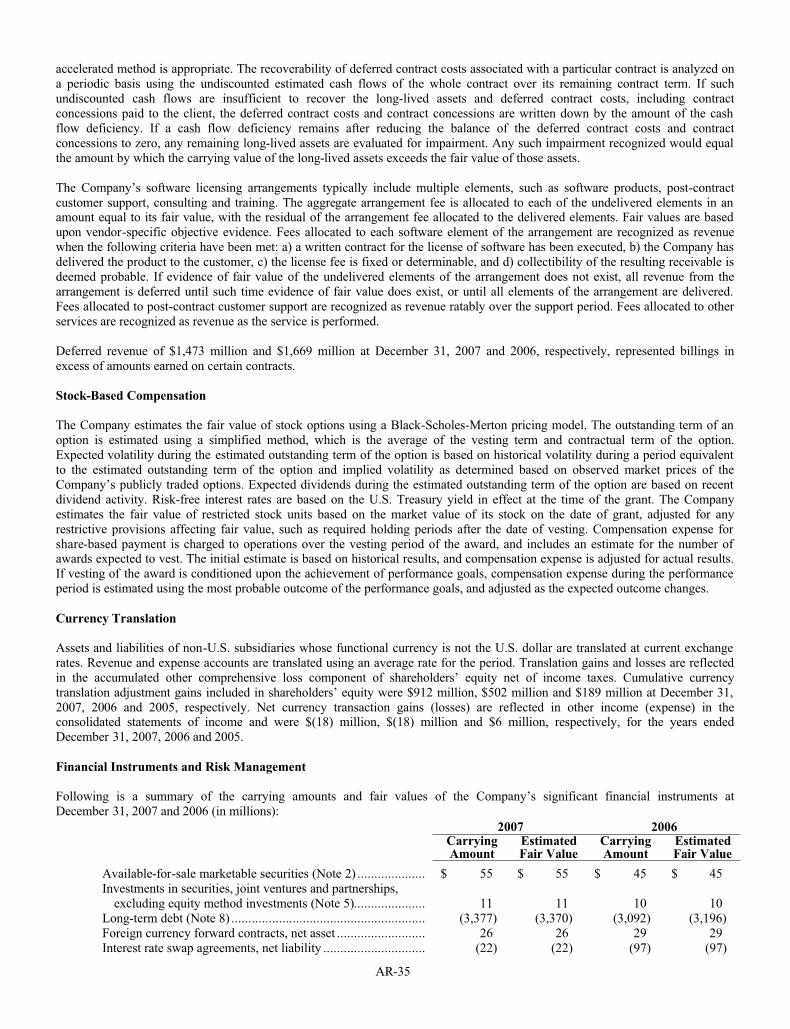
AR-35
accelerated method is appropriate. The recoverability of deferred contract costs associated with a particular contract is analyzed on a periodic basis using the undiscounted estimated cash flows of the whole contract over its remaining contract term. If suchundiscounted cash flows are insufficient to recover the long-lived assets and deferred contract costs, including contractconcessions paid to the client, the deferred contract costs and contract concessions are written down by the amount of the cashflow deficiency. If a cash flow deficiency remains after reducing the balance of the deferred contract costs and contractconcessions to zero, any remaining long-lived assets are evaluated for impairment. Any such impairment recognized would equal the amount by which the carrying value of the long-lived assets exceeds the fair value of those assets.
The Company’s software licensing arrangements typically include multiple elements, such as software products, post-contractcustomer support, consulting and training. The aggregate arrangement fee is allocated to each of the undelivered elements in anamount equal to its fair value, with the residual of the arrangement fee allocated to the delivered elements. Fair values are basedupon vendor-specific objective evidence. Fees allocated to each software element of the arrangement are recognized as revenuewhen the following criteria have been met: a) a written contract for the license of software has been executed, b) the Company hasdelivered the product to the customer, c) the license fee is fixed or determinable, and d) collectibility of the resulting receivable is deemed probable. If evidence of fair value of the undelivered elements of the arrangement does not exist, all revenue from thearrangement is deferred until such time evidence of fair value does exist, or until all elements of the arrangement are delivered.Fees allocated to post-contract customer support are recognized as revenue ratably over the support period. Fees allocated to otherservices are recognized as revenue as the service is performed.
Deferred revenue of $1,473 million and $1,669 million at December 31, 2007 and 2006, respectively, represented billings inexcess of amounts earned on certain contracts.
Stock-Based Compensation
The Company estimates the fair value of stock options using a Black-Scholes-Merton pricing model. The outstanding term of an option is estimated using a simplified method, which is the average of the vesting term and contractual term of the option.Expected volatility during the estimated outstanding term of the option is based on historical volatility during a period equivalentto the estimated outstanding term of the option and implied volatility as determined based on observed market prices of theCompany’s publicly traded options. Expected dividends during the estimated outstanding term of the option are based on recent dividend activity. Risk-free interest rates are based on the U.S. Treasury yield in effect at the time of the grant. The Companyestimates the fair value of restricted stock units based on the market value of its stock on the date of grant, adjusted for anyrestrictive provisions affecting fair value, such as required holding periods after the date of vesting. Compensation expense forshare-based payment is charged to operations over the vesting period of the award, and includes an estimate for the number of awards expected to vest. The initial estimate is based on historical results, and compensation expense is adjusted for actual results.If vesting of the award is conditioned upon the achievement of performance goals, compensation expense during the performance period is estimated using the most probable outcome of the performance goals, and adjusted as the expected outcome changes.
Currency Translation
Assets and liabilities of non-U.S. subsidiaries whose functional currency is not the U.S. dollar are translated at current exchangerates. Revenue and expense accounts are translated using an average rate for the period. Translation gains and losses are reflectedin the accumulated other comprehensive loss component of shareholders’ equity net of income taxes. Cumulative currencytranslation adjustment gains included in shareholders’ equity were $912 million, $502 million and $189 million at December 31, 2007, 2006 and 2005, respectively. Net currency transaction gains (losses) are reflected in other income (expense) in theconsolidated statements of income and were $(18) million, $(18) million and $6 million, respectively, for the years endedDecember 31, 2007, 2006 and 2005.
Financial Instruments and Risk Management
Following is a summary of the carrying amounts and fair values of the Company’s significant financial instruments atDecember 31, 2007 and 2006 (in millions):
2007 2006CarryingAmount
EstimatedFair Value
CarryingAmount
EstimatedFair Value
Available-for-sale marketable securities (Note 2) .................... $ 55 $ 55 $ 45 $ 45Investments in securities, joint ventures and partnerships,
excluding equity method investments (Note 5)..................... 11 11 10 10Long-term debt (Note 8) ......................................................... (3,377) (3,370) (3,092) (3,196)Foreign currency forward contracts, net asset .......................... 26 26 29 29Interest rate swap agreements, net liability .............................. (22) (22) (97) (97)
AR-36
Current marketable securities are carried at their estimated fair value based on current market quotes. The fair values of certainlong-term investments are estimated based on quoted market prices for these or similar investments. For other investments, various methods are used to estimate fair value, including external valuations and discounted cash flows. The fair value of long-term debtis estimated based on the quoted market prices for the same or similar issues or based on the current rates offered to the Companyfor instruments with similar terms, degree of risk and remaining maturities. The fair value of foreign currency forward and interestrate swap contracts represents the estimated amount required to settle the contracts using current market exchange or interest rates.The carrying values of other financial instruments, such as cash equivalents, accounts and notes receivable, and accounts payable,approximate their fair value.
The Company makes investments, receives revenues and incurs expenses in many countries and has exposure to market risksarising from changes in interest rates, foreign exchange rates and equity prices. The Company’s ability to sell these investmentsmay be constrained by market or other factors. Derivative financial instruments are used to hedge against these risks by creatingoffsetting market positions. The Company does not hold or issue derivative financial instruments for trading purposes.
The notional amounts of derivative contracts, summarized below as part of the description of the instruments utilized, do notnecessarily represent the amounts exchanged by the parties and thus are not necessarily a measure of the exposure of the Companyresulting from its use of derivatives. The amounts exchanged by the parties are normally calculated on the basis of the notionalamounts and the other terms of the derivatives.
Foreign Currency Risk
The Company has significant international sales and purchase transactions in foreign currencies. The Company enters into foreigncurrency forward contracts and may enter into currency options with durations of generally less than 30 days to hedge suchtransactions. These derivative instruments are employed to eliminate or minimize certain foreign currency exposures that can beconfidently identified and quantified. Generally, these instruments are not designated as hedges for accounting purposes, andchanges in the fair value of these instruments are recognized immediately in other income (expense). The Company’s currencyhedging activities are focused on exchange rate movements, primarily in Canada, Mexico, the United Kingdom, Western European countries that use the euro as a common currency, Australia, India, Israel and Switzerland. At December 31, 2007 and 2006, the Company had forward exchange contracts to purchase various foreign currencies in the amount of $2.6 billion and $1.9 billion,respectively, and to sell various foreign currencies in the amount of $0.9 billion and $1.0 billion, respectively.
Interest Rate Risk
The Company enters into interest rate swap agreements that convert fixed-rate instruments to variable-rate instruments to manageinterest rate risk. The derivative financial instruments are designated and documented as fair value hedges at the inception of the contract. Changes in fair value of derivative financial instruments are recognized in earnings as an offset to changes in fair value of the underlying exposure which are also recognized in other income (expense). The impact on earnings from recognizing the fair value of these instruments depends on their intended use, their hedge designation, and their effectiveness in offsetting theunderlying exposure they are designed to hedge.
The Company had interest rate swap fair value hedges outstanding in the notional amount of $1.8 billion in connection with itslong-term notes payable at December 31, 2007 and 2006 (see Note 8). Under the swaps, the Company receives fixed rates ranging from 6.0% to 7.125% and pays floating rates tied to the London Interbank Offering Rate (“LIBOR”). The weighted-averagefloating rates were 7.25% and 7.64% at December 31, 2007 and 2006, respectively. At December 31, 2007 and 2006, respectively, the Company had $700 million of swaps and related debt which contained the same critical terms. Accordingly, no gain or loss relating to the change in fair value of the swap and related hedged item was recognized in earnings. At December 31, 2007 and 2006, $1.1 billion of the interest rate swaps contained different terms than the related underlying debt. Accordingly, the Companyrecognized in earnings the change in fair value of the interest rate swap and underlying debt which amounted to gains (losses) of$(9.4) million and $2.8 million during 2007 and 2006, respectively. Such gains (losses) are included in other income (expense) inthe accompanying consolidated statements of income.
Comprehensive Income (Loss) and Shareholders’ Equity
Comprehensive income (loss) includes all changes in equity during a period, except those resulting from investments by anddistributions to owners. For the years ended December 31, 2006 and 2005, reclassifications from accumulated othercomprehensive loss to net income of net gains (losses) recognized on marketable security transactions were $(7) million and $(3)million, net of the related tax expense (benefit) of $(4) million and $(1) million, respectively. There were no such reclassificationsfor the year ended December 31, 2007.
AR-37
Following is a summary of changes within each classification of accumulated other comprehensive loss for the years endedDecember 31, 2007 and 2006 (in millions):
Cumulative
Translation
Adjustments
Unrealized
Gains
(Losses) on
Securities
Defined
Benefit
Pension
Plans
Accumulated
Other
Compre-
hensive
Income
(Loss)
Balance at December 31, 2005............................................ $ 189 $ (4) $ (552) $ (367)Change........................................................................ 313 4 (132) 185
Balance at December 31, 2006............................................ 502 – (684) (182)Change........................................................................ 410 – 842 1,252
Balance at December 31, 2007............................................ $ 912 $ – $ 158 $ 1,070
In connection with its employee stock incentive plans, the Company issued 9.7 million, 11.4 million and 4.5 million shares oftreasury stock at a cost of $265 million, $332 million and $252 million during 2007, 2006 and 2005, respectively. The differencebetween the cost and fair value at the date of issuance of such shares has been recognized as a charge to retained earnings of $69million, $107 million and $166 million in the consolidated statements of shareholders’ equity and comprehensive income (loss) during 2007, 2006 and 2005, respectively.
On December 4, 2007, the Company announced that its Board of Directors had authorized the Company to repurchase up to $1billion of its outstanding common stock over the next 18 months in open market purchases or privately negotiated transactions.The Company repurchased 2.7 million shares in the open market at a cost of $57 million, before commissions, during the year ended December 31, 2007 in connection with this share repurchase authorization.
On February 21, 2006, the Company announced that its Board of Directors had authorized the Company to repurchase up to $1 billion of its outstanding common stock over the next 18 months in open market purchases or privately negotiated transactions. Inconnection with the share repurchase authorization, on February 23, 2006, the Company entered into a $400 million accelerated share repurchase agreement with a financial institution pursuant to which the Company repurchased 15.3 million shares ofcommon stock in the open market during the repurchase period which ended on May 31, 2006. The final amount paid under thearrangement was $26.16 per share, excluding fees and commissions. The Company also repurchased 10.9 million shares in theopen market at a cost of $283 million, before commissions, during the year ended December 31, 2006. In April 2007, theCompany completed the $1 billion share repurchase program announced in February 2006. The Company purchased an aggregate of 37.6 million shares of common stock at a cost of $1 billion (excluding transaction costs) under this program.
During 2006, cumulative translation adjustments of approximately $40 million were transferred from accumulated othercomprehensive loss to net income due to the divestitures of certain non-U.S. investments (see Notes 17 and 19).
Income Taxes
The Company provides for deferred taxes under the asset and liability method. Deferred tax assets and liabilities are recognized for the future tax consequences attributable to differences between the financial statement carrying amounts of existing assets andliabilities and their respective tax bases. Deferred tax assets and liabilities are measured using enacted tax rates expected to apply to taxable income in the years in which those temporary differences are expected to be reversed. The deferral method is used toaccount for investment tax credits. Valuation allowances are recorded to reduce deferred tax assets to an amount whose realizationis more likely than not. In determining the recognition of uncertain tax positions, the Company applies a more-likely-than-notrecognition threshold and determines the measurement of uncertain tax positions considering the amounts and probabilities of theoutcomes that could be realized upon ultimate settlement with taxing authorities. Income taxes payable are classified in theaccompanying consolidated balance sheets based on their estimated payment date.
Statements of Cash Flows
The Company considers the following asset classes with original maturities of three months or less to be cash equivalents:certificates of deposit, commercial paper, repurchase agreements and money market funds.
AR-38
Use of Estimates
The preparation of the consolidated financial statements in conformity with generally accepted accounting principles in the UnitedStates requires management to make estimates, judgments and assumptions that affect the reported amounts of assets and liabilitiesand disclosure of contingent assets and liabilities at the date of the consolidated financial statements and the reported amounts of revenues and expenses during the reporting period. Because of the use of estimates inherent in the financial reporting process,actual results could differ from those estimates. Areas in which significant judgments and estimates are used include, but are notlimited to, cost estimation for Construct Service elements, projected cash flows associated with recoverability of deferred contractcosts, contract concessions and long-lived assets, liabilities associated with pensions and performance guarantees, receivablescollectibility, and loss accruals for litigation, exclusive of legal fees which are expensed as services are received. It is reasonablypossible that events and circumstances could occur in the near term that would cause such estimates to change in a manner that would be material to the consolidated financial statements.
Concentration of Credit Risk
Accounts receivable, net, from General Motors (“GM”) and its affiliates totaled $511 million and $342 million as of December 31,2007 and 2006, respectively. In addition, the Company has several large contracts with major U.S. and foreign corporations, eachof which may result in the Company carrying a receivable balance between $50 million and $300 million at any point in time. Other than operating receivables from GM and aforementioned contracts, concentrations of credit risk with respect to accountsreceivable are generally limited due to the large number of clients forming the Company’s client base and their dispersion acrossdifferent industries and geographic areas.
The Company is exposed to credit risk in the event of nonperformance by counterparties to derivative contracts. Because theCompany deals only with major commercial banks with high-quality credit ratings, the Company believes the risk ofnonperformance by any of these counterparties is remote.
NOTE 2: MARKETABLE SECURITIES
Following is a summary of current available-for-sale marketable securities at December 31, 2007 and 2006 (in millions):
2007
Amortized
Cost
Gross
Unrealized
Gains
Gross
Unrealized
Losses
Estimated
Fair Value
Equity securities ..................................................................... $ 54 $ 2 $ (1) $ 55
Total current available-for-sale securities ......................... $ 54 $ 2 $ (1) $ 55
2006
Amortized
Cost
Gross
Unrealized
Gains
Gross
Unrealized
Losses
Estimated
Fair Value
Equity securities ..................................................................... $ 45 $ 1 $ (1) $ 45
Total current available-for-sale securities ......................... $ 45 $ 1 $ (1) $ 45
Following is a summary of sales of available-for-sale securities for the years ended December 31, 2007, 2006 and 2005 (inmillions). Specific identification was used to determine cost in computing realized gain or loss.
2007 2006 2005
Proceeds from sales ........................................................................................ $ – $ 2,793 $ 1,434
Gross realized gains........................................................................................ – 10 1
Gross realized losses....................................................................................... – (12) (8)
AR-39
NOTE 3: PROPERTY AND EQUIPMENT
Following is a summary of property and equipment, net, at December 31, 2007 and 2006 (in millions):
2007 2006
Land.................................................................................................................................... $ 60 $ 89
Buildings and facilities ........................................................................................................ 1,759 1,460
Computer equipment ........................................................................................................... 4,930 4,586
Other equipment and furniture ............................................................................................. 449 429
Subtotal ........................................................................................................................ 7,198 6,564
Less accumulated depreciation............................................................................................. (4,709) (4,385)
Total............................................................................................................................. $ 2,489 $ 2,179
During 2005, the Company sold sixteen domestic and international real estate properties in connection with its efforts to improveits cost competitiveness and enhance workplace capacity usage. Net proceeds from the sale were $178 million. Fourteen propertiesinvolved in the sale have been leased back by the Company for various extended periods. A deferred net gain of $14 million has been allocated to the various leased properties and will be recognized by the Company over the respective term of each lease. TheCompany recognized a net gain of $3 million on the sale of the remaining properties which is included in other income in the 2005consolidated statement of income.
NOTE 4: DEFERRED CONTRACT COSTS
The Company defers certain costs relating to construction and set-up activities on client contracts. Following is a summary ofdeferred costs for the years ended December 31, 2007 and 2006 (in millions):
2007
Gross
Carrying
Amount
Accumulated
Amortization Total
Deferred construct costs.................................................................................. $ 1,479 $ (906) $ 573
Deferred set-up costs ...................................................................................... 752 (341) 411
Total........................................................................................................ $ 2,231 $ (1,247) $ 984
2006
Gross
Carrying
Amount
Accumulated
Amortization Total
Deferred construct costs.................................................................................. $ 1,321 $ (827) $ 494
Deferred set-up costs ...................................................................................... 590 (277) 313
Total........................................................................................................ $ 1,911 $ (1,104) $ 807
Some of the Company’s client contracts require significant investment in the early stages which is expected to be recoveredthrough billings over the life of the respective contracts. These contracts often involve the construction of new computer systemsand communications networks and the development and deployment of new technologies. Substantial performance risk exists in each contract with these characteristics, and some or all elements of service delivery under these contracts are dependent uponsuccessful completion of the development, construction and deployment phases. At December 31, 2007, approximately $554million of the Company’s net deferred construct and set-up costs related to contracts with active construct activities. The Companynormally has between 20 to 25 active construct contracts with net deferred costs in excess of $1 million. Some of these contractshave experienced delays in their development and construction phases, and certain milestones have been missed. It is reasonablypossible that deferred costs associated with one or more of these contracts could become impaired due to changes in estimates offuture contract cash flows.
During 2005, the Company identified deterioration in the projected performance of one of its commercial contracts based on,among other things, a change in management’s judgment regarding the amount and likelihood of achieving anticipated benefits from contract-specific productivity initiatives, primarily related to the length of time necessary to achieve cost savings fromplanned infrastructure optimization initiatives. The Company determined that the estimated undiscounted cash flows of the
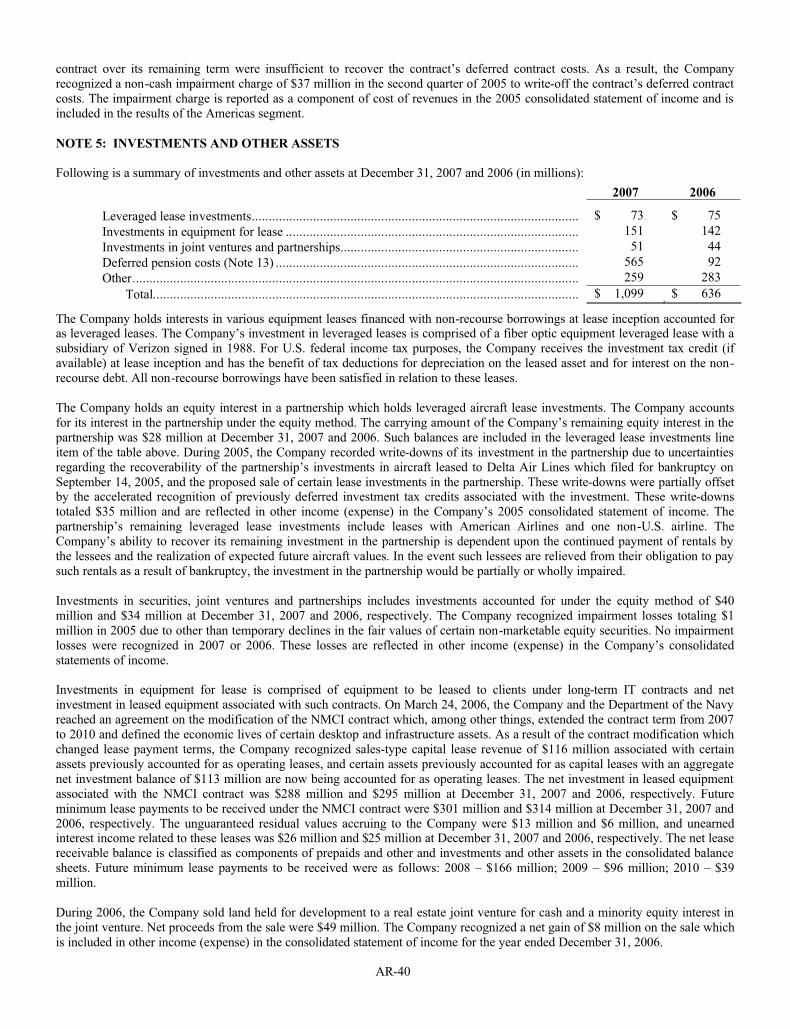
AR-40
contract over its remaining term were insufficient to recover the contract’s deferred contract costs. As a result, the Companyrecognized a non-cash impairment charge of $37 million in the second quarter of 2005 to write-off the contract’s deferred contractcosts. The impairment charge is reported as a component of cost of revenues in the 2005 consolidated statement of income and isincluded in the results of the Americas segment.
NOTE 5: INVESTMENTS AND OTHER ASSETS
Following is a summary of investments and other assets at December 31, 2007 and 2006 (in millions):
2007 2006
Leveraged lease investments................................................................................................ $ 73 $ 75
Investments in equipment for lease ...................................................................................... 151 142
Investments in joint ventures and partnerships...................................................................... 51 44
Deferred pension costs (Note 13) ......................................................................................... 565 92
Other................................................................................................................................... 259 283
Total............................................................................................................................. $ 1,099 $ 636
The Company holds interests in various equipment leases financed with non-recourse borrowings at lease inception accounted for as leveraged leases. The Company’s investment in leveraged leases is comprised of a fiber optic equipment leveraged lease with asubsidiary of Verizon signed in 1988. For U.S. federal income tax purposes, the Company receives the investment tax credit (ifavailable) at lease inception and has the benefit of tax deductions for depreciation on the leased asset and for interest on the non-recourse debt. All non-recourse borrowings have been satisfied in relation to these leases.
The Company holds an equity interest in a partnership which holds leveraged aircraft lease investments. The Company accountsfor its interest in the partnership under the equity method. The carrying amount of the Company’s remaining equity interest in thepartnership was $28 million at December 31, 2007 and 2006. Such balances are included in the leveraged lease investments lineitem of the table above. During 2005, the Company recorded write-downs of its investment in the partnership due to uncertaintiesregarding the recoverability of the partnership’s investments in aircraft leased to Delta Air Lines which filed for bankruptcy onSeptember 14, 2005, and the proposed sale of certain lease investments in the partnership. These write-downs were partially offsetby the accelerated recognition of previously deferred investment tax credits associated with the investment. These write-downstotaled $35 million and are reflected in other income (expense) in the Company’s 2005 consolidated statement of income. Thepartnership’s remaining leveraged lease investments include leases with American Airlines and one non-U.S. airline. TheCompany’s ability to recover its remaining investment in the partnership is dependent upon the continued payment of rentals by the lessees and the realization of expected future aircraft values. In the event such lessees are relieved from their obligation to pay such rentals as a result of bankruptcy, the investment in the partnership would be partially or wholly impaired.
Investments in securities, joint ventures and partnerships includes investments accounted for under the equity method of $40million and $34 million at December 31, 2007 and 2006, respectively. The Company recognized impairment losses totaling $1million in 2005 due to other than temporary declines in the fair values of certain non-marketable equity securities. No impairmentlosses were recognized in 2007 or 2006. These losses are reflected in other income (expense) in the Company’s consolidatedstatements of income.
Investments in equipment for lease is comprised of equipment to be leased to clients under long-term IT contracts and netinvestment in leased equipment associated with such contracts. On March 24, 2006, the Company and the Department of the Navy reached an agreement on the modification of the NMCI contract which, among other things, extended the contract term from 2007 to 2010 and defined the economic lives of certain desktop and infrastructure assets. As a result of the contract modification whichchanged lease payment terms, the Company recognized sales-type capital lease revenue of $116 million associated with certainassets previously accounted for as operating leases, and certain assets previously accounted for as capital leases with an aggregatenet investment balance of $113 million are now being accounted for as operating leases. The net investment in leased equipment associated with the NMCI contract was $288 million and $295 million at December 31, 2007 and 2006, respectively. Futureminimum lease payments to be received under the NMCI contract were $301 million and $314 million at December 31, 2007 and 2006, respectively. The unguaranteed residual values accruing to the Company were $13 million and $6 million, and unearnedinterest income related to these leases was $26 million and $25 million at December 31, 2007 and 2006, respectively. The net leasereceivable balance is classified as components of prepaids and other and investments and other assets in the consolidated balancesheets. Future minimum lease payments to be received were as follows: 2008 – $166 million; 2009 – $96 million; 2010 – $39million.
During 2006, the Company sold land held for development to a real estate joint venture for cash and a minority equity interest inthe joint venture. Net proceeds from the sale were $49 million. The Company recognized a net gain of $8 million on the sale whichis included in other income (expense) in the consolidated statement of income for the year ended December 31, 2006.
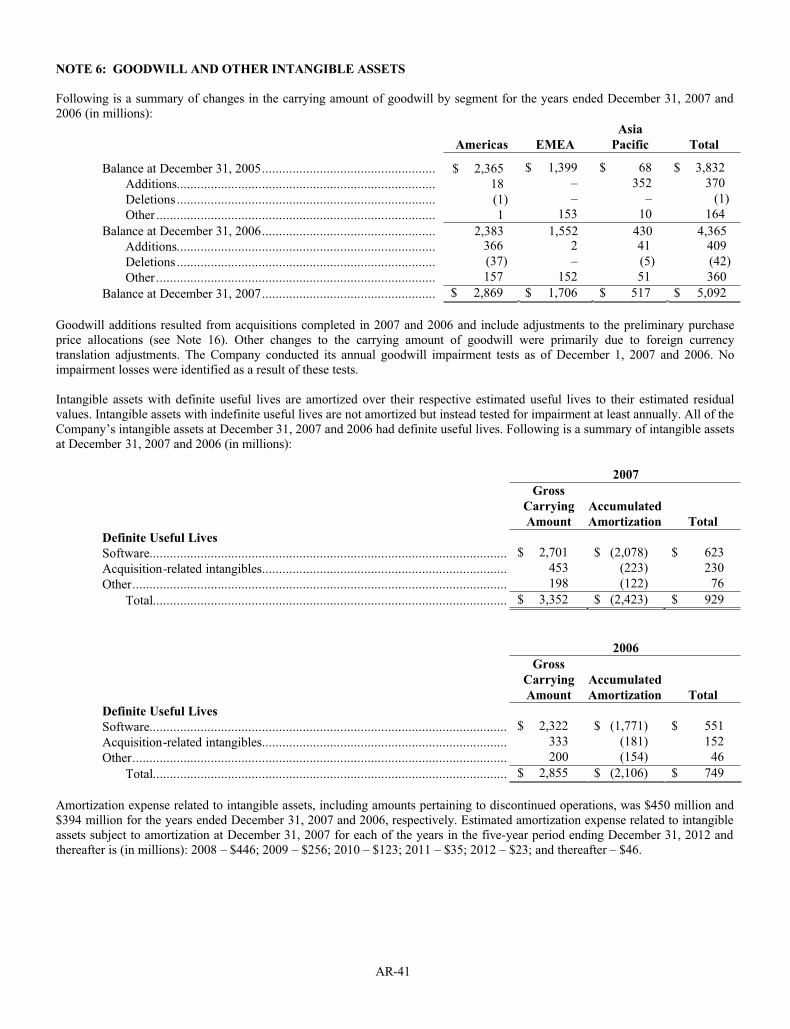
AR-41
NOTE 6: GOODWILL AND OTHER INTANGIBLE ASSETS
Following is a summary of changes in the carrying amount of goodwill by segment for the years ended December 31, 2007 and 2006 (in millions):
Americas EMEA
Asia
Pacific Total
Balance at December 31, 2005................................................... $ 2,365 $ 1,399 $ 68 $ 3,832
Additions............................................................................ 18 – 352 370
Deletions............................................................................ (1) – – (1)
Other .................................................................................. 1 153 10 164
Balance at December 31, 2006................................................... 2,383 1,552 430 4,365
Additions............................................................................ 366 2 41 409
Deletions............................................................................ (37) – (5) (42)
Other .................................................................................. 157 152 51 360
Balance at December 31, 2007................................................... $ 2,869 $ 1,706 $ 517 $ 5,092
Goodwill additions resulted from acquisitions completed in 2007 and 2006 and include adjustments to the preliminary purchaseprice allocations (see Note 16). Other changes to the carrying amount of goodwill were primarily due to foreign currencytranslation adjustments. The Company conducted its annual goodwill impairment tests as of December 1, 2007 and 2006. Noimpairment losses were identified as a result of these tests.
Intangible assets with definite useful lives are amortized over their respective estimated useful lives to their estimated residualvalues. Intangible assets with indefinite useful lives are not amortized but instead tested for impairment at least annually. All of the Company’s intangible assets at December 31, 2007 and 2006 had definite useful lives. Following is a summary of intangible assetsat December 31, 2007 and 2006 (in millions):
2007
Gross
Carrying
Amount
Accumulated
Amortization Total
Definite Useful Lives
Software......................................................................................................... $ 2,701 $ (2,078) $ 623
Acquisition-related intangibles........................................................................ 453 (223) 230
Other.............................................................................................................. 198 (122) 76
Total........................................................................................................ $ 3,352 $ (2,423) $ 929
2006
Gross
Carrying
Amount
Accumulated
Amortization Total
Definite Useful Lives
Software......................................................................................................... $ 2,322 $ (1,771) $ 551
Acquisition-related intangibles........................................................................ 333 (181) 152
Other.............................................................................................................. 200 (154) 46
Total........................................................................................................ $ 2,855 $ (2,106) $ 749
Amortization expense related to intangible assets, including amounts pertaining to discontinued operations, was $450 million and$394 million for the years ended December 31, 2007 and 2006, respectively. Estimated amortization expense related to intangible assets subject to amortization at December 31, 2007 for each of the years in the five-year period ending December 31, 2012 and thereafter is (in millions): 2008 – $446; 2009 – $256; 2010 – $123; 2011 – $35; 2012 – $23; and thereafter – $46.
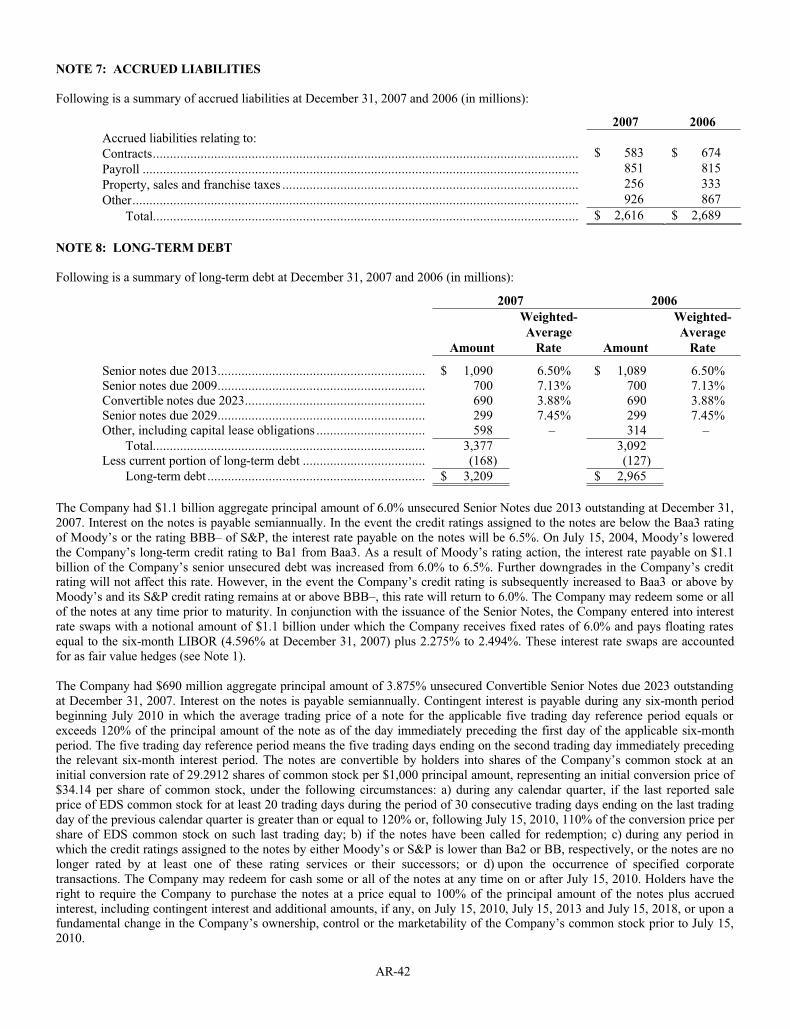
AR-42
NOTE 7: ACCRUED LIABILITIES
Following is a summary of accrued liabilities at December 31, 2007 and 2006 (in millions):
2007 2006
Accrued liabilities relating to:
Contracts............................................................................................................................. $ 583 $ 674
Payroll ................................................................................................................................ 851 815
Property, sales and franchise taxes ....................................................................................... 256 333
Other................................................................................................................................... 926 867
Total............................................................................................................................. $ 2,616 $ 2,689
NOTE 8: LONG-TERM DEBT
Following is a summary of long-term debt at December 31, 2007 and 2006 (in millions):
2007 2006
Amount
Weighted-
Average
Rate Amount
Weighted-
Average
Rate
Senior notes due 2013............................................................. $ 1,090 6.50% $ 1,089 6.50%Senior notes due 2009............................................................. 700 7.13% 700 7.13%Convertible notes due 2023..................................................... 690 3.88% 690 3.88%Senior notes due 2029............................................................. 299 7.45% 299 7.45%Other, including capital lease obligations ................................ 598 – 314 –
Total................................................................................ 3,377 3,092Less current portion of long-term debt .................................... (168) (127)
Long-term debt ................................................................ $ 3,209 $ 2,965
The Company had $1.1 billion aggregate principal amount of 6.0% unsecured Senior Notes due 2013 outstanding at December 31, 2007. Interest on the notes is payable semiannually. In the event the credit ratings assigned to the notes are below the Baa3 ratingof Moody’s or the rating BBB– of S&P, the interest rate payable on the notes will be 6.5%. On July 15, 2004, Moody’s lowered the Company’s long-term credit rating to Ba1 from Baa3. As a result of Moody’s rating action, the interest rate payable on $1.1billion of the Company’s senior unsecured debt was increased from 6.0% to 6.5%. Further downgrades in the Company’s credit rating will not affect this rate. However, in the event the Company’s credit rating is subsequently increased to Baa3 or above byMoody’s and its S&P credit rating remains at or above BBB–, this rate will return to 6.0%. The Company may redeem some or all of the notes at any time prior to maturity. In conjunction with the issuance of the Senior Notes, the Company entered into interestrate swaps with a notional amount of $1.1 billion under which the Company receives fixed rates of 6.0% and pays floating rates equal to the six-month LIBOR (4.596% at December 31, 2007) plus 2.275% to 2.494%. These interest rate swaps are accountedfor as fair value hedges (see Note 1).
The Company had $690 million aggregate principal amount of 3.875% unsecured Convertible Senior Notes due 2023 outstanding at December 31, 2007. Interest on the notes is payable semiannually. Contingent interest is payable during any six-month periodbeginning July 2010 in which the average trading price of a note for the applicable five trading day reference period equals orexceeds 120% of the principal amount of the note as of the day immediately preceding the first day of the applicable six-monthperiod. The five trading day reference period means the five trading days ending on the second trading day immediately precedingthe relevant six-month interest period. The notes are convertible by holders into shares of the Company’s common stock at an initial conversion rate of 29.2912 shares of common stock per $1,000 principal amount, representing an initial conversion price of $34.14 per share of common stock, under the following circumstances: a) during any calendar quarter, if the last reported saleprice of EDS common stock for at least 20 trading days during the period of 30 consecutive trading days ending on the last tradingday of the previous calendar quarter is greater than or equal to 120% or, following July 15, 2010, 110% of the conversion price per share of EDS common stock on such last trading day; b) if the notes have been called for redemption; c) during any period in which the credit ratings assigned to the notes by either Moody’s or S&P is lower than Ba2 or BB, respectively, or the notes are no longer rated by at least one of these rating services or their successors; or d) upon the occurrence of specified corporatetransactions. The Company may redeem for cash some or all of the notes at any time on or after July 15, 2010. Holders have the right to require the Company to purchase the notes at a price equal to 100% of the principal amount of the notes plus accruedinterest, including contingent interest and additional amounts, if any, on July 15, 2010, July 15, 2013 and July 15, 2018, or upon a fundamental change in the Company’s ownership, control or the marketability of the Company’s common stock prior to July 15, 2010.
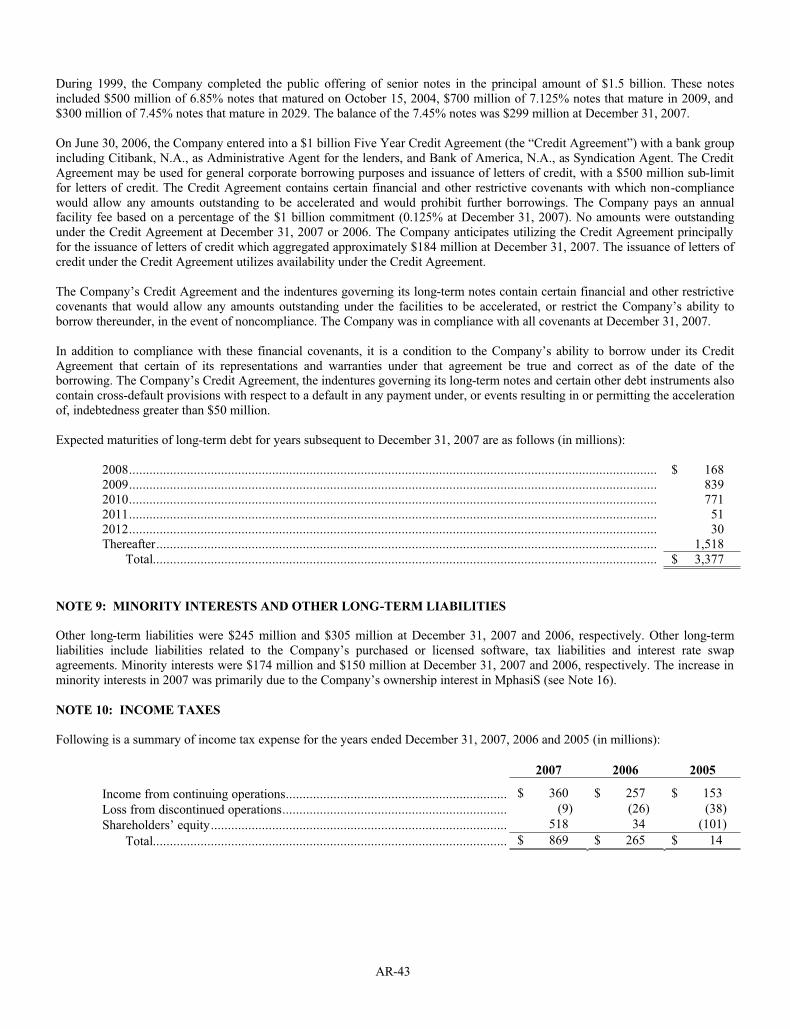
AR-43
During 1999, the Company completed the public offering of senior notes in the principal amount of $1.5 billion. These notesincluded $500 million of 6.85% notes that matured on October 15, 2004, $700 million of 7.125% notes that mature in 2009, and $300 million of 7.45% notes that mature in 2029. The balance of the 7.45% notes was $299 million at December 31, 2007.
On June 30, 2006, the Company entered into a $1 billion Five Year Credit Agreement (the “Credit Agreement”) with a bank group including Citibank, N.A., as Administrative Agent for the lenders, and Bank of America, N.A., as Syndication Agent. The Credit Agreement may be used for general corporate borrowing purposes and issuance of letters of credit, with a $500 million sub-limitfor letters of credit. The Credit Agreement contains certain financial and other restrictive covenants with which non-compliancewould allow any amounts outstanding to be accelerated and would prohibit further borrowings. The Company pays an annualfacility fee based on a percentage of the $1 billion commitment (0.125% at December 31, 2007). No amounts were outstandingunder the Credit Agreement at December 31, 2007 or 2006. The Company anticipates utilizing the Credit Agreement principally for the issuance of letters of credit which aggregated approximately $184 million at December 31, 2007. The issuance of letters of credit under the Credit Agreement utilizes availability under the Credit Agreement.
The Company’s Credit Agreement and the indentures governing its long-term notes contain certain financial and other restrictivecovenants that would allow any amounts outstanding under the facilities to be accelerated, or restrict the Company’s ability toborrow thereunder, in the event of noncompliance. The Company was in compliance with all covenants at December 31, 2007.
In addition to compliance with these financial covenants, it is a condition to the Company’s ability to borrow under its CreditAgreement that certain of its representations and warranties under that agreement be true and correct as of the date of theborrowing. The Company’s Credit Agreement, the indentures governing its long-term notes and certain other debt instruments alsocontain cross-default provisions with respect to a default in any payment under, or events resulting in or permitting the accelerationof, indebtedness greater than $50 million.
Expected maturities of long-term debt for years subsequent to December 31, 2007 are as follows (in millions):
2008........................................................................................................................................................... $ 1682009........................................................................................................................................................... 8392010........................................................................................................................................................... 7712011........................................................................................................................................................... 512012........................................................................................................................................................... 30Thereafter................................................................................................................................................... 1,518
Total.................................................................................................................................................... $ 3,377
NOTE 9: MINORITY INTERESTS AND OTHER LONG-TERM LIABILITIES
Other long-term liabilities were $245 million and $305 million at December 31, 2007 and 2006, respectively. Other long-termliabilities include liabilities related to the Company’s purchased or licensed software, tax liabilities and interest rate swapagreements. Minority interests were $174 million and $150 million at December 31, 2007 and 2006, respectively. The increase in minority interests in 2007 was primarily due to the Company’s ownership interest in MphasiS (see Note 16).
NOTE 10: INCOME TAXES
Following is a summary of income tax expense for the years ended December 31, 2007, 2006 and 2005 (in millions):
2007 2006 2005
Income from continuing operations................................................................. $ 360 $ 257 $ 153
Loss from discontinued operations.................................................................. (9) (26) (38)
Shareholders’ equity....................................................................................... 518 34 (101)
Total........................................................................................................ $ 869 $ 265 $ 14
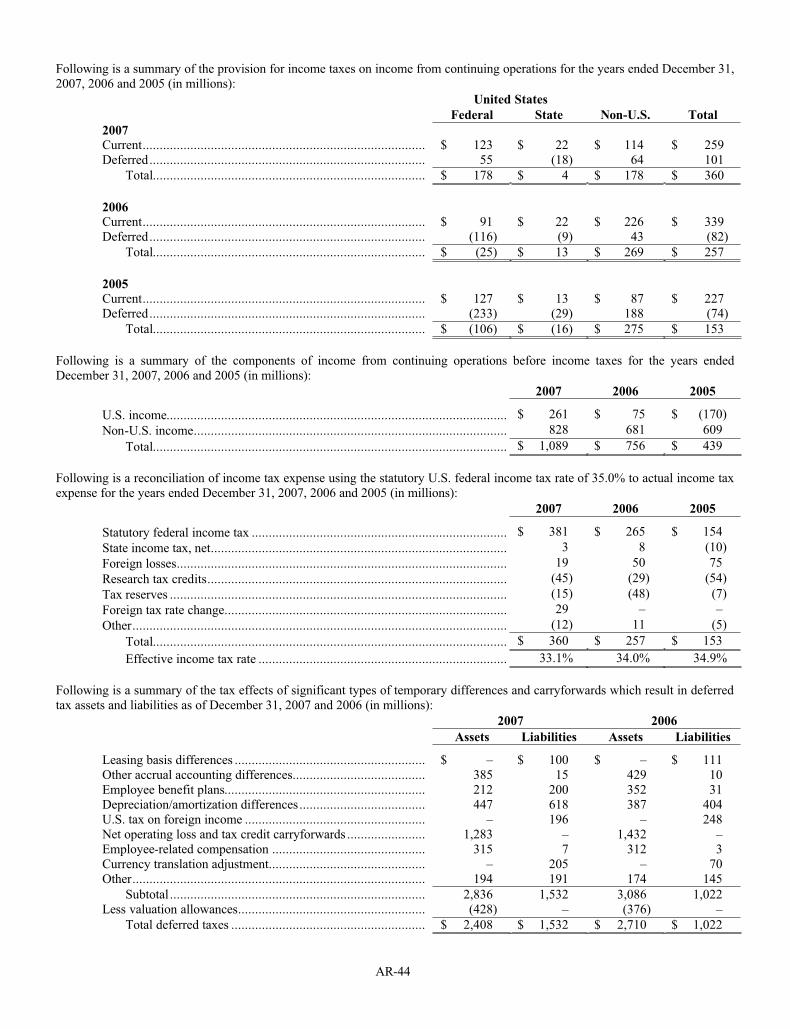
AR-44
Following is a summary of the provision for income taxes on income from continuing operations for the years ended December 31, 2007, 2006 and 2005 (in millions):
United States
Federal State Non-U.S. Total
2007Current................................................................................... $ 123 $ 22 $ 114 $ 259Deferred................................................................................. 55 (18) 64 101
Total................................................................................ $ 178 $ 4 $ 178 $ 360
2006Current................................................................................... $ 91 $ 22 $ 226 $ 339Deferred................................................................................. (116) (9) 43 (82)
Total................................................................................ $ (25) $ 13 $ 269 $ 257
2005Current................................................................................... $ 127 $ 13 $ 87 $ 227Deferred................................................................................. (233) (29) 188 (74)
Total................................................................................ $ (106) $ (16) $ 275 $ 153
Following is a summary of the components of income from continuing operations before income taxes for the years endedDecember 31, 2007, 2006 and 2005 (in millions):
2007 2006 2005
U.S. income.................................................................................................... $ 261 $ 75 $ (170)
Non-U.S. income............................................................................................ 828 681 609
Total........................................................................................................ $ 1,089 $ 756 $ 439
Following is a reconciliation of income tax expense using the statutory U.S. federal income tax rate of 35.0% to actual income taxexpense for the years ended December 31, 2007, 2006 and 2005 (in millions):
2007 2006 2005
Statutory federal income tax ........................................................................... $ 381 $ 265 $ 154
State income tax, net....................................................................................... 3 8 (10)
Foreign losses................................................................................................. 19 50 75
Research tax credits........................................................................................ (45) (29) (54)
Tax reserves ................................................................................................... (15) (48) (7)
Foreign tax rate change................................................................................... 29 – –
Other.............................................................................................................. (12) 11 (5)
Total........................................................................................................ $ 360 $ 257 $ 153
Effective income tax rate ......................................................................... 33.1% 34.0% 34.9%
Following is a summary of the tax effects of significant types of temporary differences and carryforwards which result in deferredtax assets and liabilities as of December 31, 2007 and 2006 (in millions):
2007 2006
Assets Liabilities Assets Liabilities
Leasing basis differences ........................................................ $ – $ 100 $ – $ 111Other accrual accounting differences....................................... 385 15 429 10Employee benefit plans........................................................... 212 200 352 31Depreciation/amortization differences..................................... 447 618 387 404U.S. tax on foreign income ..................................................... – 196 – 248Net operating loss and tax credit carryforwards ....................... 1,283 – 1,432 –Employee-related compensation ............................................. 315 7 312 3Currency translation adjustment.............................................. – 205 – 70Other...................................................................................... 194 191 174 145
Subtotal ........................................................................... 2,836 1,532 3,086 1,022Less valuation allowances....................................................... (428) – (376) –
Total deferred taxes ......................................................... $ 2,408 $ 1,532 $ 2,710 $ 1,022
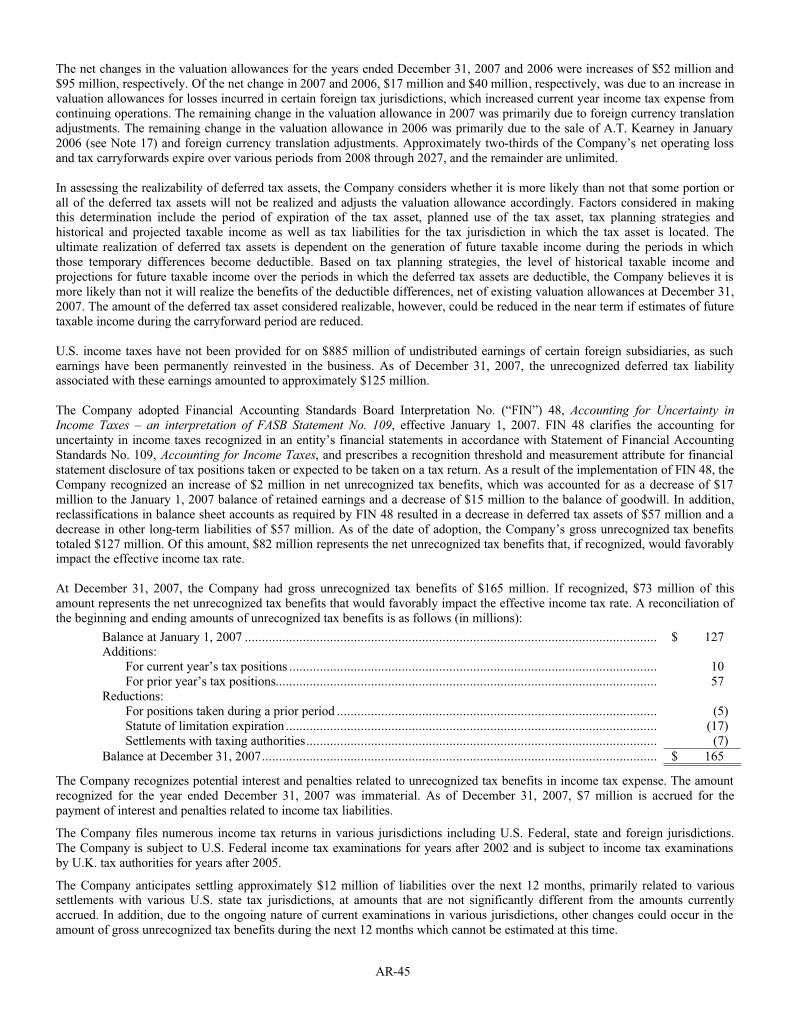
AR-45
The net changes in the valuation allowances for the years ended December 31, 2007 and 2006 were increases of $52 million and $95 million, respectively. Of the net change in 2007 and 2006, $17 million and $40 million, respectively, was due to an increase in valuation allowances for losses incurred in certain foreign tax jurisdictions, which increased current year income tax expense fromcontinuing operations. The remaining change in the valuation allowance in 2007 was primarily due to foreign currency translationadjustments. The remaining change in the valuation allowance in 2006 was primarily due to the sale of A.T. Kearney in January 2006 (see Note 17) and foreign currency translation adjustments. Approximately two-thirds of the Company’s net operating loss and tax carryforwards expire over various periods from 2008 through 2027, and the remainder are unlimited.
In assessing the realizability of deferred tax assets, the Company considers whether it is more likely than not that some portion or all of the deferred tax assets will not be realized and adjusts the valuation allowance accordingly. Factors considered in makingthis determination include the period of expiration of the tax asset, planned use of the tax asset, tax planning strategies andhistorical and projected taxable income as well as tax liabilities for the tax jurisdiction in which the tax asset is located. Theultimate realization of deferred tax assets is dependent on the generation of future taxable income during the periods in whichthose temporary differences become deductible. Based on tax planning strategies, the level of historical taxable income andprojections for future taxable income over the periods in which the deferred tax assets are deductible, the Company believes it is more likely than not it will realize the benefits of the deductible differences, net of existing valuation allowances at December 31, 2007. The amount of the deferred tax asset considered realizable, however, could be reduced in the near term if estimates of futuretaxable income during the carryforward period are reduced.
U.S. income taxes have not been provided for on $885 million of undistributed earnings of certain foreign subsidiaries, as suchearnings have been permanently reinvested in the business. As of December 31, 2007, the unrecognized deferred tax liabilityassociated with these earnings amounted to approximately $125 million.
The Company adopted Financial Accounting Standards Board Interpretation No. (“FIN”) 48, Accounting for Uncertainty inIncome Taxes – an interpretation of FASB Statement No. 109, effective January 1, 2007. FIN 48 clarifies the accounting foruncertainty in income taxes recognized in an entity’s financial statements in accordance with Statement of Financial AccountingStandards No. 109, Accounting for Income Taxes, and prescribes a recognition threshold and measurement attribute for financial statement disclosure of tax positions taken or expected to be taken on a tax return. As a result of the implementation of FIN 48, the Company recognized an increase of $2 million in net unrecognized tax benefits, which was accounted for as a decrease of $17 million to the January 1, 2007 balance of retained earnings and a decrease of $15 million to the balance of goodwill. In addition,reclassifications in balance sheet accounts as required by FIN 48 resulted in a decrease in deferred tax assets of $57 million and a decrease in other long-term liabilities of $57 million. As of the date of adoption, the Company’s gross unrecognized tax benefitstotaled $127 million. Of this amount, $82 million represents the net unrecognized tax benefits that, if recognized, would favorablyimpact the effective income tax rate.
At December 31, 2007, the Company had gross unrecognized tax benefits of $165 million. If recognized, $73 million of thisamount represents the net unrecognized tax benefits that would favorably impact the effective income tax rate. A reconciliation of the beginning and ending amounts of unrecognized tax benefits is as follows (in millions):
Balance at January 1, 2007 ......................................................................................................................... $ 127Additions:
For current year’s tax positions ............................................................................................................ 10For prior year’s tax positions................................................................................................................ 57
Reductions:For positions taken during a prior period .............................................................................................. (5)Statute of limitation expiration ............................................................................................................. (17)Settlements with taxing authorities....................................................................................................... (7)
Balance at December 31, 2007.................................................................................................................... $ 165
The Company recognizes potential interest and penalties related to unrecognized tax benefits in income tax expense. The amount recognized for the year ended December 31, 2007 was immaterial. As of December 31, 2007, $7 million is accrued for thepayment of interest and penalties related to income tax liabilities.
The Company files numerous income tax returns in various jurisdictions including U.S. Federal, state and foreign jurisdictions.The Company is subject to U.S. Federal income tax examinations for years after 2002 and is subject to income tax examinations by U.K. tax authorities for years after 2005.
The Company anticipates settling approximately $12 million of liabilities over the next 12 months, primarily related to varioussettlements with various U.S. state tax jurisdictions, at amounts that are not significantly different from the amounts currentlyaccrued. In addition, due to the ongoing nature of current examinations in various jurisdictions, other changes could occur in theamount of gross unrecognized tax benefits during the next 12 months which cannot be estimated at this time.
AR-46
NOTE 11: STOCK PURCHASE AND INCENTIVE PLANS
Stock Purchase Plan
Under the Stock Purchase Plan, eligible employees may purchase EDS common stock at the end of each fiscal quarter at apurchase price equal to 85% of the lower of the market price on the first or last trading day of the quarter, through payrolldeductions of up to 10% of their compensation, not to exceed $25,000 per year in market value. Shares of EDS common stock purchased under the plan may not be sold or transferred within one year of the date of purchase. The number of shares originallyauthorized for issuance under this plan is 57.5 million. Total compensation expense recognized under this plan was $6 millionduring each of the years ended December 31, 2007, 2006 and 2005.
PerformanceShare and EDS Global Share Plans
PerformanceShare and Global Share are “broad-based” plans that permit the grant of stock options to any eligible employee of EDS or its participating subsidiaries other than executive officers. As of December 31, 2007, options for 16.0 million shares hadbeen granted under PerformanceShare (principally in a broad-based grant in May 1997) and options for 25.9 million shares hadbeen granted under Global Share (principally in two broad-based grants in July 2000 and February 2002). The number of shares originally authorized for issuance under PerformanceShare and Global Share is 20 million and 27 million, respectively. As ofDecember 31, 2007, no shares were available for future issuance under these plans.
Incentive Plan
The Incentive Plan is authorized to issue up to 136.5 million shares of common stock. The Incentive Plan permits the granting ofstock-based awards in the form of stock grants, restricted shares, restricted stock units, stock options or stock appreciation rights to eligible employees and non-employee directors. A restricted stock unit is the right to receive shares. The exercise price for stockoptions granted under this plan must be equal to or greater than the fair market value on the date of the grant.
Transition Inducement Plan
The Transition Inducement Plan permits awards in the form of nonqualified stock options, stock appreciation rights, restrictedstock units, restricted stock awards or stock grants to eligible employees. This plan was adopted in October 2002 in anticipation of then proposed New York Stock Exchange rules which provide that awards issued to induce new employment or in exchange for awards under an “acquired” plan are not subject to shareholder approval. All options granted under this plan must have an exerciseprice not less than the fair market value per share of common stock on the grant date. The maximum number of shares that can beissued under this plan is 7.0 million, of which not more than 2.0 million are available for awards other than in the form of stockoptions.
Stock Options
The fair value of each stock option award is estimated on the date of grant using the Black-Scholes-Merton valuation model thatuses the assumptions noted below. Estimates of fair value are not intended to predict actual future events or the value ultimatelyrealized by employees who receive equity awards, and subsequent events are not indicative of the reasonableness of the originalestimates of fair value made by the Company under SFAS No. 123R. The vesting period for most new option awards is three years and the contractual term is seven years. The outstanding term of an option is estimated using a simplified method, which is theaverage of the vesting term and contractual term of the option. Expected volatility during the estimated outstanding term of theoption is based on historical volatility during a period equivalent to the estimated outstanding term of the option and impliedvolatility as determined based on observed market prices of the Company’s publicly traded options. Expected dividends during theestimated outstanding term of the option are based on recent dividend activity. Risk-free interest rates are based on the U.S.Treasury yield in effect at the time of the grant. The weighted-average fair values of options granted were $7.86, $8.87 and $10.46for the years ended December 31, 2007, 2006 and 2005, respectively. The fair value of each option was estimated at the date of grant, with the following weighted-average assumptions for the years ended December 31, 2007, 2006 and 2005, respectively:dividend yields of 0.8%, 0.7% and 1.0%; expected volatility of 31.4%, 35.0% and 60.3%; risk-free interest rate of 4.3%, 4.7% and4.1%; and expected lives of 4.8 years, 5.0 years and 5.0 years. The total intrinsic value of options exercised during the years ended December 31, 2007, 2006 and 2005 were $61 million, $115 million and $23 million, respectively, resulting in tax deductions of $21 million, $40 million and $8 million, respectively. During 2005, the Company issued new shares and utilized treasury shares tosatisfy share option exercises and the vesting of restricted share awards. The Company plans to utilize treasury shares acquiredunder the repurchase programs authorized in February 2006 and December 2007 to satisfy future share option exercises and thevesting of restricted share awards (see Note 1).
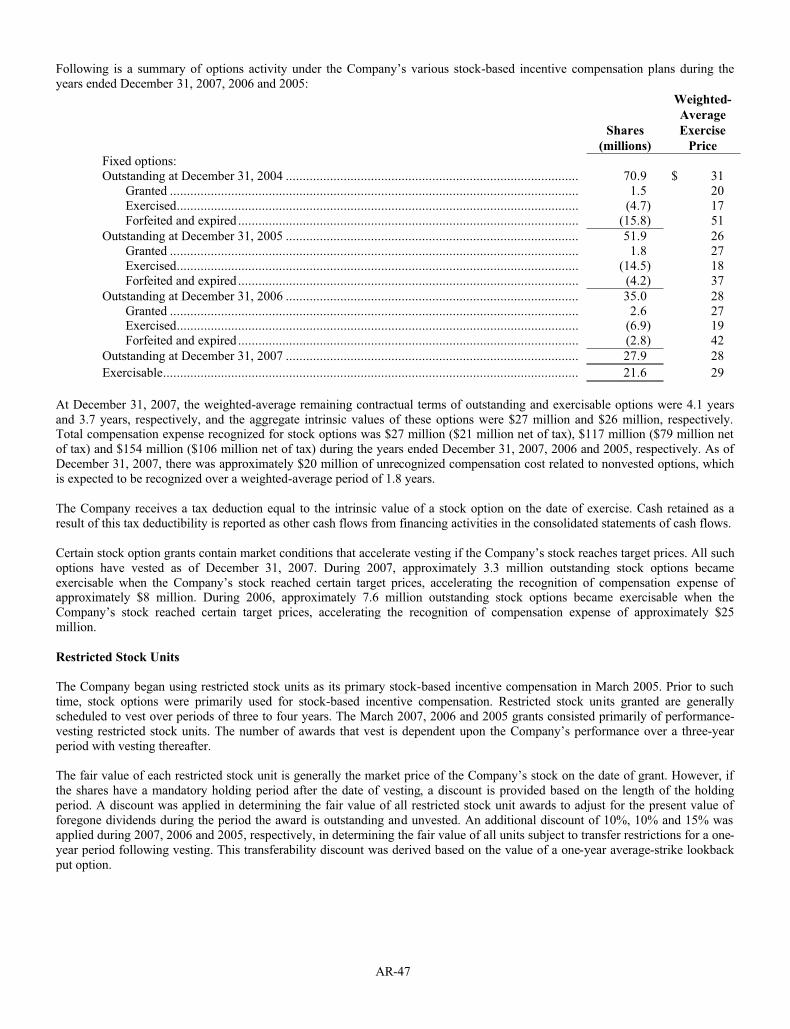
AR-47
Following is a summary of options activity under the Company’s various stock-based incentive compensation plans during theyears ended December 31, 2007, 2006 and 2005:
Shares
(millions)
Weighted-
Average
Exercise
Price
Fixed options:Outstanding at December 31, 2004 ...................................................................................... 70.9 $ 31
Granted ........................................................................................................................ 1.5 20Exercised...................................................................................................................... (4.7) 17Forfeited and expired .................................................................................................... (15.8) 51
Outstanding at December 31, 2005 ...................................................................................... 51.9 26Granted ........................................................................................................................ 1.8 27Exercised...................................................................................................................... (14.5) 18Forfeited and expired .................................................................................................... (4.2) 37
Outstanding at December 31, 2006 ...................................................................................... 35.0 28Granted ........................................................................................................................ 2.6 27Exercised...................................................................................................................... (6.9) 19Forfeited and expired .................................................................................................... (2.8) 42
Outstanding at December 31, 2007 ...................................................................................... 27.9 28
Exercisable.......................................................................................................................... 21.6 29
At December 31, 2007, the weighted-average remaining contractual terms of outstanding and exercisable options were 4.1 yearsand 3.7 years, respectively, and the aggregate intrinsic values of these options were $27 million and $26 million, respectively.Total compensation expense recognized for stock options was $27 million ($21 million net of tax), $117 million ($79 million netof tax) and $154 million ($106 million net of tax) during the years ended December 31, 2007, 2006 and 2005, respectively. As ofDecember 31, 2007, there was approximately $20 million of unrecognized compensation cost related to nonvested options, which is expected to be recognized over a weighted-average period of 1.8 years.
The Company receives a tax deduction equal to the intrinsic value of a stock option on the date of exercise. Cash retained as aresult of this tax deductibility is reported as other cash flows from financing activities in the consolidated statements of cash flows.
Certain stock option grants contain market conditions that accelerate vesting if the Company’s stock reaches target prices. All such options have vested as of December 31, 2007. During 2007, approximately 3.3 million outstanding stock options becameexercisable when the Company’s stock reached certain target prices, accelerating the recognition of compensation expense ofapproximately $8 million. During 2006, approximately 7.6 million outstanding stock options became exercisable when theCompany’s stock reached certain target prices, accelerating the recognition of compensation expense of approximately $25million.
Restricted Stock Units
The Company began using restricted stock units as its primary stock-based incentive compensation in March 2005. Prior to such time, stock options were primarily used for stock-based incentive compensation. Restricted stock units granted are generallyscheduled to vest over periods of three to four years. The March 2007, 2006 and 2005 grants consisted primarily of performance-vesting restricted stock units. The number of awards that vest is dependent upon the Company’s performance over a three-yearperiod with vesting thereafter.
The fair value of each restricted stock unit is generally the market price of the Company’s stock on the date of grant. However, if the shares have a mandatory holding period after the date of vesting, a discount is provided based on the length of the holdingperiod. A discount was applied in determining the fair value of all restricted stock unit awards to adjust for the present value of foregone dividends during the period the award is outstanding and unvested. An additional discount of 10%, 10% and 15% was applied during 2007, 2006 and 2005, respectively, in determining the fair value of all units subject to transfer restrictions for a one-year period following vesting. This transferability discount was derived based on the value of a one-year average-strike lookbackput option.
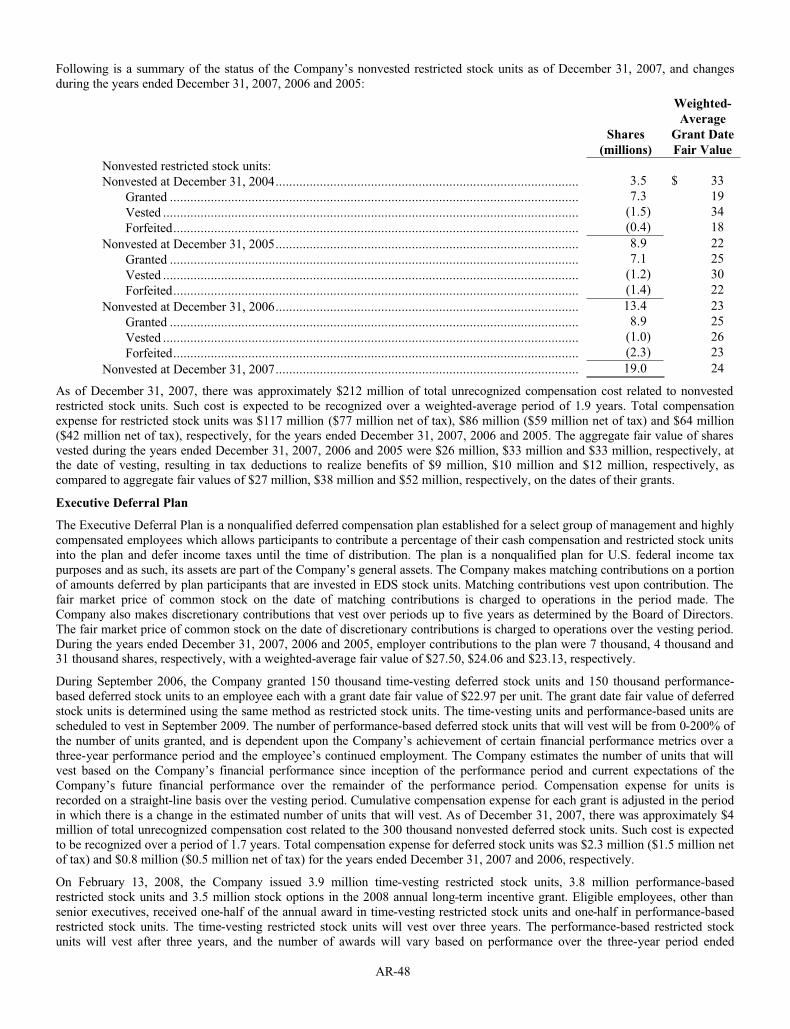
AR-48
Following is a summary of the status of the Company’s nonvested restricted stock units as of December 31, 2007, and changesduring the years ended December 31, 2007, 2006 and 2005:
Shares
(millions)
Weighted-
Average
Grant Date
Fair Value
Nonvested restricted stock units:
Nonvested at December 31, 2004......................................................................................... 3.5 $ 33
Granted ........................................................................................................................ 7.3 19
Vested .......................................................................................................................... (1.5) 34
Forfeited....................................................................................................................... (0.4) 18
Nonvested at December 31, 2005......................................................................................... 8.9 22
Granted ........................................................................................................................ 7.1 25
Vested .......................................................................................................................... (1.2) 30
Forfeited....................................................................................................................... (1.4) 22
Nonvested at December 31, 2006......................................................................................... 13.4 23
Granted ........................................................................................................................ 8.9 25
Vested .......................................................................................................................... (1.0) 26
Forfeited....................................................................................................................... (2.3) 23
Nonvested at December 31, 2007......................................................................................... 19.0 24
As of December 31, 2007, there was approximately $212 million of total unrecognized compensation cost related to nonvested restricted stock units. Such cost is expected to be recognized over a weighted-average period of 1.9 years. Total compensationexpense for restricted stock units was $117 million ($77 million net of tax), $86 million ($59 million net of tax) and $64 million($42 million net of tax), respectively, for the years ended December 31, 2007, 2006 and 2005. The aggregate fair value of sharesvested during the years ended December 31, 2007, 2006 and 2005 were $26 million, $33 million and $33 million, respectively, at the date of vesting, resulting in tax deductions to realize benefits of $9 million, $10 million and $12 million, respectively, ascompared to aggregate fair values of $27 million, $38 million and $52 million, respectively, on the dates of their grants.
Executive Deferral Plan
The Executive Deferral Plan is a nonqualified deferred compensation plan established for a select group of management and highlycompensated employees which allows participants to contribute a percentage of their cash compensation and restricted stock unitsinto the plan and defer income taxes until the time of distribution. The plan is a nonqualified plan for U.S. federal income taxpurposes and as such, its assets are part of the Company’s general assets. The Company makes matching contributions on a portionof amounts deferred by plan participants that are invested in EDS stock units. Matching contributions vest upon contribution. Thefair market price of common stock on the date of matching contributions is charged to operations in the period made. TheCompany also makes discretionary contributions that vest over periods up to five years as determined by the Board of Directors.The fair market price of common stock on the date of discretionary contributions is charged to operations over the vesting period.During the years ended December 31, 2007, 2006 and 2005, employer contributions to the plan were 7 thousand, 4 thousand and 31 thousand shares, respectively, with a weighted-average fair value of $27.50, $24.06 and $23.13, respectively.
During September 2006, the Company granted 150 thousand time-vesting deferred stock units and 150 thousand performance-based deferred stock units to an employee each with a grant date fair value of $22.97 per unit. The grant date fair value of deferredstock units is determined using the same method as restricted stock units. The time-vesting units and performance-based units arescheduled to vest in September 2009. The number of performance-based deferred stock units that will vest will be from 0-200% ofthe number of units granted, and is dependent upon the Company’s achievement of certain financial performance metrics over a three-year performance period and the employee’s continued employment. The Company estimates the number of units that will vest based on the Company’s financial performance since inception of the performance period and current expectations of theCompany’s future financial performance over the remainder of the performance period. Compensation expense for units isrecorded on a straight-line basis over the vesting period. Cumulative compensation expense for each grant is adjusted in the periodin which there is a change in the estimated number of units that will vest. As of December 31, 2007, there was approximately $4million of total unrecognized compensation cost related to the 300 thousand nonvested deferred stock units. Such cost is expectedto be recognized over a period of 1.7 years. Total compensation expense for deferred stock units was $2.3 million ($1.5 million net of tax) and $0.8 million ($0.5 million net of tax) for the years ended December 31, 2007 and 2006, respectively.
On February 13, 2008, the Company issued 3.9 million time-vesting restricted stock units, 3.8 million performance-basedrestricted stock units and 3.5 million stock options in the 2008 annual long-term incentive grant. Eligible employees, other thansenior executives, received one-half of the annual award in time-vesting restricted stock units and one-half in performance-basedrestricted stock units. The time-vesting restricted stock units will vest over three years. The performance-based restricted stockunits will vest after three years, and the number of awards will vary based on performance over the three-year period ended
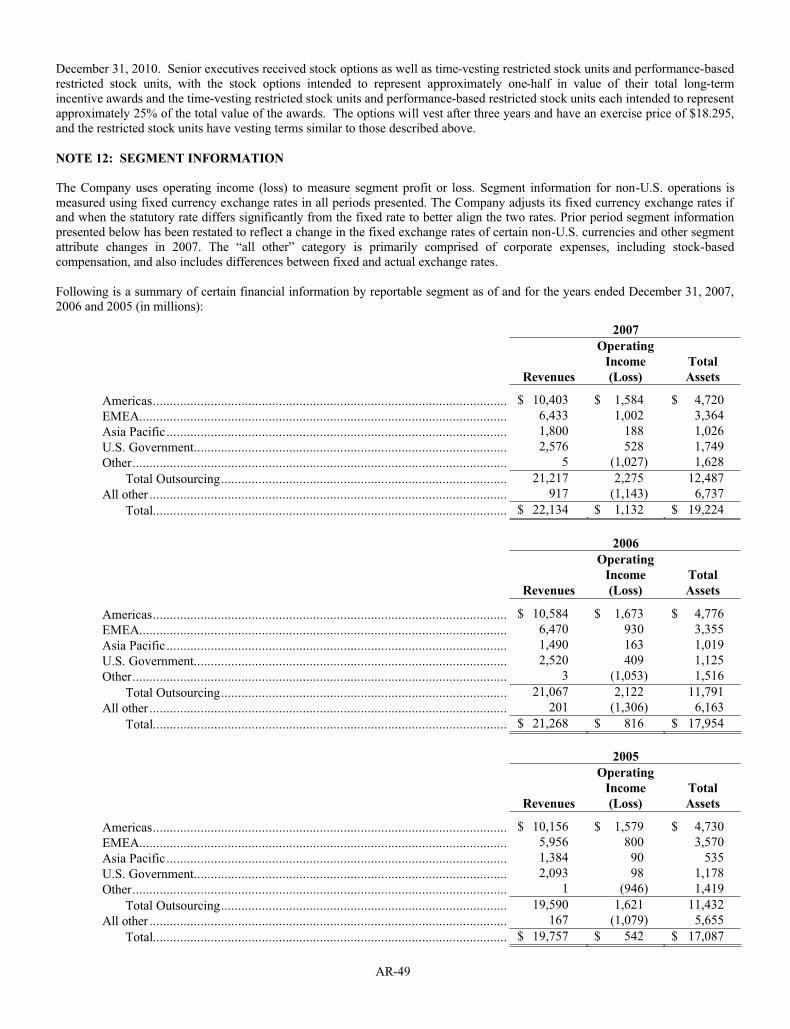
AR-49
December 31, 2010. Senior executives received stock options as well as time-vesting restricted stock units and performance-basedrestricted stock units, with the stock options intended to represent approximately one-half in value of their total long-termincentive awards and the time-vesting restricted stock units and performance-based restricted stock units each intended to representapproximately 25% of the total value of the awards. The options will vest after three years and have an exercise price of $18.295,and the restricted stock units have vesting terms similar to those described above.
NOTE 12: SEGMENT INFORMATION
The Company uses operating income (loss) to measure segment profit or loss. Segment information for non-U.S. operations ismeasured using fixed currency exchange rates in all periods presented. The Company adjusts its fixed currency exchange rates ifand when the statutory rate differs significantly from the fixed rate to better align the two rates. Prior period segment informationpresented below has been restated to reflect a change in the fixed exchange rates of certain non-U.S. currencies and other segmentattribute changes in 2007. The “all other” category is primarily comprised of corporate expenses, including stock-basedcompensation, and also includes differences between fixed and actual exchange rates.
Following is a summary of certain financial information by reportable segment as of and for the years ended December 31, 2007, 2006 and 2005 (in millions):
2007
Revenues
Operating
Income
(Loss)
Total
Assets
Americas........................................................................................................ $ 10,403 $ 1,584 $ 4,720
EMEA............................................................................................................ 6,433 1,002 3,364
Asia Pacific.................................................................................................... 1,800 188 1,026
U.S. Government............................................................................................ 2,576 528 1,749
Other.............................................................................................................. 5 (1,027) 1,628
Total Outsourcing.................................................................................... 21,217 2,275 12,487
All other ......................................................................................................... 917 (1,143) 6,737
Total........................................................................................................ $ 22,134 $ 1,132 $ 19,224
2006
Revenues
Operating
Income
(Loss)
Total
Assets
Americas........................................................................................................ $ 10,584 $ 1,673 $ 4,776
EMEA............................................................................................................ 6,470 930 3,355
Asia Pacific.................................................................................................... 1,490 163 1,019
U.S. Government............................................................................................ 2,520 409 1,125
Other.............................................................................................................. 3 (1,053) 1,516
Total Outsourcing.................................................................................... 21,067 2,122 11,791
All other ......................................................................................................... 201 (1,306) 6,163
Total........................................................................................................ $ 21,268 $ 816 $ 17,954
2005
Revenues
Operating
Income
(Loss)
Total
Assets
Americas........................................................................................................ $ 10,156 $ 1,579 $ 4,730
EMEA............................................................................................................ 5,956 800 3,570
Asia Pacific.................................................................................................... 1,384 90 535
U.S. Government............................................................................................ 2,093 98 1,178
Other.............................................................................................................. 1 (946) 1,419
Total Outsourcing.................................................................................... 19,590 1,621 11,432
All other ......................................................................................................... 167 (1,079) 5,655
Total........................................................................................................ $ 19,757 $ 542 $ 17,087
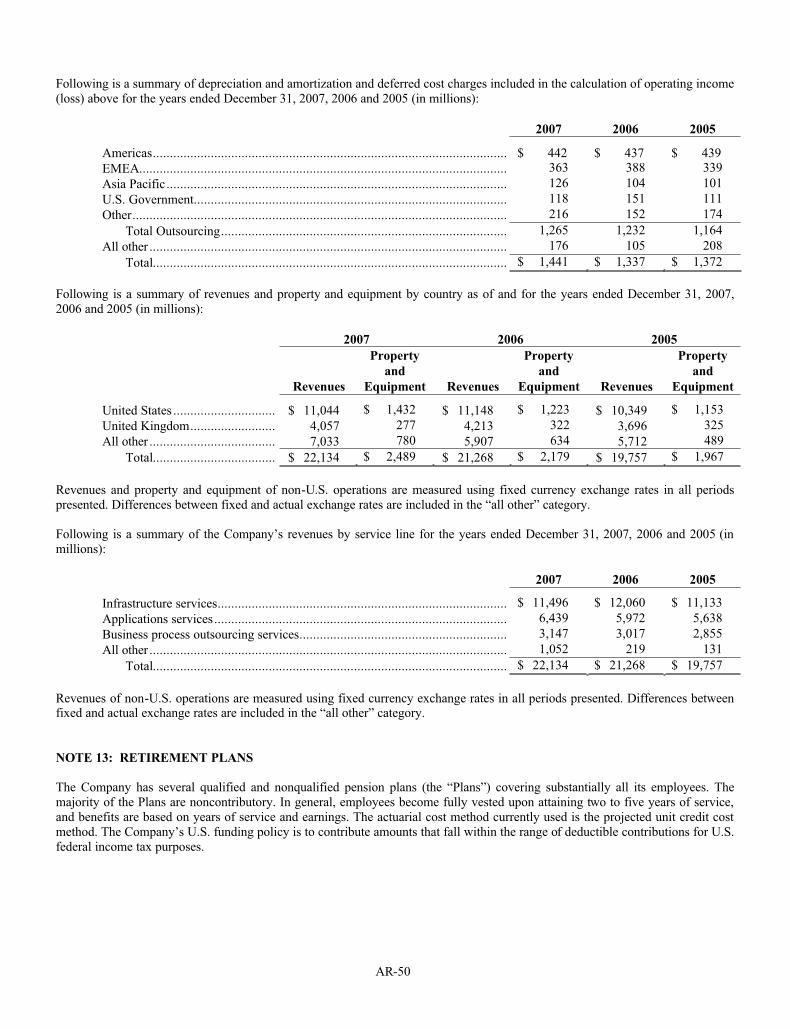
AR-50
Following is a summary of depreciation and amortization and deferred cost charges included in the calculation of operating income(loss) above for the years ended December 31, 2007, 2006 and 2005 (in millions):
2007 2006 2005
Americas........................................................................................................ $ 442 $ 437 $ 439
EMEA............................................................................................................ 363 388 339
Asia Pacific.................................................................................................... 126 104 101
U.S. Government............................................................................................ 118 151 111
Other.............................................................................................................. 216 152 174
Total Outsourcing.................................................................................... 1,265 1,232 1,164
All other ......................................................................................................... 176 105 208
Total........................................................................................................ $ 1,441 $ 1,337 $ 1,372
Following is a summary of revenues and property and equipment by country as of and for the years ended December 31, 2007,2006 and 2005 (in millions):
2007 2006 2005
Revenues
Property
and
Equipment Revenues
Property
and
Equipment Revenues
Property
and
Equipment
United States .............................. $ 11,044 $ 1,432 $ 11,148 $ 1,223 $ 10,349 $ 1,153
United Kingdom......................... 4,057 277 4,213 322 3,696 325
All other ..................................... 7,033 780 5,907 634 5,712 489
Total.................................... $ 22,134 $ 2,489 $ 21,268 $ 2,179 $ 19,757 $ 1,967
Revenues and property and equipment of non-U.S. operations are measured using fixed currency exchange rates in all periodspresented. Differences between fixed and actual exchange rates are included in the “all other” category.
Following is a summary of the Company’s revenues by service line for the years ended December 31, 2007, 2006 and 2005 (in millions):
2007 2006 2005
Infrastructure services..................................................................................... $ 11,496 $ 12,060 $ 11,133
Applications services...................................................................................... 6,439 5,972 5,638
Business process outsourcing services............................................................. 3,147 3,017 2,855
All other ......................................................................................................... 1,052 219 131
Total........................................................................................................ $ 22,134 $ 21,268 $ 19,757
Revenues of non-U.S. operations are measured using fixed currency exchange rates in all periods presented. Differences between fixed and actual exchange rates are included in the “all other” category.
NOTE 13: RETIREMENT PLANS
The Company has several qualified and nonqualified pension plans (the “Plans”) covering substantially all its employees. Themajority of the Plans are noncontributory. In general, employees become fully vested upon attaining two to five years of service,and benefits are based on years of service and earnings. The actuarial cost method currently used is the projected unit credit costmethod. The Company’s U.S. funding policy is to contribute amounts that fall within the range of deductible contributions for U.S.federal income tax purposes.
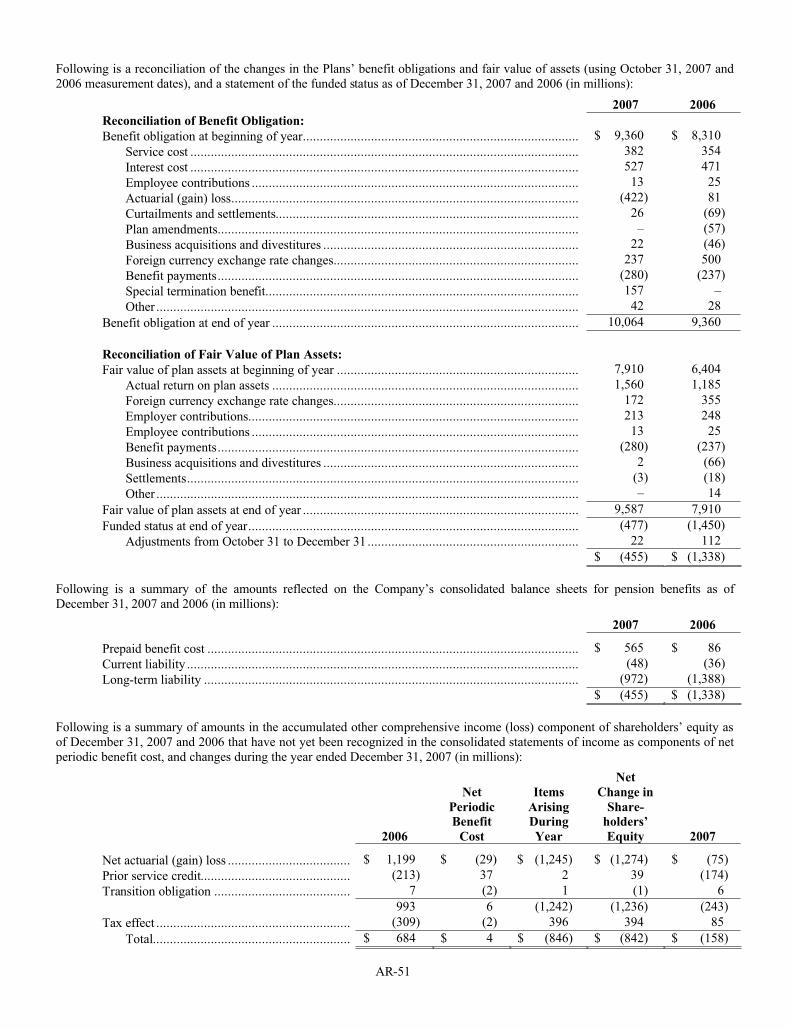
AR-51
Following is a reconciliation of the changes in the Plans’ benefit obligations and fair value of assets (using October 31, 2007 and 2006 measurement dates), and a statement of the funded status as of December 31, 2007 and 2006 (in millions):
2007 2006
Reconciliation of Benefit Obligation:
Benefit obligation at beginning of year................................................................................. $ 9,360 $ 8,310
Service cost .................................................................................................................. 382 354
Interest cost .................................................................................................................. 527 471
Employee contributions ................................................................................................ 13 25
Actuarial (gain) loss...................................................................................................... (422) 81
Curtailments and settlements......................................................................................... 26 (69)
Plan amendments.......................................................................................................... – (57)
Business acquisitions and divestitures ........................................................................... 22 (46)
Foreign currency exchange rate changes........................................................................ 237 500
Benefit payments.......................................................................................................... (280) (237)
Special termination benefit............................................................................................ 157 –
Other ............................................................................................................................ 42 28
Benefit obligation at end of year .......................................................................................... 10,064 9,360
Reconciliation of Fair Value of Plan Assets:
Fair value of plan assets at beginning of year ....................................................................... 7,910 6,404
Actual return on plan assets .......................................................................................... 1,560 1,185
Foreign currency exchange rate changes........................................................................ 172 355
Employer contributions................................................................................................. 213 248
Employee contributions ................................................................................................ 13 25
Benefit payments.......................................................................................................... (280) (237)
Business acquisitions and divestitures ........................................................................... 2 (66)
Settlements................................................................................................................... (3) (18)
Other ............................................................................................................................ – 14
Fair value of plan assets at end of year ................................................................................. 9,587 7,910
Funded status at end of year................................................................................................. (477) (1,450)
Adjustments from October 31 to December 31 .............................................................. 22 112
$ (455) $ (1,338)
Following is a summary of the amounts reflected on the Company’s consolidated balance sheets for pension benefits as ofDecember 31, 2007 and 2006 (in millions):
2007 2006
Prepaid benefit cost ............................................................................................................. $ 565 $ 86
Current liability ................................................................................................................... (48) (36)
Long-term liability .............................................................................................................. (972) (1,388)
$ (455) $ (1,338)
Following is a summary of amounts in the accumulated other comprehensive income (loss) component of shareholders’ equity as of December 31, 2007 and 2006 that have not yet been recognized in the consolidated statements of income as components of net periodic benefit cost, and changes during the year ended December 31, 2007 (in millions):
2006
Net
PeriodicBenefit
Cost
Items
ArisingDuring
Year
Net
Change in
Share-holders’
Equity 2007
Net actuarial (gain) loss .................................... $ 1,199 $ (29) $ (1,245) $ (1,274) $ (75)
Prior service credit............................................ (213) 37 2 39 (174)
Transition obligation ........................................ 7 (2) 1 (1) 6
993 6 (1,242) (1,236) (243)
Tax effect ......................................................... (309) (2) 396 394 85
Total.......................................................... $ 684 $ 4 $ (846) $ (842) $ (158)
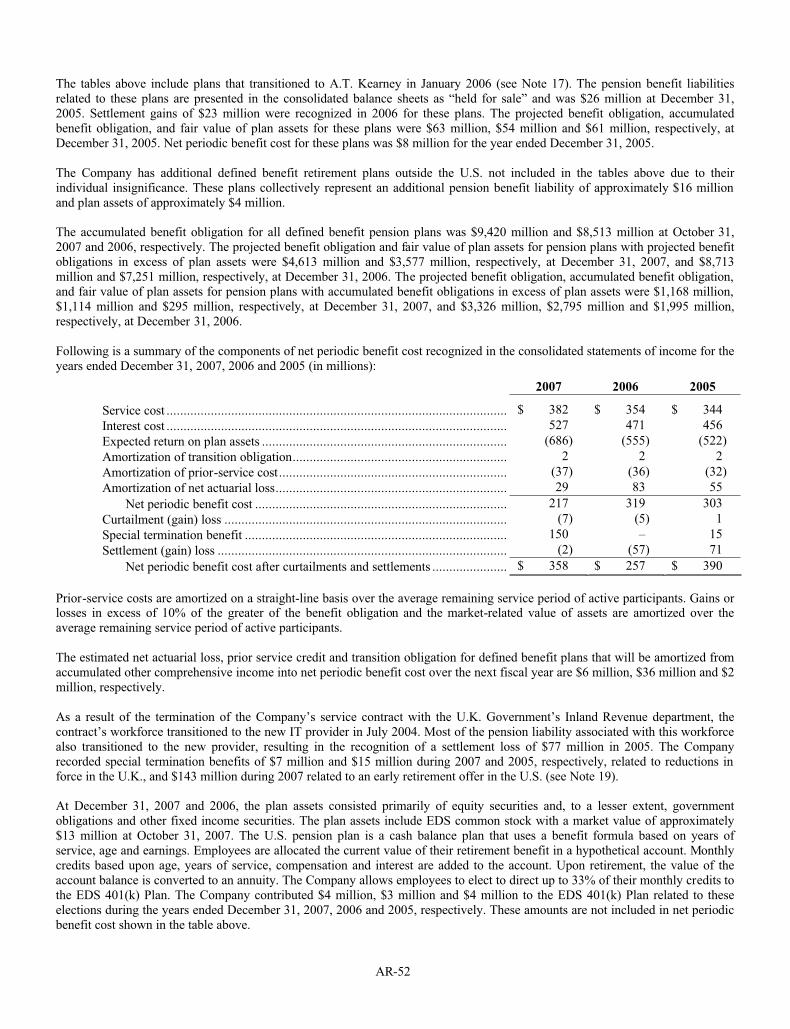
AR-52
The tables above include plans that transitioned to A.T. Kearney in January 2006 (see Note 17). The pension benefit liabilitiesrelated to these plans are presented in the consolidated balance sheets as “held for sale” and was $26 million at December 31,2005. Settlement gains of $23 million were recognized in 2006 for these plans. The projected benefit obligation, accumulatedbenefit obligation, and fair value of plan assets for these plans were $63 million, $54 million and $61 million, respectively, atDecember 31, 2005. Net periodic benefit cost for these plans was $8 million for the year ended December 31, 2005.
The Company has additional defined benefit retirement plans outside the U.S. not included in the tables above due to theirindividual insignificance. These plans collectively represent an additional pension benefit liability of approximately $16 millionand plan assets of approximately $4 million.
The accumulated benefit obligation for all defined benefit pension plans was $9,420 million and $8,513 million at October 31,2007 and 2006, respectively. The projected benefit obligation and fair value of plan assets for pension plans with projected benefitobligations in excess of plan assets were $4,613 million and $3,577 million, respectively, at December 31, 2007, and $8,713million and $7,251 million, respectively, at December 31, 2006. The projected benefit obligation, accumulated benefit obligation,and fair value of plan assets for pension plans with accumulated benefit obligations in excess of plan assets were $1,168 million,$1,114 million and $295 million, respectively, at December 31, 2007, and $3,326 million, $2,795 million and $1,995 million,respectively, at December 31, 2006.
Following is a summary of the components of net periodic benefit cost recognized in the consolidated statements of income for theyears ended December 31, 2007, 2006 and 2005 (in millions):
2007 2006 2005
Service cost .................................................................................................... $ 382 $ 354 $ 344
Interest cost .................................................................................................... 527 471 456
Expected return on plan assets ........................................................................ (686) (555) (522)
Amortization of transition obligation............................................................... 2 2 2
Amortization of prior-service cost................................................................... (37) (36) (32)
Amortization of net actuarial loss.................................................................... 29 83 55
Net periodic benefit cost .......................................................................... 217 319 303
Curtailment (gain) loss ................................................................................... (7) (5) 1
Special termination benefit ............................................................................. 150 – 15
Settlement (gain) loss ..................................................................................... (2) (57) 71
Net periodic benefit cost after curtailments and settlements ...................... $ 358 $ 257 $ 390
Prior-service costs are amortized on a straight-line basis over the average remaining service period of active participants. Gains or losses in excess of 10% of the greater of the benefit obligation and the market-related value of assets are amortized over theaverage remaining service period of active participants.
The estimated net actuarial loss, prior service credit and transition obligation for defined benefit plans that will be amortized fromaccumulated other comprehensive income into net periodic benefit cost over the next fiscal year are $6 million, $36 million and $2 million, respectively.
As a result of the termination of the Company’s service contract with the U.K. Government’s Inland Revenue department, thecontract’s workforce transitioned to the new IT provider in July 2004. Most of the pension liability associated with this workforcealso transitioned to the new provider, resulting in the recognition of a settlement loss of $77 million in 2005. The Companyrecorded special termination benefits of $7 million and $15 million during 2007 and 2005, respectively, related to reductions inforce in the U.K., and $143 million during 2007 related to an early retirement offer in the U.S. (see Note 19).
At December 31, 2007 and 2006, the plan assets consisted primarily of equity securities and, to a lesser extent, governmentobligations and other fixed income securities. The plan assets include EDS common stock with a market value of approximately$13 million at October 31, 2007. The U.S. pension plan is a cash balance plan that uses a benefit formula based on years ofservice, age and earnings. Employees are allocated the current value of their retirement benefit in a hypothetical account. Monthlycredits based upon age, years of service, compensation and interest are added to the account. Upon retirement, the value of theaccount balance is converted to an annuity. The Company allows employees to elect to direct up to 33% of their monthly credits tothe EDS 401(k) Plan. The Company contributed $4 million, $3 million and $4 million to the EDS 401(k) Plan related to theseelections during the years ended December 31, 2007, 2006 and 2005, respectively. These amounts are not included in net periodicbenefit cost shown in the table above.
AR-53
Following is a summary of the weighted-average assumptions used in the determination of the Company’s benefit obligation for the years ended December 31, 2007, 2006 and 2005:
2007 2006 2005
Discount rate at October 31............................................................................. 5.9% 5.4% 5.4%
Rate increase in compensation levels at October 31......................................... 3.2% 3.2% 3.2%
Following is a summary of the weighted-average assumptions used in the determination of the Company’s net periodic benefit costfor the years ended December 31, 2007, 2006 and 2005:
2007 2006 2005
Discount rate at October 31............................................................................. 5.4% 5.4% 6.0%
Rate increase in compensation levels at October 31......................................... 3.2% 3.2% 3.4%
Long-term rate of return on assets at January 1................................................ 8.5% 8.4% 8.6%
Following is a summary of the weighted-average asset allocation of all plan assets at December 31, 2007 and 2006, by assetcategory:
2007 2006
Equity securities .................................................................................................................. 77% 78%
Debt securities..................................................................................................................... 13% 14%
Cash and cash equivalents.................................................................................................... 1% 1%
Real estate........................................................................................................................... 1% 1%
Other................................................................................................................................... 8% 6%
Total............................................................................................................................. 100% 100%
In determining net periodic benefit cost recognized in its consolidated statements of income, the Company utilizes an expectedlong-term rate of return that, over time, should approximate the actual long-term returns earned on pension plan assets. TheCompany derives the assumed long-term rate of return on assets based upon the historical return of actual plan assets and thehistorical long-term return on similar asset classes as well as anticipated future returns based upon the types of invested assets. The type and mix of invested assets are determined by the pension investment strategy, which considers the average age of theCompany’s workforce and associated average periods until retirement. Since the average age of the Company’s workforce isrelatively low and average periods until retirement exceed 15 years, plan assets are weighted heavily towards equity investments.Equity investments, while susceptible to significant short-term fluctuations, have historically outperformed most other investmentalternatives on a long-term basis. The Company utilizes an active management strategy through third-party investment managers to maximize asset returns. As of December 31, 2007, the weighted-average target asset allocation for all plans was 76% equity; 15% fixed income; 1% cash and cash equivalents; 1% real estate; and 7% other. The Company expects to contribute approximately $130 million to its pension plans during fiscal year 2008, including discretionary and statutory contributions.
Estimated benefit payments, which include amounts to be earned by active plan employees through expected future service for allpension plans over the next 10 years are: 2008 – $318 million; 2009 – $259 million; 2010 – $280 million; 2011 – $309 million; 2012 – $337 million; and 2013 through 2017 – $2,045 million.
In addition to the plans described above, the EDS 401(k) Plan provides a long-term savings program for participants. The EDS401(k) Plan allows eligible employees to contribute a percentage of their compensation to a savings program and to defer incometaxes until the time of distribution. Participants may invest their contributions in various publicly traded investment funds or EDS common stock. The EDS 401(k) Plan also provides for employer-matching contributions. Until December 31, 2006, employercontributions were made in the form of EDS common stock, which participants could elect to transfer to another investment optionwithin the EDS 401(k) Plan after two years from the date of contribution. Participants were 40% vested in the employer-matchingcontributions after two years of service, vested another 20% per year of service thereafter, and were fully vested after five years of service. Beginning January 1, 2007, participants’ employer-matching contributions follow the investment allocation of their salarydeferrals. Participants are 40% vested after two years of service, and 100% vested after three years of service. Participants withmore than three but less than five years of service at January 1, 2007 were fully vested at that date. Participants with more than two but less than three years of service at January 1, 2007 will fully vest after three years of service. Participants hired after January 1, 2007 will fully vest after three years of service. During the years ended December 31, 2007, 2006 and 2005, employer-matchingcontributions totaled $41 million, $40 million and $37 million, respectively.
AR-54
NOTE 14: COMMITMENTS AND RENTAL EXPENSE
Total rentals under cancelable and non-cancelable leases of tangible property and equipment included in costs and charged toexpenses were $561 million, $557 million and $552 million for the years ended December 31, 2007, 2006 and 2005, respectively. Commitments for rental payments under non-cancelable operating leases of tangible property and equipment net of sublease rentalincome are: 2008 – $398 million; 2009 – $353 million; 2010 – $263 million; 2011 – $182 million; 2012 – $135 million; and all years thereafter – $260 million.
The Company has signed certain service agreements with terms of up to ten years with certain vendors to obtain favorable pricingand commercial terms for services that are necessary for the ongoing operation of its business. These agreements relate to softwareand telecommunications services. Under the terms of these agreements, the Company has committed to contractually specifiedminimums over the contractual periods. The contractual minimums are: 2008 – $1,099 million; 2009 – $393 million; 2010 – $166 million; 2011 – $48 million; 2012 – $1 million; and all years thereafter – $1 million. Amounts purchased under these agreements were $1,598 million, $1,452 million and $991 million during the years ended December 31, 2007, 2006 and 2005, respectively. To the extent that the Company does not purchase the contractual minimum amount of services, the Company must pay the vendors the shortfall. The Company believes that it will meet the contractual minimums through the normal course of business.
NOTE 15: CONTINGENCIES
In connection with certain service contracts, the Company may arrange a client supported financing transaction (“CSFT”) with a client and an independent third-party financial institution or its designee. Under CSFT arrangements, the financial institutionfinances the purchase of certain IT-related assets and simultaneously leases those assets for use in connection with the servicecontract.
In a CSFT, all client contract payments are made directly to the financial institution providing the financing. After thepredetermined monthly obligations to the financial institution are met, the remaining portion of the customer payment is madeavailable to the Company. If the client does not make the required payments under the service contract, under no circumstances does the Company have any obligation to acquire the underlying assets unless nonperformance under the service contract would permit its termination, or the Company fails to comply with certain customary terms under the financing agreements, including, forexample, covenants the Company has undertaken regarding the use of the assets for their intended purpose. The Companyconsiders the likelihood of its failure to comply with any of these terms to be remote. In the event of nonperformance underapplicable contracts which would permit their termination, the Company would have no additional or incremental performancerisk with respect to the ownership of the assets, because it would have owned or leased the same or substantially equivalent assetsin order to fulfill its obligations under its service contracts. Performance under the Company’s service contracts is generallymeasured by contract terms relating to project deadlines, IT system deliverables or level-of-effort measurements.
As of December 31, 2007, an aggregate of $76 million was outstanding under CSFTs yet to be paid by the Company’s clients. The Company believes it is in compliance with performance obligations under all service contracts for which there is a related CSFTand the ultimate liability, if any, incurred in connection with such financings will not have a material adverse affect on itsconsolidated results of operations or financial position.
In the normal course of business, the Company may provide certain clients, principally governmental entities, with financialperformance guarantees, which are generally backed by standby letters of credit or surety bonds. In general, the Company would only be liable for the amounts of these guarantees in the event that nonperformance by the Company permits termination of therelated contract by the Company’s client, which the Company believes is remote. At December 31, 2007, the Company had $568 million outstanding standby letters of credit and surety bonds relating to these performance guarantees. The Company believes it is in compliance with its performance obligations under all service contracts for which there is a financial performance guarantee,and the ultimate liability, if any, incurred in connection with these guarantees will not have a material adverse affect on itsconsolidated results of operations or financial position. In addition, the Company had $8 million of other financial guaranteesoutstanding at December 31, 2007 relating to indebtedness of others.
The Company has received tax assessments from various taxing authorities and is currently at varying stages of appeals regardingthese matters. The Company has provided for the amounts it believes will ultimately result from those proceedings. In January2008, the Company reached a final agreement with the Appeals Office of the Internal Revenue Service for all outstanding issues for the period 1999-2002 consistent with the Company’s tax reserves as of December 31, 2007.
AR-55
Pending Litigation and Proceedings
On December 19, 2003, Sky Subscribers Services Limited (“SSSL”) and British Sky Broadcasting Limited (“BSkyB”), a former client of the Company, served a draft pleading seeking redress for the Company’s alleged failure to perform pursuant to a contractbetween the parties. Under applicable legal procedures, the Company responded to the allegations. Despite the response, onAugust 17, 2004, SSSL and BSkyB issued and served upon the Company a pleading alleging the following damages, eachpresented as an alternative cause of action: (1) pre-contract deceit in 2000 in the amount of £320 million (approximately $635million); (2) pre-contract negligent misrepresentation in 2000 in the amount of £127 million (approximately $250 million); (3)deceit inducing the Letter of Agreement in July 2001 in the amount of £261 million (approximately $520 million); (4) negligent misrepresentation inducing the Letter of Agreement in July 2001 in the amount of £116 million (approximately $230 million); and(5) breach of contract from 2000 through 2002 in the amount of £101 million (approximately $200 million). On November 12,2004, the Company filed its defense and counterclaim denying the claims and seeking damages in the amount of £4.7 million (approximately $9.3 million). On December 21, 2005, SSSL and BSkyB filed a Re-Amended Particulars of Claim alleging thefollowing damages, still as alternative causes of action: (1) pre-contract deceit in the amount of £480 million (approximately $955million); (2) pre-contract negligent misrepresentation and negligent misstatement in the amount of £480 million (approximately$955 million); (3) deceit inducing the Letter of Agreement and negligent misrepresentation inducing the Letter of Agreement of £415 million (approximately $825 million); and (4) breach of contract in the amount of £179 million (approximately $355million). The principal stated reason for the increases in amount of damages was that the claimants had taken the opportunity to re-assess their alleged lost profits and increased costs to deliver the project in light of the extended timetable they then required to complete delivery of the project that was the subject of the contract. Claimants said then that they would further re-assess thesealleged losses prior to trial. In April 2007, the claimants served on EDS in draft further amendments to the Particulars of Claim,and the Court conditionally granted claimants request to amend. The claimants have increased the damages claim still further, asfollows: (1) pre-contract deceit, negligent misrepresentation and negligent misstatement in the sum of £711.4 million(approximately $1.4 billion); (2) deceit, negligent misrepresentation and negligent misstatement inducing the Letter of Agreementin the sum of £582.9 million (approximately $1.2 billion); and (3) breach of contract in the amount of £160.3 million(approximately $320 million). These heads of claim are still pleaded in the alternative. The principal stated reason for the increasesin the amount of damages is that the claimants say they have re-assessed their alleged losses in the light of expert witnessevidence. Weeks later, and immediately prior to a hearing on May 25, 2007, the claimants made further revisions to the quantum of their damages claims, as follows: (1) pre-contract deceit, negligent misrepresentation and negligent misstatement in the sum of £709.3 million (approximately $1.4 billion); (2) deceit, negligent misrepresentation and negligent misstatement inducing the Letterof Agreement in the sum of £523 million (approximately $1.0 billion); and (3) breach of contract remained unchanged in theamount of £160.3 million (approximately $320 million). These heads of claim are still pleaded in the alternative. The stated reasonfor the revisions of the damages claims in (1) and (2) above is that the claimants made arithmetical errors in the precedingamendments a few weeks earlier. A hearing was held on May 25, 2007 at which the court granted claimants leave to amend their pleaded case. BSkyB has since made further amendments to points of detail in the particulars of claim, however the pleadedquantum of the claim remains unchanged. The dispute surrounds a contract the Company entered into with BSkyB in November 2000, which was terminated by the Company in January 2003 for BSkyB’s failure to pay its invoices. The contract had an initialtotal contract value of approximately £48 million which rose to just over £60 million during the term of the contract. The Companyintends to defend against these allegations vigorously. The trial for this matter commenced in October 2007 and is scheduled tocontinue until the end of May 2008. Although there can be no assurance as to the outcome of this matter, the Company does not believe it will have a material adverse impact on its consolidated results or financial position.
There are other various claims and pending actions against the Company arising in the ordinary course of its business. Certain ofthese actions seek damages in significant amounts. The amount of the Company’s liability for such claims and pending actions atDecember 31, 2007 was not determinable. However, in the opinion of management, the ultimate liability, if any, resulting from such claims and pending actions will not have a material adverse affect on the Company’s consolidated results of operations or financial position.
NOTE 16: ACQUISITIONS
On November 30, 2007, the Company acquired a controlling interest (approximately 93%) in Saber Government Solutions, aprovider of software products and services to U.S. state and local governments. The cash purchase price of the interest acquired,net of cash acquired, was approximately $423 million. The consolidated statements of income include the results of the acquiredbusiness since the date of acquisition. The preliminary purchase price allocation is as follows: accounts receivable – $16 million;property and equipment – $3 million; deferred contract costs – $20 million; goodwill and other intangibles – $463 million;deferred income taxes – $34 million; accounts payable and accrued liabilities – $18 million; deferred revenue – $22 million andlong-term debt – $5 million. In connection with the acquisition, the Company recorded a pre-tax charge of $6 million related to the write-off of acquired in-process research and development (see Note 19). The preliminary purchase price allocation may changeupon completion of the valuations of acquired assets and assumed liabilities of the business. Factors contributing to a purchaseprice that resulted in recognition of goodwill included the domestic and international growth potential in the state and local areas
AR-56
of voter registration, election management, public retirement programs, human services, public health services, motor vehicleregistration and unemployment insurance, and an effective, assembled management team with an ability to successfully deploysoftware and services in such areas. Commencing November 30, 2010, and continuing annually thereafter, (i) the Company may require Saber’s minority shareholders to sell their minority interest to the Company, and (ii) if the Company has not exercised its right to acquire such minority interest, Saber’s minority shareholders may require the Company to purchase their minority interest,at a price based on fair value; provided that the minority interest will be acquired by the Company prior to November 30, 2010 upon the occurrence of certain events. Had the Company completed the acquisition as of the earliest date presented, results ofoperations on a pro forma basis would not have been materially different from actual results.
On June 26, 2007, the Company acquired RelQ Software Private Limited, a software testing company based in Bangalore, India. The cash purchase price of RelQ, net of cash acquired, was approximately $37 million. The acquisition of RelQ enhances theCompany’s global applications testing, validation and verification, and quality assurance services. The consolidated statements of income include the results of the acquired business since the date of acquisition. The preliminary purchase price allocation is asfollows: accounts receivable – $9 million; prepaids and other current assets – $1 million; property and equipment – $2 million;goodwill – $23 million; other intangibles – $9 million; and other liabilities – $7 million. The preliminary purchase price allocationmay change upon completion of the valuations of acquired assets and assumed liabilities of the business. Factors contributing to a purchase price that resulted in recognition of goodwill included projections of the operating results of the acquired business andthe ability to accelerate the Company’s growth in the applications services market. Had the Company completed the acquisition asof the earliest date presented, results of operations on a pro forma basis would not have been materially different from actualresults.
On June 20, 2006, the Company acquired a controlling interest (approximately 51%) in MphasiS Limited, an applications andbusiness process outsourcing services company based in Bangalore, India. The cash purchase price of the controlling interest, netof cash acquired, was $352 million. The acquisition of MphasiS enhances the Company’s capabilities in priority growth areas of applications development and business process outsourcing services. The consolidated statements of income include the results ofthe acquired business since the date of acquisition. The purchase price allocation is as follows: accounts receivable – $45 million;other current assets – $14 million; property and equipment – $27 million; goodwill – $352 million; other intangibles – $47 million;current liabilities – $34 million; deferred tax liabilities – $29 million and minority interest – $70 million. Factors contributing to a purchase price that resulted in recognition of goodwill included the Company’s and MphasiS management’s projections ofoperating results of the acquired business, and the ability to accelerate the Company’s growth in the applications and businessprocess outsourcing services markets. Had the Company completed the acquisition as of the earliest date presented, results ofoperations on a pro forma basis would not have been materially different from actual historical results. In July 2007, the Companycompleted the merger of its wholly owned Indian subsidiary into MphasiS which increased the Company’s ownership interest in MphasiS to approximately 61%, resulting in an increase in goodwill and other intangibles of approximately $10 million, minorityinterest of approximately $8 million, and a decrease in deferred income taxes of $2 million.
On May 19, 2005, the Company purchased the outstanding minority interest in its Australian subsidiary for a cash purchase priceof approximately $135 million. The transaction was accounted for as an acquisition by the Company, and the excess carrying valueof the minority interest liability over the purchase price paid was allocated as a reduction to property and equipment – $(19)million; deferred contract costs – $(2) million; and other intangible assets – $(3) million.
On March 1, 2005, the Company and Towers Perrin entered into a joint venture whereby Towers Perrin contributed cash and its pension, health and welfare administration services business and the Company contributed cash and its payroll and related humanresources (“HR”) outsourcing business to a new company, known as ExcellerateHRO LLP. Upon closing of the transaction,Towers Perrin received $417 million in cash and a 15% minority interest, representing total consideration paid by the Company toTowers Perrin, and the Company received an 85% interest in the new company. The acquisition enabled the Company to offer a comprehensive set of HR outsourcing solutions across the core areas of benefits, payroll, compensation management, workforce administration and relocation, recruitment and staffing, and workforce development. The consolidated statements of incomeinclude the results of the acquired business since the date of acquisition. The transaction was accounted for as an acquisition by the Company with the purchase price being allocated as follows: property and equipment – $19 million; other intangibles – $41million; goodwill – $423 million; other assets – $5 million; accrued expenses – $4 million; and minority interest – $67 million.Factors contributing to a purchase price that resulted in recognition of goodwill included the Company’s and its advisors’projections of operating results of the new company, the ability to accelerate the Company’s growth in the HR outsourcing marketand the competitive differentiation offered by the relationship with Towers Perrin. Towers Perrin may require the Company topurchase its minority interest in the joint venture at any time after March 1, 2010, or prior to that date upon the occurrence ofcertain events (including the breach by the Company of certain transaction related agreements, the failure of the joint venture to achieve certain financial results or certain events related to the Company), at a price based on the fair market value of such interest,with a minimum purchase price based on the joint venture’s annual revenue. In addition, the Company may require Towers Perrin to sell its minority interest in the joint venture to the Company at any time after March 1, 2012, or prior to that date upon theoccurrence of certain events (including the breach by Towers Perrin of certain transaction related agreements or certain events
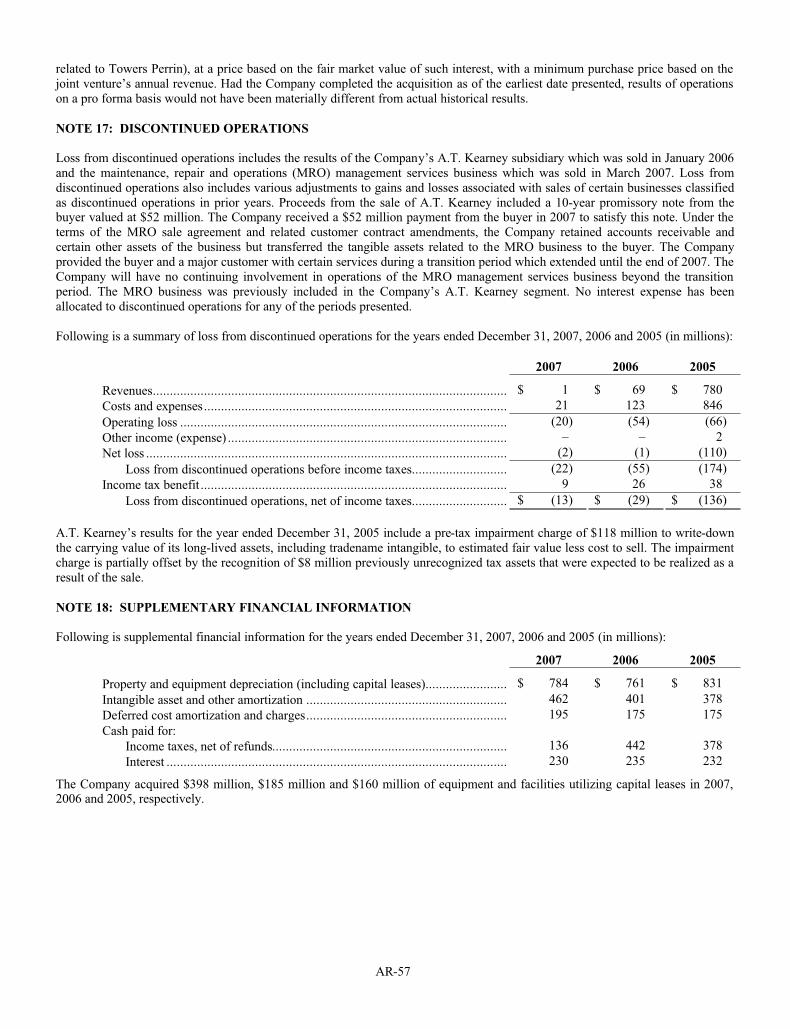
AR-57
related to Towers Perrin), at a price based on the fair market value of such interest, with a minimum purchase price based on thejoint venture’s annual revenue. Had the Company completed the acquisition as of the earliest date presented, results of operationson a pro forma basis would not have been materially different from actual historical results.
NOTE 17: DISCONTINUED OPERATIONS
Loss from discontinued operations includes the results of the Company’s A.T. Kearney subsidiary which was sold in January 2006 and the maintenance, repair and operations (MRO) management services business which was sold in March 2007. Loss fromdiscontinued operations also includes various adjustments to gains and losses associated with sales of certain businesses classifiedas discontinued operations in prior years. Proceeds from the sale of A.T. Kearney included a 10-year promissory note from thebuyer valued at $52 million. The Company received a $52 million payment from the buyer in 2007 to satisfy this note. Under the terms of the MRO sale agreement and related customer contract amendments, the Company retained accounts receivable andcertain other assets of the business but transferred the tangible assets related to the MRO business to the buyer. The Companyprovided the buyer and a major customer with certain services during a transition period which extended until the end of 2007. TheCompany will have no continuing involvement in operations of the MRO management services business beyond the transition period. The MRO business was previously included in the Company’s A.T. Kearney segment. No interest expense has beenallocated to discontinued operations for any of the periods presented.
Following is a summary of loss from discontinued operations for the years ended December 31, 2007, 2006 and 2005 (in millions):
2007 2006 2005
Revenues........................................................................................................ $ 1 $ 69 $ 780
Costs and expenses......................................................................................... 21 123 846
Operating loss ................................................................................................ (20) (54) (66)
Other income (expense) .................................................................................. – – 2
Net loss .......................................................................................................... (2) (1) (110)
Loss from discontinued operations before income taxes............................ (22) (55) (174)
Income tax benefit .......................................................................................... 9 26 38
Loss from discontinued operations, net of income taxes............................ $ (13) $ (29) $ (136)
A.T. Kearney’s results for the year ended December 31, 2005 include a pre-tax impairment charge of $118 million to write-downthe carrying value of its long-lived assets, including tradename intangible, to estimated fair value less cost to sell. The impairmentcharge is partially offset by the recognition of $8 million previously unrecognized tax assets that were expected to be realized as a result of the sale.
NOTE 18: SUPPLEMENTARY FINANCIAL INFORMATION
Following is supplemental financial information for the years ended December 31, 2007, 2006 and 2005 (in millions):
2007 2006 2005
Property and equipment depreciation (including capital leases)........................ $ 784 $ 761 $ 831
Intangible asset and other amortization ........................................................... 462 401 378
Deferred cost amortization and charges........................................................... 195 175 175
Cash paid for:
Income taxes, net of refunds..................................................................... 136 442 378
Interest .................................................................................................... 230 235 232
The Company acquired $398 million, $185 million and $160 million of equipment and facilities utilizing capital leases in 2007, 2006 and 2005, respectively.
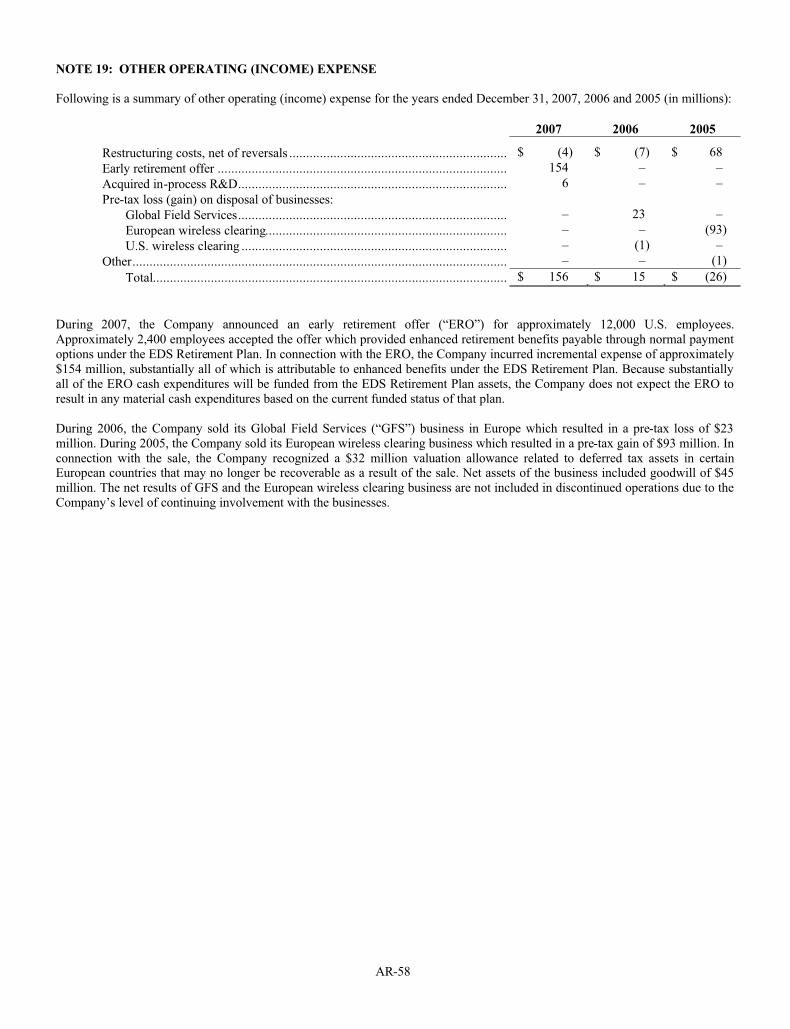
AR-58
NOTE 19: OTHER OPERATING (INCOME) EXPENSE
Following is a summary of other operating (income) expense for the years ended December 31, 2007, 2006 and 2005 (in millions):
2007 2006 2005
Restructuring costs, net of reversals ................................................................ $ (4) $ (7) $ 68
Early retirement offer ..................................................................................... 154 – –
Acquired in-process R&D............................................................................... 6 – –
Pre-tax loss (gain) on disposal of businesses:
Global Field Services............................................................................... – 23 –
European wireless clearing....................................................................... – – (93)
U.S. wireless clearing .............................................................................. – (1) –
Other.............................................................................................................. – – (1)
Total........................................................................................................ $ 156 $ 15 $ (26)
During 2007, the Company announced an early retirement offer (“ERO”) for approximately 12,000 U.S. employees.Approximately 2,400 employees accepted the offer which provided enhanced retirement benefits payable through normal payment options under the EDS Retirement Plan. In connection with the ERO, the Company incurred incremental expense of approximately $154 million, substantially all of which is attributable to enhanced benefits under the EDS Retirement Plan. Because substantiallyall of the ERO cash expenditures will be funded from the EDS Retirement Plan assets, the Company does not expect the ERO to result in any material cash expenditures based on the current funded status of that plan.
During 2006, the Company sold its Global Field Services (“GFS”) business in Europe which resulted in a pre-tax loss of $23 million. During 2005, the Company sold its European wireless clearing business which resulted in a pre-tax gain of $93 million. In connection with the sale, the Company recognized a $32 million valuation allowance related to deferred tax assets in certainEuropean countries that may no longer be recoverable as a result of the sale. Net assets of the business included goodwill of $45million. The net results of GFS and the European wireless clearing business are not included in discontinued operations due to theCompany’s level of continuing involvement with the businesses.
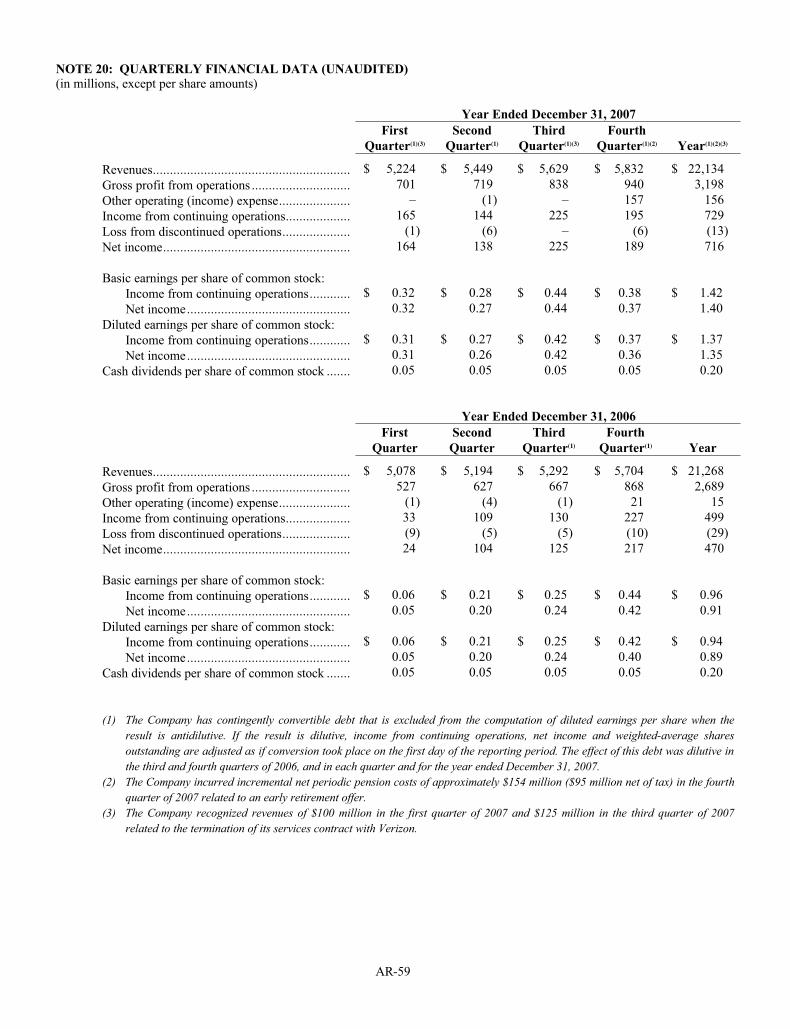
AR-59
NOTE 20: QUARTERLY FINANCIAL DATA (UNAUDITED)(in millions, except per share amounts)
Year Ended December 31, 2007
First
Quarter(1)(3)Second
Quarter(1)Third
Quarter(1)(3)Fourth
Quarter(1)(2) Year(1)(2)(3)
Revenues.......................................................... $ 5,224 $ 5,449 $ 5,629 $ 5,832 $ 22,134
Gross profit from operations ............................. 701 719 838 940 3,198
Other operating (income) expense..................... – (1) – 157 156
Income from continuing operations................... 165 144 225 195 729
Loss from discontinued operations.................... (1) (6) – (6) (13)
Net income....................................................... 164 138 225 189 716
Basic earnings per share of common stock:
Income from continuing operations............ $ 0.32 $ 0.28 $ 0.44 $ 0.38 $ 1.42
Net income................................................ 0.32 0.27 0.44 0.37 1.40
Diluted earnings per share of common stock:
Income from continuing operations............ $ 0.31 $ 0.27 $ 0.42 $ 0.37 $ 1.37
Net income................................................ 0.31 0.26 0.42 0.36 1.35
Cash dividends per share of common stock ....... 0.05 0.05 0.05 0.05 0.20
Year Ended December 31, 2006
First
Quarter
Second
Quarter
Third
Quarter(1)Fourth
Quarter(1) Year
Revenues.......................................................... $ 5,078 $ 5,194 $ 5,292 $ 5,704 $ 21,268
Gross profit from operations ............................. 527 627 667 868 2,689
Other operating (income) expense..................... (1) (4) (1) 21 15
Income from continuing operations................... 33 109 130 227 499
Loss from discontinued operations.................... (9) (5) (5) (10) (29)
Net income....................................................... 24 104 125 217 470
Basic earnings per share of common stock:
Income from continuing operations............ $ 0.06 $ 0.21 $ 0.25 $ 0.44 $ 0.96
Net income................................................ 0.05 0.20 0.24 0.42 0.91
Diluted earnings per share of common stock:
Income from continuing operations............ $ 0.06 $ 0.21 $ 0.25 $ 0.42 $ 0.94
Net income................................................ 0.05 0.20 0.24 0.40 0.89
Cash dividends per share of common stock ....... 0.05 0.05 0.05 0.05 0.20
(1) The Company has contingently convertible debt that is excluded from the computation of diluted earnings per share when theresult is antidilutive. If the result is dilutive, income from continuing operations, net income and weighted-average sharesoutstanding are adjusted as if conversion took place on the first day of the reporting period. The effect of this debt was dilutive in the third and fourth quarters of 2006, and in each quarter and for the year ended December 31, 2007.
(2) The Company incurred incremental net periodic pension costs of approximately $154 million ($95 million net of tax) in the fourthquarter of 2007 related to an early retirement offer.
(3) The Company recognized revenues of $100 million in the first quarter of 2007 and $125 million in the third quarter of 2007related to the termination of its services contract with Verizon.
AR-60
AR-61

AR-65
AR-62

About EDS
EDS (NYSE: EDS) is a leading global technology services company delivering business
solutions to its clients. EDS founded the information technology outsourcing industry
more than 45 years ago. Today, EDS delivers a broad portfolio of information
technology and business process outsourcing services to clients in the manufacturing,
fi nancial services, healthcare, communications, energy, transportation, and consumer and
retail industries and to governments around the world. Learn more at eds.com.
EDS and the EDS logo are registered trademarks of Electronic Data Systems Corporation. All other brand or product
names are trademarks or registered marks of their respective owners. EDS is an equal
opportunity employer and values the diversity of its people. Copyright © 2008 Electronic Data Systems Corporation. All
rights reserved. 03/2008 7GCJH8103
Printed entirely on recycled and recyclable paper.
Contact us
Corporate Headquarters
United States
5400 Legacy DrivePlano, Texas 75024
USA
1 800 566 9337
Regional Headquarters
Asia
36F, Shanghai Information Tower211 Century Avenue
PudongShanghai, SHAChina 200120
86 21 2891 2888
Australia & New Zealand
Level 1, The Bond30 Hickson Road
Millers PointNew South Wales 2000
Australia
612 8965 0500
Canada33 Yonge StreetToronto, Ontario
M5E 1G4 Canada
1 416 814 45001 800 814 9038
(in Canada only)
Europe, Middle East & Africa
2nd Floor Lansdowne House
Berkeley SquareLondon W1J 6ER
44 20 7569 5100
Latin AmericaEstrada Samuel Aizemberg, 1707
Tower C – 4th FloorSão Bernardo do Campo, SP
Brazil 09851-55055 11 4399 8875