impact of ev rollout on eu electricity system · impact of ev rollout on eu electricity system ....
TRANSCRIPT
Marko Aunedi Imperial College London
Green eMotion European Electromobility Conference Liepaja, Latvia, February 10th, 2015
Impact of EV rollout on EU electricity system

Page 2 Feb 2015 GeM European Electromobility Conference, Latvia
Key objectives
■Apply whole-systems approach to understand impact of EV rollout on:
■Generation system operation ■Generation system investment ■Transmission network investment ■Distribution network investment ■Carbon emissions
■Inform policy makers and provide evidence about the impact of different approaches to integration of electro-mobility across the electricity sector and the potential economic value of smart charging
Page 3 Feb 2015 GeM European Electromobility Conference, Latvia
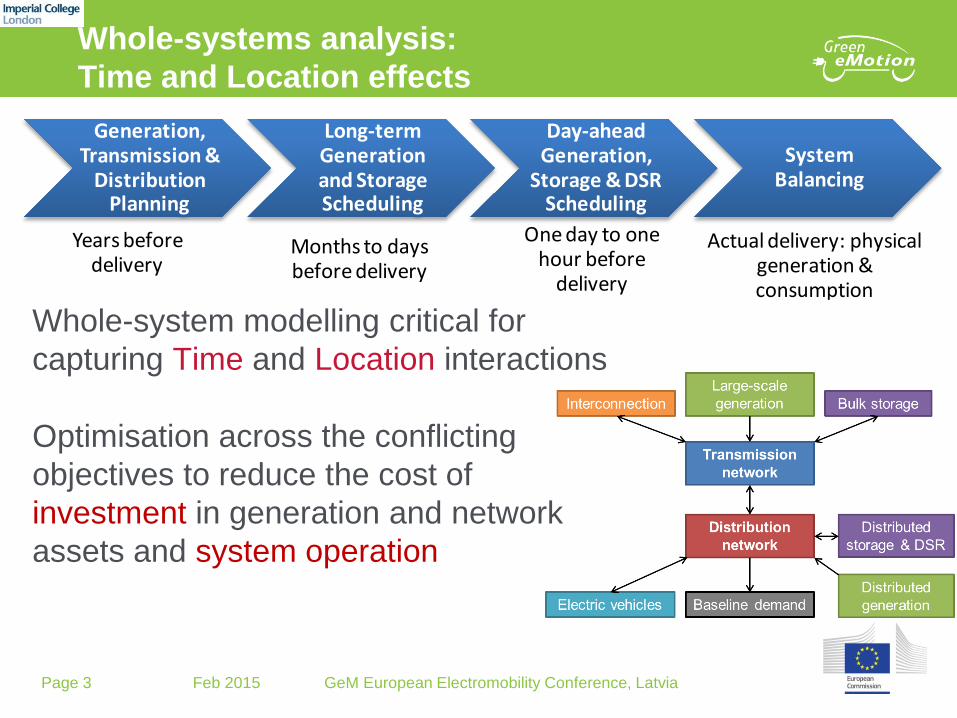
Whole-systems analysis: Time and Location effects
Generation, Transmission &
Distribution Planning
Long-term Generation and Storage Scheduling
Day-ahead Generation,
Storage & DSR Scheduling
System Balancing
Actual delivery: physical generation & consumption
One day to one hour before
delivery
Months to days before delivery
Years before delivery
Adequacy Reserve & ResponseArbitrage
Whole-system modelling critical for capturing Time and Location interactions
Optimisation across the conflicting objectives to reduce the cost of investment in generation and network assets and system operation

Page 4 Feb 2015 GeM European Electromobility Conference, Latvia
Modelling framework for assessing the impact of EV deployment
EU Generation, Transmission and
Distribution Investment and Operation Model
Future development scenarios: - EV penetration & characteristics - Electricity system evolution (RES) - Market integration of European systems
EU Grid Model: Transmission +
Distribution
• Adequate system capacity (generation and transmission) • RES curtailment & Carbon emissions • Overall investment and operation cost • Benefits of smart EV charging → Value of different
charging strategies
Key results
EU-wide impact of mass rollout of EVs

Page 5 Feb 2015 GeM European Electromobility Conference, Latvia
Impact of EVs on local distribution networks ■ ITRES tool
■ Developed in Green eMotion (to be published on project website) ■ Designed to quantify the impact of EV uptake on reinforcements in LV
distribution networks ■ Example: cumulative reinforcement cost with different EV charging
strategies Smart Non-smart
Dis
trib
utio
n ne
twor
k re
info
rcem
ent c
ost
Year
UG-I UG-V OH-I OH-V GMT
Dis
trib
utio
n ne
twor
k re
info
rcem
ent c
ost
Year
UG-I UG-V OH-I OH-V GMT
Page 6 Feb 2015 GeM European Electromobility Conference, Latvia
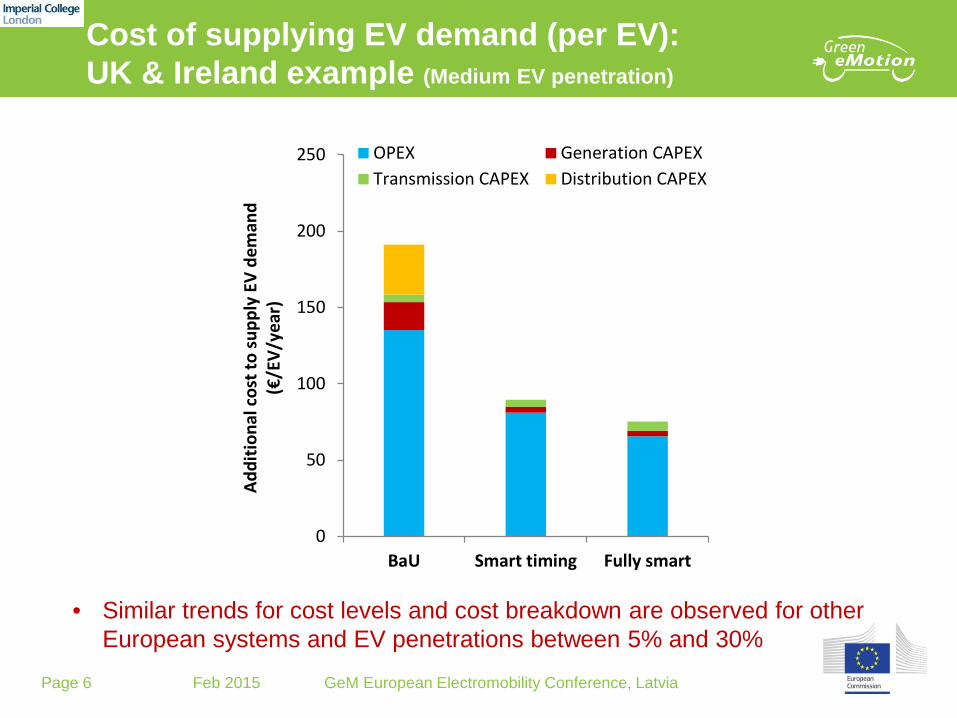
Cost of supplying EV demand (per EV): UK & Ireland example (Medium EV penetration)
• Similar trends for cost levels and cost breakdown are observed for other European systems and EV penetrations between 5% and 30%
0
50
100
150
200
250
BaU Smart timing Fully smart
Addi
tiona
l cos
t to
supp
ly E
V de
man
d (€
/EV/
year
)
OPEX Generation CAPEXTransmission CAPEX Distribution CAPEX

Page 7 Feb 2015 GeM European Electromobility Conference, Latvia
Utilisation of RES and carbon emissions with smart EV management (Medium EV penetration)
-10
0
10
20
30
40
BaU Smart sched. Fully smartCa
rbon
em
issi
ons f
rom
supp
lyin
g EV
s (gC
O2/
km)
DE-DK
Italy
UK-RI
Spain
92%
94%
96%
98%
100%
(No EV) BaU Smart timingFully smart
Util
ised
RES
out
put
Spain
UK-RI
Italy
DE-DK
Comparison with emissions from conventional passenger vehicles (EU): • Current emission factor (2013): 127 g/km • Target fleet average for 2021: 95 g/km
Page 8 Feb 2015 GeM European Electromobility Conference, Latvia
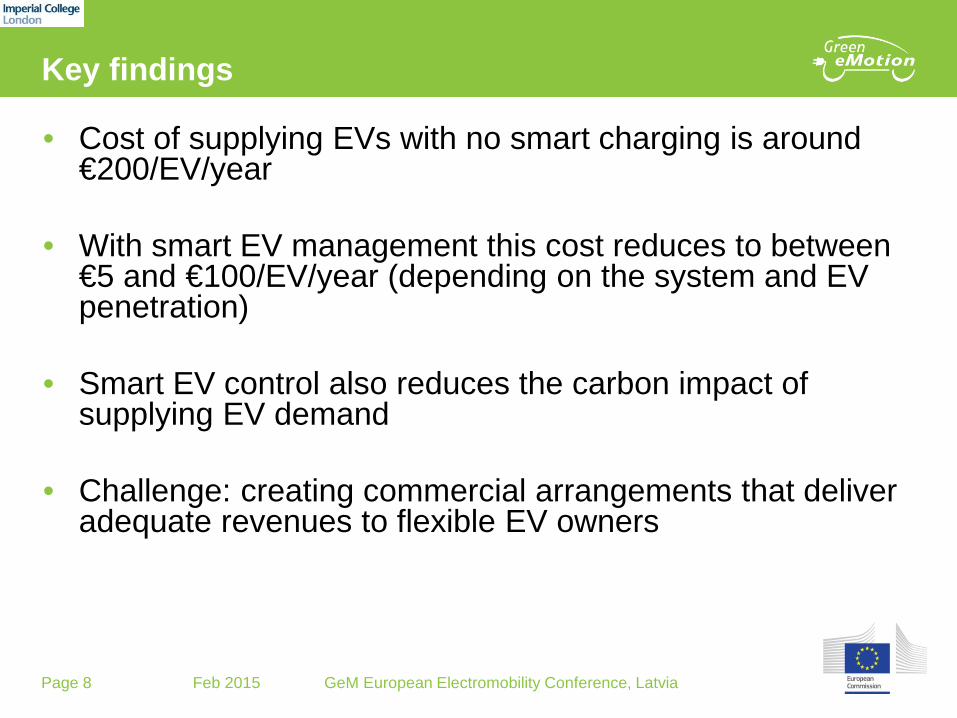
Key findings
• Cost of supplying EVs with no smart charging is around €200/EV/year
• With smart EV management this cost reduces to between €5 and €100/EV/year (depending on the system and EV penetration)
• Smart EV control also reduces the carbon impact of supplying EV demand
• Challenge: creating commercial arrangements that deliver adequate revenues to flexible EV owners
Imperial College London Marko Aunedi, Predrag Djapic, David Newbery, Dimitrios
Papadaskalopoulos, Goran Strbac
Green eMotion European Electromobility Conference Liepaja, Latvia, February 10th, 2015
Impact of EV rollout on EU electricity system
Deliverable 9.2 www.greenemotion-project.eu

GeM data analysis and user acceptance Electromobility Conference and Exhibition: Preparing an effective electromobility system for Europe
Patrick Morrissey (TCD), Margaret O’Mahony (TCD)
Green eMotion External Stakeholder Forum Liepaja, Latvia, 10th February 2015

Page 11 February 2015
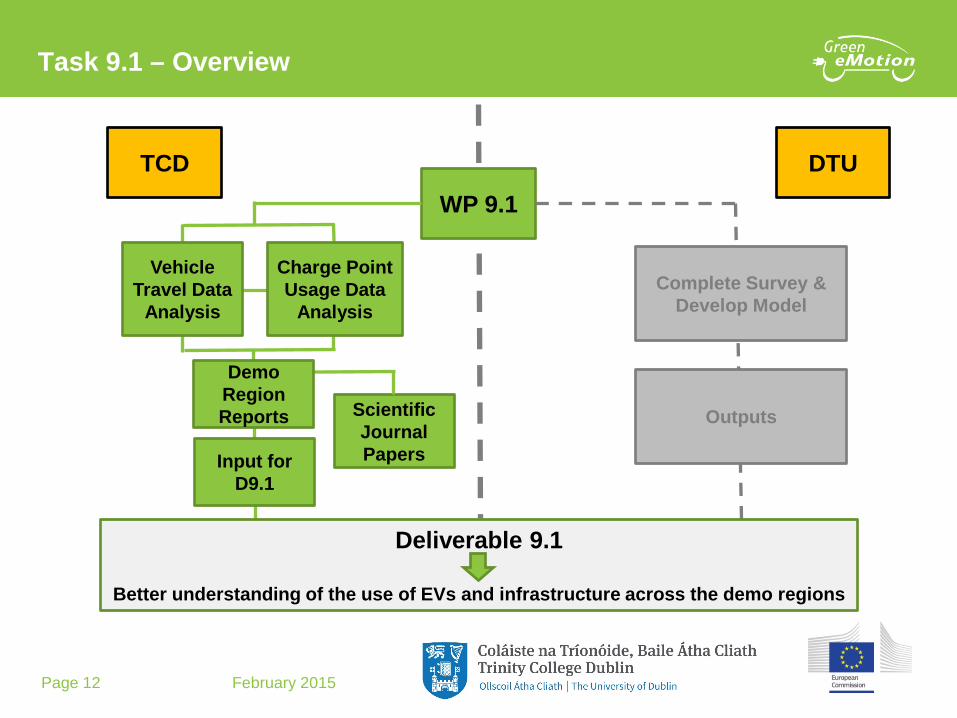
Task 9.1 – Overview
• Data Collection – IREC receive data from each of the GeM demo regions and distribute to the relevant partners
• Data Analysis – TCD perform analyses of the data: • GeM fleet considered as a whole to determine common trends • Individual regions analysed separately to understand local influences
and behaviour • Dissemination – Output of the analysis are disseminated by three means:
• Technical reports prepared for each of the demo regions • Deliverable 9.1 and also provide input for policy in further deliverables • Scientific journal papers
DoW: “…monitor and evaluate the aspects related to potential buyers’ driving behaviour, consumer acceptance and social impact of using electric vehicles, and the customers’ willingness to accept that battery charging is managed in an intelligent way…….driving behaviour data collected using GPS data logging from the vehicles”
Page 12 February 2015
Task 9.1 – Overview
Charge Point Usage Data
Analysis
Vehicle Travel Data
Analysis
Deliverable 9.1
Better understanding of the use of EVs and infrastructure across the demo regions
WP 9.1
Complete Survey & Develop Model
TCD DTU
Demo Region Reports
Input for D9.1
Scientific Journal Papers
Outputs

Page 13 February 2015
Data Analysis
Demo Region Household Office
Parking Public Access
Parking Street Other Total
DE1 - 51 5 200 37 293 DE2 - 42 - 48 - 90 DK3 - 6 - - 694 700 ES1 11 23 16 170 - 220 ES2 - 7 5 - - 12 FR1 43 52 9 4 - 108 IE1 16 - - 199 38 253 IT1 63 142 - 358 - 563
SW1 - - 10 - - 10 Total 2249
Charging Infrastructure
• Static Data - details on specific infrastructure • Dynamic Data – how the asset is used over time
• 4 specific use cases
• 124,363 dynamic charging registers returned and analysed • Time of use, usage duration and energy consumed considered
Page 14 February 2015
Data Analysis
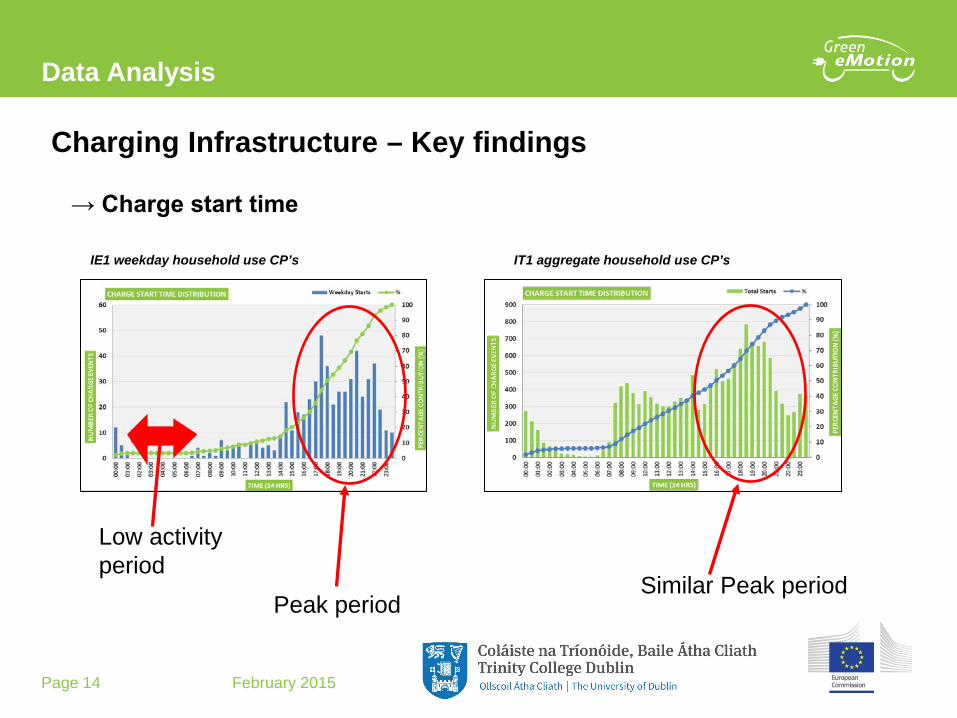
Charging Infrastructure – Key findings
→ Charge start time
Peak period Similar Peak period
IE1 weekday household use CP’s IT1 aggregate household use CP’s
Low activity period
Page 15 February 2015
Data Analysis
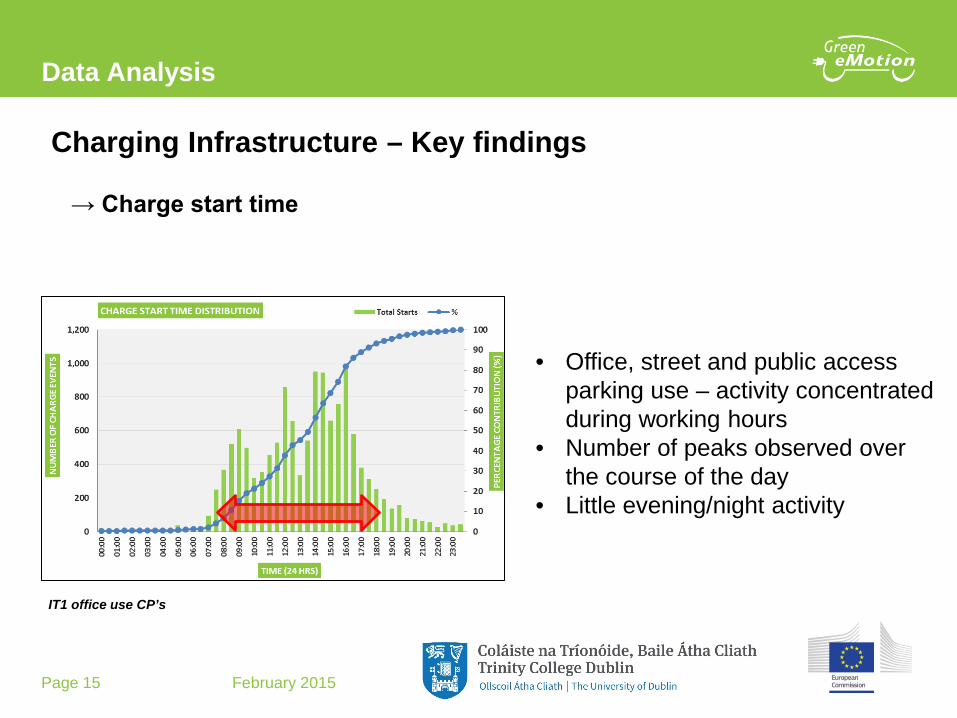
Charging Infrastructure – Key findings
→ Charge start time
IT1 office use CP’s
• Office, street and public access parking use – activity concentrated during working hours
• Number of peaks observed over the course of the day
• Little evening/night activity

Page 16 February 2015
Data Analysis
Charging Infrastructure – Key findings → Charge duration → Charge energy consumption
Demo region Category Total Weekday Weekend
DK3 Number of Events 40957 33882 7075 Mean (hrs) 3.2 3.2 3.2 Mins/Charging event 190.8 190.1 194.3
ES1 Number of Events 12224 10573 1651 Mean (hrs) 2.3 2.3 2.2 Mins/Charging event 137.2 138.0 132.0
FR1 Number of Events 23888 20825 3063 Mean (hrs) 1.3 1.3 1.3 Mins/Charging event 79.1 79.6 76.2
IE1 Number of Events 5779 4339 1440 Mean (hrs) 3.2 3.3 3.0 Mins/Charging event 193.4 198.7 177.7
IT1 Number of Events 41515 35770 5745 Mean (hrs) 3.8 3.9 3.5 Mins/Charging event 230.1 232.9 212.2
DK3 – aggregate use CP’s
Region N 1 (kWh)
2 (kWh)
3 (kWh)
4 (kWh)
5 (kWh)
FR1: France – Strasbourg 23376 2.5 ES1: Spain - Barcelona/Malaga 12224 4.8 IE1: Ireland 5779 6.5 DK3: Denmark - Better Place 40957 6.9 IT1: Italy 41515 7.7

Page 17 February 2015
Main Outcomes and recommendations
• Low levels of night time charging observed • High demand for charging in evening periods (17:00 – 21:30) • Charge consumption per event low relative to battery capacity (2 – 9 kWh) • Significant demand for office and household charging • Concentration of short charge durations (<240 mins) • Longer charge durations at office locations
Summary of main findings – charging infrastructure
General recommendations – charging infrastructure • Prioritise provision of charging infrastructure in office and home locations to
promote mass roll-out (street and public access locations lower priority) • Introduce smart energy management and reduced electricity tariffs at night • Provide more information to users about real-time battery state of charge to
reduce tendency for habitual charging
Page 18 February 2015
Data Analysis
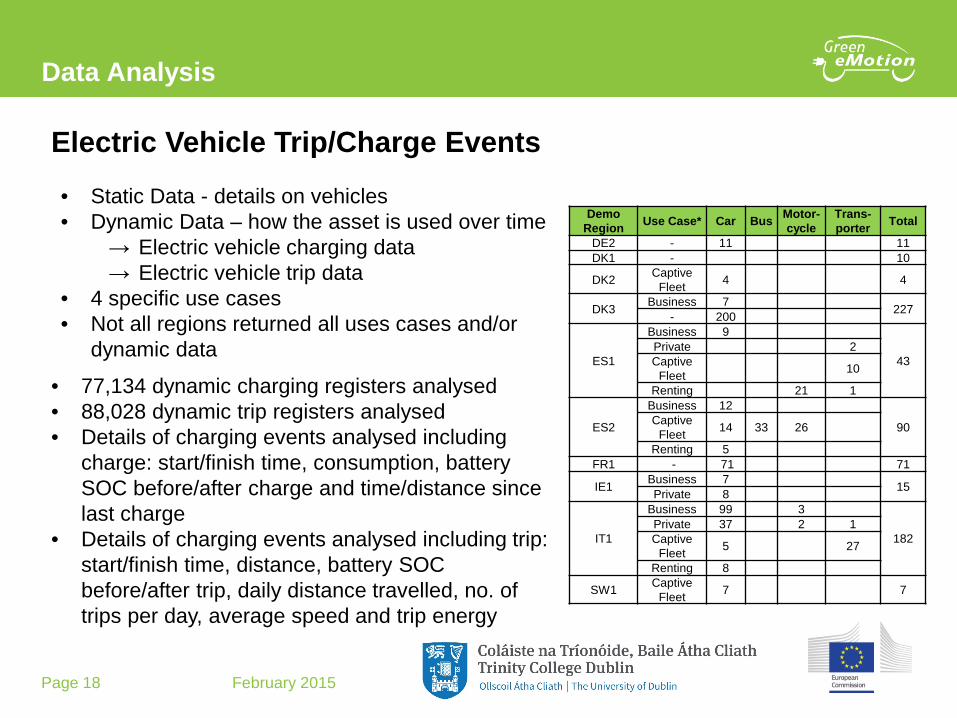
Electric Vehicle Trip/Charge Events
• Static Data - details on vehicles • Dynamic Data – how the asset is used over time
→ Electric vehicle charging data → Electric vehicle trip data
• 4 specific use cases • Not all regions returned all uses cases and/or
dynamic data
• 77,134 dynamic charging registers analysed • 88,028 dynamic trip registers analysed • Details of charging events analysed including
charge: start/finish time, consumption, battery SOC before/after charge and time/distance since last charge
• Details of charging events analysed including trip: start/finish time, distance, battery SOC before/after trip, daily distance travelled, no. of trips per day, average speed and trip energy
Demo Region Use Case* Car Bus Motor-
cycle Trans-porter Total
DE2 - 11 11 DK1 - 10
DK2 Captive Fleet 4 4
DK3 Business 7 227 - 200
ES1
Business 9
43 Private 2 Captive
Fleet 10
Renting 21 1
ES2
Business 12
90 Captive Fleet 14 33 26
Renting 5 FR1 - 71 71
IE1 Business 7 15 Private 8
IT1
Business 99 3
182 Private 37 2 1 Captive
Fleet 5 27
Renting 8
SW1 Captive Fleet 7 7

Page 19 February 2015
Data Analysis
EV charging events – Key findings → Charge start/finish
• Large peak in charging activity in the early evening observed for private vehicle users
• Significant levels of charging event starts early in the morning (~8am) for business vehicles
• Large variations in business vehicle charging patterns later in the day
• Large variations in charging patterns by captive fleet vehicles
• Charging patterns at weekends were more sporadic and generally lower numbers of charging events were evident
• Little night charging activity observed
IT1 Private use vehicle charge start time distribution
Page 20 February 2015
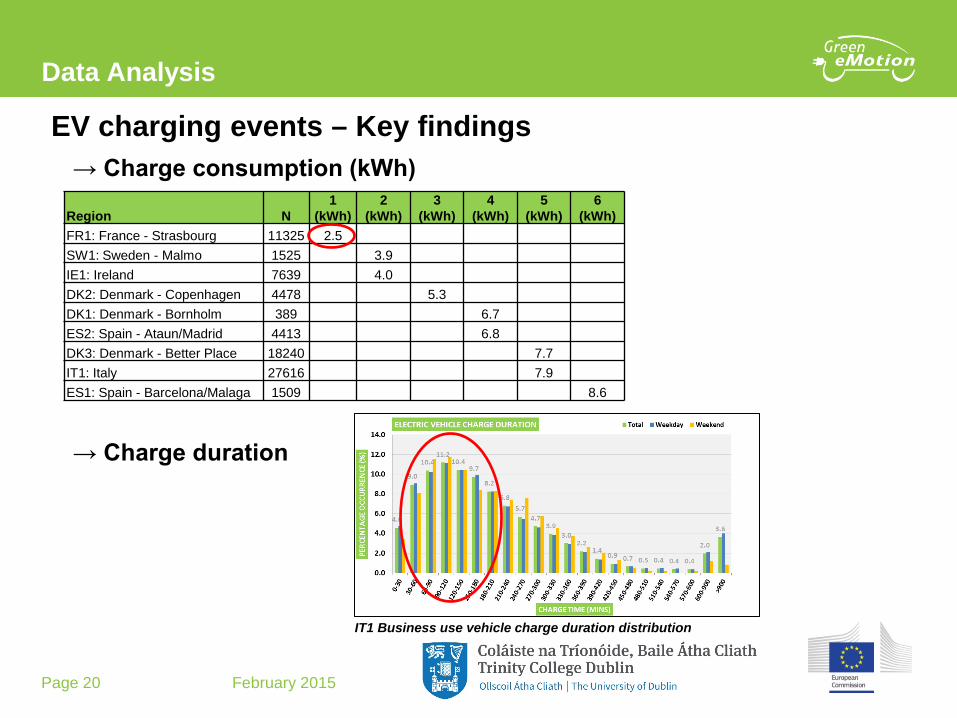
Data Analysis
EV charging events – Key findings → Charge consumption (kWh)
Region N 1
(kWh) 2
(kWh) 3
(kWh) 4
(kWh) 5
(kWh) 6
(kWh) FR1: France - Strasbourg 11325 2.5 SW1: Sweden - Malmo 1525 3.9 IE1: Ireland 7639 4.0 DK2: Denmark - Copenhagen 4478 5.3 DK1: Denmark - Bornholm 389 6.7 ES2: Spain - Ataun/Madrid 4413 6.8 DK3: Denmark - Better Place 18240 7.7 IT1: Italy 27616 7.9 ES1: Spain - Barcelona/Malaga 1509 8.6
→ Charge duration
IT1 Business use vehicle charge duration distribution

Page 21 February 2015
Data Analysis
Demo Region
Category Total Weekday Weekend
DK1 Number of Events 389 294 95 Mean (%) 54 52 59
DK2 Number of Events 4478 3399 1079 Mean (%) 62 63 58
DK3 Number of Events 17992 14509 3483 Mean (%) 58 58 61
ES1 Number of Events 1464 1076 388 Mean (%) 64 65 63
ES2 Number of Events 4409 3958 451 Mean (%) 68 69 60
IE1 Number of Events 7639 6209 1430 Mean (%) 59 59 56
SW1 Number of Events 1392 1385 7 Mean (%) 71 71 57
EV charging events – Key findings → State of Charge before/after charge event
DK2 captive fleet vehicle SOC before charge event distribution
DK3 Aggregate vehicle SOC after charge event distribution

Page 22 February 2015
Data Analysis EV charging events – Key findings
Distance since last charge event
Region Use Case N 1 (km)
2 (km)
3 (km)
4 (km)
5 (km)
SW1: Sweden - Malmo Captive Fleet 1431 17.1 ES1: Spain - Barcelona/Malaga Captive Fleet 822 17.5 DK2: Denmark - Copenhagen Captive Fleet 2555 21.0 ES2: Spain - Ataun/Madrid Business 2092 23.3 IE1: Ireland Private 1860 32.4 IE1: Ireland Business 2648 34.9 34.9 ES1: Spain - Barcelona/Malaga Private 100 39.9 39.9 DK3: Denmark - Better Place Aggregate (n/a) 18174 44.1 ES1: Spain - Barcelona/Malaga Business 172 44.2 ES2: Spain - Ataun/Madrid Renting 1345 51.5
Time since last charge event
Region Use Case N 1 (hrs)
2 (hrs)
3 (hrs)
4 (hrs)
5 (hrs)
ES1: Spain - Barcelona/Malaga Private 11 0.10 SW1: Sweden - Malmo Captive Fleet 1449 6.01 6.01 DK2: Denmark - Copenhagen Captive Fleet 2487 10.60 10.60 10.60 ES2: Spain - Ataun/Madrid Renting 1864 12.34 12.34 12.34 ES1: Spain - Barcelona/Malaga Business 183 12.84 12.84 12.84 DK3: Denmark - Better Place Aggregate (n/a) 17621 17.67 17.67 IE1: Ireland Business 3893 18.31 18.31 IE1: Ireland Private 2704 19.58 19.58 ES1: Spain - Barcelona/Malaga Captive Fleet 822 24.00 24.00 IT1: Italy Private 3442 34.02 34.02 IT1: Italy Business 16271 36.62 36.62 ES2: Spain - Ataun/Madrid Business 2207 42.03 IT1: Italy Captive Fleet 3831 42.57 IT1: Italy Renting 210 47.61

Page 23 February 2015
Data Analysis
EV trip events – Key findings
• Trip activity found to be similar to ICEV patterns – dependent on vehicle use • Private use vehicles follow typical commuting patterns • Business and captive fleet vehicles recorded trips throughout the day • Renting use vehicles have higher variance of use
→ Trip start/finish time
IE1 Private use vehicle journey start time distribution
Page 24 February 2015
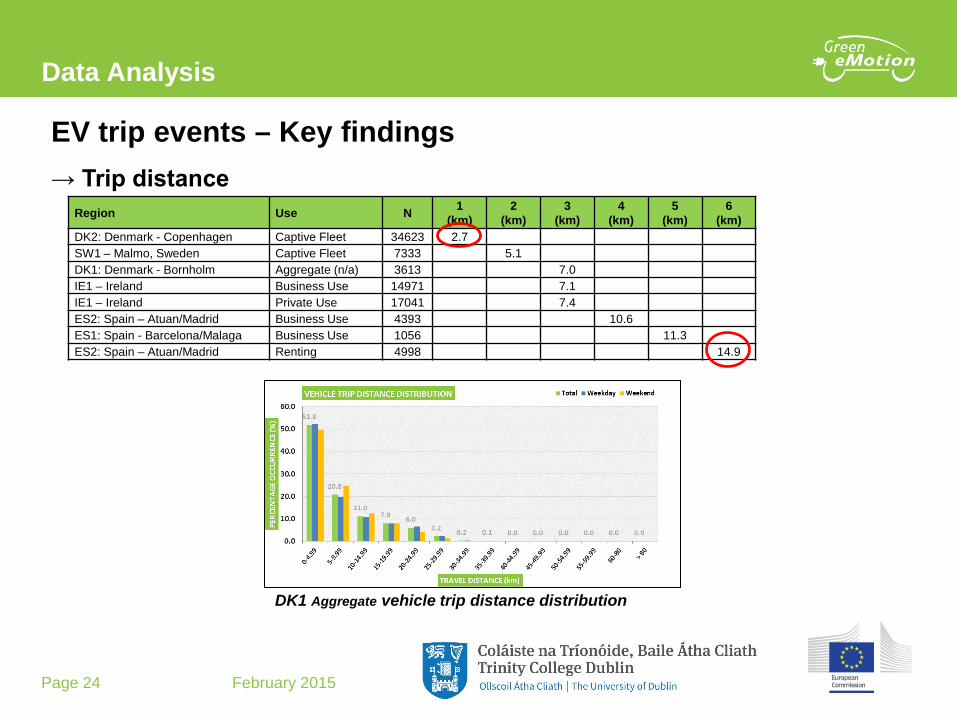
Data Analysis
Region Use N 1 (km)
2 (km)
3 (km)
4 (km)
5 (km)
6 (km)
DK2: Denmark - Copenhagen Captive Fleet 34623 2.7 SW1 – Malmo, Sweden Captive Fleet 7333 5.1 DK1: Denmark - Bornholm Aggregate (n/a) 3613 7.0 IE1 – Ireland Business Use 14971 7.1 IE1 – Ireland Private Use 17041 7.4 ES2: Spain – Atuan/Madrid Business Use 4393 10.6 ES1: Spain - Barcelona/Malaga Business Use 1056 11.3 ES2: Spain – Atuan/Madrid Renting 4998 14.9
EV trip events – Key findings → Trip distance
DK1 Aggregate vehicle trip distance distribution
Page 25 February 2015
Data Analysis
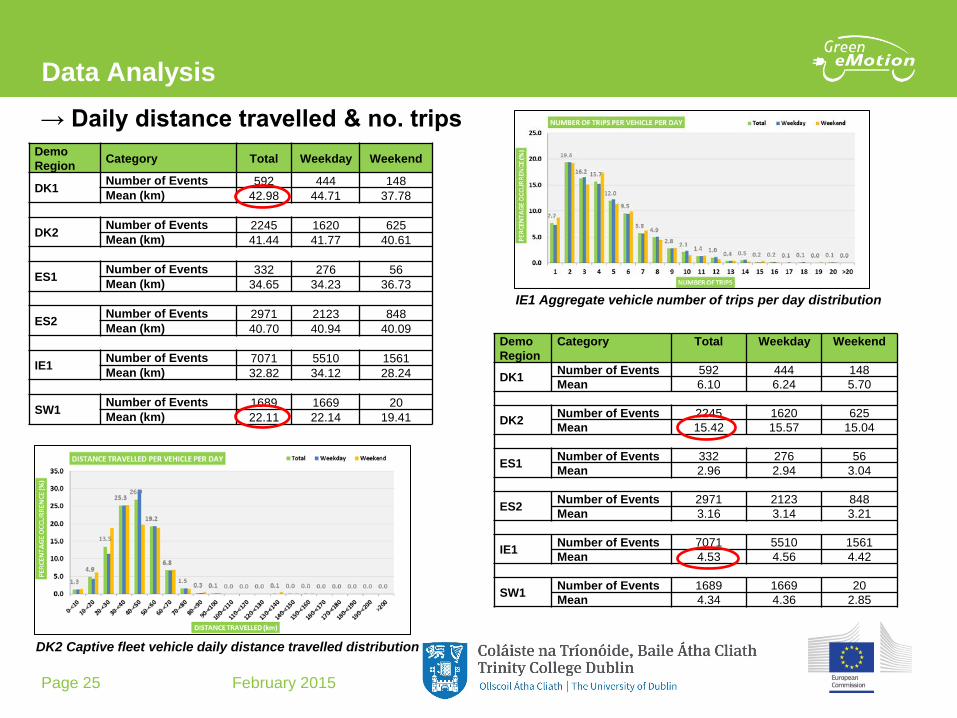
Demo Region Category Total Weekday Weekend
DK1 Number of Events 592 444 148 Mean (km) 42.98 44.71 37.78
DK2 Number of Events 2245 1620 625 Mean (km) 41.44 41.77 40.61
ES1 Number of Events 332 276 56 Mean (km) 34.65 34.23 36.73
ES2 Number of Events 2971 2123 848 Mean (km) 40.70 40.94 40.09
IE1 Number of Events 7071 5510 1561 Mean (km) 32.82 34.12 28.24
SW1 Number of Events 1689 1669 20 Mean (km) 22.11 22.14 19.41
→ Daily distance travelled & no. trips
Demo Region
Category Total Weekday Weekend
DK1 Number of Events 592 444 148 Mean 6.10 6.24 5.70
DK2 Number of Events 2245 1620 625 Mean 15.42 15.57 15.04
ES1 Number of Events 332 276 56 Mean 2.96 2.94 3.04
ES2 Number of Events 2971 2123 848 Mean 3.16 3.14 3.21
IE1 Number of Events 7071 5510 1561 Mean 4.53 4.56 4.42
SW1 Number of Events 1689 1669 20 Mean 4.34 4.36 2.85
DK2 Captive fleet vehicle daily distance travelled distribution
IE1 Aggregate vehicle number of trips per day distribution
Page 26 February 2015
Data Analysis
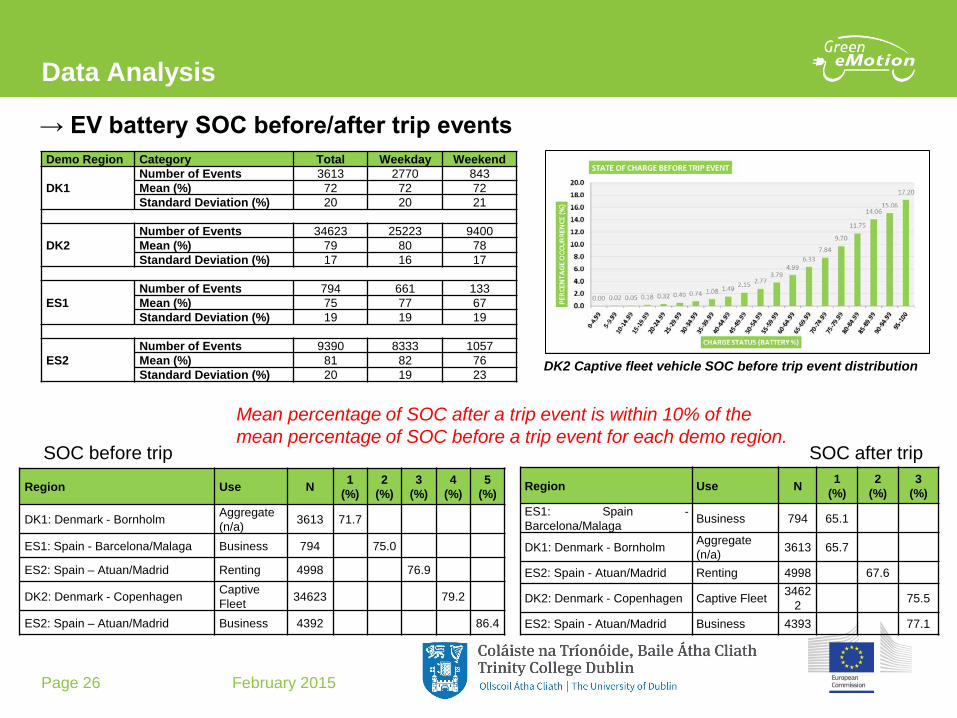
Demo Region Category Total Weekday Weekend
DK1 Number of Events 3613 2770 843 Mean (%) 72 72 72 Standard Deviation (%) 20 20 21
DK2 Number of Events 34623 25223 9400 Mean (%) 79 80 78 Standard Deviation (%) 17 16 17
ES1 Number of Events 794 661 133 Mean (%) 75 77 67 Standard Deviation (%) 19 19 19
ES2 Number of Events 9390 8333 1057 Mean (%) 81 82 76 Standard Deviation (%) 20 19 23
DK2 Captive fleet vehicle SOC before trip event distribution
→ EV battery SOC before/after trip events
Region Use N 1 (%)
2 (%)
3 (%)
ES1: Spain - Barcelona/Malaga Business 794 65.1
DK1: Denmark - Bornholm Aggregate (n/a) 3613 65.7
ES2: Spain - Atuan/Madrid Renting 4998 67.6
DK2: Denmark - Copenhagen Captive Fleet 34622 75.5
ES2: Spain - Atuan/Madrid Business 4393 77.1
Mean percentage of SOC after a trip event is within 10% of the mean percentage of SOC before a trip event for each demo region.
Region Use N 1 (%)
2 (%)
3 (%)
4 (%)
5 (%)
DK1: Denmark - Bornholm Aggregate (n/a) 3613 71.7
ES1: Spain - Barcelona/Malaga Business 794 75.0
ES2: Spain – Atuan/Madrid Renting 4998 76.9
DK2: Denmark - Copenhagen Captive Fleet 34623 79.2
ES2: Spain – Atuan/Madrid Business 4392 86.4
SOC after trip SOC before trip
Page 27 February 2015
Data Analysis
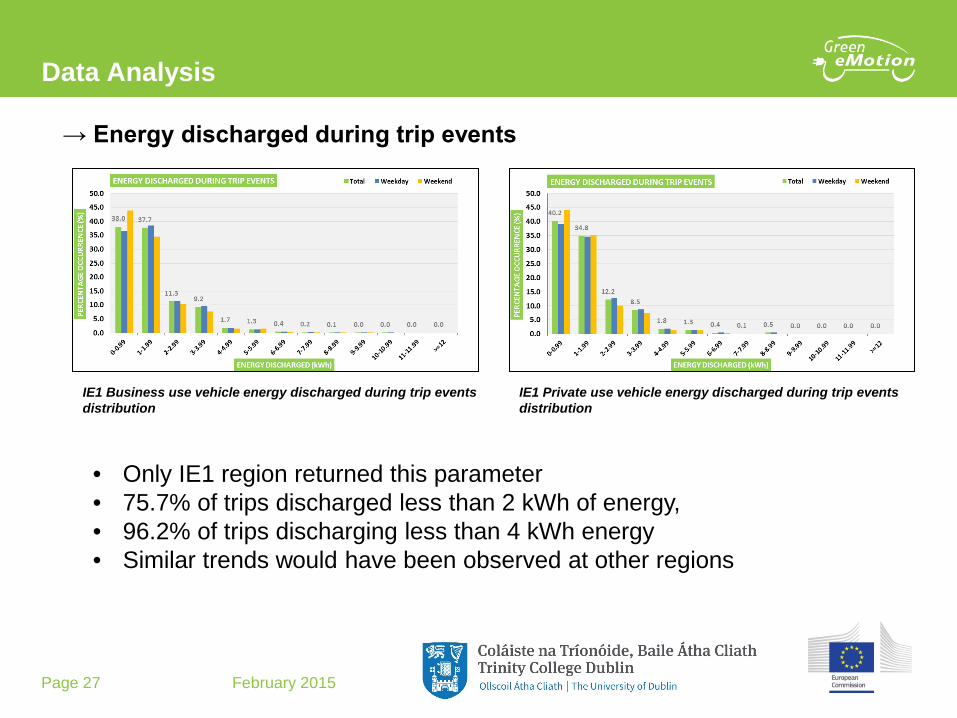
IE1 Business use vehicle energy discharged during trip events distribution
IE1 Private use vehicle energy discharged during trip events distribution
→ Energy discharged during trip events
• Only IE1 region returned this parameter • 75.7% of trips discharged less than 2 kWh of energy, • 96.2% of trips discharging less than 4 kWh energy • Similar trends would have been observed at other regions

Page 28 February 2015
Data Analysis
Region Use N 1 (km/h)
2 (km/h)
3 (km/h)
4 (km/h)
5 (km/h)
6 (km/h)
DK2: Denmark - Copenhagen Captive Fleet 34623 22.9 SW1: Sweden - Malmo Business 7333 23.4 ES2: Spain – Atuan/Madrid Business 4393 23.6 IE1: Ireland Business 14971 26.3 IE1: Ireland Private 17041 29.9 ES1: Spain - Barcelona/Malaga Business 1056 30.7 DK1: Denmark - Bornholm Aggregate (n/a) 3613 44.9 ES2: Spain – Atuan/Madrid Renting 4998 49.0
→ Vehicle average speeds
• Comparable to ICEV’s • Urban driving conditions will generally reduce average
speeds • Maximum speeds achieved ranged between 65 – 147 km/h

Page 29 February 2015
Main Outcomes and recommendations
Summary of main findings – EV charging behaviour • Significant levels of charging event starts early in the morning (~8am)
particularly for business vehicles • Large variations in business vehicle charging patterns later in the day • Peak in charging activity in the early evening observed for private vehicle users • Large variations in charging patterns by captive fleet vehicles • Charging patterns at weekends were more sporadic and generally lower
numbers of charging events were evident • Significant preference for low consumption charge events • Average SOC before charge event not less than 50% • Distance covered since last charge event significantly lower than the range of
the battery • Captive fleet vehicles travelled less since last charge event compared with other
use cases • Average time since last charge event less than 24 hours • Peak occurs at charge durations in the 90-120 min range • Charge duration distributions influenced by battery capacity of vehicles
Page 30 February 2015
Main Outcomes and recommendations
General recommendations – EV charging behaviour
• Increasing the length of trips undertaken by users and reducing their tendency to charge frequently would increase charge consumption values.
• Provision of information to users could change user behaviour in this area. e.g. provision of real-time information on locations of charging facilities could assist in making longer trips.
• Introduce electricity tariff incentisation to promote lower frequency charging
• Provide more fast charging facilities to encourage users to increase their normal driving range. Increasing battery range over time will lead to confidence in their vehicles' abilities

Page 31 February 2015
Main Outcomes and recommendations
Summary of main findings – EV travel behaviour • High level of trip activity throughout the working day with peaks evident during morning and
evening commutes for private use vehicles. More sustained trip activity periods throughout the day in demo regions where vehicles are used by municipalities and for business use.
• A large proportion of trips were in the short distance range, 73% <10km, 92% <20km. These distances are not specific to EV vehicles and are comparable with average ICEV trip distances estimated in travel surveys across Europe.
• Maximum trip distances ranged from 48 - 129km. • Captive fleet vehicles tended to make shorter journeys with business use and rental
vehicles making longer trips • Average daily distances were well within the battery range. • The average daily distance travelled is somewhat lower than that reported for ICEVs in
national surveys. • Number of trips per vehicle per day in the range 2-6 trips. • High proportion of trips begin with a large SOC in the vehicle battery • Majority of trips end with >65% on average SOC remaining in battery • High proportion of trips consume low amount of energy compared to the vehicles battery • Measured average speeds range between 22 and 46 km/hr – comparable to ICEV values
Page 32 February 2015
Main Outcomes and recommendations
• EV’s found to generally perform the same commuting and business type functions as comparable ICEVs.
• As previously stated the provision of more fast charging facilities which will encourage users to increase their normal driving range.
• EVs have significantly higher capability in terms of trip distance than exploited by the average activity of the different use cases examined here – evidence of range anxiety. Need to increase user confidence in their vehicles
• Benefits of additional EV trips will only accrue if these trips replace ICEV trips as opposed to increasing the absolute number of trips made on the network.
General recommendations – EV charging behaviour

Thank you for your attention.