implementation evaluation on pulse coding …...automatic generated time/msec s 1.01 2 1.01 6 1.01...
TRANSCRIPT
Yi-Fei Sun, Yasunori Kobori, Haruo Kobayashi
Gunma University
Kobayashi Laboratory
Mar. 4 ETG-19-14 10:30-10:45
Implementation Evaluation on Pulse Coding Controlled
Switching Converter with Notch Frequency Generation
in Noise Spectrum
平成30年度 第9回 電気学会東京支部栃木・群馬支所 合同研究発表会於 小山高専 2019年3月4日(月),5日(火)
2/25
OUTLINE
• Introduction & Objective
• Pulse Coding Method in Switching Converter
• Full Automatic PWC Control Switching Converter
• Implementation of PWC Switching Converter
• Conclusion and Future work
PWC: Pulse Width Coding

3/25
OUTLINE
• Introduction & Objective
• Pulse Coding Method in Switching Converter
• Full Automatic PWC Control Switching Converter
• Implementation of PWC Switching Converter
• Conclusion and Future work
4/25
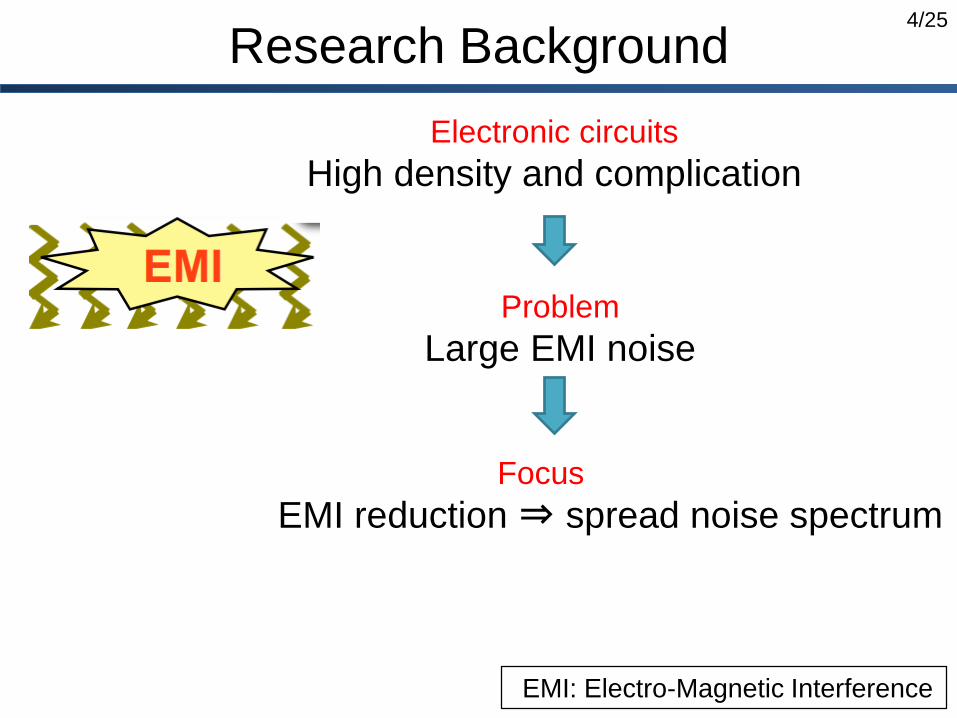
Research Background
Electronic circuits
High density and complication
EMI: Electro-Magnetic Interference
Problem
Large EMI noise
Focus
EMI reduction ⇒ spread noise spectrum
5/25
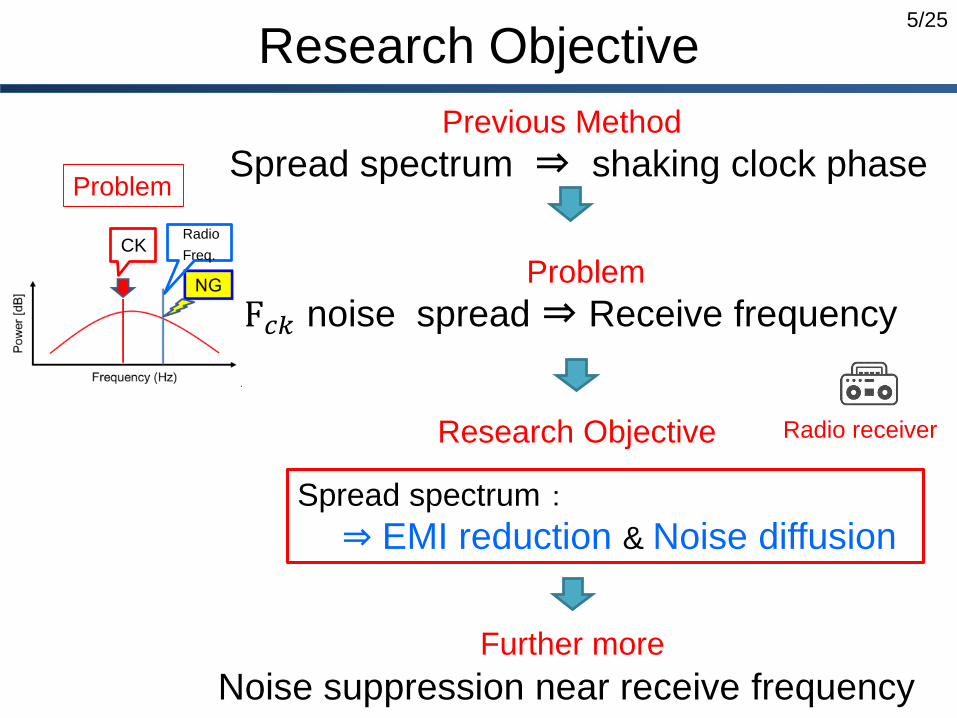
Research Objective
Previous Method
Spread spectrum ⇒ shaking clock phase
Problem
F𝑐𝑘 noise spread ⇒ Receive frequency
Research Objective
Spread spectrum:
⇒ EMI reduction & Noise diffusion
Problem
CKRadio
Freq.
Radio receiver
Further more
Noise suppression near receive frequency
6/25
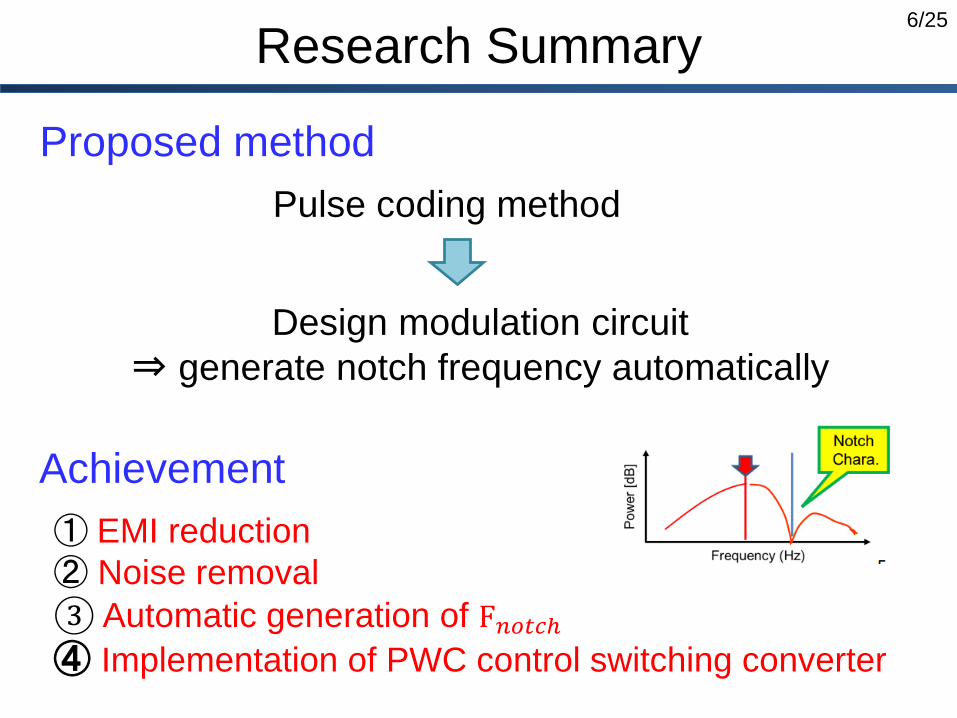
Research Summary
Pulse coding method
Proposed method
Design modulation circuit
⇒ generate notch frequency automatically
Achievement
① EMI reduction
② Noise removal
③ Automatic generation of F𝑛𝑜𝑡𝑐ℎ④ Implementation of PWC control switching converter

7/25
OUTLINE
• Introduction & Objective
• Pulse Coding Method in Switching Converter
• Full Automatic PWC Control Switching Converter
• Implementation of PWC Switching Converter
• Conclusion and Future work
8/25
PWM
Coding
Pulse
Selector
Pulse-H
Pulse-L
Vref
⊿VoSEL
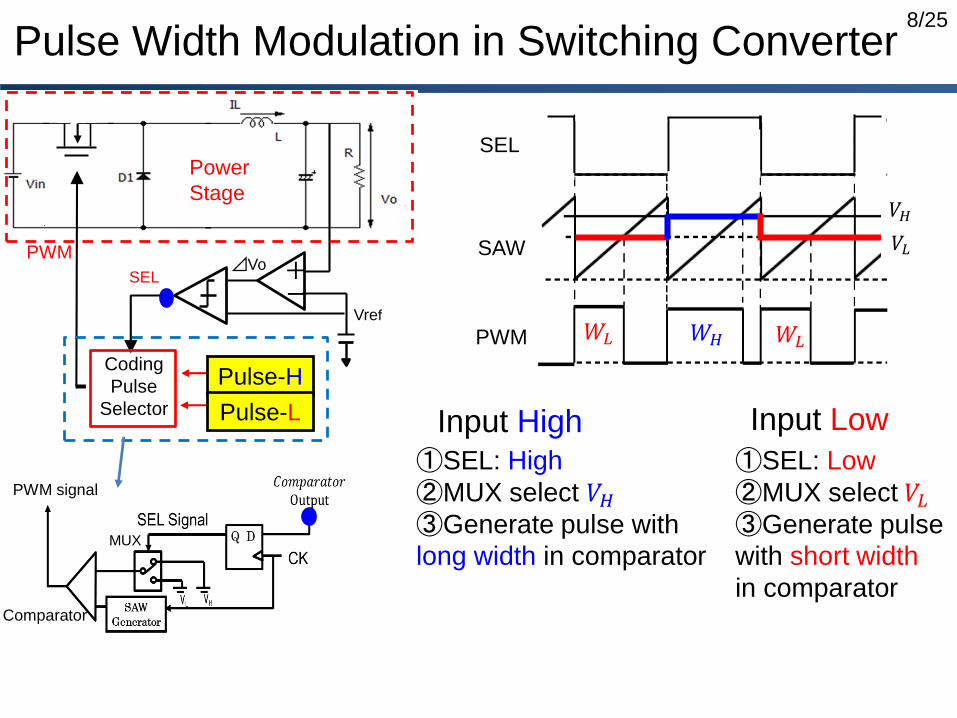
Pulse Width Modulation in Switching Converter
PWM
SAW
SEL
𝑉𝐿
𝑉𝐻
𝑊𝐿 𝑊𝐿𝑊𝐻
Input High①SEL: High
②MUX select 𝑉𝐻③Generate pulse with
long width in comparator
PWM signal
Input Low
①SEL: Low
②MUX select 𝑉𝐿③Generate pulse
with short width
in comparator
MUX
Comparator
+-
Power
Stage
9/25
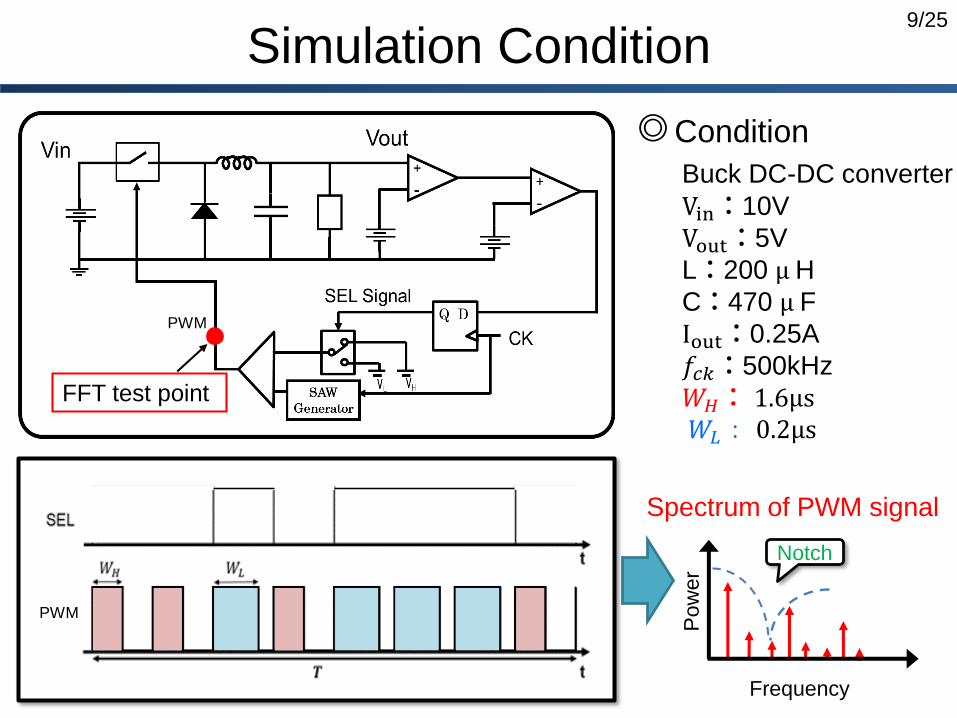
Simulation Condition
FFT test point
◎Condition
Buck DC-DC converter
Vin:10V
Vout:5V
L:200 μH
C:470 μ F
Iout:0.25A
𝑓𝑐𝑘:500kHz
𝑊𝐻: 1.6μs𝑊𝐿: 0.2μs
Spectrum of PWM signal
Pow
er
Frequency
Notch
PWM
PWM
10/25
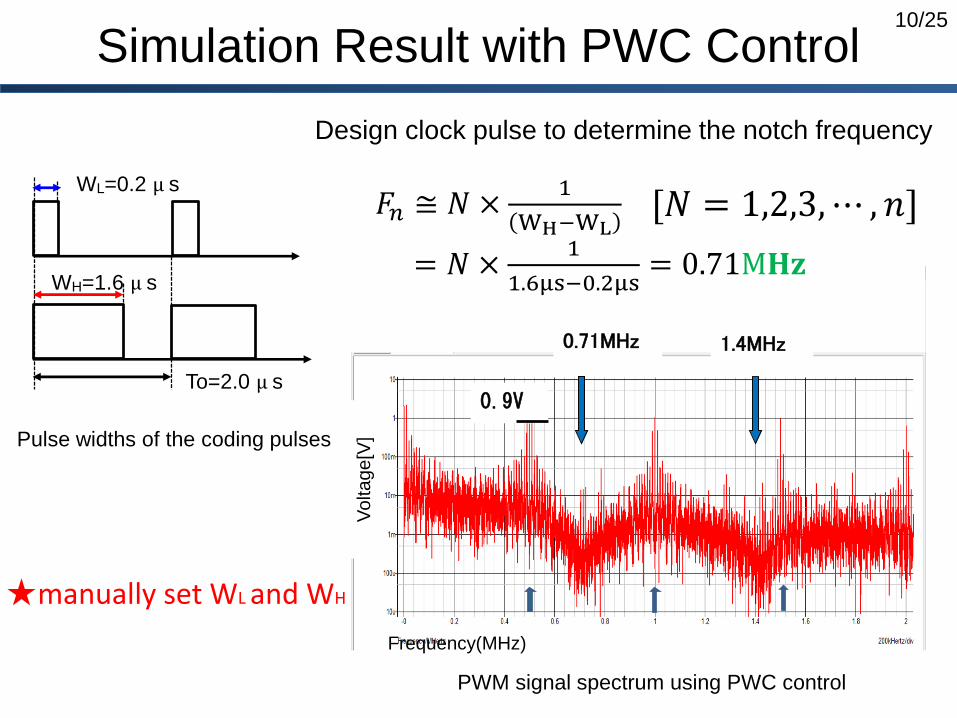
Simulation Result with PWC Control
To=2.0 μ s
WL=0.2 μ s
WH=1.6 μ s
1.4MHz0.71MHz
0.9V
𝐹𝑛 ≅ 𝑁 ×1
WH−WL
= 𝑁 ×1
1.6μs−0.2μs= 0.71M𝐇𝐳
[𝑁 = 1,2,3,⋯ , 𝑛]
Design clock pulse to determine the notch frequency
Frequency(MHz)
Voltage[V
]
PWM signal spectrum using PWC control
Pulse widths of the coding pulses
★manually set WL and WH

11/25
OUTLINE
• Introduction & Objective
• Pulse Coding Method in Switching Converter
• Full Automatic PWC Control Switching Converter
• Implementation of PWC Switching Converter
• Conclusion and Future work

12/25
Automatic PWC Control
SW
Pulse
Selector Pulse-H
Pulse-L
Vref
⊿VoSEL
Automatic generate
Pulse-H and Pulse-L
Fin
Comp
Comp
VH
VL
SAW
Generator
SAW
Generator
Automatic
PWC
Controller
+-
Objective
Reduction generate noise of receive frequency Fin
Method
generate notch at receive frequency Fin
13/25
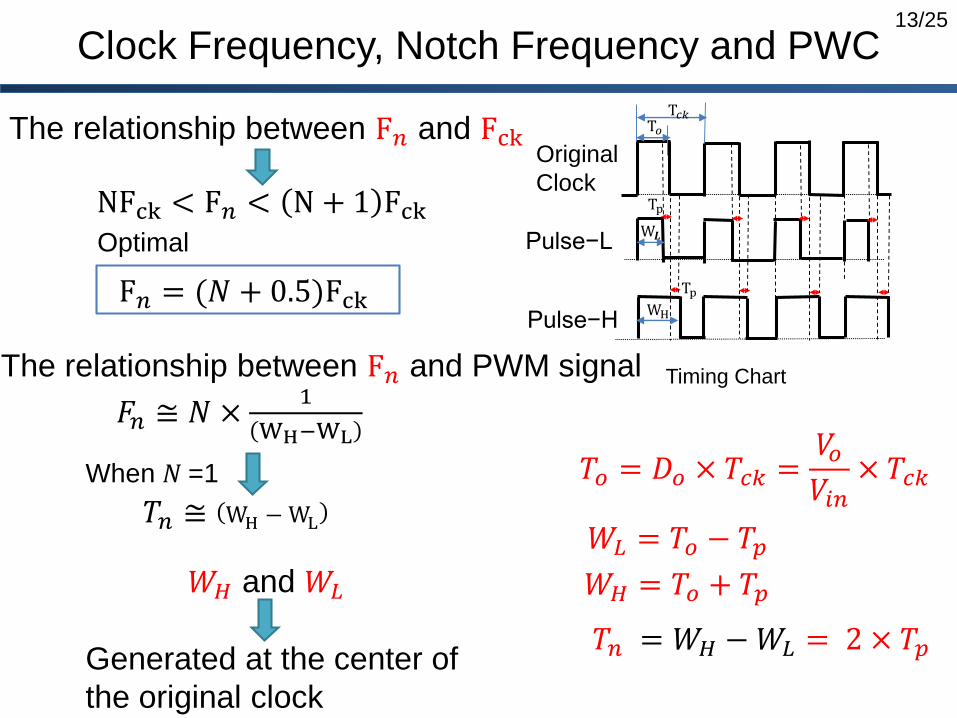
Clock Frequency, Notch Frequency and PWC
𝑇𝑜 = 𝐷𝑜 × 𝑇𝑐𝑘 =𝑉𝑜𝑉𝑖𝑛
× 𝑇𝑐𝑘
Original
Clock
Pulse−L
Pulse−H
Tp
Tp
Timing Chart
𝑊𝐿 = 𝑇𝑜 − 𝑇𝑝𝑊𝐻 = 𝑇𝑜 + 𝑇𝑝
𝑇𝑛 = 𝑊𝐻 −𝑊𝐿 = 2 × 𝑇𝑝
T𝑐𝑘T𝑜
WH
W𝑳
𝐹𝑛 ≅ 𝑁 ×1
WH−WL
𝑊𝐻 and 𝑊𝐿
Generated at the center of
the original clock
𝑇𝑛 ≅ WH −WL
When 𝑁 =1
The relationship between F𝑛 and Fck
NFck < F𝑛 < N + 1 FckOptimal
F𝑛 = (𝑁 + 0.5)Fck
The relationship between F𝑛 and PWM signal
14/25
SW
Pulse
Selector Pulse-H
Pulse-L
Vref
⊿VoSEL
CounterRight shift
1bit
Tin
Fin
ADD
SUB
Tin2
Comp
CompADD Right shift
1bitT𝑐𝑘
Tck2
VH
VL
SAW
Generator
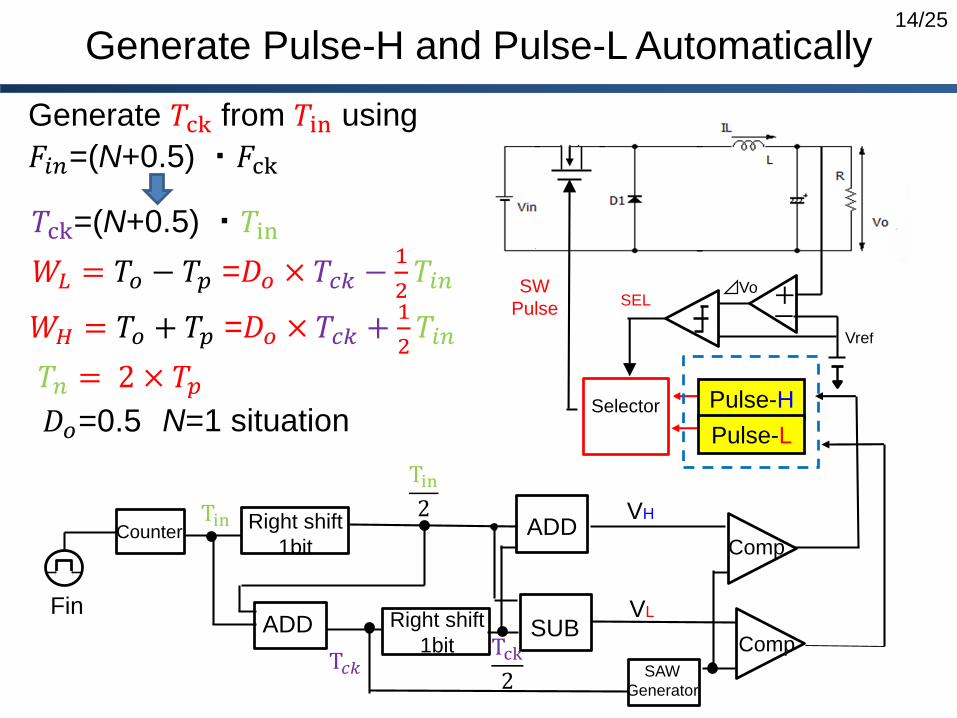
Generate Pulse-H and Pulse-L Automatically
Generate 𝑇ck from 𝑇in using
𝐹𝑖𝑛=(N+0.5) ・𝐹ck
𝑇ck=(N+0.5) ・𝑇in
𝑊𝐿 = 𝑇𝑜 − 𝑇𝑝 =𝐷𝑜 × 𝑇𝑐𝑘 −1
2𝑇𝑖𝑛
𝑊𝐻 = 𝑇𝑜 + 𝑇𝑝 =𝐷𝑜 × 𝑇𝑐𝑘 +1
2𝑇𝑖𝑛
𝑇𝑛 = 2 × 𝑇𝑝N=1 situation𝐷𝑜=0.5
+-

15/25
Simulation Waveforms of W𝐻, W𝐿 Generation
We set 𝐹𝑖𝑛 = 750𝑘𝐻z 𝐹𝑐𝑘 = 500𝑘𝐻z
𝑊𝐻= 1.66𝜇𝑠𝑊𝐿= 0.25𝜇𝑠
Simulation result
𝑊𝐻 = 1.67𝜇𝑠𝑊𝐿 = 0.35𝜇𝑠
Automatic generated
Time/mSecs
1.012
1.016
1.018
1.020
Simulation waveform of 𝑇𝑐𝑘 and 𝑇in
Time/mSecs1.006 1.008 1.01 1.012 1.014 1.016
Simulation waveforms of 𝑊𝐻 and 𝑊𝐿
𝑇𝑐𝑘 compare with VL or VH
Theoretical formula
Tck=1.99𝜇s Tin=1.25𝜇s
1.014
V
wL
wH
0.35𝜇𝑠
1.67𝜇𝑠
Pulse-L
Pulse-HWell
matched
𝑇ck=(N + 0.5)𝑇in = 1.5𝑇in
16/25
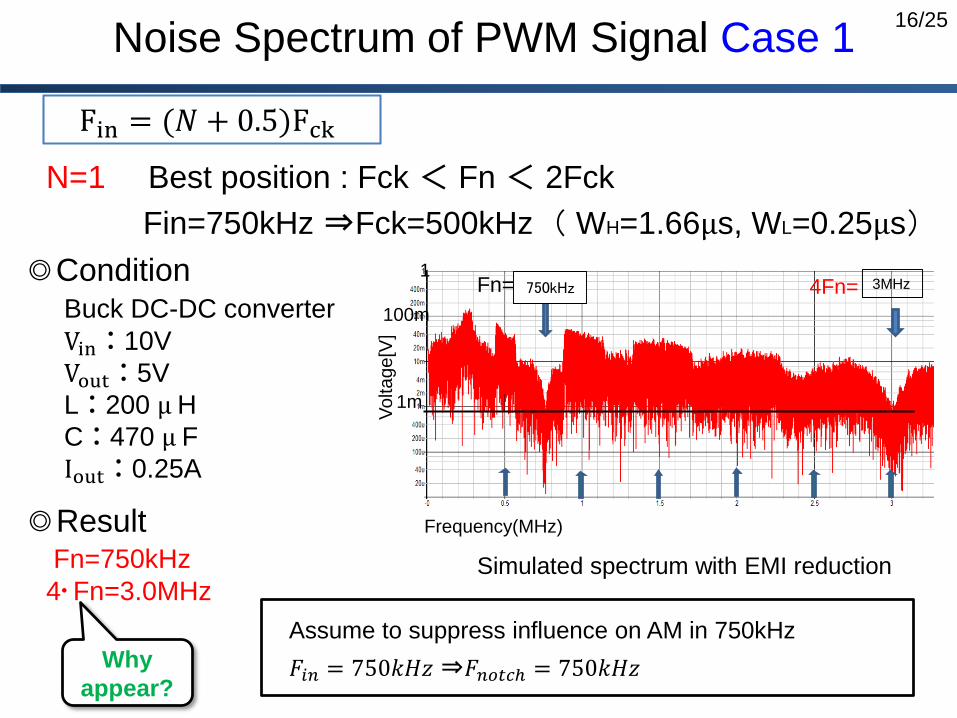
Noise Spectrum of PWM Signal Case 1
N=1 Best position : Fck < Fn < 2Fck
Fin=750kHz ⇒Fck=500kHz ( WH=1.66μs, WL=0.25μs)
Vo
lta
ge
[V]
Frequency(MHz)
◎ConditionBuck DC-DC converter
Vin:10V
Vout:5V
L:200 μH
C:470 μ F
Iout:0.25A
𝐹𝑖𝑛 = 750𝑘𝐻𝑧 ⇒𝐹𝑛𝑜𝑡𝑐ℎ = 750𝑘𝐻𝑧
750kHz
Simulated spectrum with EMI reduction
1m
100m
13MHzFn= 4Fn=
◎ResultFn=750kHz
4・Fn=3.0MHz
Why
appear?
Fin = (𝑁 + 0.5)Fck
Assume to suppress influence on AM in 750kHz
17/25
OUTLINE
• Introduction & Objective
• Pulse Coding Method in Switching Converter
• Full Automatic PWC Control Switching Converter
• Implementation of PWC Switching Converter
• Conclusion and Future work
18/25
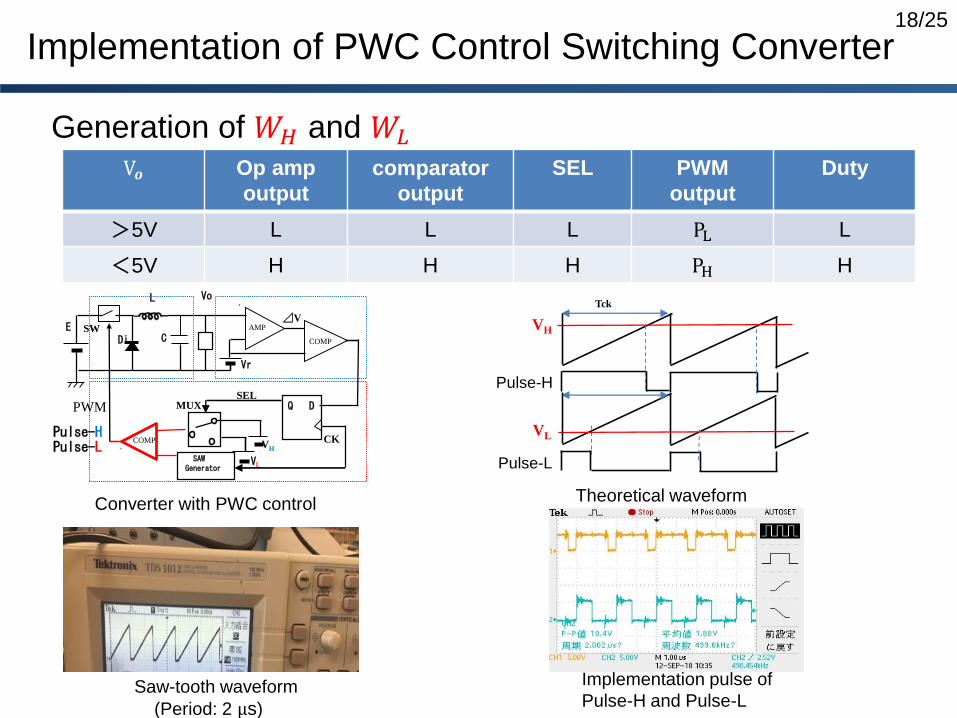
Implementation of PWC Control Switching Converter
Generation of 𝑊𝐻 and 𝑊𝐿
V𝒐 Op amp
output
comparator
output
SEL PWM
output
Duty
>5V L L L PL L
<5V H H H PH H
Pulse-H
⊿VE
VoL
Di CAMPSW
COMP
SEL
COMP CK
MUX
VH
Vr
VLSAW
Generator
PWM Q D
Pulse-HPulse-L
Converter with PWC control
Saw-tooth waveform
(Period: 2 μs)
Tck
Pulse-L
VH
VL
Theoretical waveform
Implementation pulse of
Pulse-H and Pulse-L
19/25
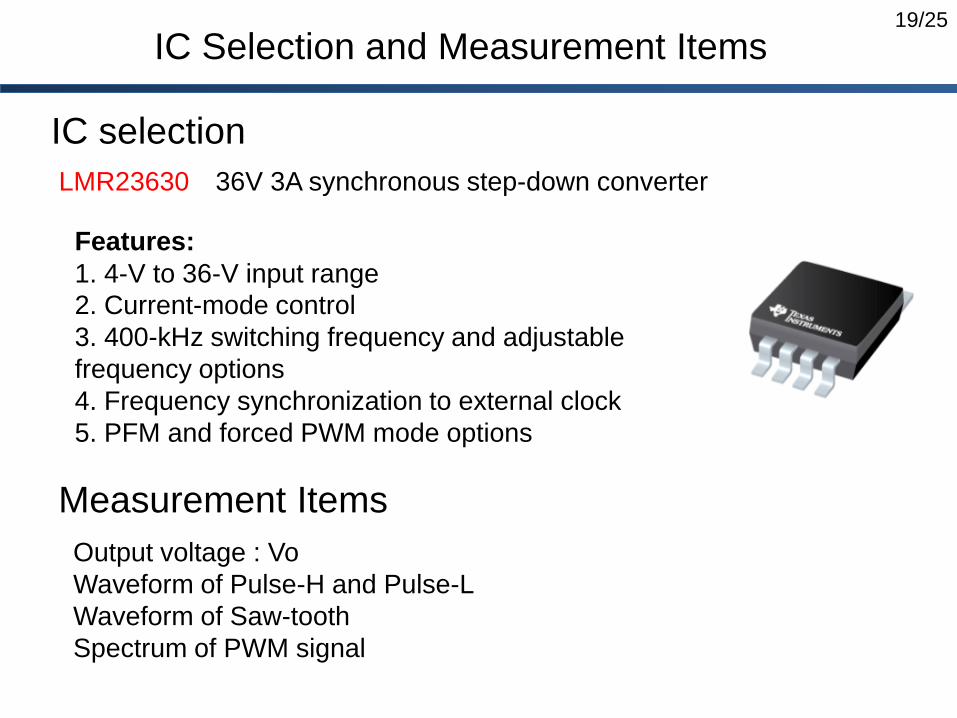
IC Selection and Measurement Items
IC selection
LMR23630 36V 3A synchronous step-down converter
Output voltage : Vo
Waveform of Pulse-H and Pulse-L
Waveform of Saw-tooth
Spectrum of PWM signal
Measurement Items
Features:
1. 4-V to 36-V input range
2. Current-mode control
3. 400-kHz switching frequency and adjustable
frequency options
4. Frequency synchronization to external clock
5. PFM and forced PWM mode options
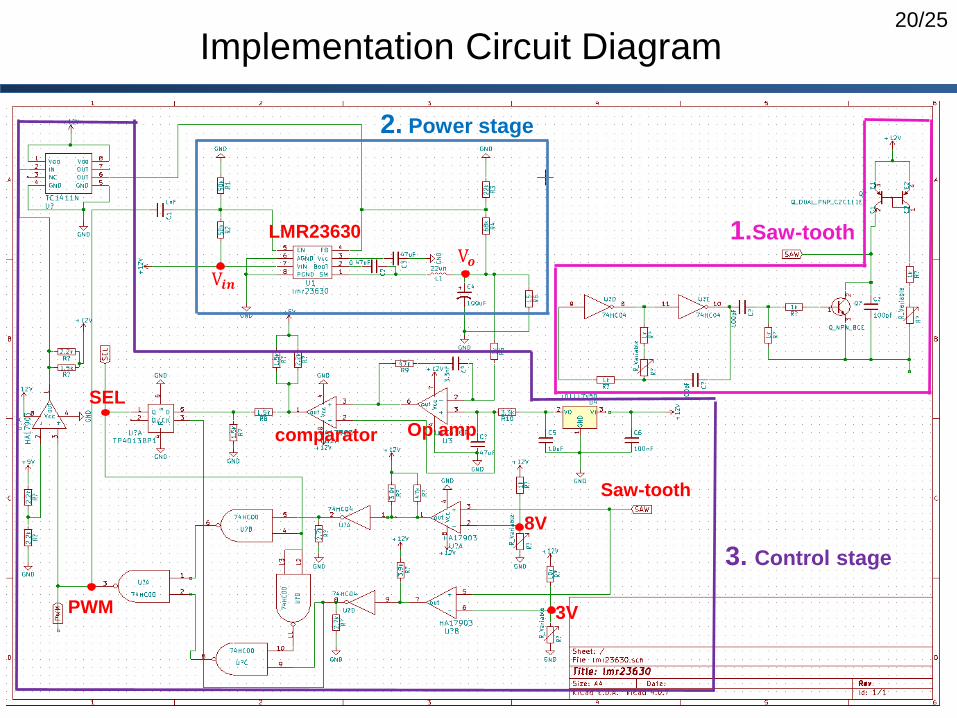
20/25
Implementation Circuit Diagram
SEL
V𝒐
PWM
Op ampcomparator
1.Saw-tooth
2. Power stage
3. Control stage
LMR23630
V𝒊𝒏
8V
Saw-tooth
3V

21/25
Vin 12V
Vo 5V
L 100uH
C 47uF
Vref 5V
fclk 500kHz
Pulse generator can generate clocks
of 250kHz or less
Using pulse generation circuit
Implementation
Parameter Setting
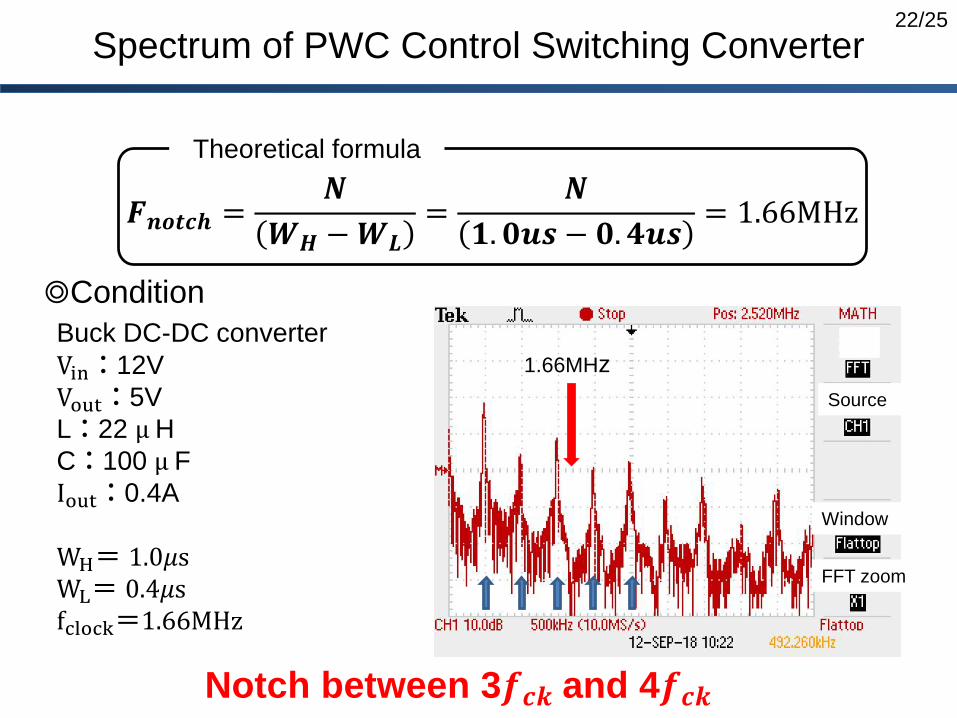
22/25
Spectrum of PWC Control Switching Converter
Theoretical formula
𝑭𝒏𝒐𝒕𝒄𝒉 =𝑵
𝑾𝑯 −𝑾𝑳=
𝑵
𝟏. 𝟎𝒖𝒔 − 𝟎. 𝟒𝒖𝒔= 1.66MHz
◎Condition
Buck DC-DC converter
Vin:12V
Vout:5V
L:22 μH
C:100 μ F
Iout:0.4A
WH= 1.0𝜇sWL= 0.4𝜇sfclock=1.66MHz
Source
Window
FFT zoom
1.66MHz
Notch between 3𝒇𝒄𝒌 and 4𝒇𝒄𝒌

23/25
OUTLINE
• Introduction & Objective
• Pulse Coding Method in Switching Converter
• Full Automatic PWC Control Switching Converter
• Implementation of PWC Switching Converter
• Conclusion and Future work
24/25
Conclusion and Future Work
• Developed pulse coding control in order to generate
notch characteristics at desired frequency
• Automatic generate the 𝐹𝑛𝑜𝑡𝑐ℎ from 𝐹𝑖𝑛• Implementation of PWC control switching converter
Conclusion
Future work
• Implementation of full automatic PWC control
switching converter
For EMI problem handling in switching power converter

25/25
Thank you for Listening
26/25
Q&A
Q1: If using this device, the noise of the spectrum will be decreased?
A: If using the pulse coding method as I mentioned early in switching
converter, the noise of the spectrum will be decreased. In implementation,
the IC which I choose can create the step-down conversion function from
12V to 5V. And the pulse coding function is realized in the control part of
the circuit.
Q2: The frequency of PWM was a fixed frequency?
A: Yes, the frequency of PWM was set by ourselves and it is always
500kHz.